
Abstract
While a large literature indicates that using a mixed-mode approach to notify or contact potential respondents can be effective in increasing response rates, surprisingly little research examines the impact the mode of invitation has on participation in a web survey. To assess the effects of invitation mode on response rates, costs, and demographic representativeness, university faculty members (N = 280) were randomly assigned to experimental groups and sent a mailed invitation letter and a $2 cash incentive; a mailed invitation letter only; or an e-mailed invitation. Nonresponding faculty received up to two reminders to participate, by e-mail. Results indicated that the response rates were higher for the groups invited using a postal letter, but the inclusion of $2 did not significantly increase the response rates. Consistent with expectations, while costs were higher for the mailed invitation groups, the mailed invitations improved the demographic representativeness of the respondents, especially for the $2 incentive group. This study builds on a small body of literature that explicitly examines the mode of invitation on survey participation in web surveys and adds to previous findings by examining costs and effects on the demographic representativeness of the respondents.
Introduction
E-mailed and mailed invitations are the two dominant methods for inviting sample members to participate in a web survey. E-mailed invitations, in which a hot-linked URL is embedded in an e-mail's text, are most commonly used due to their ease of sending, ease of responding, and low costs. Mailed invitations, in which a URL is included on a postcard or in a letter that respondents must manually type into a browser, are less common because they require a mailing address, require more effort by sample members in order to respond, and are potentially more costly. While a large literature indicates that using a mixed-mode approach to notify or contact potential respondents can be effective in increasing response rates, surprisingly little research examines the impact of the mode of invitation on participation in a web survey. The purpose of the current study was to examine the impact of an e-mailed versus mailed invitation on response rates, costs, and sample representativeness in a web survey of university faculty. This study builds on a small body of literature that explicitly examines the mode of invitation on survey participation in web surveys and adds to previous findings by examining costs and effects on the demographic representativeness of the respondents.
Dillman (2007) uses social exchange theory to help explain why people participate or fail to participate in surveys. Social exchange theory posits that individuals are more likely to respond positively to a request when they trust the originator of the request and perceive the ratio of rewards to costs to be personally acceptable. While an e-mailed invitation appears to lower the costs of responding by decreasing respondent burden (e.g., all that is required of respondents to access the survey is to point and click), there are several reasons why a paper or postal contact might be more effective than an e-mailed contact in increasing participation in a web survey (Couper, 2008; Porter & Whitcomb, 2007). Paper contacts may provide a better medium than e-mail contacts for establishing trust and maximizing rewards (Dillman, Smyth, & Christian, 2009). Because paper contacts are more expensive to produce and administer, potential respondents may have more trust that the research being conducted is serious and important. Given the positive relationship between sponsorship and participation (Edwards et al., 2002), paper contacts may provide a better visual canvas for establishing trust by conveying graphics and logos related to the type and nature of the sponsoring organization (e.g., whether the research is academically or commercially based).
While a substantial literature, primarily involving surveys administered via postal mailings demonstrates the effectiveness of prepaid, monetary incentives in increasing response rates (Church, 1993; Edwards et al., 2002; Singer, 2002), the effectiveness of incentives in web surveys has been less pronounced (Singer & Ye, 2013, forthcoming). In part this is because the most common way incentives are administered in web surveys is through lotteries which, because they are offered contingent on participating and not guaranteed a have been shown not to be as effective as prepaid incentives (see Göritz, 2006). On the other hand, inviting sample members using a mailed invitation allows the researcher to include small, cash incentives that have been so effective in postal surveys. In their study using the Internet to survey a general population sample, Messer and Dillman (2011) reported that including a $5 incentive in a mailed invitation to complete a web survey significantly increased the rate of participation by 18 percentage points over not including an incentive (see also Millar & Dillman, 2011).
Researchers also refer to norms among both Internet users and researchers against sending unsolicited e-mails to request survey participation (Council of American Survey Research Organizations [CASRO], 2011; Porter & Whitcomb, 2007); a violation of this standard may increase the likelihood that the recipient of an e-mailed request will ignore it. No such standards exist for materials that are mailed. Further, if contact is initially made by mail, subsequent reminders that are sent by e-mail may not seem unsolicited and may be less likely to be ignored. Tentative support for this conclusion is found in results reported by Kaplowitz, Hadlock, and Levine (2004). They examined the effect of a prenotification postcard for respondents who went on to receive an e-mailed invitation and postcard reminder and found sending the prenotification postcard ultimately increased the response rate by 4 percentage points.
A final set of factors that advocate for the use of mailed invitations involves practical issues in administering web surveys, particularly with regard to the quality of the sample of e-mail addresses and reducing that component of nonresponse that is due to noncontact. Depending on the population being studied, the quality of e-mail addresses may be highly variable. When e-mail contact information is missing or is inaccurate, the addition of a mailed invitation could increase response rates by increasing the likelihood that the selected sample members receive an invitation. Similarly, mailed invitations could also increase response rates by offsetting e-mail notifications that are lost to spam filters.
Previous Research and Current Hypotheses
As reviewed by Kaplowitz and colleagues a substantial body of research indicates that notifying or contacting potential respondents using a mailed letter or postcard can increase response rates when the survey is ultimately administered in a mode other than mail (Kaplowitz, Lupi, Couper, & Thorp, 2011). For example, a recent meta-analysis demonstrated that advance letters improved response rates by 8% in telephone surveys (De Leeuw, Callegaro, Hox, Korendijk, & Lensvelt-Mulders, 2007). Sending potential respondents a postal letter or postcard notifying them that they would receive an e-mail invitation to participate in a web survey has also been shown to increase response rates in surveys of students and alumni (Crawford et al., 2004; Kaplowitz, Hadlock, & Levine, 2004; Porter & Whitcomb, 2007), grant applicants (Harmon, Westin, & Levin, 2005), and physicians (Dykema, Stevenson, Day, Sellers, & Bonham, 2011).
We were, however, only able to identify four studies that directly examined the effect of invitation mode on web survey participation. Birnholtz, Horn, Finholt, and Bae (2004) varied invitation modes and incentives in a sample of research engineers. Treatment groups received a mailed letter invitation with a $5 cash incentive, a mailed letter invitation containing code to redeem $5 at Amazon.com, or an e-mailed invitation with code to redeem $5 at Amazon.com. The cash incentive led to a significantly higher response rate than the combined rate for groups receiving $5 at Amazon.com (57% vs. 36%). While the response rate for the group receiving the mailed invitation with incentive was 8 percentage points higher than the group receiving the invitation and incentive by e-mail, the difference between the two groups was not significantly different, though this may simply have been due to the small sample sizes employed in the study. Kaplowitz, Lupi, Couper, and Thorp (2011) compared the effectiveness of a mailed postcard invitation to an e-mailed invitation in a sample of university faculty, students, and staff and found that the results varied across the sampled groups. Consistent with expectations, the response rate for students was significantly higher for the postcard versus e-mailed invitation groups (22% vs. 19%). For staff, however, there were no differences for the postcard versus e-mail groups (43% vs. 43%), and rates for faculty were significantly higher for the e-mailed invitation group (40% vs. 33%). Millar and Dillman (2011) varied whether a sample of students was invited to participate in a web survey using an e-mailed invitation, a postal letter, or a postal letter that included a $2 incentive. When they compared the response rate for the group that received the letter without an incentive (21.2%) to the group that was contacted by e-mail (20.5%), they found that the postal letter alone had no appreciable effect on response rates. Including the $2 incentive, however, led to a significant increase in the response rate (38.2%). Bandilla, Couper, and Kaczmirek (2012) crossed invitation mode with the use or non-use of a mailed prenotification letter in a follow-up web survey of respondents who had indicated prior willingness to participate and had provided e-mail addresses. Results indicated that the effect of each mode of invitation varied with the use of a mailed prenotification letter. Among those not receiving a prenotification letter, a mailed invitation was associated with an increase in response of 11 points over an e-mailed invitation (51% versus 40%). In contrast, among those receiving the prenotification letter, the e-mailed invitation was associated with an increase in response of 6 points over a mailed invitation (57% versus 51%).
Although the literature reviewed on the effects of invitations on response rates provides contradictory results, we hypothesized that response rates would be higher for mailed versus e-mailed invitations and highest for a group sent a prepaid $2 incentive along with a mailed invitation.
Response rates, however, are just one indicator of overall data quality and a “low” response rate does not necessarily indicate inferior data. Even with a high response rate, nonresponse bias may be large if those surveyed differ substantially from those who are not. Conversely, nonresponse bias may be small, even with a low response rate, if respondents are similar to nonparticipants on the characteristics of interest (Biemer & Lyberg, 2003). Because the profile of those who fail to respond to a request for participation may be associated with nonresponse bias, especially when survey responses are associated with demographic characteristics (see, for example, Messer & Dillman, 2011), we also sought to determine whether the distribution of characteristics of respondents in the experimental groups would be more representative of the population when mailed invitations were used. We hypothesized that because postal contacts lend legitimacy to a study, particularly when the contact is accompanied by a small, cash incentive, the distribution of characteristics in the samples mailed invitations would be more representative of the population than a group e-mailed the invitation. The characteristics we examined were gender and faculty rank.
Finally, one of the primary reasons researchers collect data via web surveys is because they tend to be cheaper to administer than other forms of data collection (Couper, 2008). Although the inclusion of an incentive in the first point of contact of a survey conducted exclusively by mail increases the initial costs of the survey, the incentive may ultimately reduce costs by decreasing the number of nonrespondents that require subsequent contacts, such as additional mailings and telephone follow-ups (Beebe, Davern, McAlpine, Call, & Rockwood, 2005; Dykema et al., 2012). For web surveys, however, the costs associated with sending follow-up e-mail reminders to nonresponders are usually quite small. Thus, we predicted that cost per complete would be higher for groups receiving a mailed invitation and highest for group receiving a mailed invitation and incentive because the costs associated with e-mail reminders are negligible.
Method
Sample, Procedures, and Experiment
This research note is from an experiment embedded in a pilot study designed to measure college-level instructors’ attitudes and beliefs about the challenges and constraints they face teaching in Science, Technology, Engineering and Mathematics (STEM) fields. A sample of 280 faculty instructors was drawn at random from departments in biology, chemistry, mathematics, physics, and physiology at the University of Wisconsin–Madison. All sample members had campus postal and e-mail addresses on file. The questionnaire could only be completed over the Internet. The questionnaire contained a total of 151 questions although the number of questions answered by any one respondent varied considerably due to skip patterns. The survey was administered by the University of Wisconsin Survey Center from December 2009 to January 2010 on behalf of the University of Wisconsin–Madison’s Center for Education Research. The pilot study, as well as a subsequent larger scale survey on the same topic, was funded by the National Science Foundation. The study was approved by the institutional review board at the University of Wisconsin–Madison.
Sample members were randomly assigned to three experimental groups and sent a mailed invitation letter and a prepaid $2 cash incentive affixed to the letter (n = 94); a mailed invitation letter only (n = 93); or an e-mailed invitation (n = 93). The mailed invitation was sent first class via the U.S. Postal Service to sample members’ postal addresses on campus. The letter was printed on study-specific stationery, described the study’s purpose and funder, and included a URL and authentication credentials, which the sample member could manually type into a browser in order to access the survey instrument. The mailed invitation letters in the incentive and no incentive groups were identical except that the former made reference to the incentive using the text, “Please accept the enclosed $2.00 as our way of thanking you in advance for your participation” (see Figure 1). E-mail invitations were sent 5 days after the mailed invitations. They contained a clickable URL with embedded authentication credentials as well as a description of the study and funder (see Figure 2). The e-mail’s subject line referenced the content of the survey (e.g., “Culture, Cognition and Evaluation of STEM Higher Education Reform Survey”).
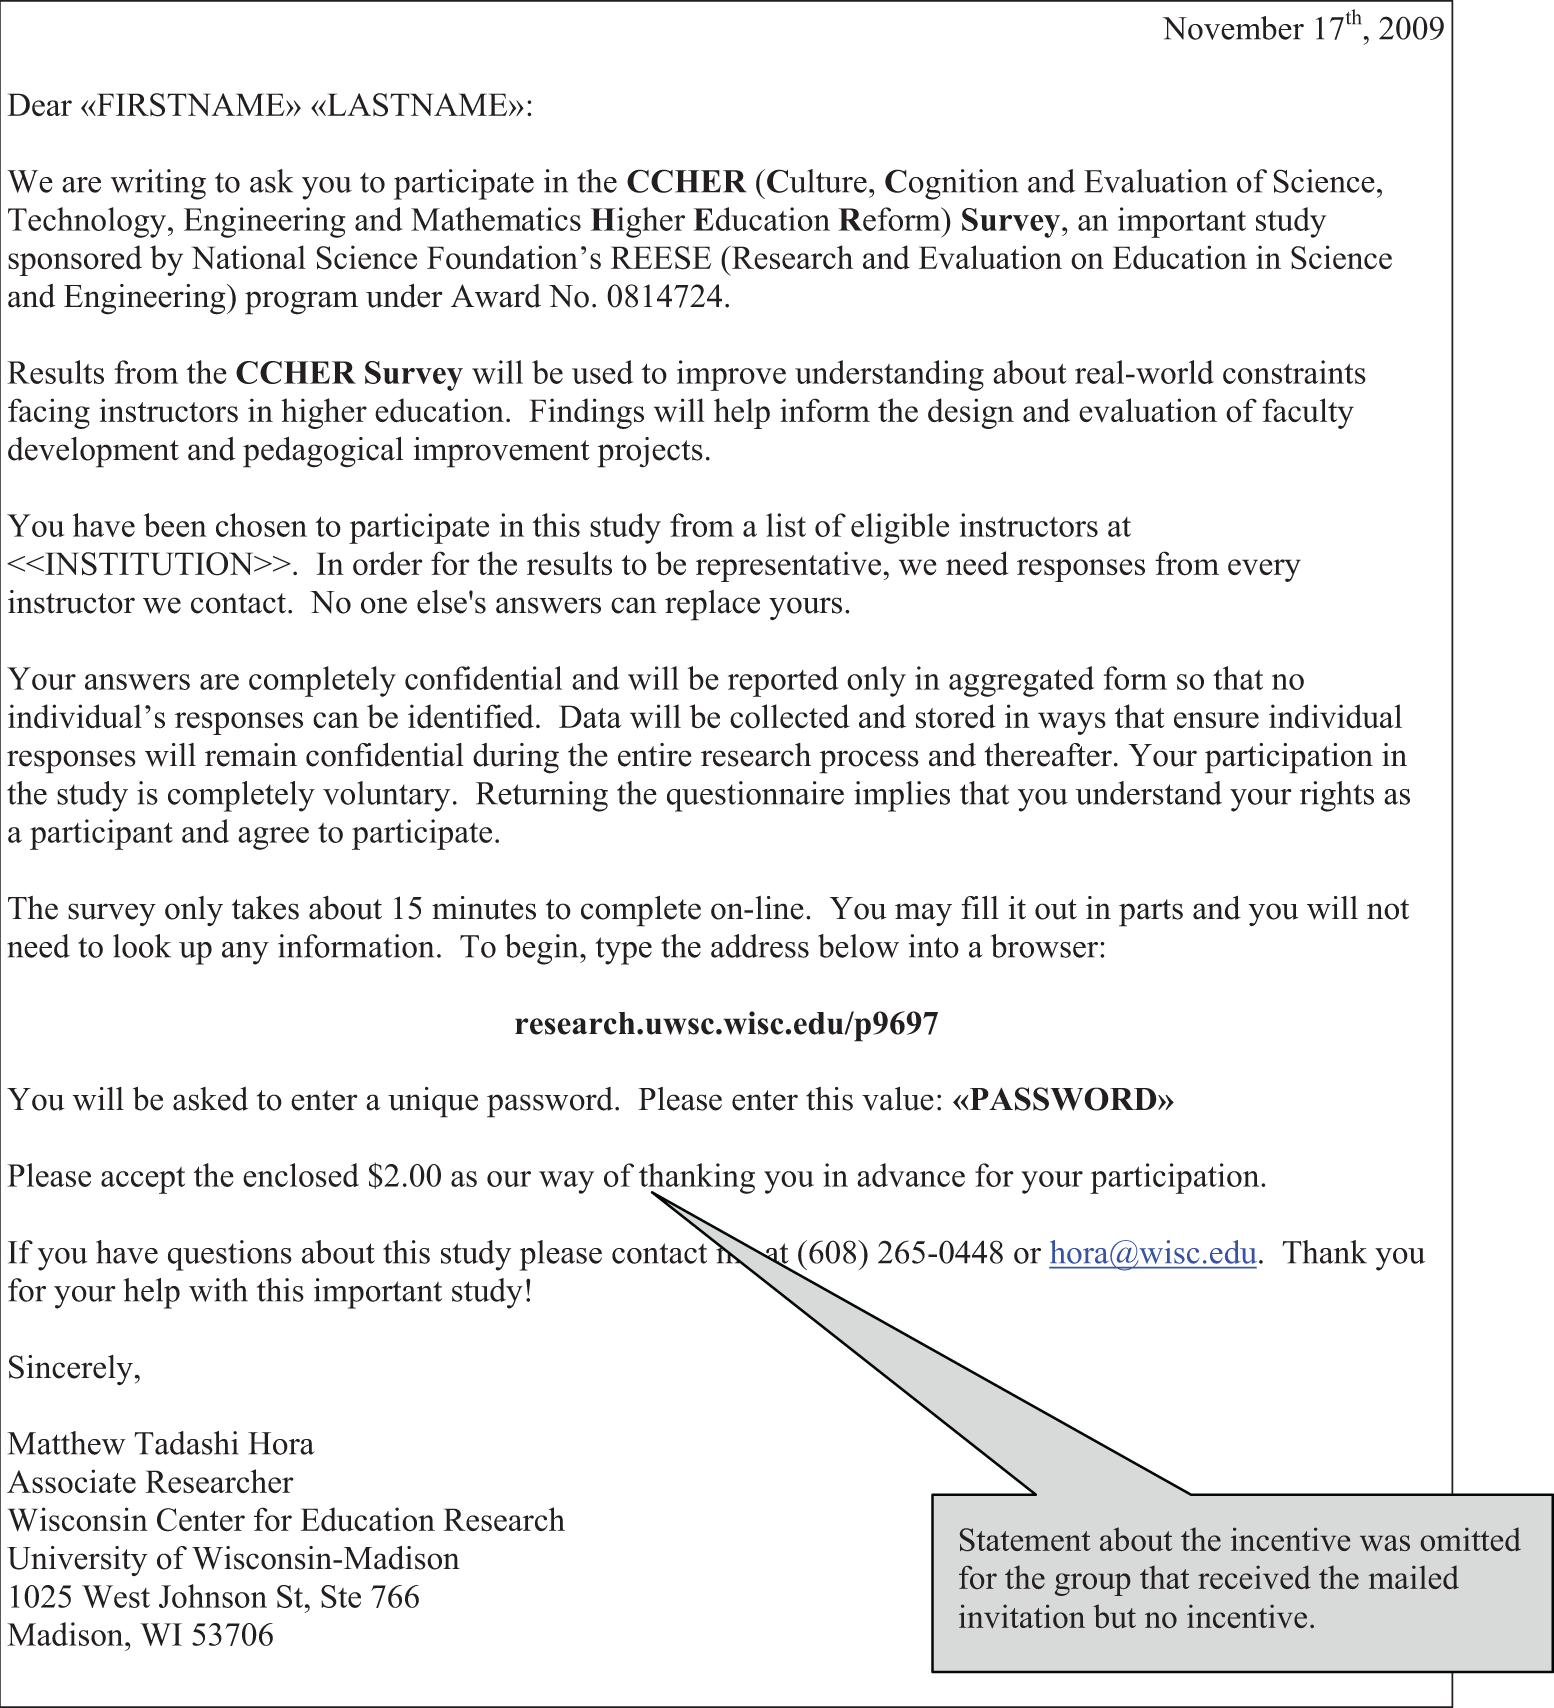
Mailed invitation.
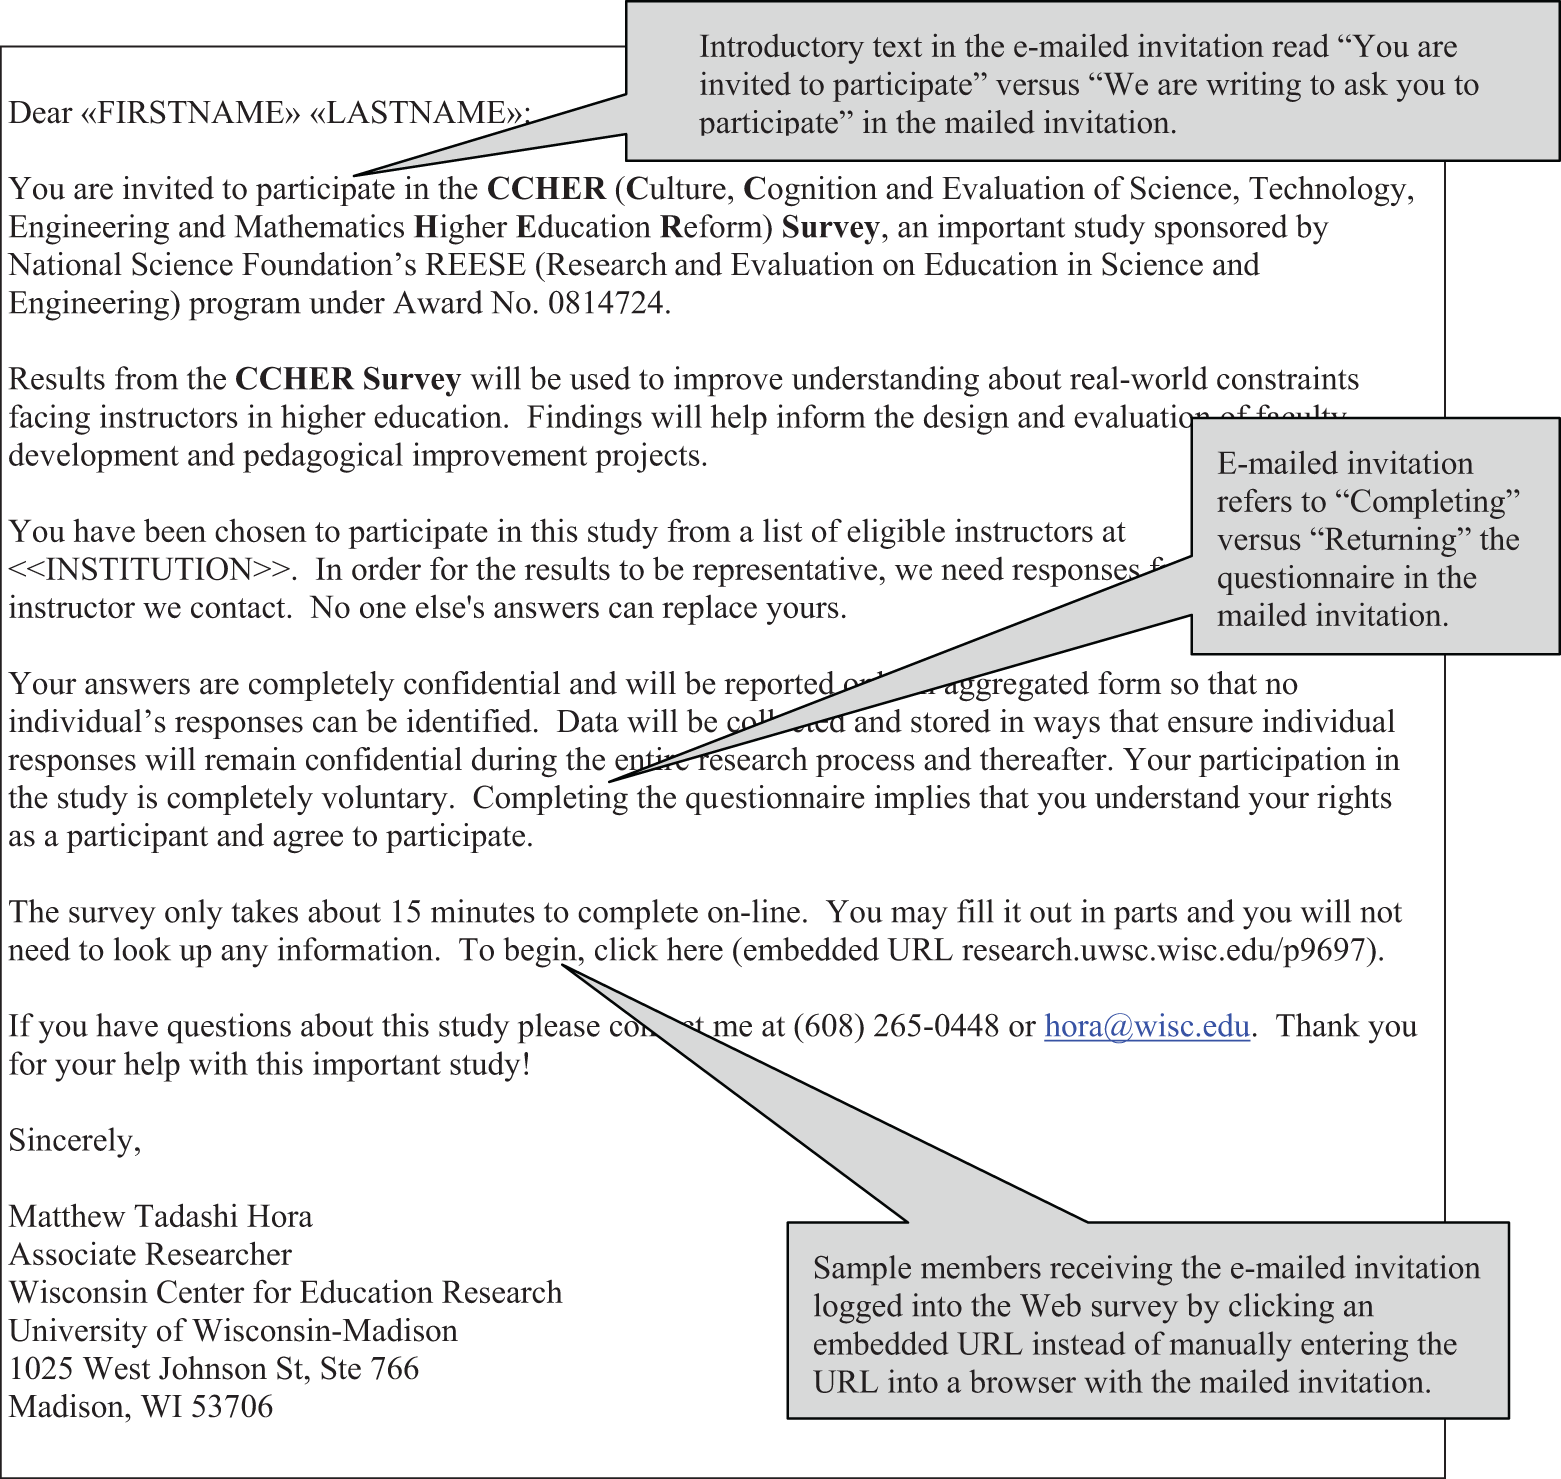
E-mailed invitation.
The invitations were followed by e-mail reminders to nonresponders. The e-mail reminders did not refer to initial mode of invitation or incentive, regardless of the experimental condition. Nonresponders in the mailed invitation groups received the letter plus three e-mail reminders; nonresponders in the e-mailed invitation group received only the initial e-mail and two e-mail reminders. In order to make comparisons across the three groups, this analysis focuses on the results of the initial invitation followed by the first two e-mail reminders so that only the first three contacts are considered across groups.
Statistical Analysis
Response rates, calculated after each contact attempt, were computed as the number of completed surveys divided by the total number of sample members contacted (RR1; American Association for Public Opinion Research (AAPOR), 2011). Because this was a pilot study, sample sizes were small, and we assessed only the significance of response rates after three contact attempts (Peduzzi, Concato, Kemper, Holford, & Feinstein, 1996). Comparisons between experimental groups were analyzed using logistic regression. To test for significant differences between groups, we fitted a baseline model in which we regressed an indicator for whether the respondent completed the survey or not on indicators for the experimental groups, omitting the mailed invitation plus incentive group, which served as the reference group. The remaining pairwise contrast (i.e., the mailed invitation group without the incentive versus the e-mailed invitation group) was evaluated using the postestimation command lincom (Stata, Version 11; Long & Freese, 2006).
We examined demographic representativeness by comparing the distribution of respondents’ gender and faculty ranking from the survey data to the distribution of these two characteristics in the administrative data, comparing across each of the experimental groups. Differences were tested using one sample z tests for proportions.
We examined total costs and the difference in cost per completed survey across experimental groups. Our analysis included only variable costs that differed across the groups in order to focus on the direct effects of mailed invitation letters and incentives on administration costs. For the mailing of the postal invitation, costs included the mailing (e.g., printing, assembly, supplies, and postage) and the incentives (e.g., their monetary value and administration). For the e-mail invitations and reminder e-mails, we included only the costs for the prorated programmer’s time (i.e., the costs associated with sending the e-mails). Because the overall sample size for the pilot study was relatively small, we also modeled how the costs would likely change for a sample size 10 times larger than the sample sizes for our experimental groups. This modeling was performed to demonstrate what the relative costs and benefits of our design would be with a larger sample and to show how the differences in cost across our experimental groups change with sample size. We omitted all other fixed costs that were consistent across the experimental groups, such as costs associated with instrument development, programming the web survey, and data delivery.
Results
A total of 82 surveys were completed for an overall response rate of 29.3% (Table 1).1 Compared to the e-mailed invitation group, the response rate was significantly higher in the mailed invitation group that received the $2 incentive (38.3% vs. 19.4%, p < .01) and marginally significantly higher in the mailed invitation group that did not received the incentive (30.1% vs. 19.4%, p < .10). Even though there was a difference of 8 percentage points between the mailed invitation groups receiving versus not receiving an incentive (38.3% vs. 30.1%), the difference was not large enough to reach statistical significance, given the small sample sizes in the groups (p > .10)
Cumulative response rates by experimental group.
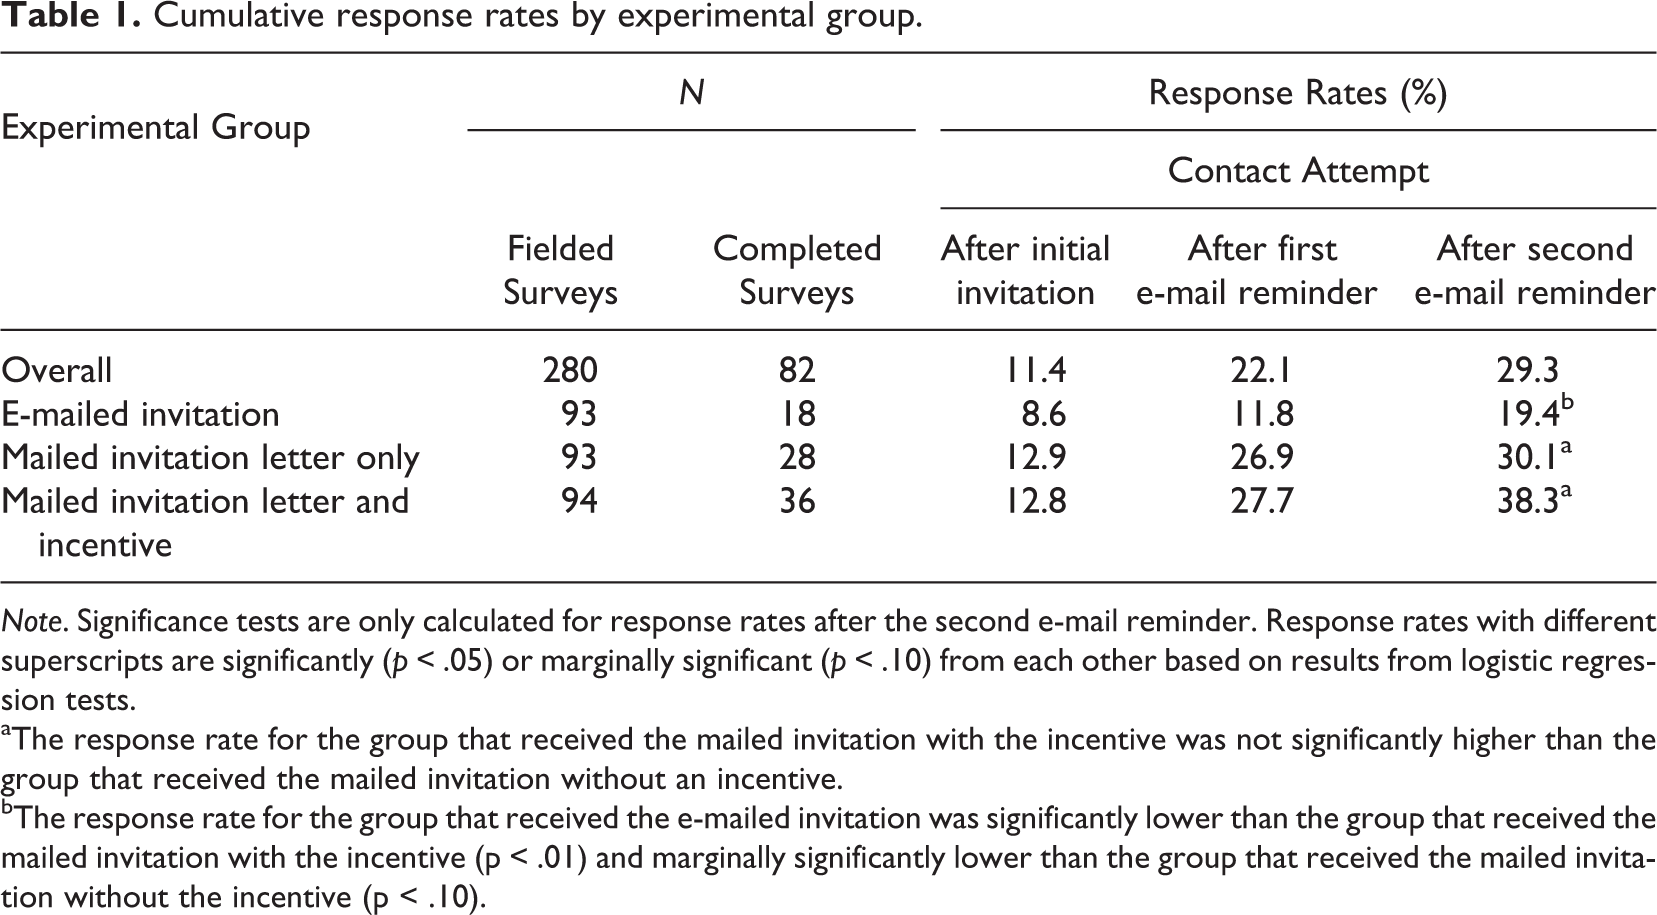
Note. Significance tests are only calculated for response rates after the second e-mail reminder. Response rates with different superscripts are significantly (p < .05) or marginally significant (p < .10) from each other based on results from logistic regression tests.
aThe response rate for the group that received the mailed invitation with the incentive was not significantly higher than the group that received the mailed invitation without an incentive.
bThe response rate for the group that received the e-mailed invitation was significantly lower than the group that received the mailed invitation with the incentive (p < .01) and marginally significantly lower than the group that received the mailed invitation without the incentive (p < .10).
Table 2 presents results for tests examining the demographic representativeness of the respondents. Male faculty members in both the e-mailed invitation group and mailed invitation group without the incentive were less likely to respond. This difference was significant for the e-mailed invitation group (50% vs. 78.9%, p < .01) and marginally significant for the mailed incentive group (64.3% vs. 78.9%, p < .10). For faculty rank, both of the mailed invitation groups obtained distributions that mirrored the administrative data. Associate and full professors in the e-mailed invitation group, however, were marginally significantly less likely to respond to the invitation (61.1% vs. 78.6%, p < .10).
Analysis of Demographic Representativeness: Distributions of Key Variables From the Administrative Data by Experimental Group.
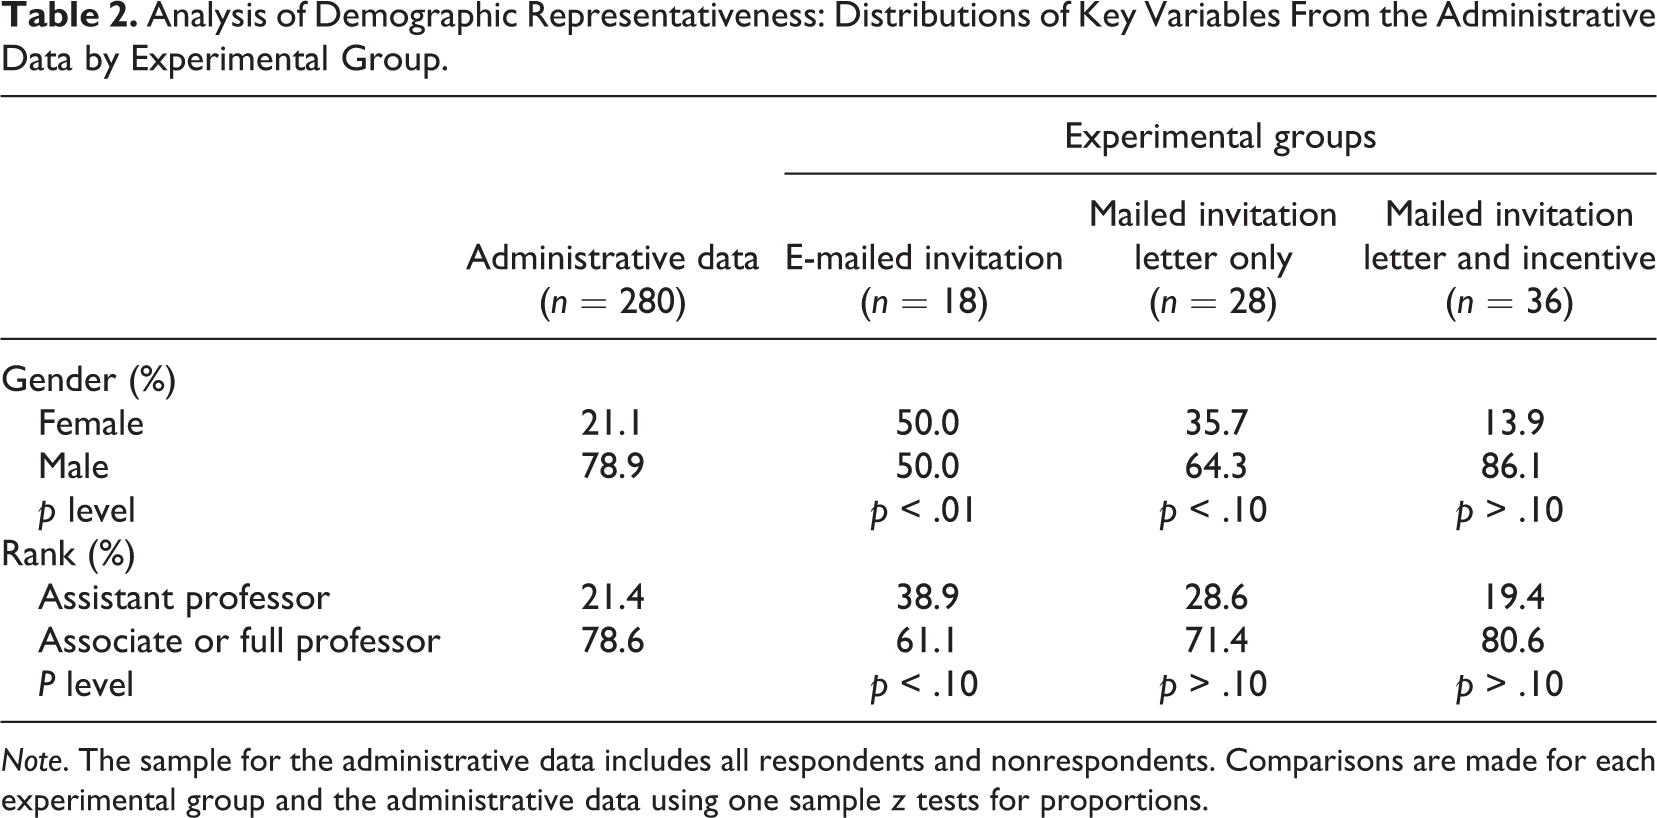
Note. The sample for the administrative data includes all respondents and nonrespondents. Comparisons are made for each experimental group and the administrative data using one sample z tests for proportions.
Table 3 presents the results of our cost analysis. As expected, variable costs were lowest for the e-mail invitation group and highest for the group that received the mailed letter invitation with the incentive. The $354 spent overall on variable costs for the mailed letter with the incentive was substantially higher than the $151 spent on variable costs for the letter-only group and the $67 spent on variable costs for the e-mailed invitation group. The costs per complete for the group receiving the mailed letter and incentive was $4.47 more than the letter-only groups ($9.85 vs. $5.38). The e-mailed invitation yielded the lowest cost per completed survey ($3.73). In all comparisons, the increase in response rates required an increase in overall cost and an increase in per complete costs that exceeded the value of the prepaid $2 incentive.
Variable Costs and Costs per Completed Surveys Based on the Actual Number of Cases Fielded and Modeled for a Larger Sample Size.
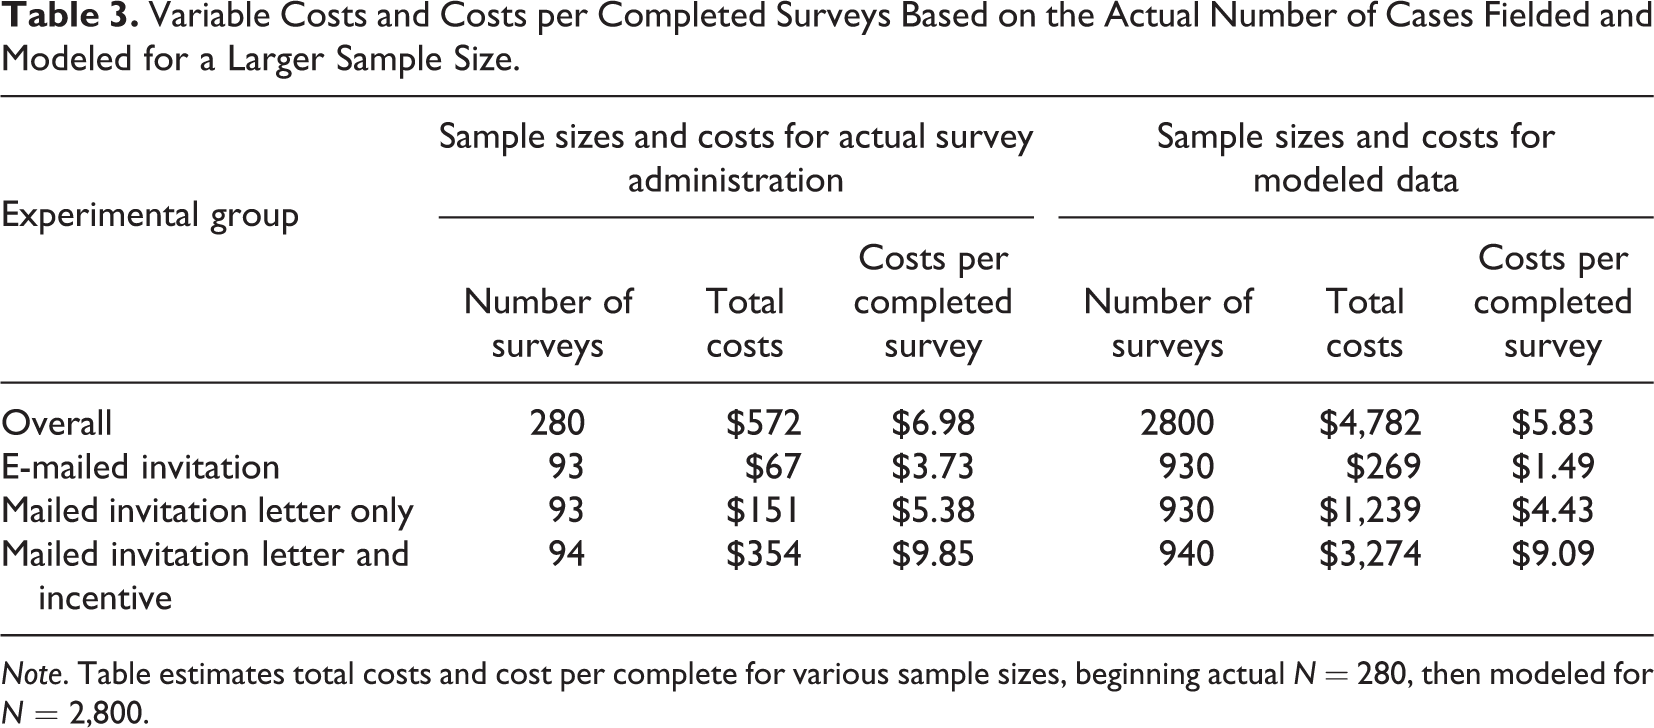
Note. Table estimates total costs and cost per complete for various sample sizes, beginning actual N = 280, then modeled for N = 2,800.
The costs for the e-mailed invitation group may be higher than a reader would anticipate. This is a consequence of the relatively small sample size over which the e-mailing costs were distributed. Table 3 also presents a comparison of how cost per complete would vary for a larger sample size by modeling how the costs in the experimental groups would change with a 10-fold increase in our original sample size from 280 to 2,800 cases. Without the expense of mailed letters and incentives, the cost per complete for cases in the e-mailed invitation group would decline 60%, from $3.73 per complete to $1.49 per complete. The reduced marginal cost per complete in the groups receiving the letter invitation and the letter with the incentive would be less dramatic. Increasing the sample size by 10 times would only reduce the cost per complete in the mailed invitation group by 18% (from $5.38 to $4.43). Similarly, with a 10-fold increase in sample size, the mailed invitation group that received the incentive would only experience a reduction in cost per complete of a little under 8% (from $9.85 to $9.09). These estimates assume that the response rate would remain unchanged.
Discussion
The purpose of this study was to assess the effects of an e-mailed versus mailed invitation on response rates, sample representativeness, and survey costs in a web survey of university faculty members working in science-related fields. While the initial response to both of the mailed invitation groups was somewhat muted, as more contact attempts were made, impact increased, ultimately resulting in higher rates of participation.
We interpret this as a consequence of several factors (see also Dykema et al., 2011; Millar & Dillman, 2011). During its initial distribution, the mailed invitation provided an opportunity for respondents who received it to participate by turning to their computers and manually entering the URL. In contrast to the e-mailed invitation, the mailed invitation was likely more successful at underscoring the legitimacy and importance of the study. During subsequent e-mail reminders, the mailed invitation likely served as a sort of advance letter that increased the likelihood sample members would notice and respond to the subsequent e-mailed requests to participate (see also Kaplowitz et al., 2004). This would explain the disproportionate increase in response rates evidenced in the mailed invitation groups relative to the e-mailed invitation group following the e-mail reminders. Following the mailed invitations, the e-mail reminders, which were sent to all nonresponders, provided a less laborious way of accessing the web survey. Lastly, by mixing contact modes over time, we were probably more likely to succeed at making contact with respondents. Sample members with inaccurate mailing or e-mailing addresses had two modes by which they could be reached. The addition of mailed invitations lowered the risks of the losing sample members when initial e-mailed invitations may have ended up in spam folders. We believe that each of these pieces contributed to increasing the response rate.
Additionally we wanted to know what effects the inclusion of a small token cash incentive would have when coupled with the mailed invitation. Our findings on the positive effect of including an incentive in the mailed invitation mirror the experiences of other researchers (Birnholtz, Horn, Finholt, & Bae, 2004; Messer & Dillman, 2011; Millar & Dillman, 2011). While not significant, the effect of the incentive was in the predicted direction. The response rate was 8 percentage points higher than the group that received the mailed invitation without an incentive. The pattern of response was consistent with the group that received mailed invitations without the incentive; fairly modest after the initial contact but with a steeper increase in participation with subsequent e-mailed contact attempts.
The ease of conducting web surveys combined with their low cost has led to large numbers of web surveys being conducted. Even more important than the effect of the mailed invitation and incentive on response rates was the impact of these factors on the distribution of characteristics of respondents who chose to participate. Previous research in which survey results were compared to population characteristics has found that men participate at a lower rate than women in web surveys (McCabe, Boyd, Couper, Crawford, & D’Arcy, 2002). For our topic, a recruiting strategy that relied only on e-mailed invitations was not sufficient in underscoring the importance of the study and was associated with an underrepresentation of male and tenured faculty. The group responding to the mailed invitation and the incentive best matched the distribution in the population in terms of gender and faculty rank.
When sample sizes are small, the use of letters and incentives (even very small incentives) could have a positive impact on response rates and representativeness at relatively little cost. Our cost analysis underscores that conducting a cost analysis on the use of incentives in web surveys is fundamentally different from that of basic mail or web/mail mixed-mode surveys. This is because the cost structure of web surveys differs. The inclusion of an incentive in the first wave of a mailed survey increases the initial costs of the survey, but the incentive may ultimately reduce costs by decreasing the number of nonrespondents that require subsequent contacts, such as additional mailings and telephone follow-ups (Beebe et al., 2005; Dykema et al, 2012). Thus in mail (or even web/mail) surveys, the use of prepaid incentives could be cost effective, neutral, or more expensive. With web surveys, we are unlikely to ever recoup costs on subsequent contacts because follow-up e-mails are administered in batches and extremely inexpensive. Hence incentives in web surveys should probably be viewed more as an investment toward an increased response rate and data quality. In our study, the investment paid off, attracting men and tenured faculty to participate at more representative rates.
With regard to costs, we offer a few words of caution. The savings that web administration offers may be reduced if a study requires some postal mailings and incentives in order to ensure a satisfactory response rate and representative data. If the administration of a survey needs to be augmented with mixed-mode contacts, then this cost-effective benefit decreases. If substantial incentives are needed to ensure participation, it may be more cost effective to conduct the survey using a different mode or mixed-mode design.
Finally, we note several limitations with our design and methods. First, because it was a pilot study, sample sizes were small, limiting our ability to detect statistically significant differences. This was most frustrating for the comparison between the mailed invitation groups with and without the incentive. Second, our respondents included faculty members working in science- and technology-related fields. Our results with this highly educated sample may not be generalizable to other populations. Third, while we increased the representativeness of our data with regard to the demographic characteristics of gender and faculty rank, we cannot conclude with certainty that doing so reduced nonresponse bias for other measures in the survey. Fourth, while our results signal a positive effect on response rates and data quality for the use of a mailed invitation and incentive, these methodologies can only be considered when researchers have access to mailing addresses.
Footnotes
Acknowledgments
The authors thank Nora Cate Schaeffer and Steven Blixt for providing comments on earlier drafts. Opinions expressed here are those of the authors and do not necessarily reflect those of the sponsors or related organizations.
Declaration of Conflicting Interests
The authors declared no potential conflicts of interest with respect to the research, authorship, and/or publication of this article.
Funding
The authors disclosed receipt of the following financial support for the research, authorship, and/or publication of this article: The research reported here was supported in part by the University of Wisconsin Survey Center (UWSC), which receives support from the College of Letters and Science, by the Wisconsin Center for Demography and Ecology, National Institute of Child Health and Human Development Center Grant (R24 HD047873 to James R. Walker), and by the National Science Foundation (DRL-0814724).