
Abstract
The past decade has seen a rise in the use of online panels for conducting survey research. However, the popularity of online panels, largely driven by relatively low implementation costs and high rates of Internet penetration, has been met with criticisms regarding their ability to accurately represent their intended target populations. This criticism largely stems from the fact that (1) non-Internet (or offline) households, despite their relatively small size, constitute a highly selective group unaccounted for in Internet panels, and (2) the preeminent use of nonprobability-based recruitment methods likely contributes a self-selection bias that further compromises the representativeness of online panels. In response to these criticisms, some online panel studies have taken steps to recruit probability-based samples of individuals and providing them with the means to participate online. Using data from one such study, the German Internet Panel, this article investigates the impact of including offline households in the sample on the representativeness of the panel. Consistent with studies in other countries, we find that the exclusion of offline households produces significant coverage biases in online panel surveys, and the inclusion of these households in the sample improves the representativeness of the survey despite their lower propensity to respond.
Internet surveys have become a popular tool for conducting research across multiple discipline areas, including public opinion research, market research, and the social, health, and behavioral sciences. The ability to interview a large number of respondents cost-effectively and to embed a rich selection of audio and visual content makes Internet surveys a particularly attractive tool for conducting research. Furthermore, through self-administration, Internet surveys possess many desirable measurement properties compared to their interviewer-administered counterparts, including less risk of social desirability bias (Kreuter, Presser, & Tourangeau, 2008). The popularity of Internet surveys has also coincided with increasing rates of Internet penetration and decreasing rates of landline telephone coverage in many countries, prompting further interest in using the web for survey research in lieu of the telephone (Mohorko, de Leeuw, & Hox, 2013a, 2013b).
However, despite their cost and measurement advantages, a major criticism of Internet surveys is that they do not produce results that are representative of the desired target population (Bethlehem & Stoop, 2007; Couper, 2000). Part of this criticism stems from the fact that the majority of Internet surveys recruit respondents using quota sampling or other nonprobability methods. Most commercial Internet surveys are conducted through online access panels, which rely on the self-selection of respondents into these panels. What is of concern here is that respondents who self-select themselves into the panel may be very different from people who do not in terms of the collected study variables. Indeed, studies have identified discrepancies when comparing results produced from online access panels to census-based benchmarks and probability sample surveys that are assumed to be more representative of the target population (Erens et al., 2014; Loosveldt & Sonck, 2008; Yeager et al., 2011).
Another point of criticism is that most Internet surveys do not include households without Internet access, which may result in coverage errors, if Internet households are systematically different from non-Internet households. Despite relatively high rates of Internet penetration in countries such as Germany (88.6%), the United States (86.9%), the Netherlands (95.7%), Sweden (94.8%), France (83.3%), Norway (95.1%), and the United Kingdom (89.8%; Internet World Stats, 2014), 1 non-Internet households remain an increasingly selective subgroup of the population (Couper, 2000). To reduce biases attributable to both self-selection and noncoverage, Internet surveys typically apply adjustment procedures (e.g., weighting) that utilize information that is assumed to be known for the entire population (Bethlehem & Stoop, 2007). But even these procedures have had limited success in reducing discrepancies with population benchmarks derived from probability sample surveys and census information (Loosveldt & Sonck, 2008; Yeager et al., 2011).
In response to these criticisms, some Internet surveys and, in particular, some Internet panel surveys have made a deliberate attempt to recruit respondents using probability-based sampling methods and provide Internet access to households that do not possess it. This is typically done by drawing a sample of addresses (or telephone numbers) and making contact with the household via personal visit (or by telephone). During an initial face-to-face (or telephone) interview, the household’s Internet capabilities are assessed. If the household does not possess Internet access but does possess an Internet-capable device suitable for administering online questionnaires (e.g., personal computer [PC], laptop, tablet), then an Internet subscription is provided free of charge to sample units committing to join the online panel. If none of these items (Internet subscription or Internet-capable device) are present, then both are provided by the survey organization.
This strategy is implemented in the German Internet Panel (GIP), a large, national probability-based online panel survey of individuals living in Internet and non-Internet households in Germany. Although the GIP and other surveys alike take additional steps to make themselves nationally representative, there are still questions regarding whether providing offline households with Internet access increases the representativeness of panel surveys. Couper, Kapteyn, Scholau, and Winter (2007) identified three stages of the survey recruitment process that can affect the representativeness of online panel surveys: (1) whether sample members have access to or use the Internet, (2) their willingness to participate in the panel, and (3) whether they actually register and take part in the online interviews. The first stage is relevant for coverage error, whereas the second and third correspond to nonresponse error. Providing Internet access to offline household members (hereafter referred to as “offliners”) reduces coverage error but has the potential to increase nonresponse error, if the offliners are less likely to register and participate in the online surveys. That is, the significant costs and resources invested into recruiting and providing Internet access to offliners could be negated from a survey representativeness perspective if the previously offline households fail to follow through with their commitment to the panel.
In this context, we sought to examine each of the three stages of the recruitment process to determine whether recruiting offliners (i.e., individuals who reside in a non-Internet household) in the GIP ultimately increases the representativeness of the surveyed sample. Specifically, this article is organized around the following three research questions:
Results From Other Studies
Web surveys that do not account for the non-Internet population are susceptible to coverage bias if this population differs from the Internet population on characteristics that are related to key survey topics. Indeed, studies conducted in different countries have shown that individuals with and without Internet access differ systematically on many survey variables. In the United States, older and more recent evidence shows that individuals with Internet access are more likely to be younger, White, and college educated; have higher income; and live in urban areas compared to individuals without Internet access (Couper, 2000; DiSogra, Callegaro, & Hendarwan, 2009; Zickuhr & Smith, 2012). However, despite these persistent access gaps, many of the disparities have narrowed over the last 15 years (Perrin & Duggan, 2015). Dever, Rafferty, and Valliant (2008) found that Internet users have more favorable health outcomes and are more likely to have health insurance than non-Internet users. Schonlau, van Soest, Kapteyn, and Couper (2009) and Couper et al. (2007) also found significant differences in health-related variables between those who had Internet access and those who did not. Internet users also tend to be more politically engaged and have more tolerant attitudes compared to non-Internet users (Zhang, Callegaro, Thomas, & DiSogra, 2009).
In the Netherlands, studies have shown that individuals without Internet are more likely to be older, live alone, and have a migration background compared to those who do have Internet (Leenheer & Scherpenzeel, 2013; van der Laan, 2009). In a reanalysis of published studies using data from the Longitudinal Internet Studies for the Social Sciences (LISS), Eckman (2015) found significant demographic differences between Internet and non-Internet households, although the omission of non-Internet households did not strongly affect the substantive conclusions drawn from the studies. In Germany, people without Internet access tend to be less educated and older compared to those with access (Bosnjak et al., 2013). In France, Revilla, Cornilleau, Cousteaux, Legleye, and de Pedraza (2015) found that Internet and non-Internet users tend to differ on age, sex, marital status, and education, among others.
The apparent differences between persons with and without Internet access have prompted efforts to mitigate the impact of coverage bias in web surveys. One approach is to control for sociodemographic differences in multivariate models or through the use of statistical weighting adjustments (e.g., poststratification), which can adjust for coverage bias as well as nonresponse bias. However, studies have shown that coverage bias persists even after statistically adjusting for such differences (Couper et al., 2007; Loosveldt & Sonck, 2008; Rookey, Hanway, & Dillman, 2008; Schonlau, van Soest, & Kapteyn, 2007; Schonlau, van Soest, Kapteyn, & Couper, 2009; Zhang et al., 2009). A second approach for mitigating the effects of coverage bias in web surveys is to recruit units residing in non-Internet households and providing them with Internet access and the necessary equipment to take part in the survey. This approach has been adopted by a very limited number of probability-based Internet panel studies. The first adopters included the Knowledge Networks panel in the United States and the LISS panel in the Netherlands. Subsequent studies in other countries have followed this approach, including the Etude Longitudinale par Internet Pour les Sciences Sociales (ELIPSS) panel in France and the GIP in Germany. A detailed overview of the LISS, GIP, and ELIPSS panel studies can be found in Blom et al. (2016). All of these panels equip panel members living in non-Internet households to participate in the survey by providing, at minimum, an Internet connection and Internet-capable device (e.g., laptop, tablet), if one or the other does not already exist in the household. The ELIPSS panel is an exception, as it provides all panel members with a tablet computer and mobile Internet connection, including those who already have an Internet connection and Internet-capable device.
Providing households with the necessary means to participate in online panel surveys, while costly, is advantageous from a coverage bias perspective, because it directly compensates for known differences between Internet and non-Internet households. However, despite these additional efforts, there is no guarantee that non-Internet household members will participate in the survey or participate at the same rate as Internet households. In fact, several studies have shown that persons living in non-Internet households participate in surveys at a lower rate than persons living in Internet households. For the LISS panel, which recruits all household members aged 16 or older into the panel, Leenheer and Scherpenzeel (2013) reported that only 35% of non-Internet households agreed to participate in the LISS panel compared to 84% of Internet households. In the ELIPSS panel, Revilla et al. (2015) observed that persons living in non-Internet households who were randomly selected into the panel revoked their participation at a higher rate (19%) than sampled persons living in Internet households (9%), and only 12.5% of non-Internet persons participated in half of the survey requests compared to 27.5% of Internet persons. A similar pattern has been observed in the GESIS Panel, a mixed-mode (web and mail) probability-based panel study of the general population (aged 18–70) in Germany, where attrition rates for respondents who participate offline are about twice as high as for online respondents (Struminskaya & Bosnjak, 2015).
The low rate of recruitment (and retention) among persons without Internet access is a significant concern in probability-based Internet panels due to the increased risk of nonresponse bias among this group. A key question is whether such nonresponse bias offsets the reduction in coverage bias and effectively negates the costly design of recruiting offliners into the panel. If the answer is affirmative, then recruiting offliners is unlikely to improve the representativeness of the panel and the accuracy of the resulting survey estimates. Only few studies have evaluated whether adding persons without Internet access to probability-based Internet panels improves the representativeness of the panel. For example, an evaluation of the LISS panel revealed that adding non-Internet household members to the panel improves representativeness for several household-level variables (e.g., composition, tenure, presence of children and persons aged 65 and older) collected from the primary household respondent by shifting the estimates closer to the Dutch population figures (Leenheer & Scherpenzeel, 2013). However, this was not the case for some substantive measures (e.g., voting behavior) that did not approach the population benchmarks after including panel members from non-Internet households. An evaluation of the ELIPSS panel suggested that combining sampled panel members from non-Internet and Internet households improves survey representativeness on a few characteristics, including couple status, education, and nationality (Revilla et al., 2015). However, the analysis of change in the estimates was limited by a small sample of panel members residing in non-Internet households.
In this article, we add to the sparse literature by evaluating the representativeness of a probability-based Internet panel from a different country: Germany. While the GIP shares some similarities with other probability-based Internet panels (in particular with the LISS panel), it has some distinguishing features that will be highlighted in the following analyses. First, the GIP has conducted two rounds of panel recruitment, one in 2012 and the other in 2014, both using the same recruitment protocol. This design permits the analysis of representativeness over time, which is particularly relevant at a time when the non-Internet population is ever changing and the prevalence of Internet-capable devices is rapidly increasing (see Initiative D21, 2015; Mohorko et al., 2013b). A second distinguishing feature of the GIP is its data structure, which includes multiple recruitment steps at the household and individual level and the recruitment of all age-eligible members within the sampled household. All of these steps contribute to the overall representativeness of the GIP and are analyzed separately within this article.
Facing Potential Coverage and Nonresponse Biases: GIP Survey Design
The GIP aims to limit selectivities stemming from the online mode of data collection, in particular biases due to nonresponse and noncoverage. For this purpose, the following features were built into its survey design (see Blom, Gathmann, & Krieger, 2015 for details).
First, the sample of the GIP is based on a strict random probability sample of the general population, to rule out any self-selection into the panel. The sample was drawn as a three-stage area probability sample with listing of households and random sampling among listed households in a sampled area. Both when sampling areas and when sampling households, the units were drawn with equal probabilities (see also “Data and Method” section).
Second, the sample units were first approached with a 15-min face-to-face survey in each private household. The invitation letter to this face-to-face survey, which was mailed to sampled households in advance of the visit of the interviewer, did not mention the future online mode, in order to prevent any biases at this stage that may result from respondents’ skepticism toward computers and the Internet. To minimize the burden on the household at this stage, the interview took place with one available household member aged 16 or older, that is, no random selection took place for the face-to-face interview. Because the online panel, however, invited all age-eligible household members (between the ages of 16 and 75), whether interviewed face-to-face or not, all individuals had equal probabilities of being selected into the online panel. Households, where none of the household members were age-eligible, that is, all were aged 76 or older, were interviewed face-to-face but not followed up afterward for the online panel. These households are not included in our analyses in this article. The face-to-face interviews covered questions on the composition of the household, key sociodemographic characteristics, attitudes, and behavior of the respondent and identified whether household members had access to a computer and broadband Internet at home.
Third, at the end of the face-to-face interview, persons living in households without a broadband Internet connection and/or computer were informed that they were nonetheless invited to participate in the online study and that for this purpose they would receive Internet and, if no suitable computer was available, equipment that was specifically developed for persons without prior computer experience: a touch screen PC (a so-called BenPC) in 2012 or tablet with keyboard (a so-called GiWi) in 2014 (see Figure 1). The computer engineers who installed the equipment in households across Germany were trained via video and written materials pointing out the specific challenges of communicating technical aspects to clients with little or no prior experience with computers.
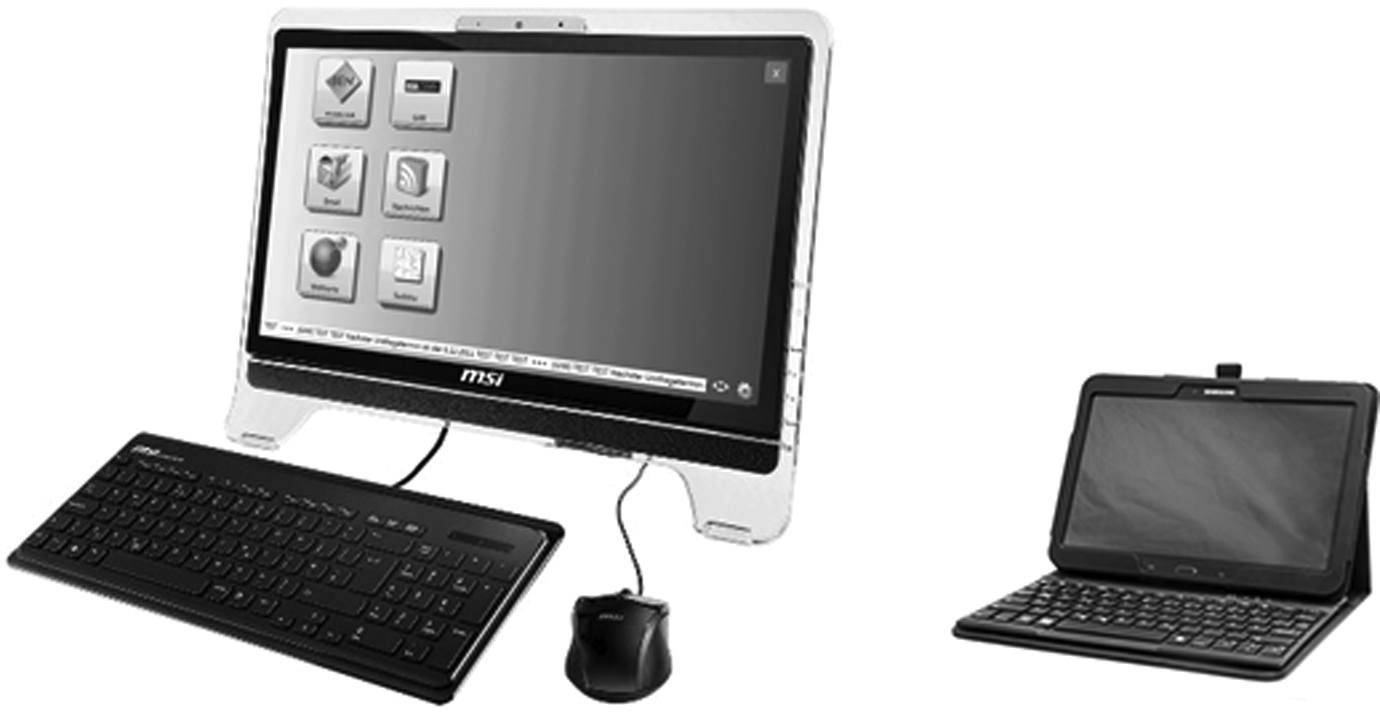
Offliner equipment: the BenPC (left) and the GiWi (right).
In 2012, the face-to-face interviews found that 79.1% of age-eligible sample members were onliners, that is, had access to a computer and broadband Internet. In 2014, this proportion was 80.8%. 2 This slight decrease in offliners between 2012 and 2014 is likely due to the rise of tablet computers offering an accessible and relatively inexpensive alternative (Toepoel & Lugtig, 2015). Internet only was needed by 7.6% in 2012 and 9.2% in 2014, while 13.2% in 2012 and 9.9% in 2014 had neither broadband Internet nor a PC or tablet computer.
Despite the careful survey design, response rates were significantly higher among previously online than among previously offline sample units. While in 2012 among onliners 1,450 out of 2,892 eligible persons became panel members (50.2%), among offliners only 128 out of 833 eligible persons could be equipped and recruited into the panel (15.4%). In 2014, there is again a difference in the response rates between online and offline persons. While 3,116 out of 6,184 age-eligible onliners became panel members (50.4%), only 270 out of 1,497 eligible offliners (18.0%) could be recruited.
Comparing the 2012 and 2014 recruitment rates, we see a significant increase in the recruitment success among offliners (from 15.4% in 2012 compared to 18.0% in 2014), while the recruitment success among onliners remained constant across the two phases. At the same time, these numbers emphasize that the recruitment rates remain consistently lower among offliners than among onliners (see Figure 2).
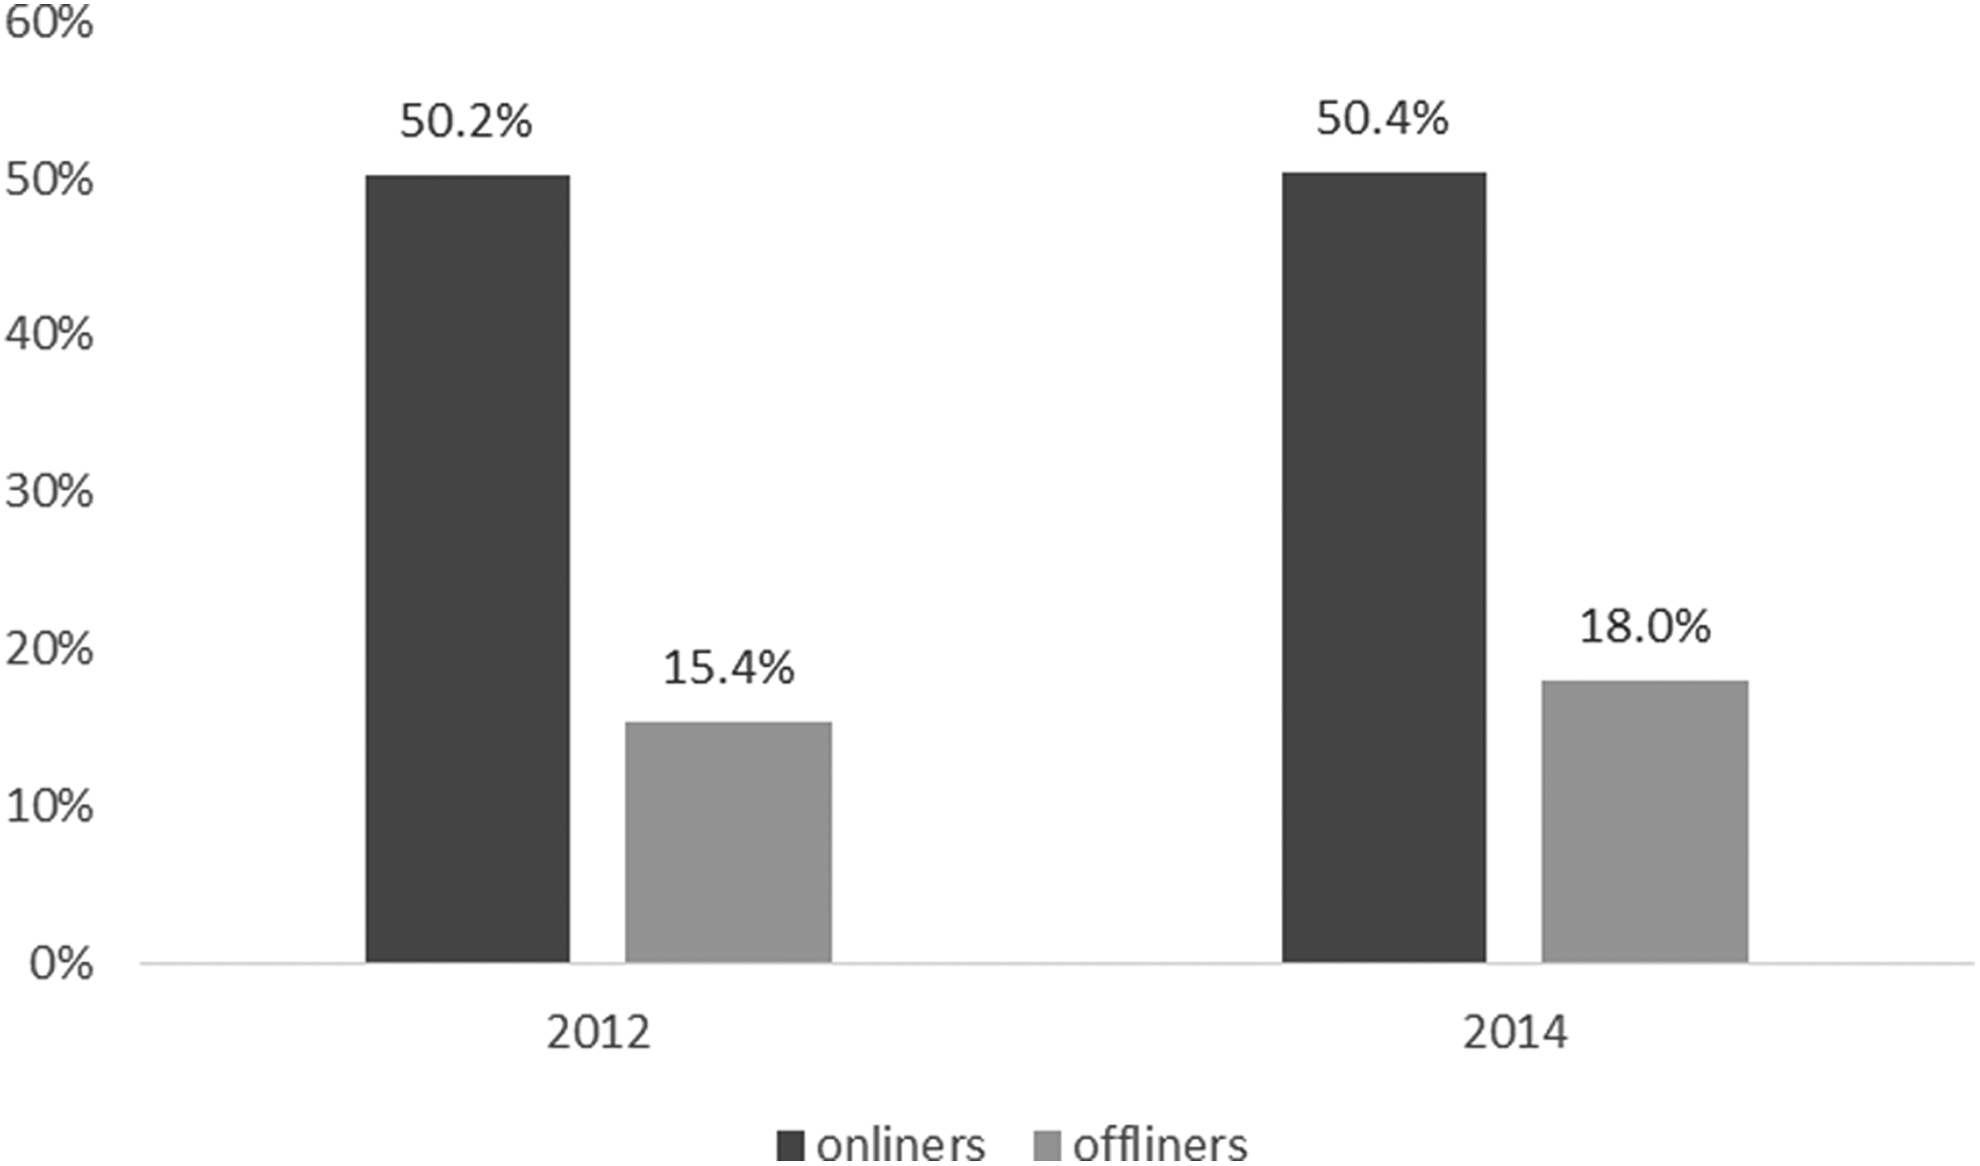
Person-level response rates among onliners and offliners in 2012 and 2014.
This raises the question of whether the measures taken by the GIP to counter coverage bias among offline persons pay off in terms of sample representativeness, if the response rates among offliners are so much lower than among onliners. Or, do we simply replace the coverage bias with nonresponse bias? The subsequent analyses investigate this question in three steps. First, we examine whether there are differences in the characteristics of online and offline persons. Next, we explore the sample unit characteristics associated with the propensity to respond and their interaction with whether the sample unit is offline. Finally, we compare the GIP sample composition with and without offline sample units to known population distributions.
Data and Method
Since the GIP is sampled and recruited in several steps, the resulting data structure is also complex. As an area probability sample, the sampling process consisted of several stages. At the first stage, we drew a random sample of areas (i.e., primary sampling units [PSUs]) from among a regularly updated database of 52,947 areas, each containing approximately equal numbers of households (see ADM, 2014, p. 96). Within each PSU, listers recorded all households along a predefined random route. Subsequently, in the office, we randomly selected every fifth household from among all listed households.
The face-to-face recruitment interview took place with one nonrandomly selected individual in each household. This individual provided information on the composition of the household (including each household member’s age, gender, and their relationship to the respondent), key sociodemographic characteristics of the respondent, plus some political and social attitudes and behavior (e.g., voting behavior, media and news consumption, political interest). In addition, the face-to-face respondent provided key information on the household as a whole on computers and Internet connections available at the household. In analyses based on the face-to-face recruitment data, there are therefore some variables that are available for all household members (e.g., age, gender, household size, and computer/Internet equipment in the household) and some variables that are only available for the nonrandomly selected respondent to the face-to-face interview.
The online panel sampled all age-eligible household members independently of whether the individual had been interviewed by a face-to-face interviewer. As a consequence, the online sample is based on a strict random sample of individuals clustered in households and PSUs sampled with equal selection probabilities at each sampling stage. See Figure 3 for an illustration of the GIP sampling and recruitment process and resulting data structure.
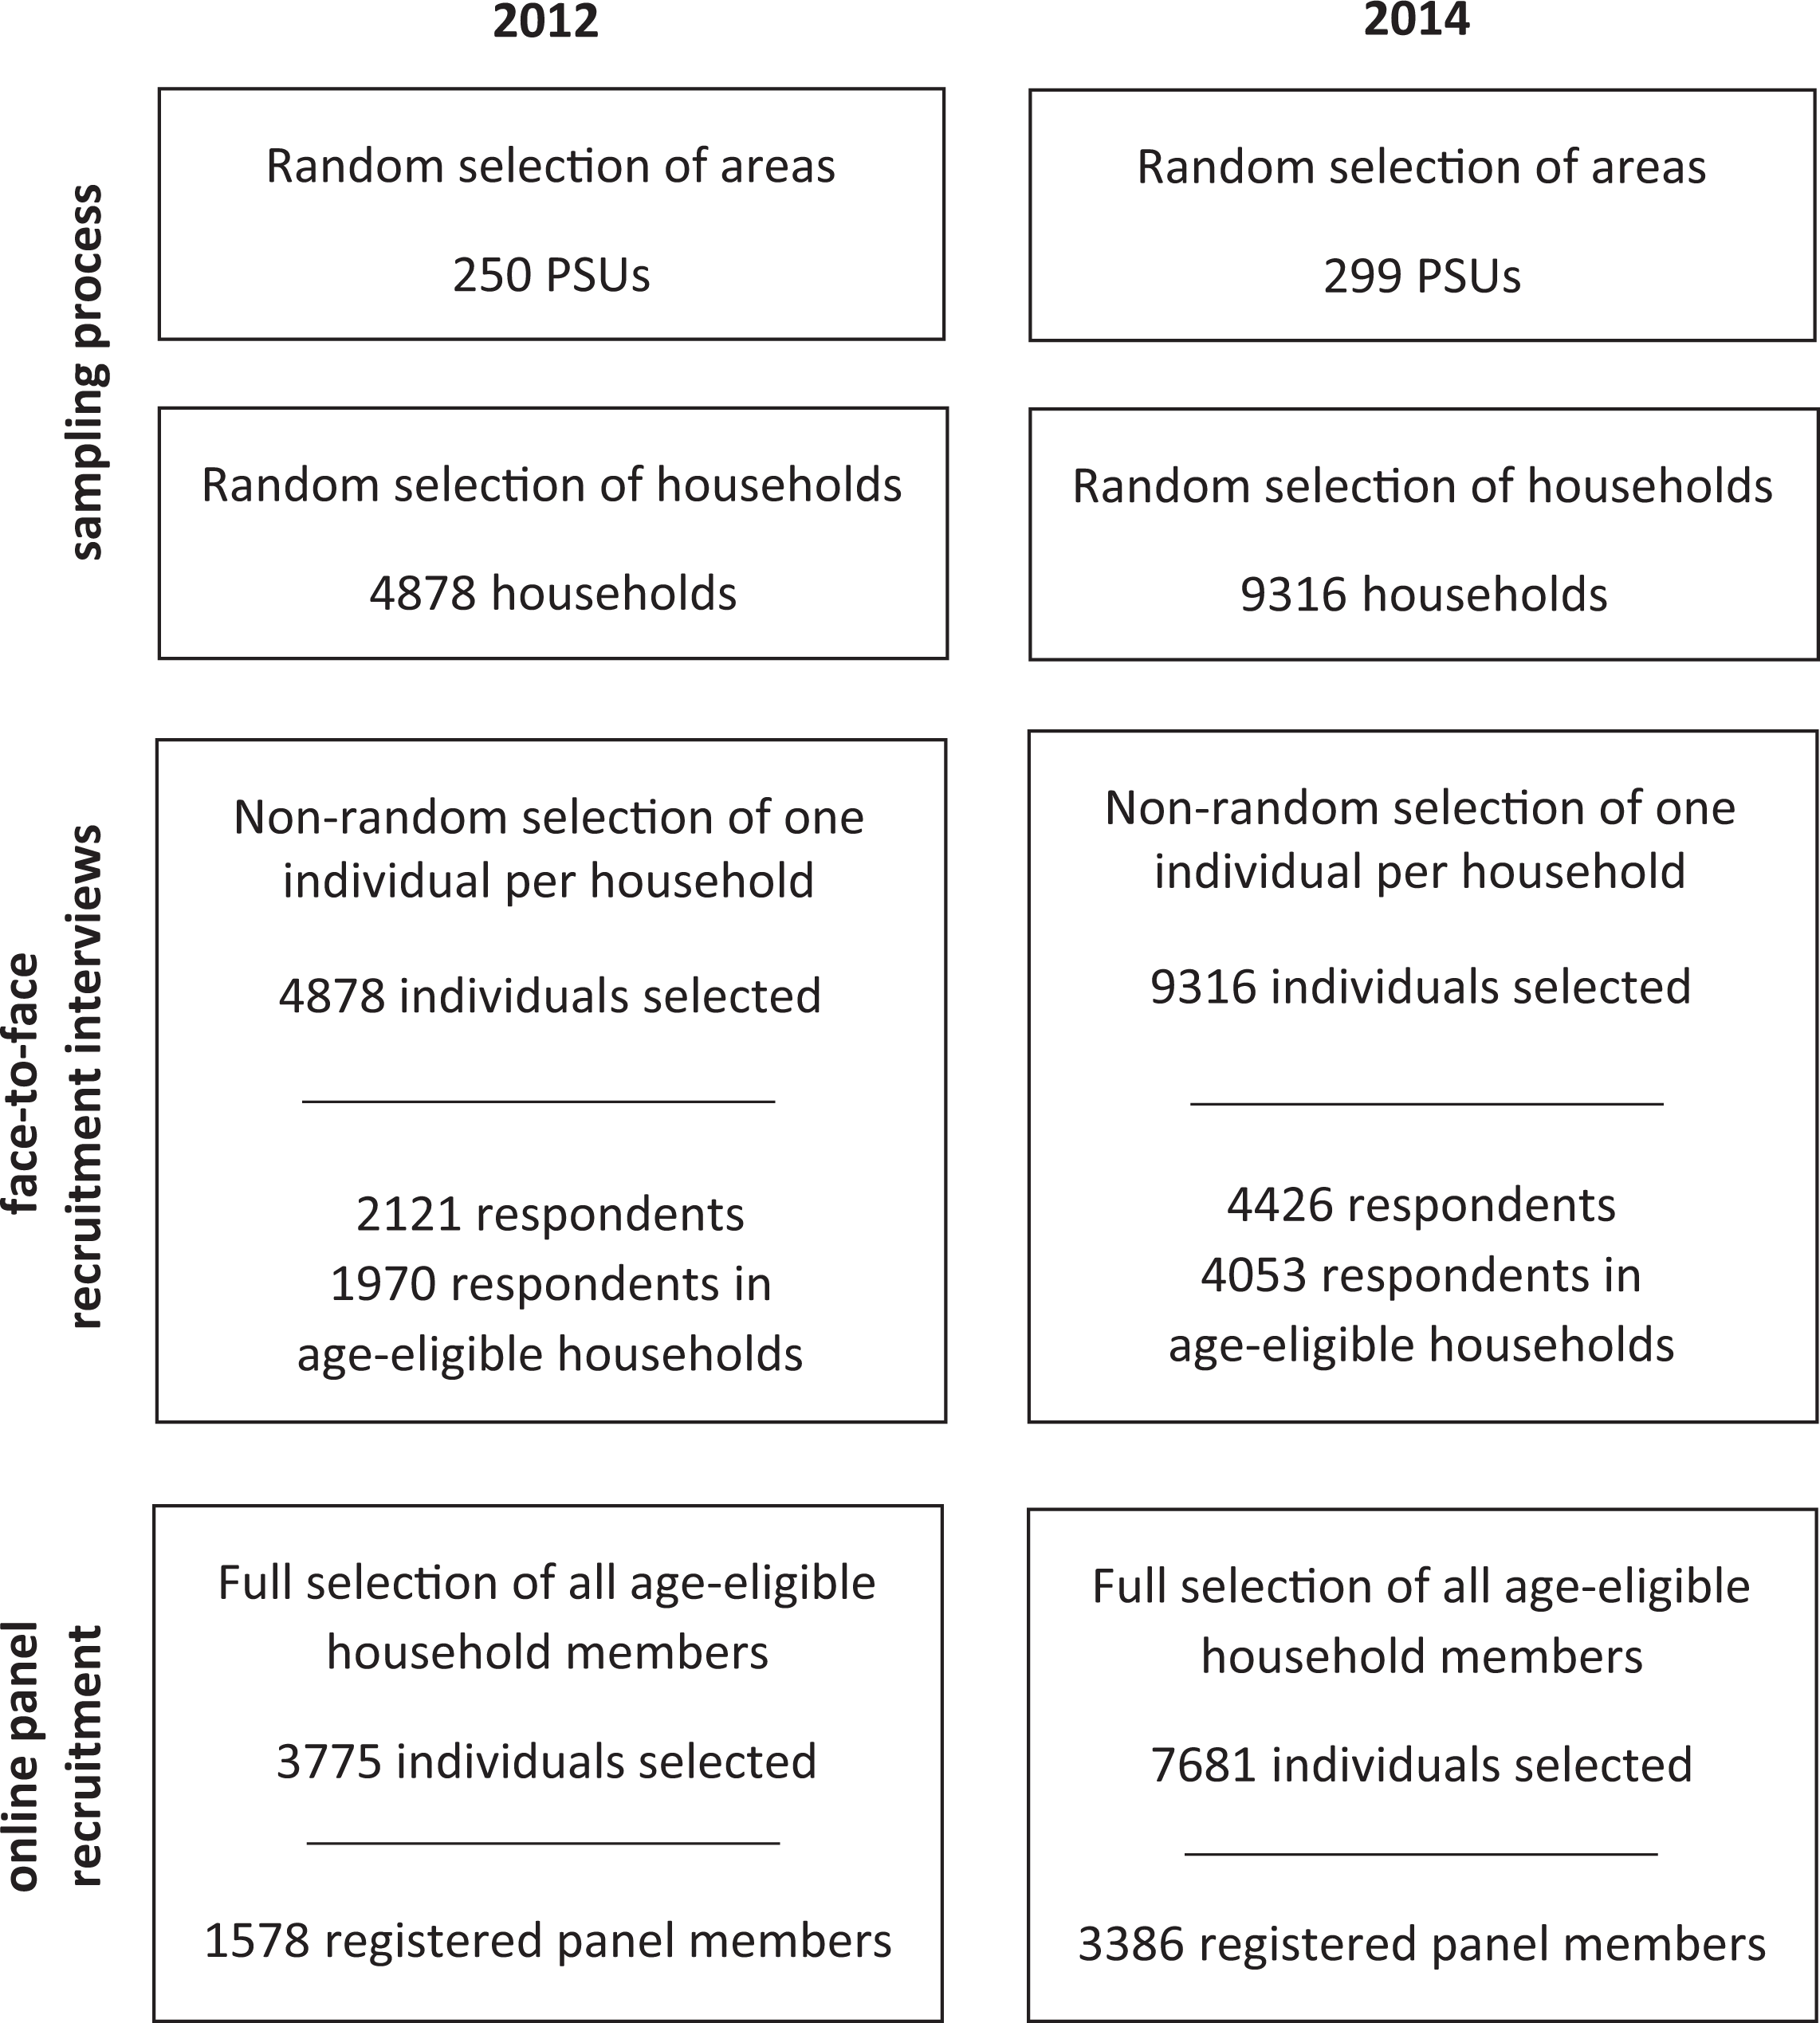
GIP sampling/recruitment processes and resulting data structures.
In the following, our analyses will take this complex data structure into account by means of jackknife variance estimation (Gould, 1995). Furthermore, analyses based on the face-to-face recruitment interviews first investigate whether the nonrandom selection of respondents at this stage resulted in relevant selectivities that may influence the results. For this purpose, we use data collected for all household members (year of birth, gender, and household size) plus area information from the sampling frame (urbanicity). Subsequently, the analyses are conducted with design weights that account for the fact that individuals in smaller households are more likely to be interviewed face-to-face than persons living in larger households. In analyses based on the face-to-face recruitment interviews, a small proportion of respondents refused information on the year of birth for themselves and/or for other household members (0.7% in 2012 and 0.6% 2014). These missing values were imputed using predictive mean matching (Morris, White, & Royston, 2014).
Since the GIP recruited new panel members twice, in 2012 and 2014, two sets of recruitment data are available for analysis. While the sampling procedures and recruitment protocols were largely the same in both recruitment rounds, the 2012 and 2014 data can be analyzed separately or in an analysis of the pooled data set controlling for differences across rounds with a dummy indicator for the round. Overall, the results across recruitment rounds were similar. For this reason, this article presents the results of the pooled analyses and reports the results of separate analyses on the 2012 and 2014 data in Appendix (Tables A1–A4).
Results
Our analyses are structured into three parts. First, we examine whether and in which way persons who do not have access to broadband Internet and a desktop, laptop, or tablet computer at home (i.e., offliners) differ from persons who have such access (i.e., onliners). Subsequently, we investigate who registers to participate in the GIP and whether being online or offline plays a role in this process over and above other sociodemographic characteristics such as age, gender, and education. Finally, we compare the achieved GIP sample to known population distributions to explore the contribution of the recruited offliners to the representativeness of the overall sample.
Please note that the first and second set of analyses presented in “Differences Between Previously Online and Previously Offline Persons” and “Recruitment Propensities” sections, respectively, are based on data from the face-to-face recruitment interviews. Our analyses assume that there is no nonresponse bias associated with the estimates of being an offliner at the face-to-face interview stage, because neither the advance letter nor the interviewers at the doorstep mentioned the online panel during the face-to-face fieldwork process. However, given that the response rates for the face-to-face recruitment interviews were 52.1% and 48.4% (response rate 2 [RR2] as defined by American Association for Public Opinion Research, 2011) in 2012 and 2014, respectively, this leaves scope for potential nonresponse bias in the face-to-face recruitment data, which we cannot account for in the first and second set of analyses. In “Contribution of Offline Respondents to the Sample Composition” section, however, we compare GIP survey estimates to general population benchmarks. This means that in this section nonresponse bias and noncoverage bias at the face-to-face interview stage are taken into account.
Differences Between Previously Online and Previously Offline Persons
For our first set of analyses, we predict whether a respondent is online or offline given their characteristics collected during the face-to-face interview. This means that both, persons who ultimately participated in the online panel and persons who did not participate online, are included in the models.
Table 1 reports the results for the analyses on the pooled data with a dummy indicator controlling for whether the person was sampled in 2012 or 2014. 3 Model 1 predicts having a computer and Internet access (i.e., being online) based on all household members with a logistic regression model taking the clustered survey design (individuals clustered in households in PSUs) into account. We find that age, gender, and household size are highly significant predictors of whether a person has access to a computer and Internet at home. Younger persons, males, and those living in larger households are more likely to be online. 4 The urbanicity of a sample unit’s home is also significantly related to being online. In particular, those living in core areas of large cities are more likely to be online.
Logistic Regression on Being Online, Pooled Data of 2012 and 2014.
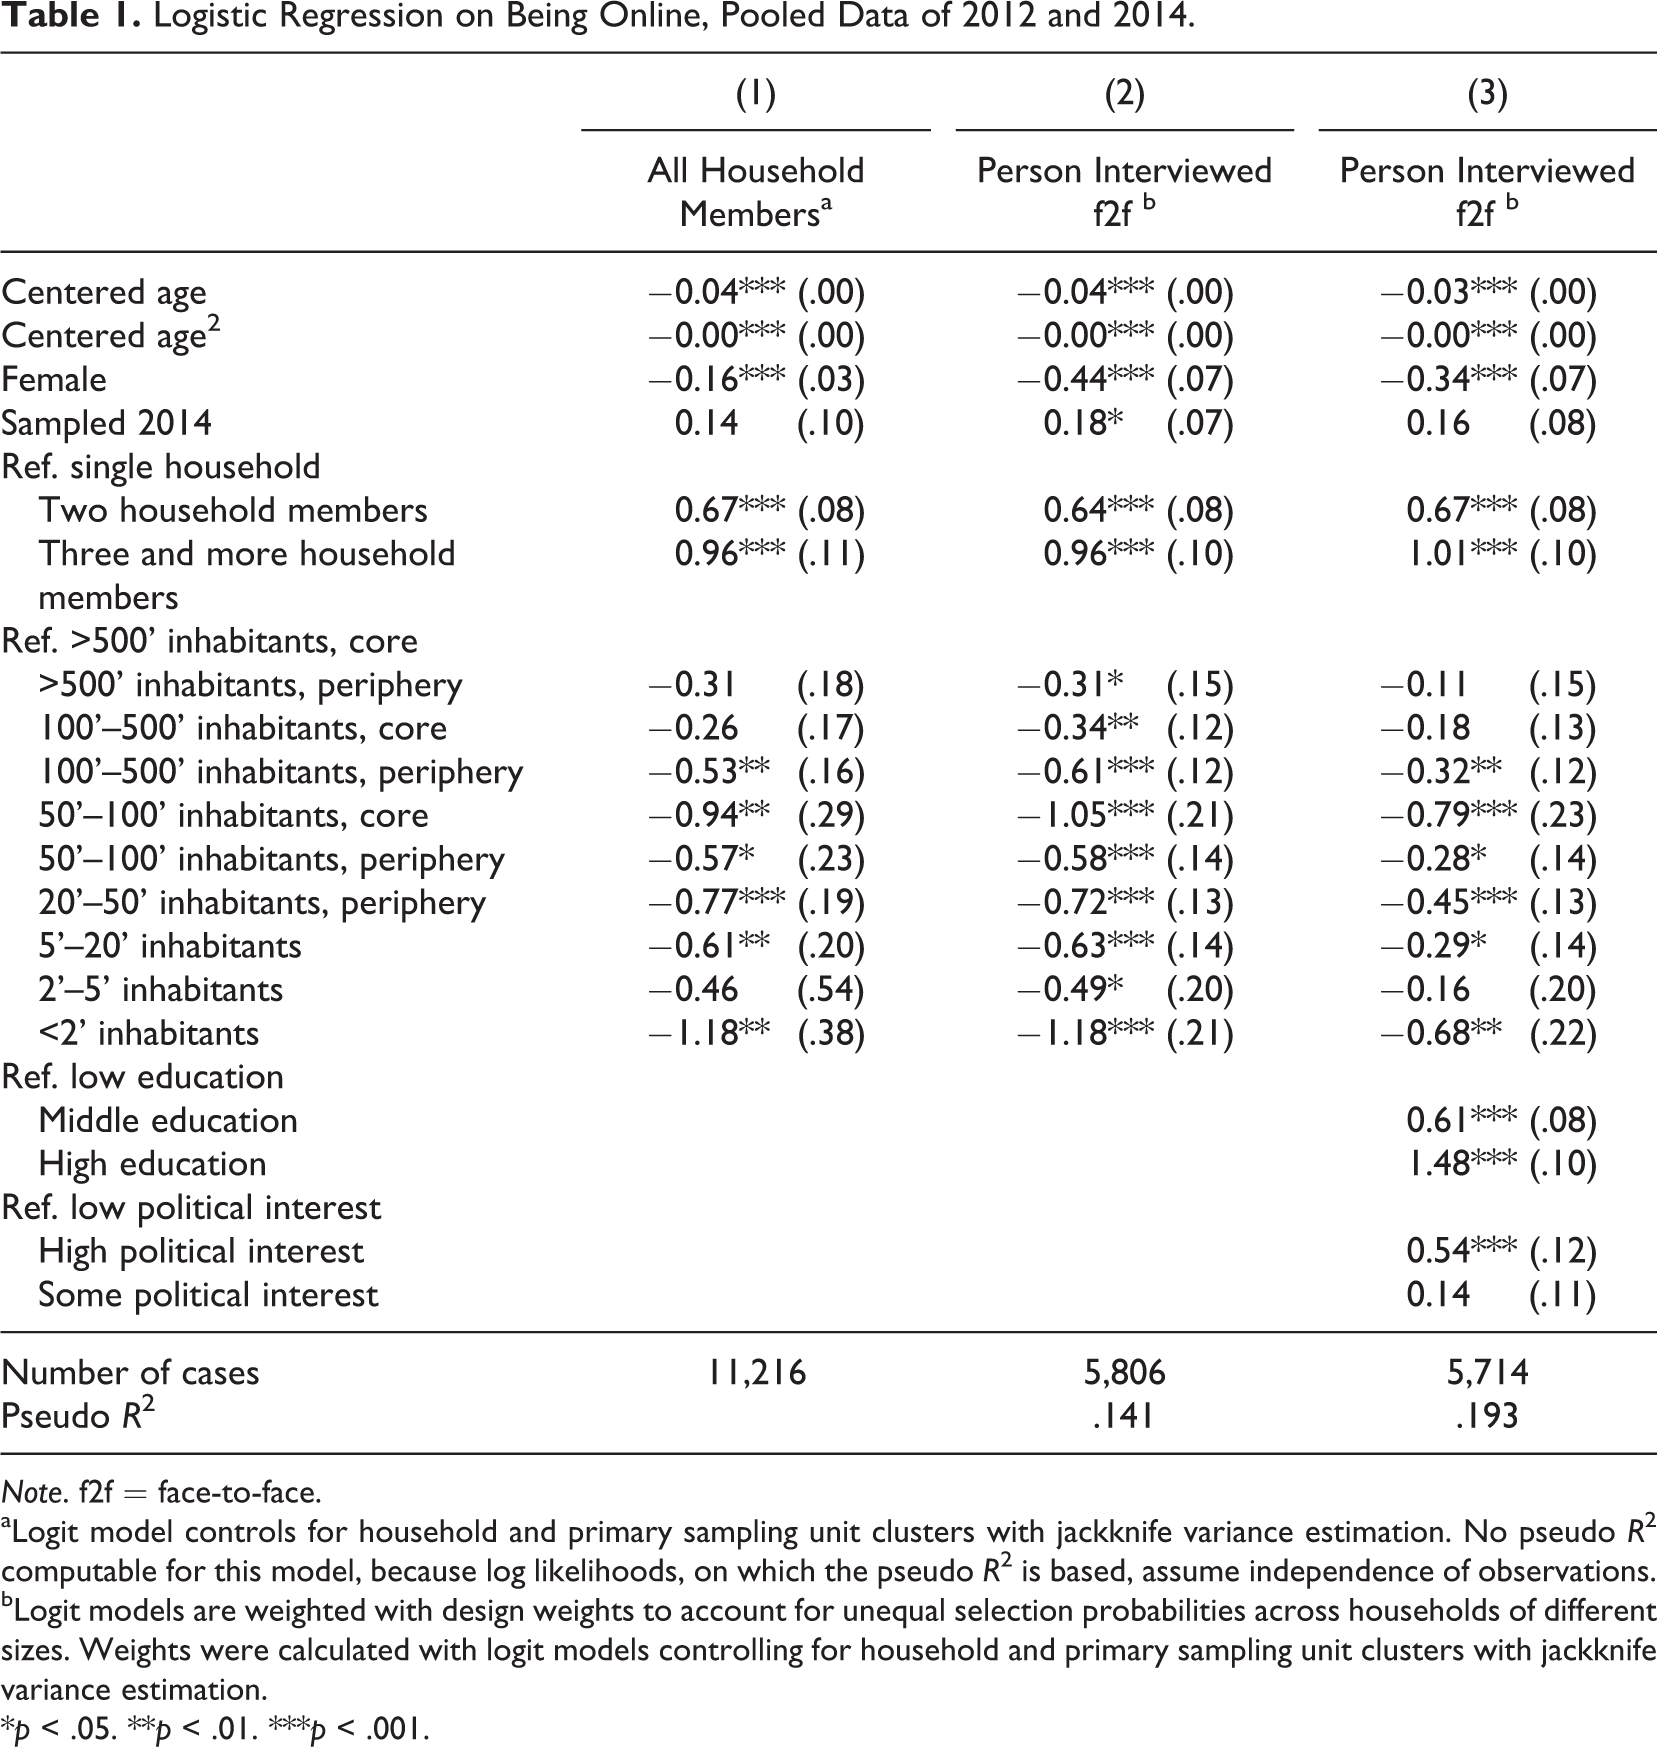
Note. f2f = face-to-face.
aLogit model controls for household and primary sampling unit clusters with jackknife variance estimation. No pseudo R 2 computable for this model, because log likelihoods, on which the pseudo R 2 is based, assume independence of observations. bLogit models are weighted with design weights to account for unequal selection probabilities across households of different sizes. Weights were calculated with logit models controlling for household and primary sampling unit clusters with jackknife variance estimation.
*p < .05. **p < .01. ***p < .001.
When we reduce our analyses to the nonrandomly selected respondent of the face-to-face interview (Model 2, design weighted for unequal selection probabilities due to household size), we observe that the statistical significance and direction of the effects remain largely the same as in Model 1. Overall, we find that the selectivities due to the nonrandom selection at the face-to-face interview are negligible. This means that we can proceed with the respondent sample for which we have more detailed information from the face-to-face interview.
In Model 3, we thus include the additional predictors education and political interest. Education has a significant positive influence on being online. Furthermore, persons with high political interest are significantly more likely to be online than persons with low political interest. Furthermore, when testing for interaction effects, we found in the 2012 recruitment that the positive effect of political interest on being online is especially strong for the highly educated (see Table A1 in Appendix).
To conclude, onliners and offliners differ significantly from each other. Onliners are younger, more likely to be male, live in larger households and in more urban areas, are higher educated, and are politically interested. These results suggest that a priori excluding offliners from an online panel may affect estimates that correlate with these characteristics because of coverage bias.
Recruitment Propensities
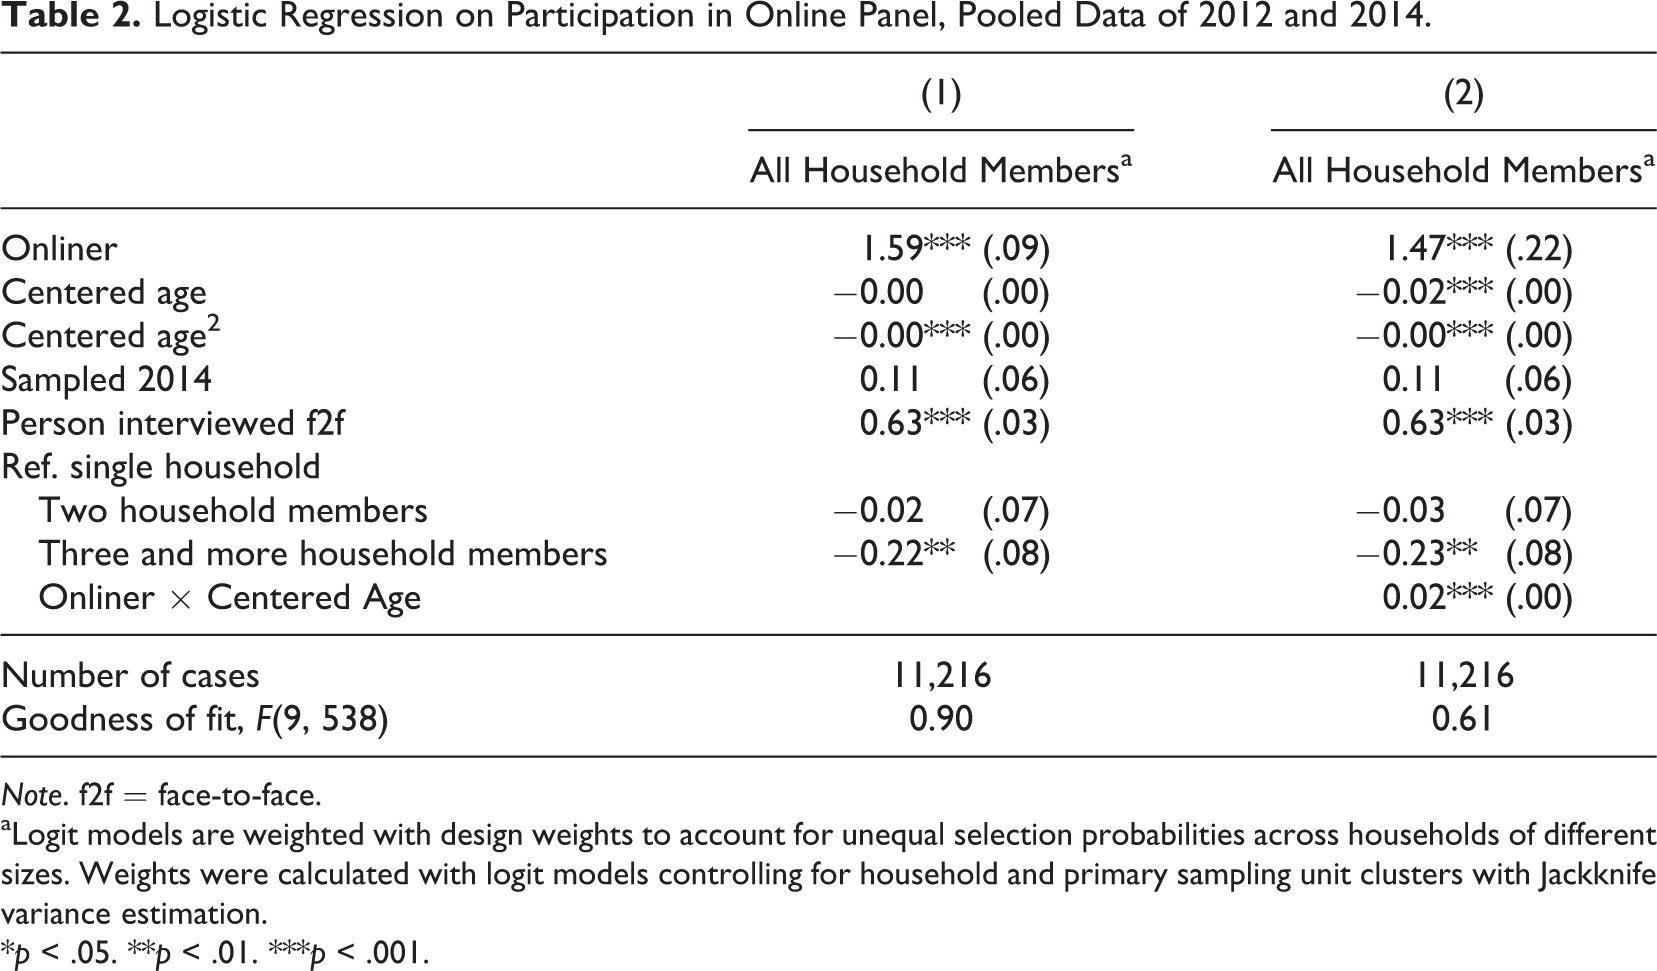
In the subsequent analyses, we investigate the characteristics of respondents to the online panel after the face-to-face recruitment interview. Figure 2 shows the main effect of recruiting onliners versus offliners. Overall, 50.3% of onliners but only 17.1% of offliners could be recruited into the online panel in 2012 and 2014. The results of a logistic regression model of participation in the online panel based on the pooled data are presented in Table 2. We estimate the effects of the characteristics of household members on their recruitment into the online panel.
Logistic Regression on Participation in Online Panel, Pooled Data of 2012 and 2014.
Note. f2f = face-to-face.
aLogit models are weighted with design weights to account for unequal selection probabilities across households of different sizes. Weights were calculated with logit models controlling for household and primary sampling unit clusters with Jackknife variance estimation.
*p < .05. **p < .01. ***p < .001.
Model 1 predicts taking part in the online panel. In line with Figure 2, onliners are significantly more likely to participate. In addition, respondents to the online panel are younger and tend to live in smaller households than nonrespondents. Finally, persons who were interviewed face-to-face (i.e., the nonrandomly selected household member at the recruitment interview) are more likely to be recruited for the online panel compared to the other household members, who were not interviewed face-to-face.
Furthermore, we find a significant interaction effect between being online and age. Figure 4 shows the predicted probabilities of participation in the online panel plotted against age, separately for onliners and offliners. The figure shows that onliners are more likely to be successfully recruited into the online panel than offliners. In addition, for onliners there is an inverted U-shape relationship between panel participation and age, while for offliners the predicted probabilities of participation in the online panel decrease with age almost linearly. Finally, Figure 4 shows two clusters of predicted probabilities for both onliners and offliners. These clusters depict the differential probabilities of panel participation between those interviewed face-to-face and other household members not interviewed face-to-face, with the face-to-face interviewees participating at a higher rate than the other household members in both online and off-line households.
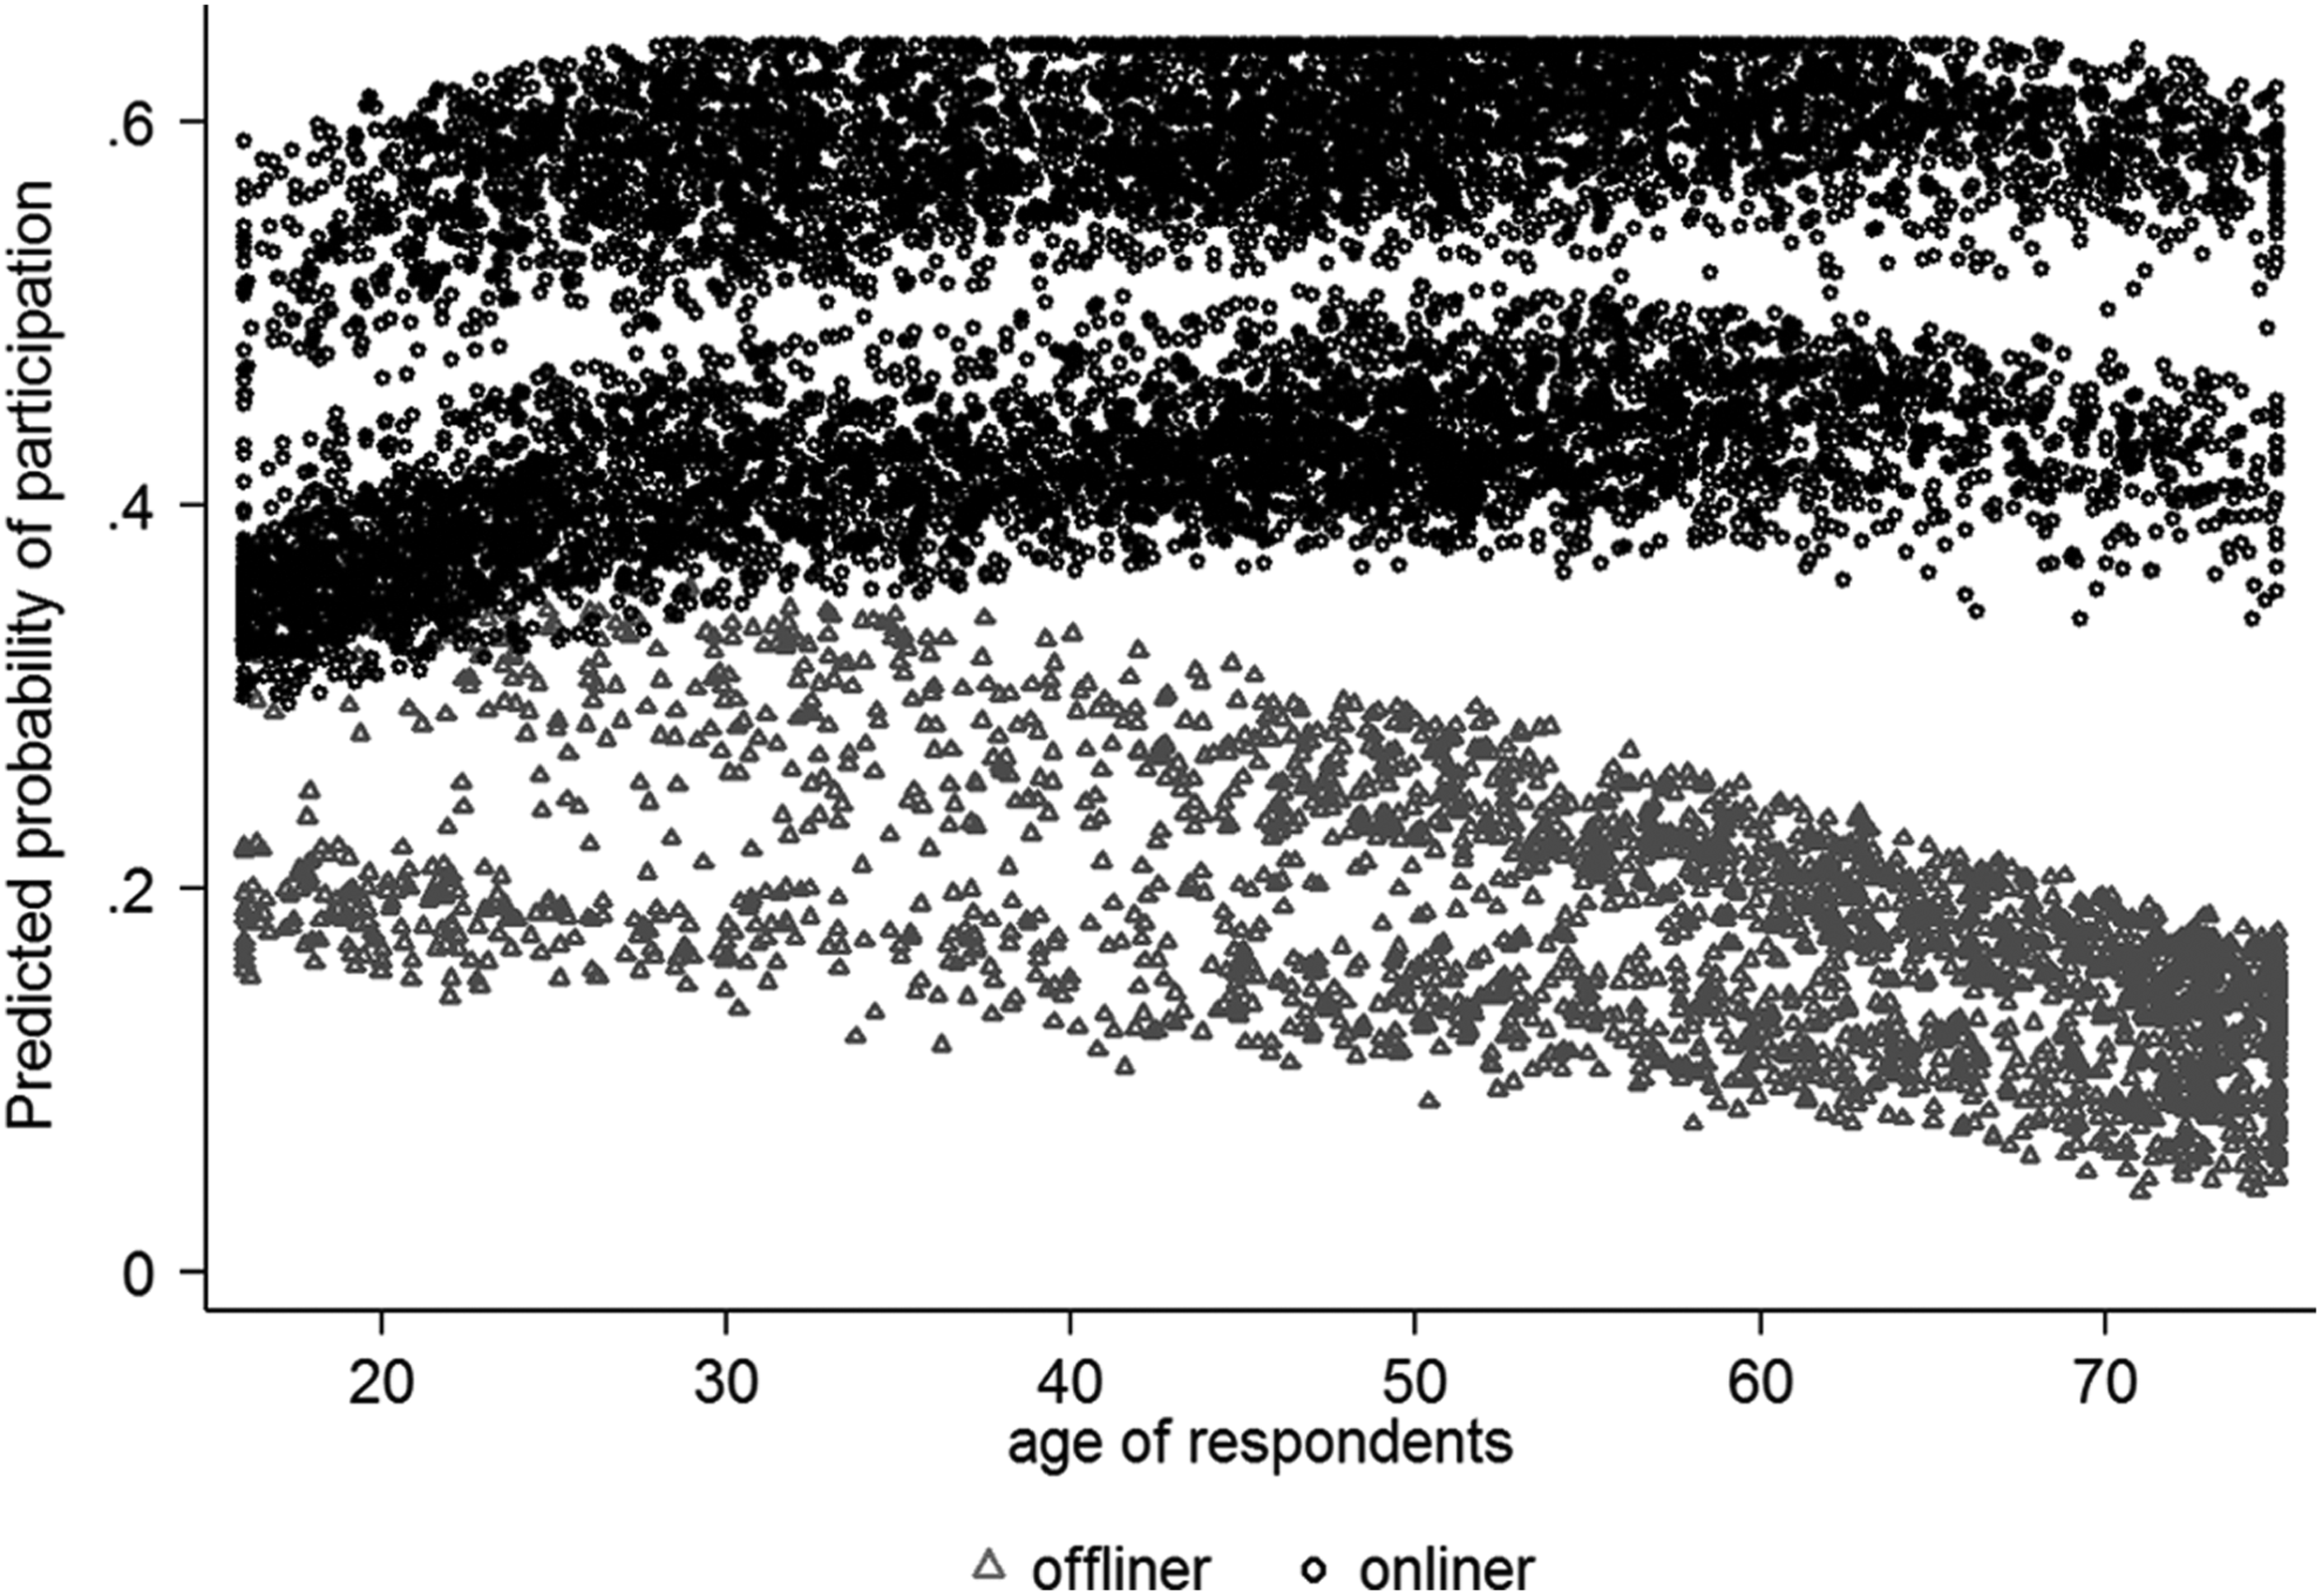
Predicted probabilities of participation in the online panel plotted against age, separately for onliners and offliners. Predicted dots were jittered to make them more visible.
In summary, when transitioning from the face-to-face recruitment interview to the online panel, nonresponse bias among offliners is significantly more prevalent than among onliners. This effect persists over and above an age effect with older persons less likely to be recruited than younger participants. In fact, an interaction effect between being online and age shows that older offliners are the most difficult group and have the lowest response propensities. These results indicate that the GIP sample is somewhat biased regarding nonresponse, especially from offliners and older respondents. At the same time, some older persons and offliners could be recruited. With information on sample unit characteristics on Internet/computer access and age, the nonresponse process may be “missing at random” in the sense of Little and Rubin (2002), enabling effective nonresponse bias adjustments for analysts using the GIP data.
Contribution of Offline Respondents to the Sample Composition
Our analyses so far have shown that onliners and offliners differ from each other in key sociodemographic characteristics and that offliners are significantly more difficult to recruit than onliners. This raises the question of the contribution that the recruited offliners make to the representativeness of the GIP sample. To investigate this, we compare key characteristics of the GIP onliner, offliner, and total sample to known population distributions of the 2012 German Microcensus. We were able to obtain reliable population figures on the following characteristics measured in the GIP in a comparable way: age, gender, education, and household size. In Figures 5 –8, the population proportions for each characteristic are displayed as horizontal lines, while the bars show the sample proportions for each characteristic for the previously online panelists (left bar), the previously offline panelists (the second bar), all GIP panelists (the third bar), and all GIP panelists when weighted for the unequal recruitment rates of offliners versus onliners (right bar). This weighting was conducted to examine whether any remaining differences between the GIP sample and the population may be due to the lower recruitment success among offliners. For this reason, offliners receive a larger weight than onliners, proportional to their respective recruitment rates in 2012 and 2014. As Eckman (2015) pointed out in relation to the LISS, such differential recruitment rates, if not accounted for through weighting, might well hide a positive effect on survey outcomes of including offliners. It should be noted, however, that this weight was derived for demonstration purposes only, to show what the GIP estimates may look like, if offliners and onliners had been recruited at the same rate. There are no official GIP nonresponse weights, and no additional variables (like age or income) were used in building the weight.
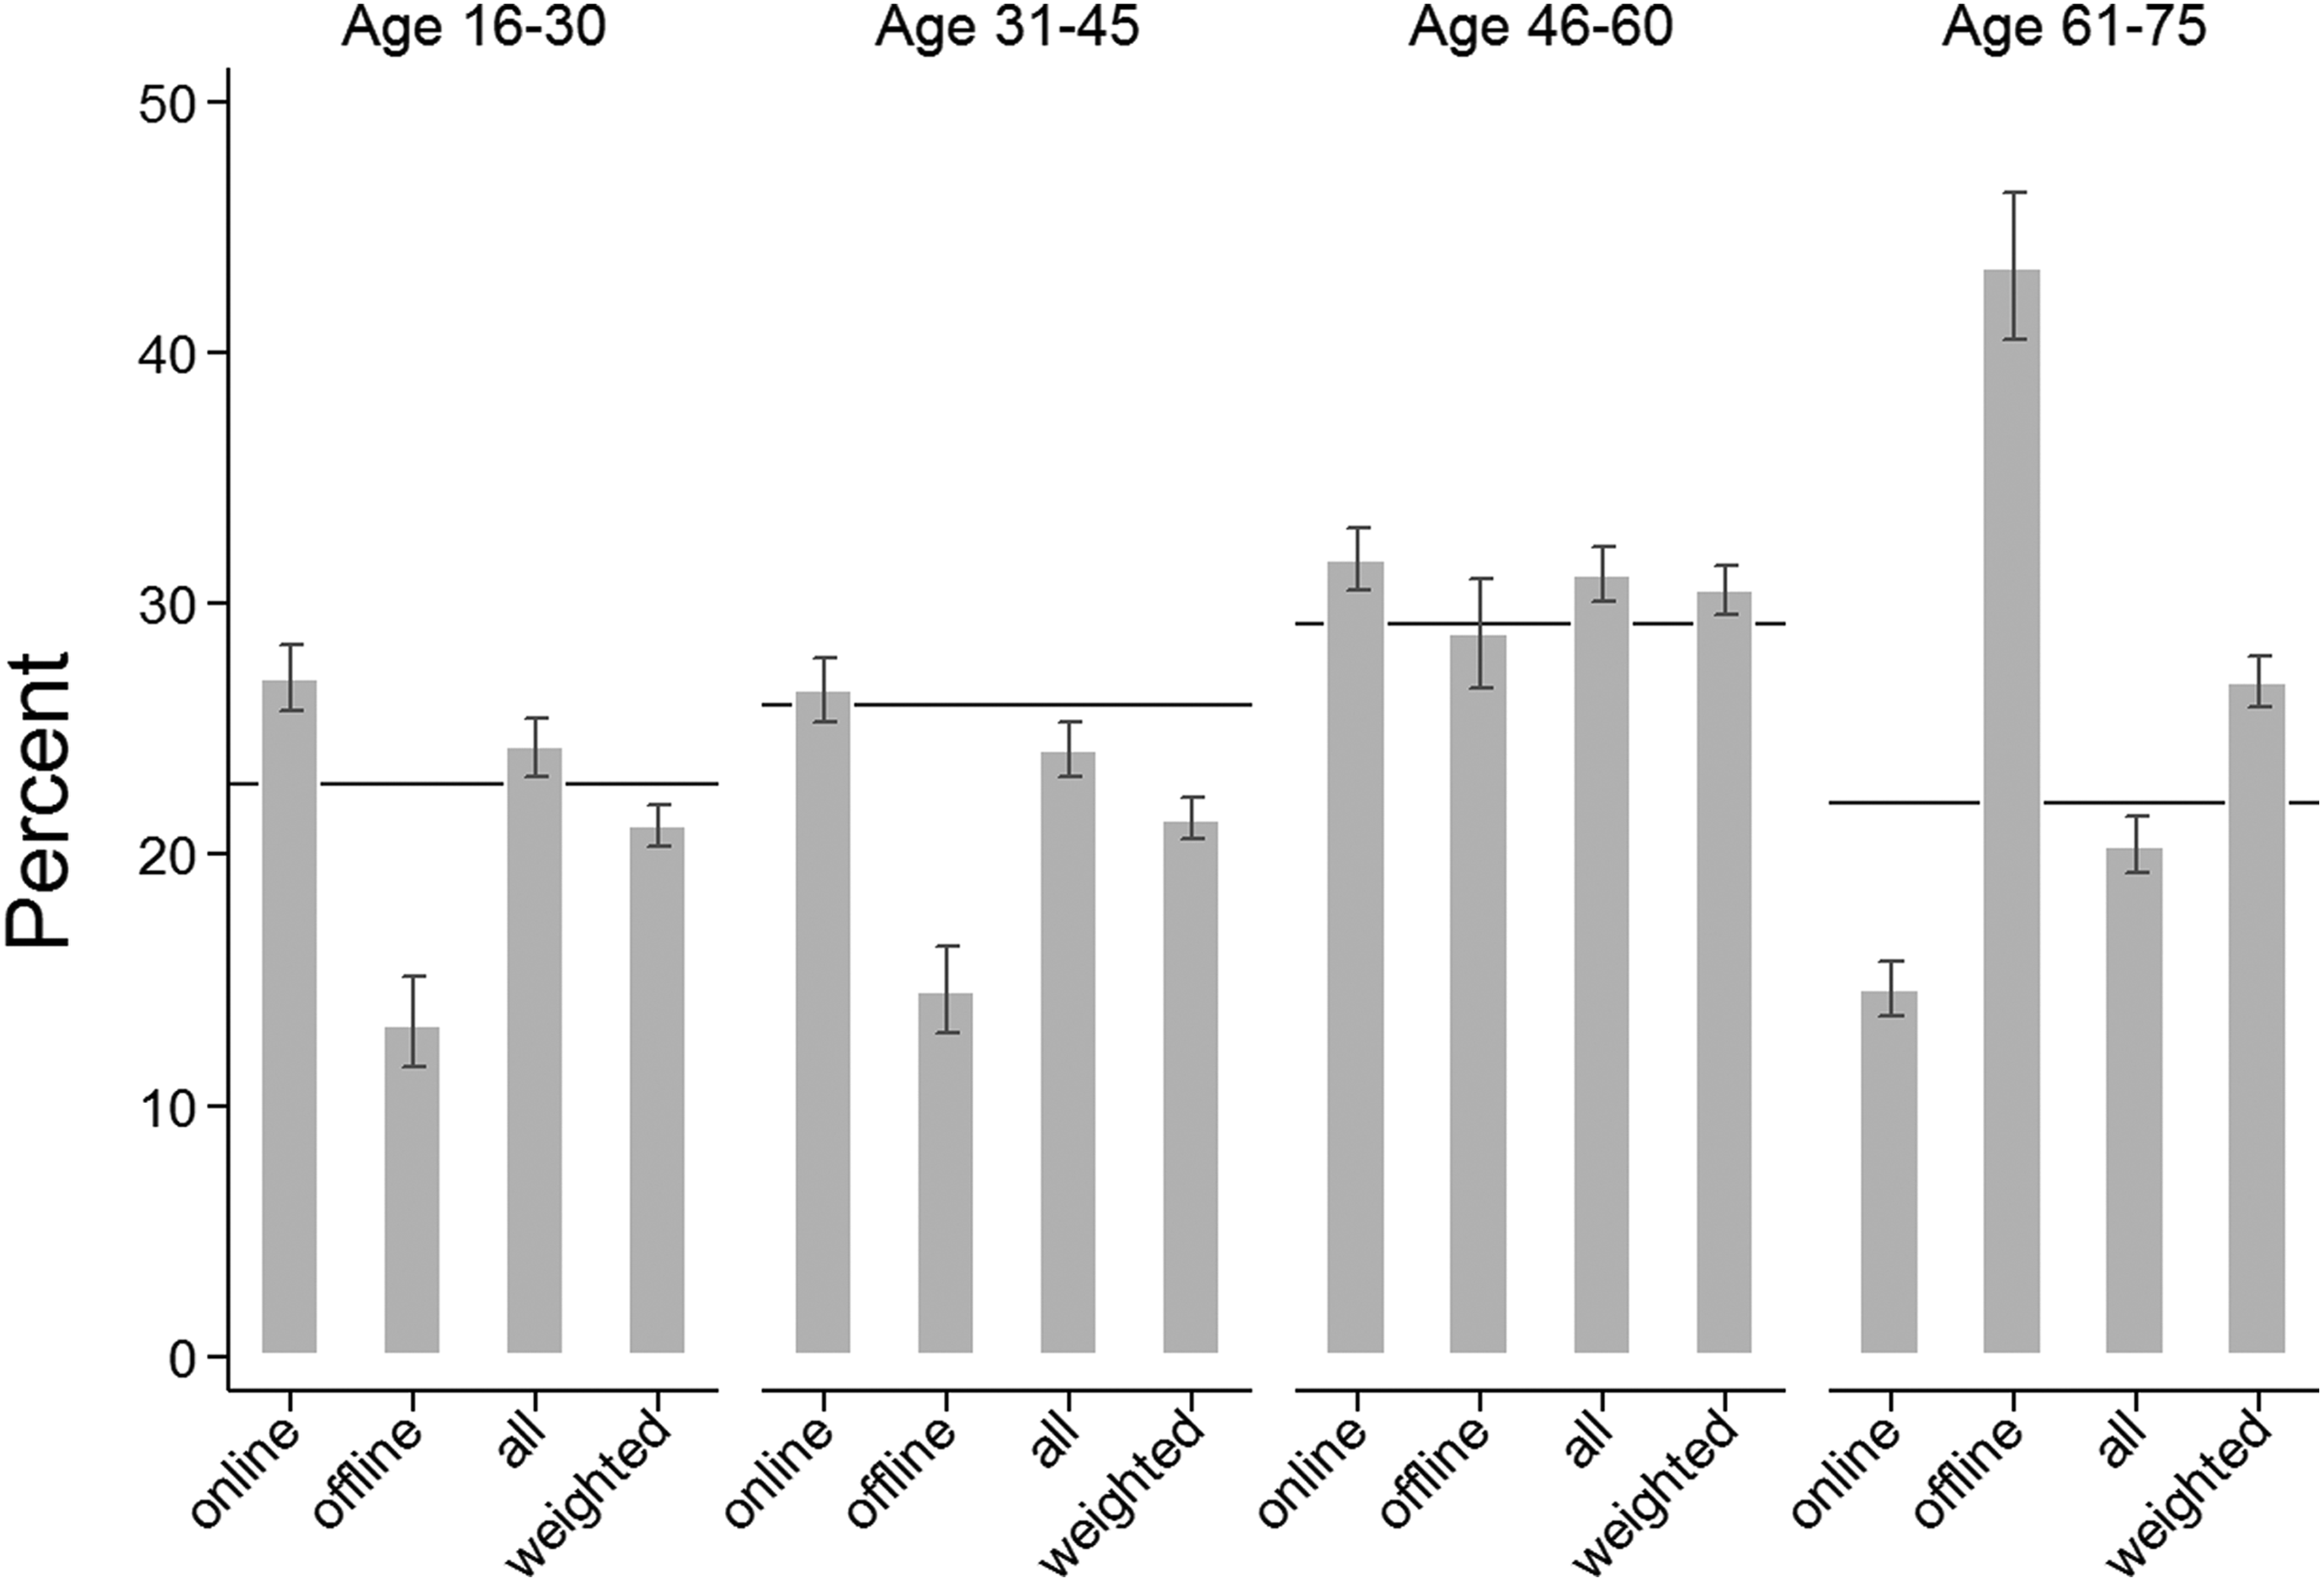
Age: population distributions (horizontal lines) and GIP sample distributions (bars).
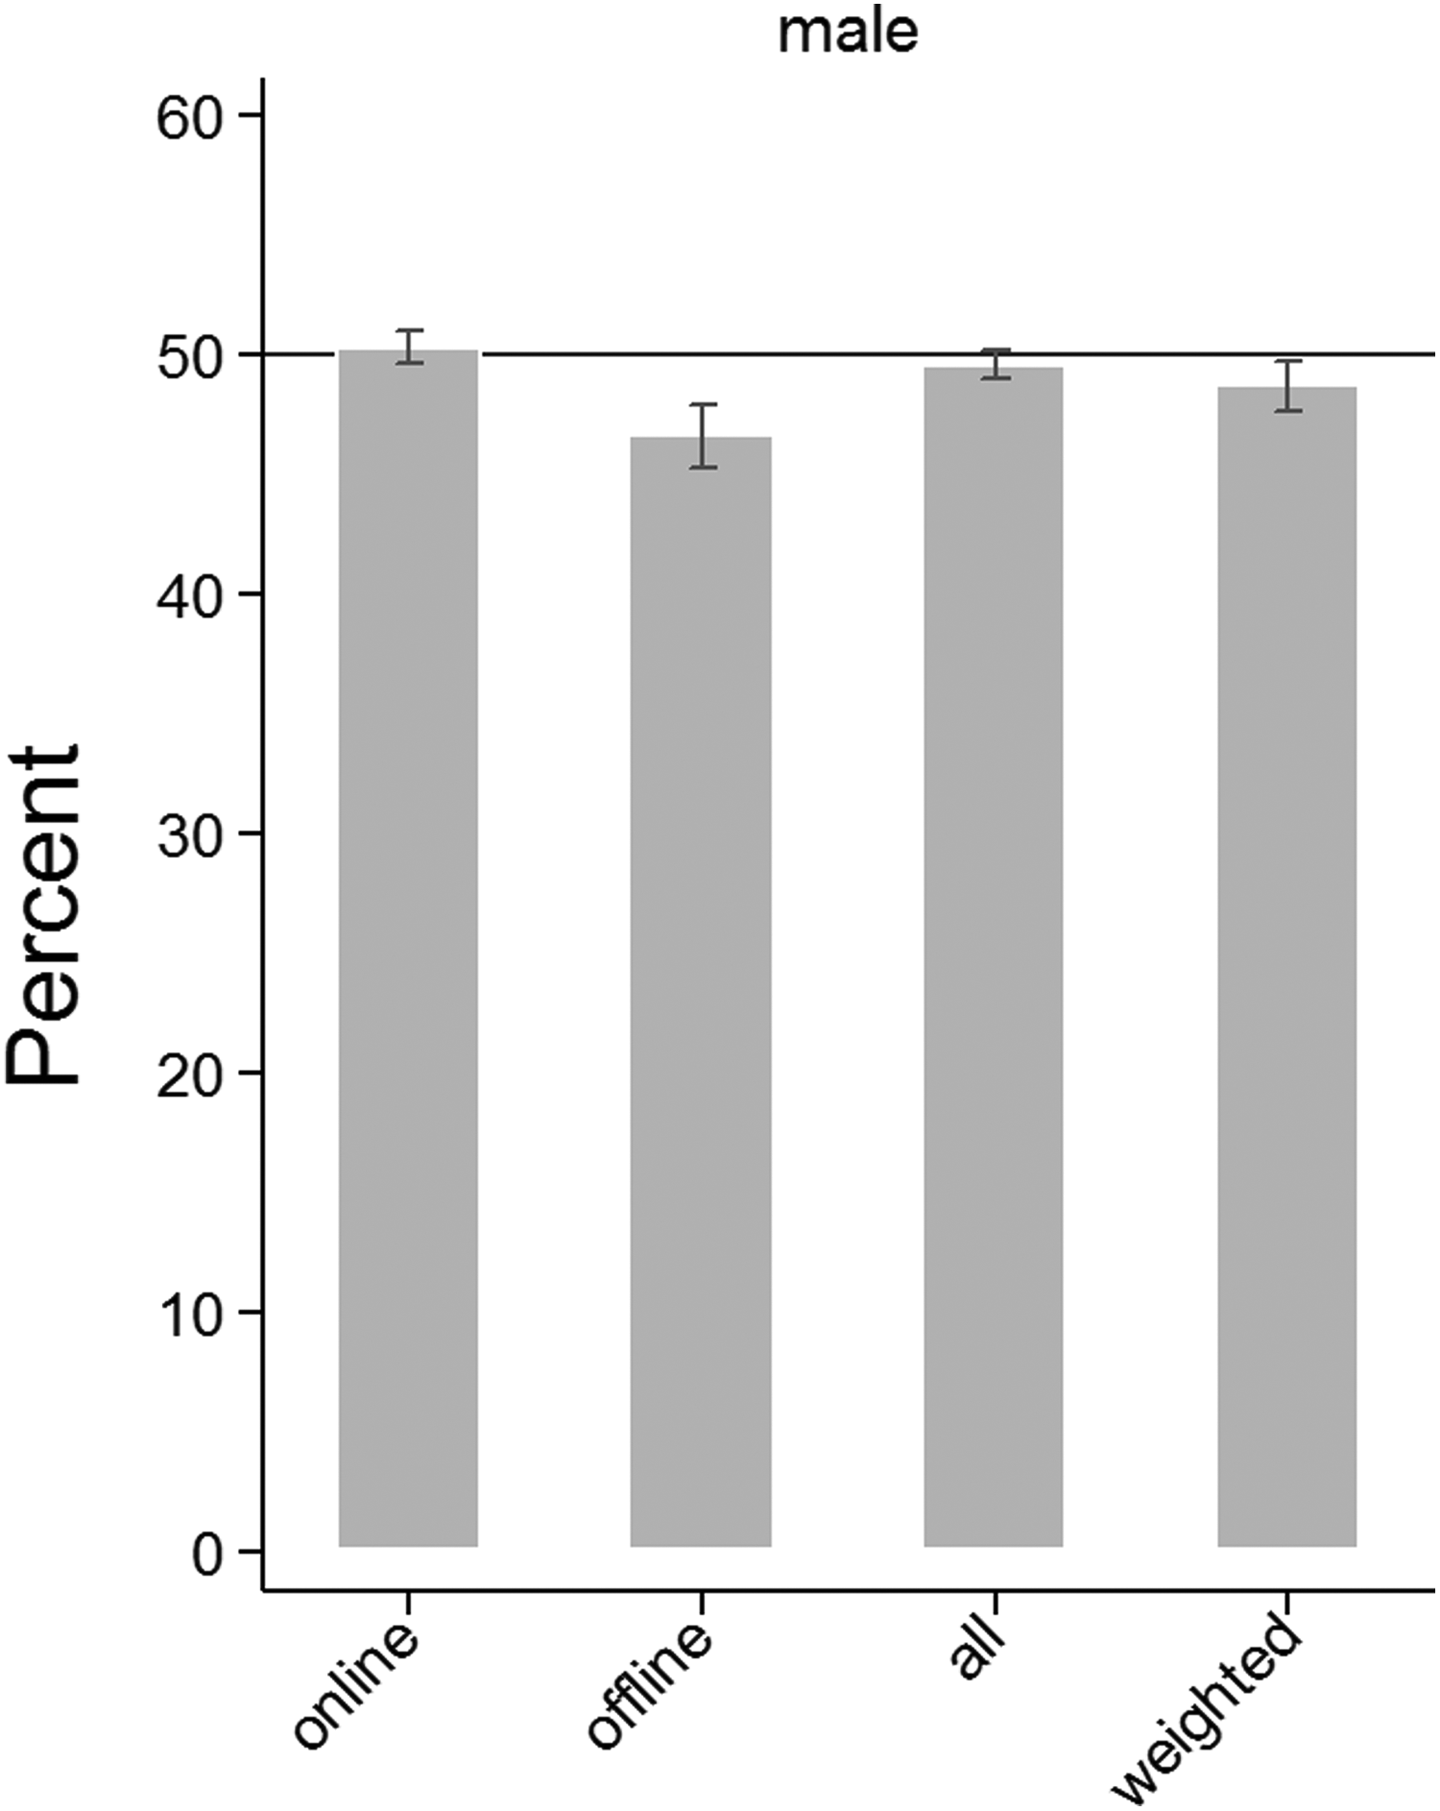
Gender: population distributions (horizontal lines) and GIP sample distributions (bars).
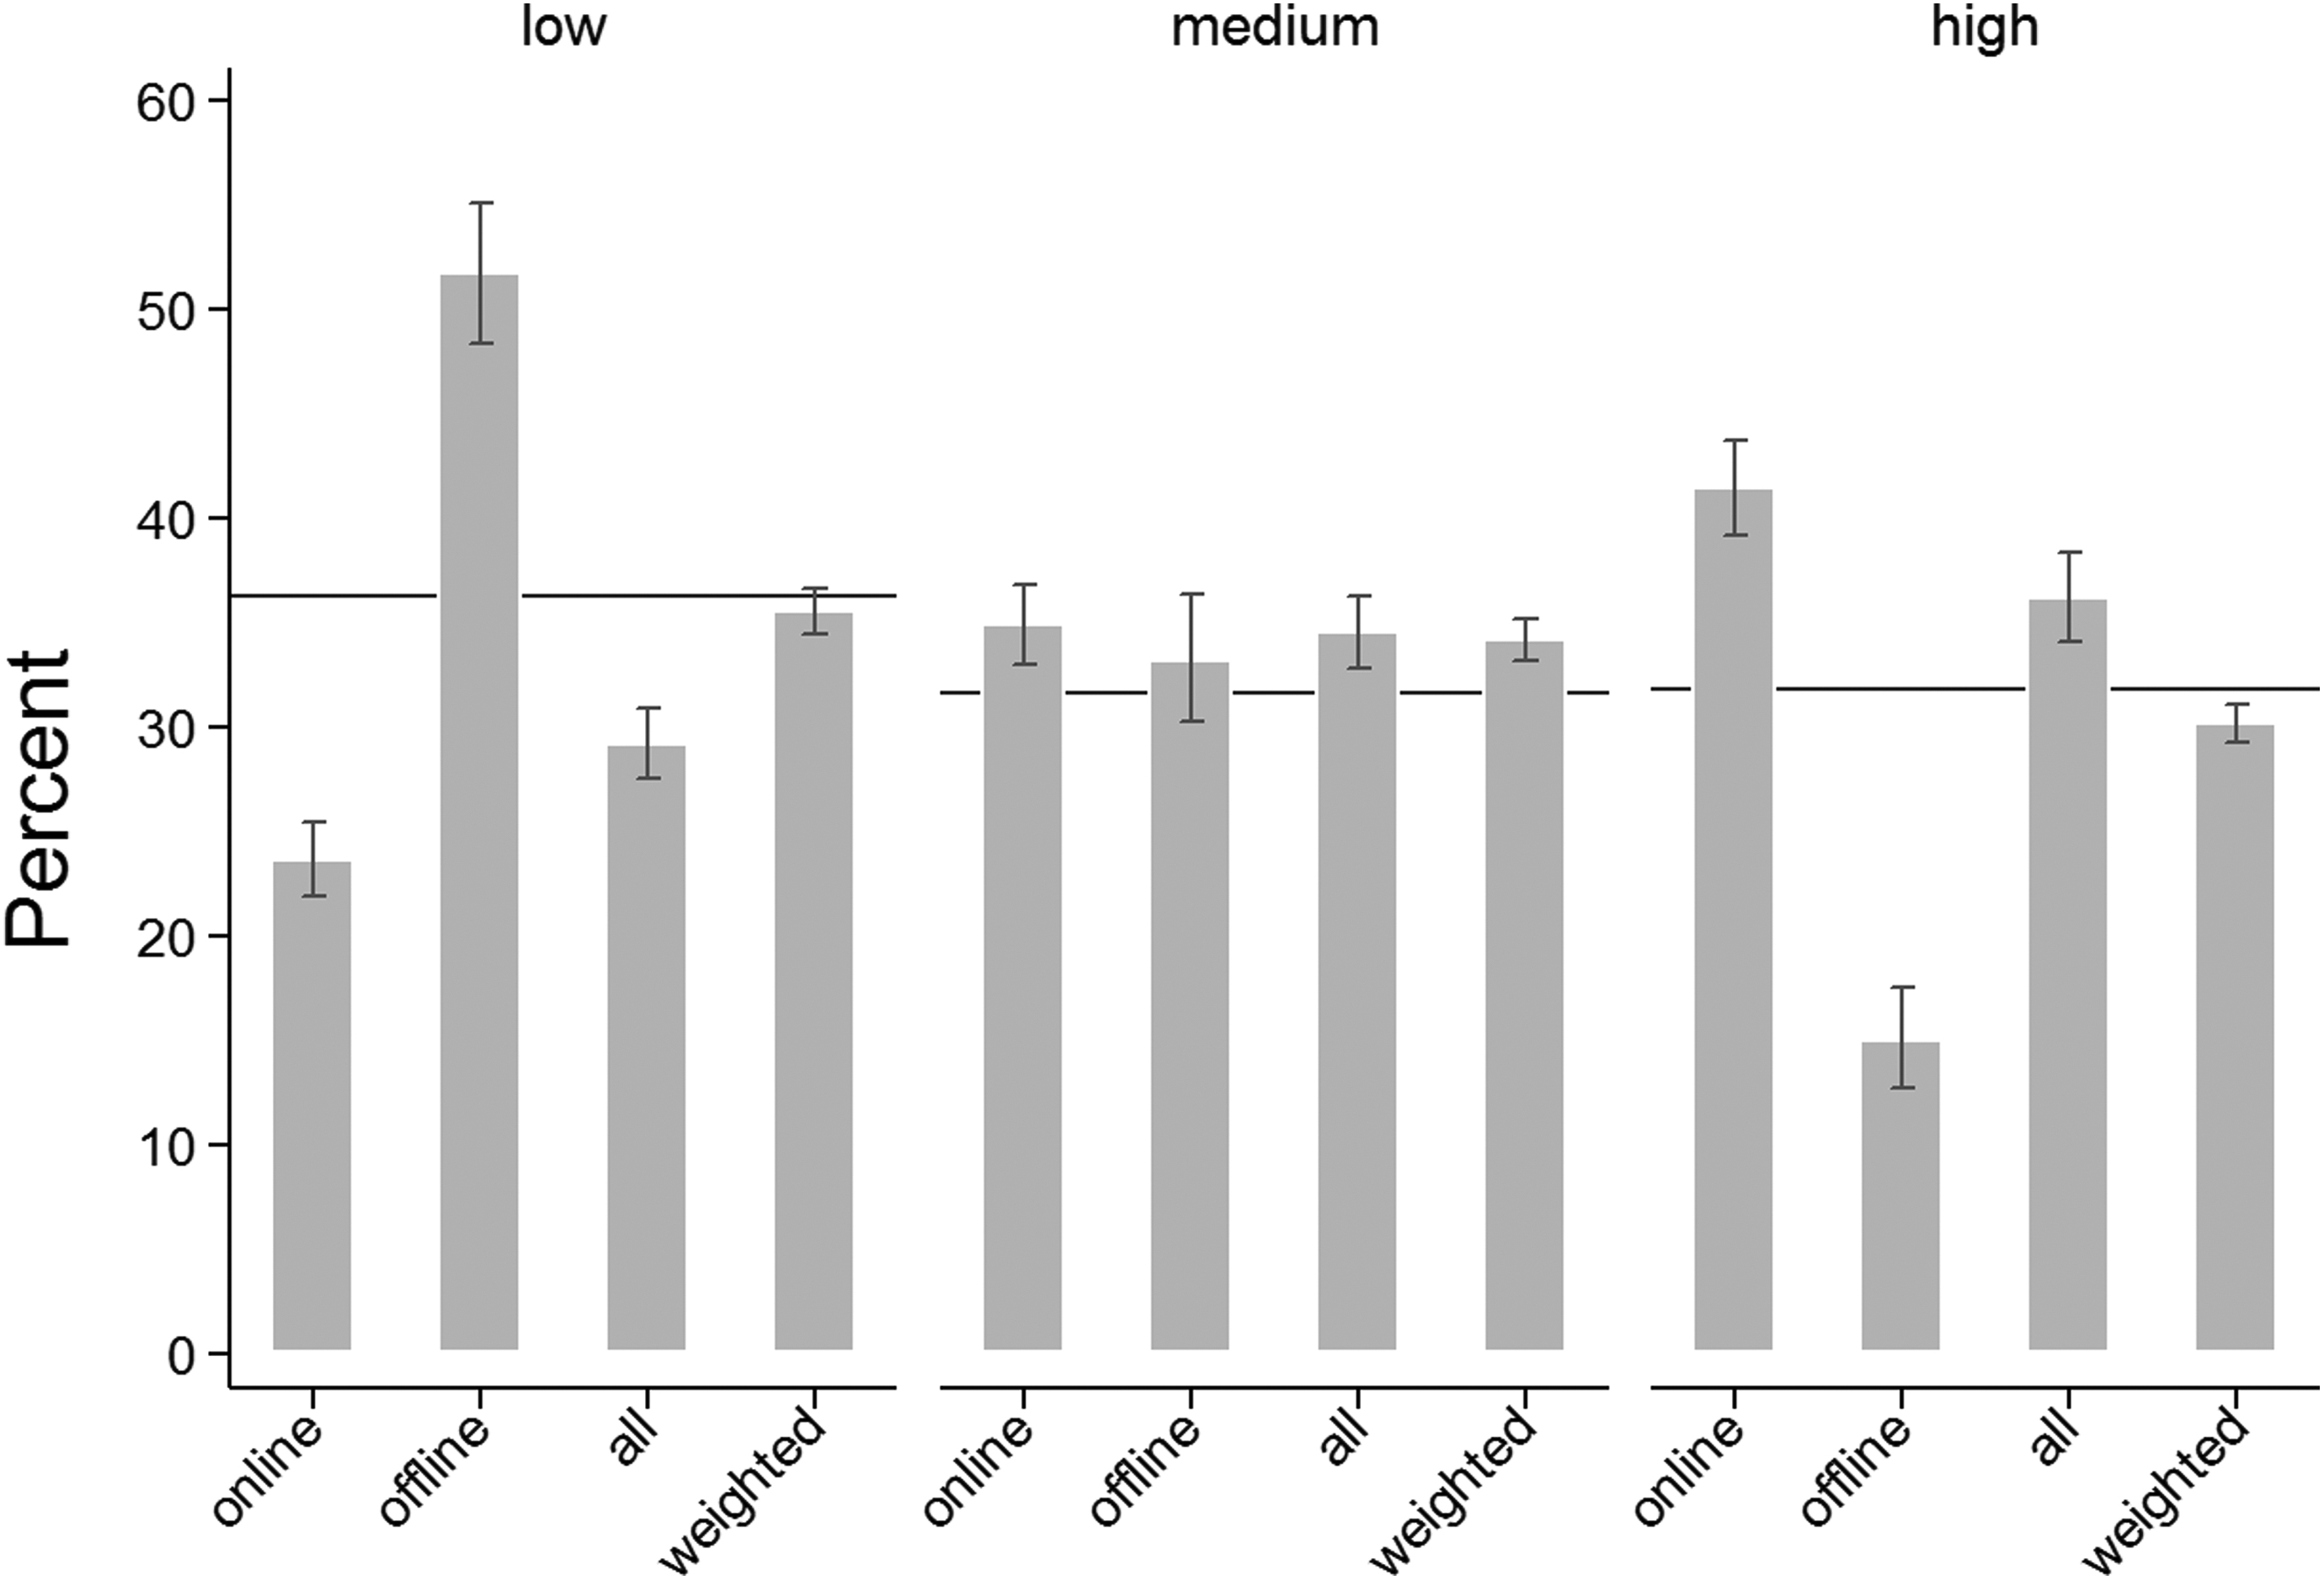
Education: population distributions (horizontal lines) and GIP sample distributions (bars).
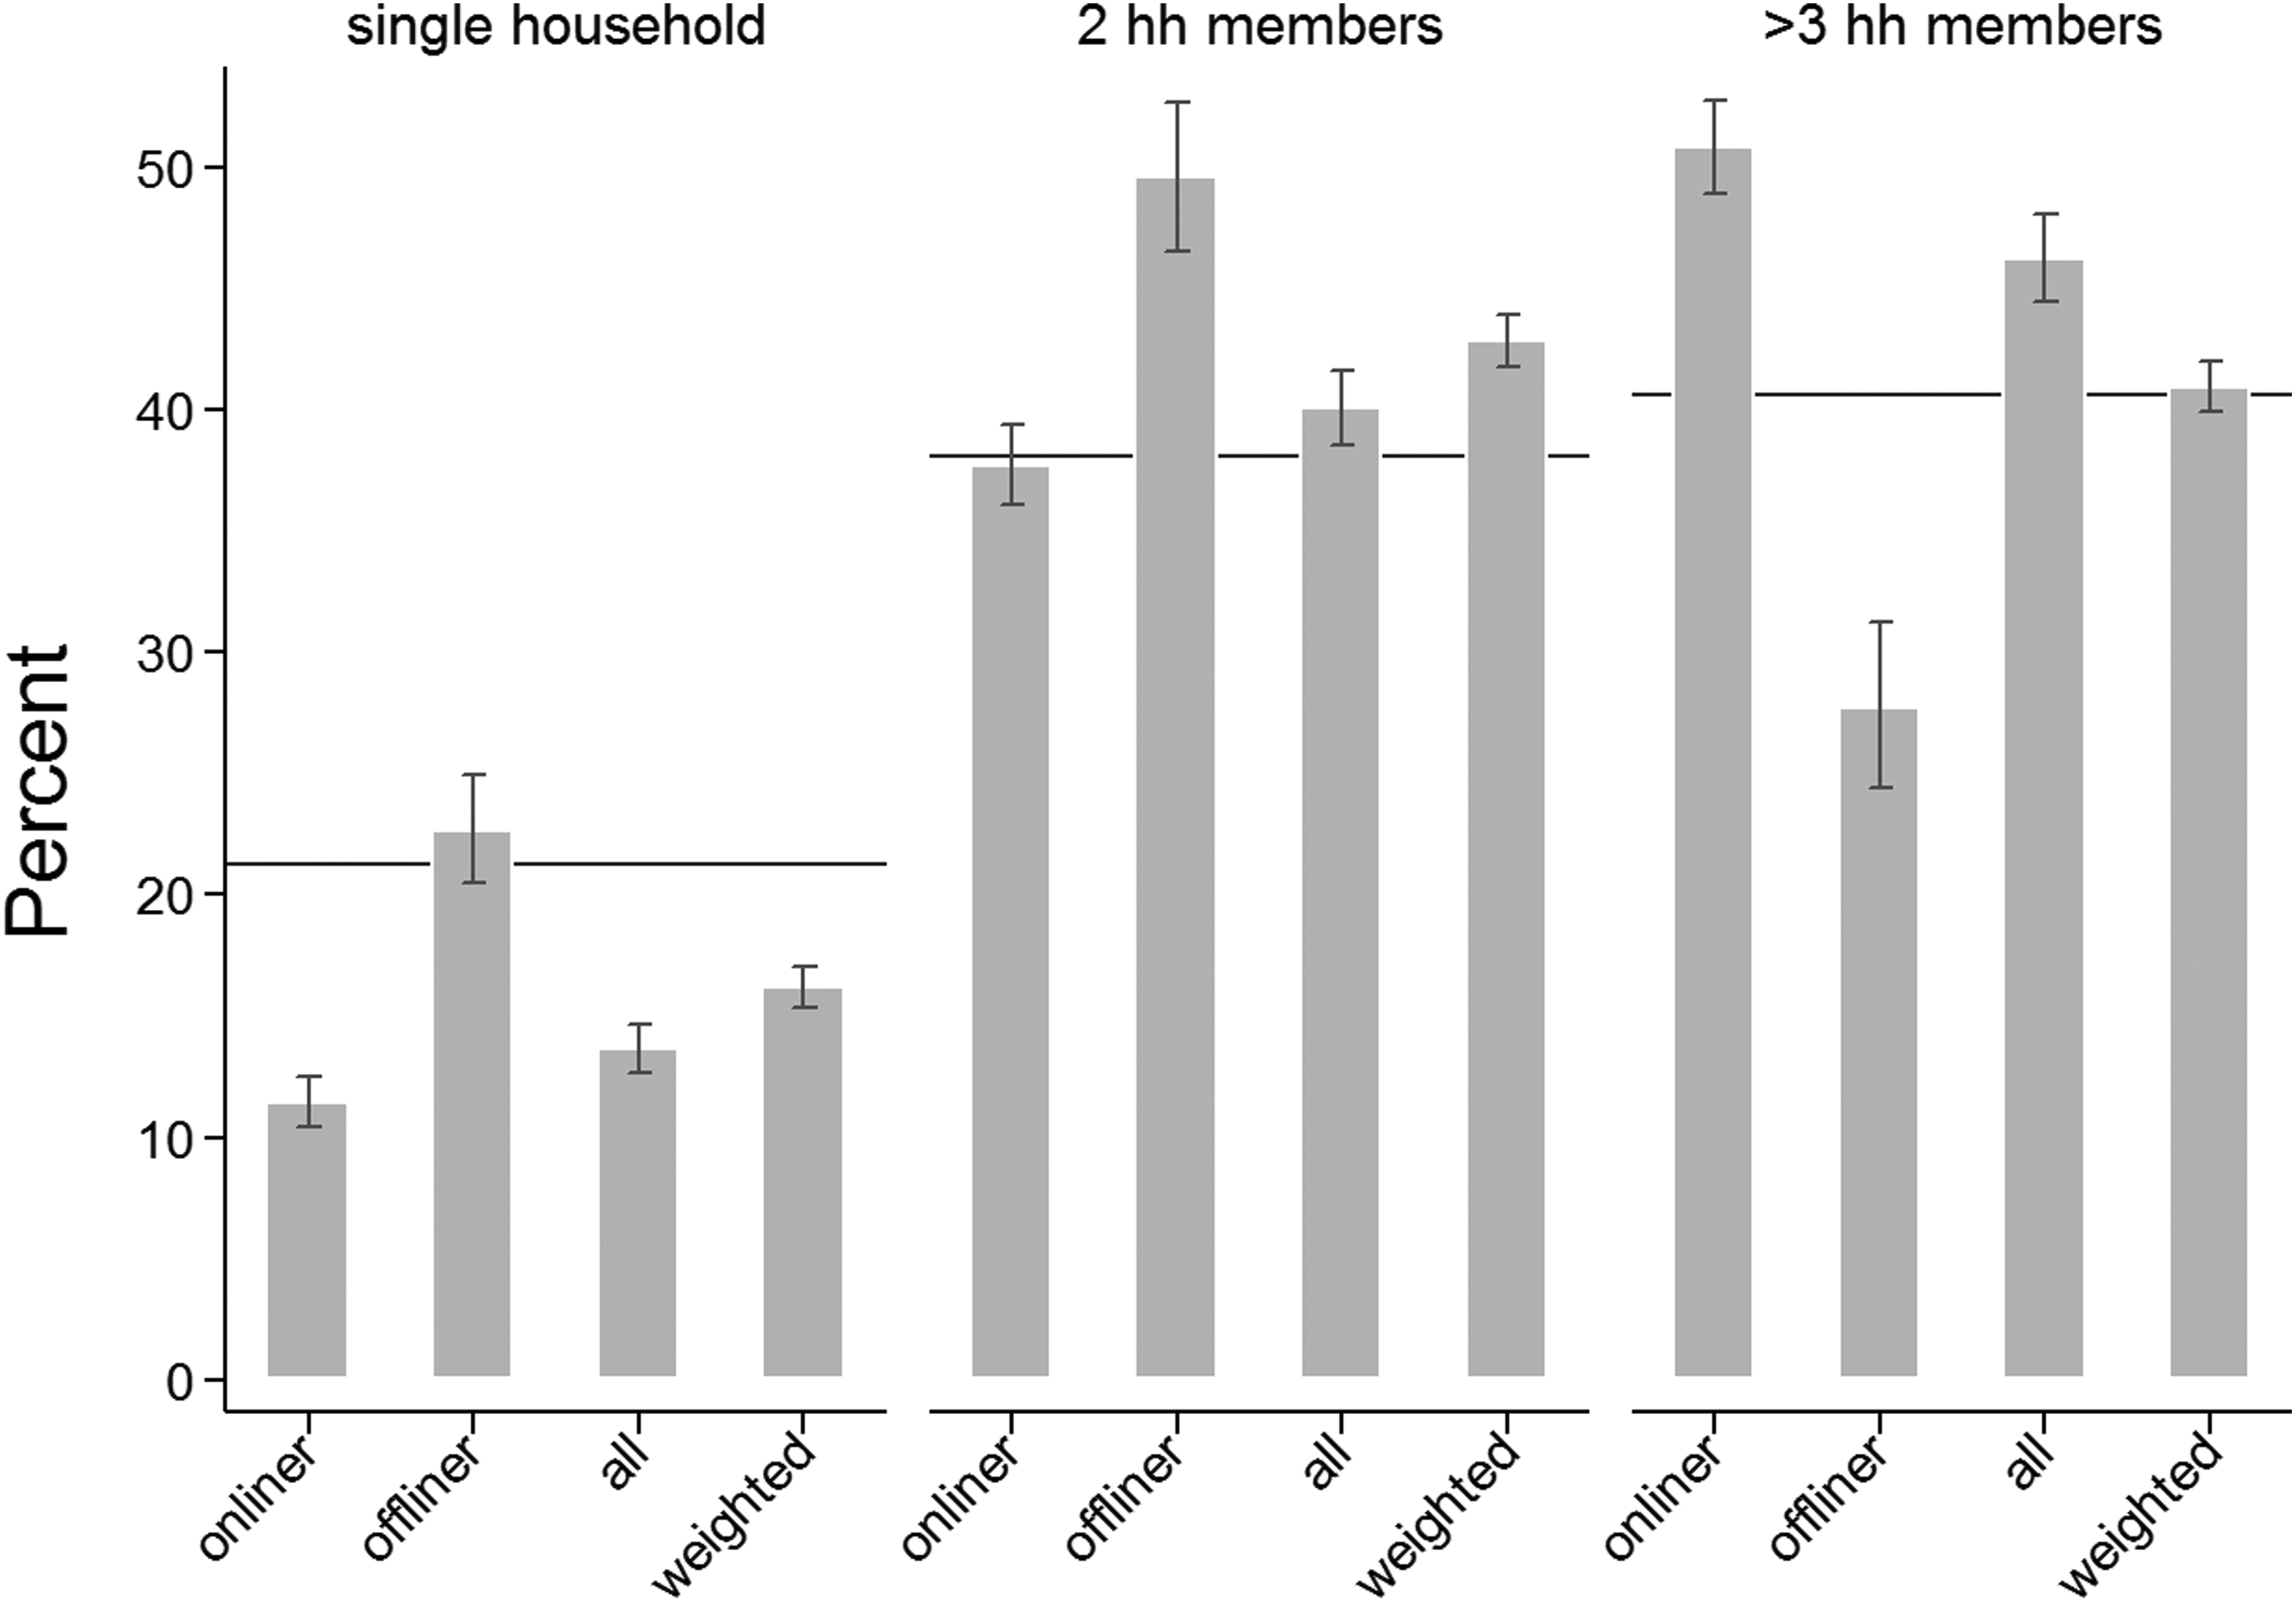
Household size: Population distributions (horizontal lines) and GIP sample distributions (bars).
Age
In Figure 5, we compare the sample distributions of four age-groups (16–30, 31–45, 46–60, and 61–75) with the respective population proportions. In the youngest and second youngest age-groups (16–30 and 31–45, respectively), the unweighted GIP sample very closely represents the population. However, a sample consisting solely of respondents with prior access to the Internet would have significantly overrepresented the youngest age-group. The low proportion of young persons among the offliners balances the sample for the youngest age-group, while the weighting results in a slightly less representative picture than the unweighted GIP sample.
Among the oldest group, the unweighted GIP sample slightly underrepresents the proportion of people aged 61–75 in Germany. However, if the sample consisted of onliners only, the sample bias among the oldest age-group would have been significantly larger. The high proportion of previously offline respondents in this group, thus, contributes significantly to the representativeness of the GIP sample. The weighted sample slightly overrepresents the oldest age-groups; however, both the unweighted and the weighted GIP sample are close to the true proportion in the oldest age-group.
For the age-group 46–60, the GIP onliners are similarly representative of the general population in Germany as the total GIP sample and the weighted total GIP sample.
Overall, countering coverage bias by equipping previously offline persons to participate in the GIP significantly benefits the sample representativeness with respect to the oldest and youngest age-groups. This is the case, despite the low response propensities of previously offline persons, thus giving a glimpse at the coverage bias, which likely affects online panels that do not include previously offline panelists.
Gender
In Figure 6, we display the proportions of males in the population and in the GIP sample. While offliners tend to underrepresent males and overrepresent females, their effect on the overall sample is marginal. As a consequence, both the overall GIP sample and the onliner subsample are representative with respect to gender.
Education
Regarding education, we find a significant contribution of the offliner recruitment to the sample representativeness. As Figure 7 shows, offliners are significantly more likely to have low education and significantly less likely to have high education than onliners. This strong contrast ensures that the overall GIP sample provides significantly better estimates of the low and high educated than the subsample of onliners. Furthermore, when weighting the total GIP sample for the difference in response propensities between offliners and onliners, the GIP is representative of the low-education group and only slightly overrepresents and underrepresents the medium and high education groups, respectively. A subsample of online panelists only, however, would strongly underrepresent the low educated and strongly overrepresent the high educated.
Household size
Figure 8 depicts the representativeness of the GIP sample regarding household size. Offliners who participate in the GIP online panel are significantly more likely to live in single or two-person households than onliners, and with respect to single households, offliners are representative of the general population. As a result, we see that the subsample of online panelists strongly underrepresents persons living in single households and strongly overrepresents persons living in households of three or more members. While the weighting for unequal recruitment propensities of offliners and onliners improves the GIP representativeness with respect to single and large households, the representativeness of two-person households decreases after weighting.
The inclusion of the offliners in the GIP improves the representativeness of single households, and the weighting contributes to the representativeness of the sample. However, the unweighted and weighted GIP sample still strongly underrepresent this population group. In households with three or more members, offliners improve the representativeness. When additionally weighting the GIP data for the unequal response propensities of offline and online sample units, the GIP data accurately represent persons living in large households.
Summary of Findings
This article investigates the representativeness of the GIP, in particular the contribution of previously offline respondents. Our research is guided by three questions: First, do onliners and offliners differ in key characteristics, which may lead to biases in substantive analyses of samples of onliners only? Second, do onliners and offliners participate in the GIP at different rates and, if so, does this introduce selectivities in the panel? Finally, how do those offliners who ultimately participate in the online panel influence the overall sample representativeness?
Regarding the first research question, we find that onliners and offliners differ significantly from each other. Onliners are younger, are more likely to be male, live in larger households and in more urban areas, are higher educated, and are more politically interested compared to offliners. These results suggest not covering offliners in an online panel will introduce biases into the sample, because this key subgroup of the general population with distinctive characteristics is left out.
Investigating the second research question, we find that offliners participate in the online panel at significantly lower rates than onliners. This effect persists over and above an age effect with older persons less likely to be recruited than younger participants. In fact, an interaction effect between being online and age shows that older offliners are the most difficult group and have the lowest response propensities. According to these results, weighting an online-only panel according to sociodemographic characteristics is unlikely to suffice to correct for nonresponse and noncoverage bias, since offliners would be missing from the panel completely. Because the GIP sample draws from the general population and thus includes offliners and onliners, it is possible to weight the sample for higher nonresponse among offliners, enabling more reasonable nonresponse bias adjustments. Our analyses show that even using a simplistic weight adjusting for unequal recruitment rates of onliners and offliners can modestly improve the representativeness of the panel. To analysts of the GIP data, however, we recommend more sophisticated weighting combining the online/offline indicator with poststratification according to known population distributions of key sociodemographic characteristics.
To investigate the third research question, we compared estimates on age, gender, education, and household size derived from the GIP sample to known population distributions, separately for onliners, offliners, all panelists, and all panelists weighted for the differential recruitment propensities of offliners and onliners. With respect to age, the inclusion of offliners resulted in a more representative sample especially in the youngest and oldest age-groups. With respect to gender, both the onliner sample and the total GIP sample were representative of the general population. With respect to education, the inclusion of offliners resulted in a more representative sample especially among the high and low educated and particularly when weighting for the lower response rates of offliners. However, the inclusion of offliners made a relatively stronger contribution to the panel’s representativeness than the weighting step. Finally, with respect to household size, the inclusion of offliners resulted in a more representative sample.
Our analyses and results are limited in a number of ways. As with most studies of coverage and nonresponse bias, auxiliary and benchmark data are limited. About half of all eligible households refused the initial face-to-fact interview (48% in 2012 and 52% in 2014), so no auxiliary information was available for these cases, when examining selectivities for recruiting online panel members from among the face-to-face interviewed households. Our benchmark data are, of course, not affected by nonresponse; however, they are limited to information on the population’s age, gender, education, and household size. Most importantly, we have no information on the political interest of sampled persons who were not interviewed face-to-face. Furthermore, we did not look at the effect of including offliners on study variables that may or may not be related to the ones we studied here. Thus, it is unclear what effect (if any) including/excluding offliners will have on the accuracy of a particular variable.
Conclusion
The past decade has seen a surge in the number of online panel surveys, particularly those in which the sample members self-select themselves into the panel. Online panels have considerable appeal in terms of cost and convenience. However, their growing popularity has sparked a debate about the representativeness of nonprobability online panels but also of online panels in general (Erens et al., 2014; Loosveldt & Sonck, 2008; Yeager et al., 2011). Regarding the representativeness of online survey data, three factors need to be considered: sampling methods, coverage (in particular with respect to computer and Internet access), and nonresponse. In this article, we have addressed the latter two aspects in the context of the probability-based face-to-face recruited GIP, a comparatively high-cost data collection, which took great care to minimize nonresponse and coverage biases.
Our results contribute to the extremely sparse, yet growing, body of literature that indicates that the exclusion of persons who do not have computers and/or Internet at home produces significant coverage biases, and the inclusion of these offliners in the sample improves the representativeness of the survey despite their lower propensity to respond (Leenheer & Scherpenzeel, 2013; Revilla et al., 2015). These findings appear to be robust across European countries, including the Netherlands, France, and now Germany.
Furthermore, our analyses show that adjusting for differential nonresponse propensities between offliners and onliners made a relatively small contribution to the representativeness of the panel compared to the inclusion of previously offline persons. This suggests that the higher proportion of nonrespondents among the offliners is largely unproblematic, as long as significant effort was made to recruit offliners into the online panel. Future research will look into optimal weighting strategies for the GIP data, combining standard sociodemographic indicators with information about computer and Internet access to ensure that bias due to offliner nonresponse for analyses based on GIP data is minimized.
While the inclusion of offliners into the online panel improved the representativeness of the probability-based GIP, this is not to say that all would be well if nonprobability online panels simply recruited some offliners into their sample. Such an initiative might reduce coverage bias the way it has in the GIP; however, the effect of nonprobability sampling methods on representativeness is not accounted for by offliner inclusion. In future research, we hope to further decipher the relative contribution to representativeness in online panels of sampling methods, nonresponse, and coverage.
Footnotes
Appendix
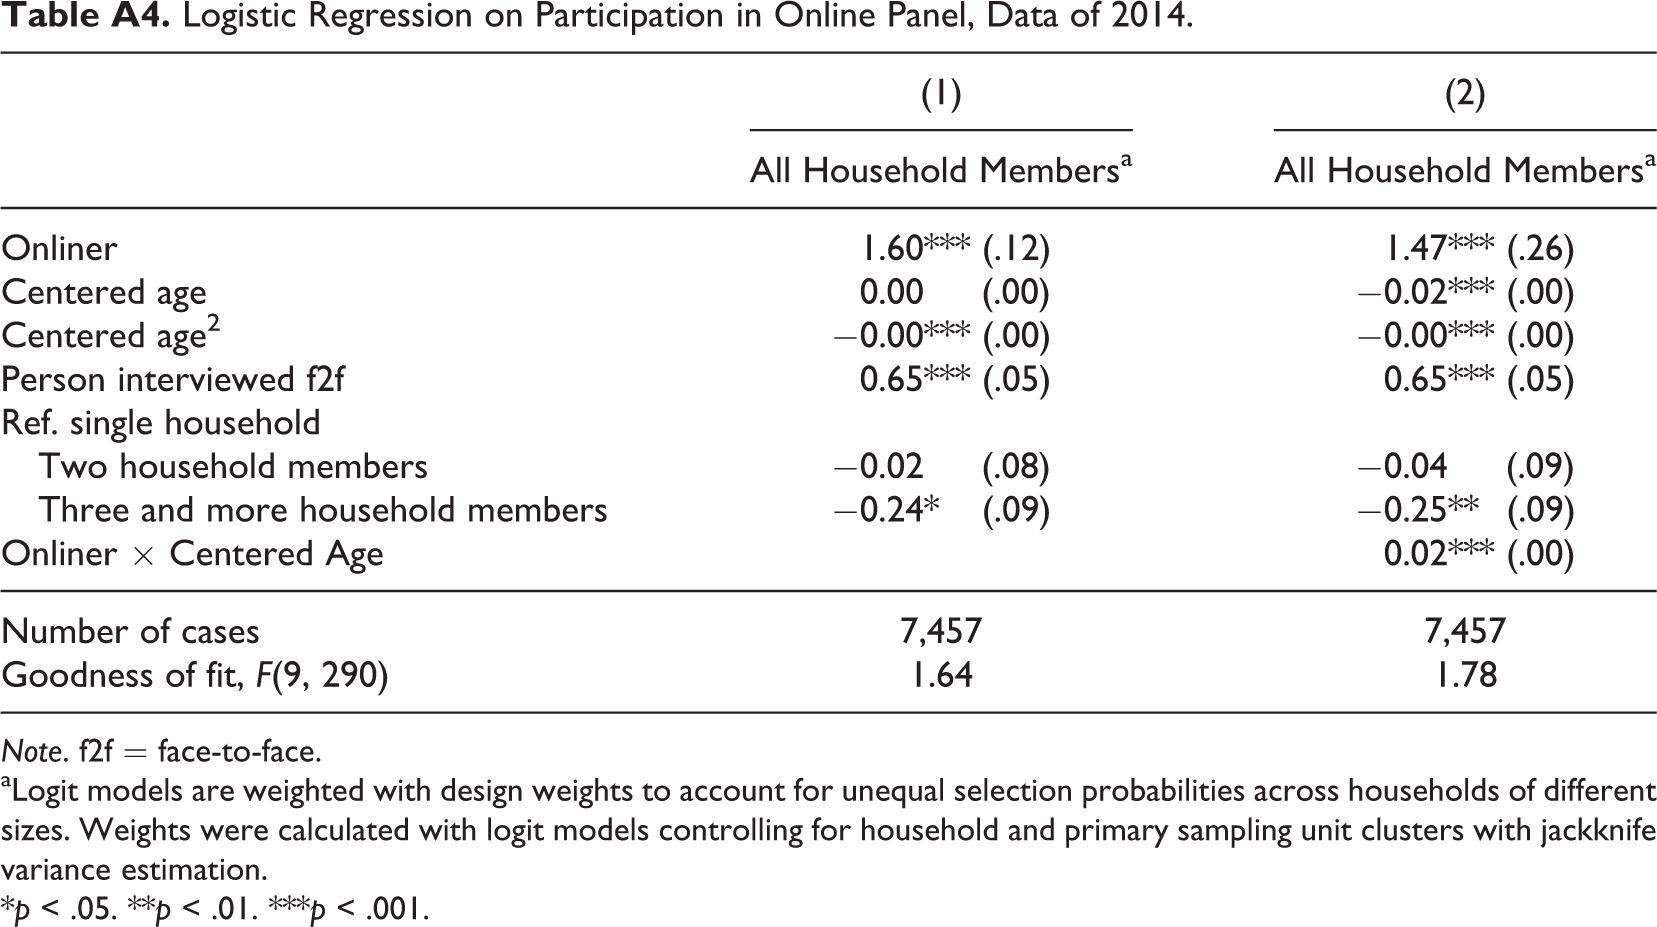
Logistic Regression on Participation in Online Panel, Data of 2014.
| (1) | (2) | |
|---|---|---|
| All Household Membersa | All Household Membersa | |
| Onliner | 1.60*** (.12) | 1.47*** (.26) |
| Centered age | 0.00 (.00) | −0.02*** (.00) |
| Centered age2 | −0.00*** (.00) | −0.00*** (.00) |
| Person interviewed f2f | 0.65*** (.05) | 0.65*** (.05) |
| Ref. single household | ||
| Two household members | −0.02 (.08) | −0.04 (.09) |
| Three and more household members | −0.24* (.09) | −0.25** (.09) |
| Onliner × Centered Age | 0.02*** (.00) | |
| Number of cases | 7,457 | 7,457 |
| Goodness of fit, F(9, 290) | 1.64 | 1.78 |
Note. f2f = face-to-face.
aLogit models are weighted with design weights to account for unequal selection probabilities across households of different sizes. Weights were calculated with logit models controlling for household and primary sampling unit clusters with jackknife variance estimation.
*p < .05. **p < .01. ***p < .001.
Declaration of Conflicting Interests
The authors declared no potential conflicts of interest with respect to the research, authorship, and/or publication of this article.
Funding
The authors disclosed receipt of the following financial support for the research, authorship, and/or publication of this article: The German Internet Panel is the central data collection (project Z1) of Collaborative Research Center 884 "Political Economy of Reforms" (SFB 884) at the University of Mannheim and is funded by the German Research Foundation (DFG).