
Abstract
Computational Public Opinion Measurement (CPOM) uses natural language processing and machine learning to infer public attitudes from social media. However, the methodological foundations and validity constraints of CPOM remain inadequately documented. This systematic literature review examines the computational methods, sentiment representations, and measurement strategies employed in CPOM research, and identifies the structural and methodological limitations that constrain CPOM as an approach to measurement. This systematic review (PRISMA, 2020) searched seven databases, identifying 56 studies from 5,108 records (2008–2025). Methods shifted substantially across eras: lexicon-based approaches declined from 77.8% (2011–2015) to 28.6% (2021–2025) while deep learning grew from 0% to 40.0%. Despite this technical evolution, empirical validation remains rare. Only 11 of 56 studies (19.6%) computed a quantitative statistic against an external benchmark such as a survey or poll. In other words, methodological sophistication and validation rigour moved in opposite directions: none of the 14 deep learning studies computed a quantitative validation statistic, while all 11 that did used lexicon-based or classical machine learning. The broader field shows an even larger gap: 49.4% of all full-text-assessed papers were excluded for providing no external validation or representativeness analysis at all. The recognition-action gap widened over time: TSE awareness grew from 44.4% to 80.0% across eras while quantitative validation rates fell from 33% to 11%, showing that growing awareness has not translated into action. CPOM must move beyond technical sophistication toward systematic criterion validation, demographic adjustment, and transparent reporting.
Keywords
Introduction
Background
Social media platforms generate vast amounts of text that may reflect how people think and feel about public issues. This has prompted researchers to develop Computational Public Opinion Measurement (CPOM): the use of automated text analysis and machine learning to infer public attitudes from social media posts at scale. Traditional public opinion measurement relies on structured surveys with carefully designed samples. A widely used framework for understanding the quality of such estimates is the Total Survey Error (TSE) framework, which catalogues the sources of error that can distort survey-based inferences (Groves et al., 2009). CPOM offers advantages in speed, cost, and temporal resolution, but raises distinct questions: do social media users represent the broader public, do automated sentiment tools capture what they claim to measure, and does online expression reflect underlying attitudes at all (Schober et al., 2016; Sen et al., 2021)? Despite this, practitioners in political forecasting, public health surveillance, and policy analysis have adopted CPOM methods as real-time alternatives to expensive polling (Beauchamp, 2017; Lazer et al., 2020; Tumasjan et al., 2010). If such methods lack adequate criterion validity, the inferences they support may be misleading, with potential implications for how public opinion is interpreted in political and policy contexts. Systematic documentation of CPOM’s methodological landscape and validation practices remains limited. This review addresses that gap.
The use of social media for public opinion measurement has expanded rapidly over the past 15 years. Researchers have applied computational sentiment analysis to political discourse and election forecasting (O'Connor et al., 2010; Tumasjan et al., 2010; DiGrazia et al., 2013; Beauchamp, 2017), to public health and crisis communication (Diaz et al., 2016; Cody et al., 2016), and to commercial brand and policy monitoring (Kalampokis et al., 2013; Anstead & O'Loughlin, 2015). Across these domains, the underlying premise is that aggregated patterns of online expression can substitute for, or meaningfully complement, structured survey-based measurement (Schober et al., 2016). The appeal is straightforward. Social media data are produced at scale and in near real time, can be collected at low marginal cost, and capture spontaneous expression rather than answers elicited by an interviewer (Beauchamp, 2017; Lazer et al., 2020). For researchers facing falling survey response rates, lengthening fieldwork times, and rising data-collection costs, these properties are attractive.
Whether the resulting measures actually capture public opinion remains contested. Empirical comparisons of social media analyses with survey data have produced mixed results: some have found notable alignment in specific contexts (O'Connor et al., 2010; Beauchamp, 2017), while others have shown that social media measures do not consistently track survey measures or predict social phenomena (Kim et al., 2013; Schober et al., 2016). Methodological critics have argued that the social media user base is systematically unrepresentative of the general population, that platforms reshape rather than reveal expression, and that sentiment-analysis pipelines are sensitive to apparently minor design choices (Ruths & Pfeffer, 2014; Schober et al., 2016; Tufekci, 2014). Two strands of critique are particularly relevant for the present review and motivate its design.
Two methodological critiques anticipated the concerns this review takes up. Gayo-Avello (2013), in a synthesis of Twitter-based election prediction studies, showed that most studies had failed to predict outcomes accurately and that favourable reports often relied on post-hoc adjustments, selective reporting, and inconsistent definitions of predictive success (see also Metaxas et al., 2011). Jungherr and colleagues (Jungherr, 2015; Jungherr et al., 2012) demonstrated that small variations in study design, such as keywords, time windows, sentiment dictionaries, and aggregation procedures, could shift predicted outcomes enough to flip electoral verdicts, casting doubt on the robustness of the underlying pipelines. Both critiques converge on a single concern: that the rapid growth of CPOM has not been matched by comparable growth in validation rigour. Whether subsequent methodological developments have closed this gap, or merely absorbed more technical complexity around it, is the central empirical question this review takes up.
Research Questions
This review addresses three questions. First (RQ1), what computational methods and sentiment representations do researchers employ in CPOM studies? Second (RQ2), how do researchers validate CPOM measures against established survey-based opinion measures? Third (RQ3), what methodological limitations do researchers acknowledge, and to what extent do they address these limitations in their research designs?
Position of This Review in Existing Literature
Prior reviews of social media-based opinion measurement reveal a clear progression in how the validation problem has been understood, but also an unaddressed gap that motivates the present review. Early empirical assessments focused narrowly on electoral prediction from Twitter and treated methodological flaws as fixable problems in individual studies. Gayo-Avello’s (2013) meta-analysis quantified per-study prediction error and documented widespread methodological flaws, while contemporaneous narrative syntheses (Ceron et al., 2014) cataloged the sensitivity of results to method choice. Both treated validation failure as a study-design issue rather than a structural feature of the field.
A second wave reframed the problem at the framework level. Schober et al. (2016) compared social media measurement against surveys and identified fundamental differences in activity understanding, representation, and data access. Hsieh and Murphy (2017) consolidated these observations into the Total Twitter Error framework, and Sen et al. (2021) generalised the approach to digital traces broadly, adding algorithmic curation and construct ambiguity to the error taxonomy. This shift was conceptually decisive: it located the validation problem not in the choices of individual researchers but in the structural relationship between social media data and population-level opinion. Its limitation, however, was empirical scope. These contributions were conceptual frameworks rather than systematic audits of how published CPOM research actually performed against the standards they articulated.
Subsequent meta-analyses broadened the empirical evidence base but inherited the earlier narrow framing. Skoric et al.'s (2020) meta-analysis of Facebook-based election forecasting quantified average performance across 74 studies, finding moderate but highly variable predictive accuracy. The synthesis remained domain-specific (electoral forecasting on a single platform) and treated validation as a question about a method’s predictive yield rather than about whether the underlying measure captures public opinion at all. Across the full corpus of prior reviews, three patterns persist: early empirical work documented but did not theorise the validation problem, framework-articulating work did not audit the literature against its own standards, and domain-specific meta-analyses did not generalise beyond their particular forecasting tasks.
The present review addresses this gap. It applies a validation-engagement inclusion criterion (IC3) to a corpus spanning 2008-2025 across platforms and substantive domains, then uses the TSE framework as the analytical lens for the included studies. This combination does what the framework-articulating reviews advocated but did not perform, and it broadens the empirical lens beyond the electoral forecasting focus that has dominated meta-analytic work. Three diagnostic findings emerge from this design: a field-level validation deficit visible in the full-text exclusion statistics, a TSE recognition-action gap in which awareness of TSE concerns grew across eras while quantitative validation rates fell, and a method-sophistication paradox in which the most technically advanced approaches (deep learning) were the least likely to compute a quantitative validation statistic against an external benchmark.
Background and Theoretical Foundations
Terminology and Conceptual Foundations
Public opinion refers to aggregated population attitudes on matters of public concern, traditionally measured through representative surveys (Zaller, 1992). Online expression is the text individuals produce on social media: spontaneous, self-selected, and shaped by platform context rather than standardised questioning (Hsieh & Murphy, 2017). CPOM uses automated text analysis, primarily sentiment analysis, to infer attitudes from this data at scale. The central question is whether online expression validly represents public opinion, which requires both theoretical justification and empirical validation.
The Total Survey Error Framework
The TSE framework (Groves et al., 2009) decomposes data quality into two dimensions: measurement accuracy (does the instrument capture the intended construct?) and representation (does the data used in the analysis reflect the target population?). Schober et al. (2016) were among the first to apply this framework to social media data, demonstrating that social media users differ from survey respondents in how they understand the activity they are engaged in, who is represented, and how researchers can access their data. Hsieh and Murphy (2017) extended this analysis under the label of “Total Twitter Error,” identifying severe coverage, measurement, and representation errors inherent to Twitter-based opinion research. Sen et al. (2021) further generalised the TSE framework to digital traces broadly, emphasising algorithmic curation and construct ambiguity as additional error sources. Conrad et al. (2021) showed empirically that this alignment is achievable under carefully controlled conditions, though it requires substantial calibration effort.
These foundational studies establish that CPOM faces challenges on both TSE dimensions. Social media posts are performative and audience-aware, not standardised responses (Hsieh & Murphy, 2017). Sentiment algorithms misclassify sarcasm and irony, a limitation well-documented in the NLP literature (Pang & Lee, 2008). Twitter/X users are younger, more educated, and more politically engaged than the general population (Sen et al., 2021), yet CPOM has no sampling frame and cannot estimate coverage or nonresponse bias. Most CPOM research addresses measurement accuracy while neglecting representation, the dimension with the most severe validity implications (Schober et al., 2016; Sen et al., 2021).
Without systematic criterion validation, CPOM cannot demonstrate that its measures capture public opinion rather than platform-specific discourse patterns or the behaviour of unrepresentative users. Conrad et al. (2021) show that such validation is achievable but demanding: alignment with survey data requires careful temporal matching, construct specification, and bias correction. Validation against surveys or electoral outcomes remains the primary available standard (Schober et al., 2016).
Methods
Review Protocol
This review followed PRISMA 2020 guidelines (Page et al., 2021); all methodological decisions are documented in Appendix A.
Search Strategy
We conducted systematic searches across seven academic databases: Web of Science, Scopus, IEEE Xplore, ACM Digital Library, PubMed, arXiv, and Google Scholar. The inclusion of arXiv and Google Scholar was justified by the rapid pace of methodological innovation in computational social science, where preprints often precede peer-reviewed publication substantially; arXiv papers were included only if they demonstrated equivalent methodological rigour (clearly described methods, at least one form of external validation, and explicit discussion of limitations). Google Scholar was searched to capture conference proceedings and grey literature not indexed by the five primary databases. The primary search was conducted in early 2026 with December 2025 as the inclusion cutoff. January 2008 was selected as the start date because it corresponds to the first wave of academic research applying sentiment analysis to social media data following Twitter’s emergence as a major platform for public discourse.
The following search string was applied across all databases, adapted as needed for each database’s specific syntax: (“sentiment analysis” OR “opinion mining” OR “natural language processing” OR “computational linguistics” OR “text mining”) AND (“social media” OR “Twitter” OR “X” OR “Facebook” OR “Reddit” OR “Instagram” OR “YouTube” OR “TikTok” OR “LinkedIn” OR “Weibo” OR “online platform” OR “microblogging”) AND (“public opinion” OR “political attitude” OR “public sentiment” OR “opinion measurement”).
Inclusion and Exclusion Criteria
Studies were included if they met all four of the following criteria. (IC1) The study employed computational methods, including natural language processing, machine learning, lexicon-based sentiment scoring, or deep learning, applied to social media data. (IC2) The study aimed primarily to measure, track, or predict public opinion or political attitudes on a substantive political or social topic. (IC3) The study either compared its social media-derived measures to an external benchmark, such as a survey, opinion poll, electoral outcome, or approval rating, or explicitly engaged with representativeness, demographic bias, or population validity in its methods, results, or limitations. (IC4) The study presented original empirical analysis and was published in a peer-reviewed journal, conference proceedings, doctoral dissertation, or quality-screened arXiv preprint between January 2008 and December 2025. Criterion IC3 was the operationally decisive criterion: studies that conducted computational sentiment analysis without any engagement with validation or representativeness were excluded regardless of their technical sophistication.
Studies were excluded if they: (EX1) focused solely on method development; (EX2) analysed sentiment for commercial or marketing purposes; (EX3) used social media for non-opinion tasks (bot detection, hate speech, rumour tracking); or (EX4) were reviews or editorials without original data. Across both screening stages in total, 1,090 studies were excluded for failing IC3, a count that itself documents the field-level validation deficit.
Study Selection Process
The study selection process followed a three-stage screening procedure. Stage 1 (database search and date filtering): Initial searches yielded 5,108 records across the seven databases. After removing 36 records outside the 2008–2025 date range, 5,072 unique records remained for title and abstract screening. Stage 2 (title and abstract screening): Each record was screened against all inclusion and exclusion criteria. Records were excluded for: no identifiable computational method or social media platform (IC1; n = 565); topic not a qualifying political or social issue (IC2; n = 2,407); no validation signal or representativeness discussion detectable in abstract (IC3; n = 965); commercial or financial topic (EX2; n = 304); social media data used for non-opinion purpose such as bot detection or information diffusion (EX3; n = 431); review or meta-analysis without original data (EX4; n = 117); and ineligible publication type (IC4; n = 22). A total of 261 records advanced to full-text review. Stage 3 (full-text review): Of the 261 records, three were identified as cross-database duplicates and five were not retrievable (EX6), leaving 253 full texts assessed against all criteria. Full-text exclusions included: no external validation or representativeness analysis in the body of the paper (IC3; n = 125), no substantive public opinion focus in the body despite a relevant abstract (IC2; n = 40), review paper without original data (EX4; n = 7), non-opinion social media purpose confirmed in full text (EX3; n = 2), commercial or financial topic confirmed (EX2; n = 2), and full text not retrievable after multiple attempts (EX6; n = 21). A total of 56 studies met all inclusion criteria and were included in the final synthesis. Figure 1 presents the PRISMA 2020 flow diagram. The 125 full-text IC3 exclusions (49.4% of assessed papers) document the validation deficit directly: these are studies that measured social media sentiment on political topics but provided no external benchmark comparison. Prisma 2020 flow diagram.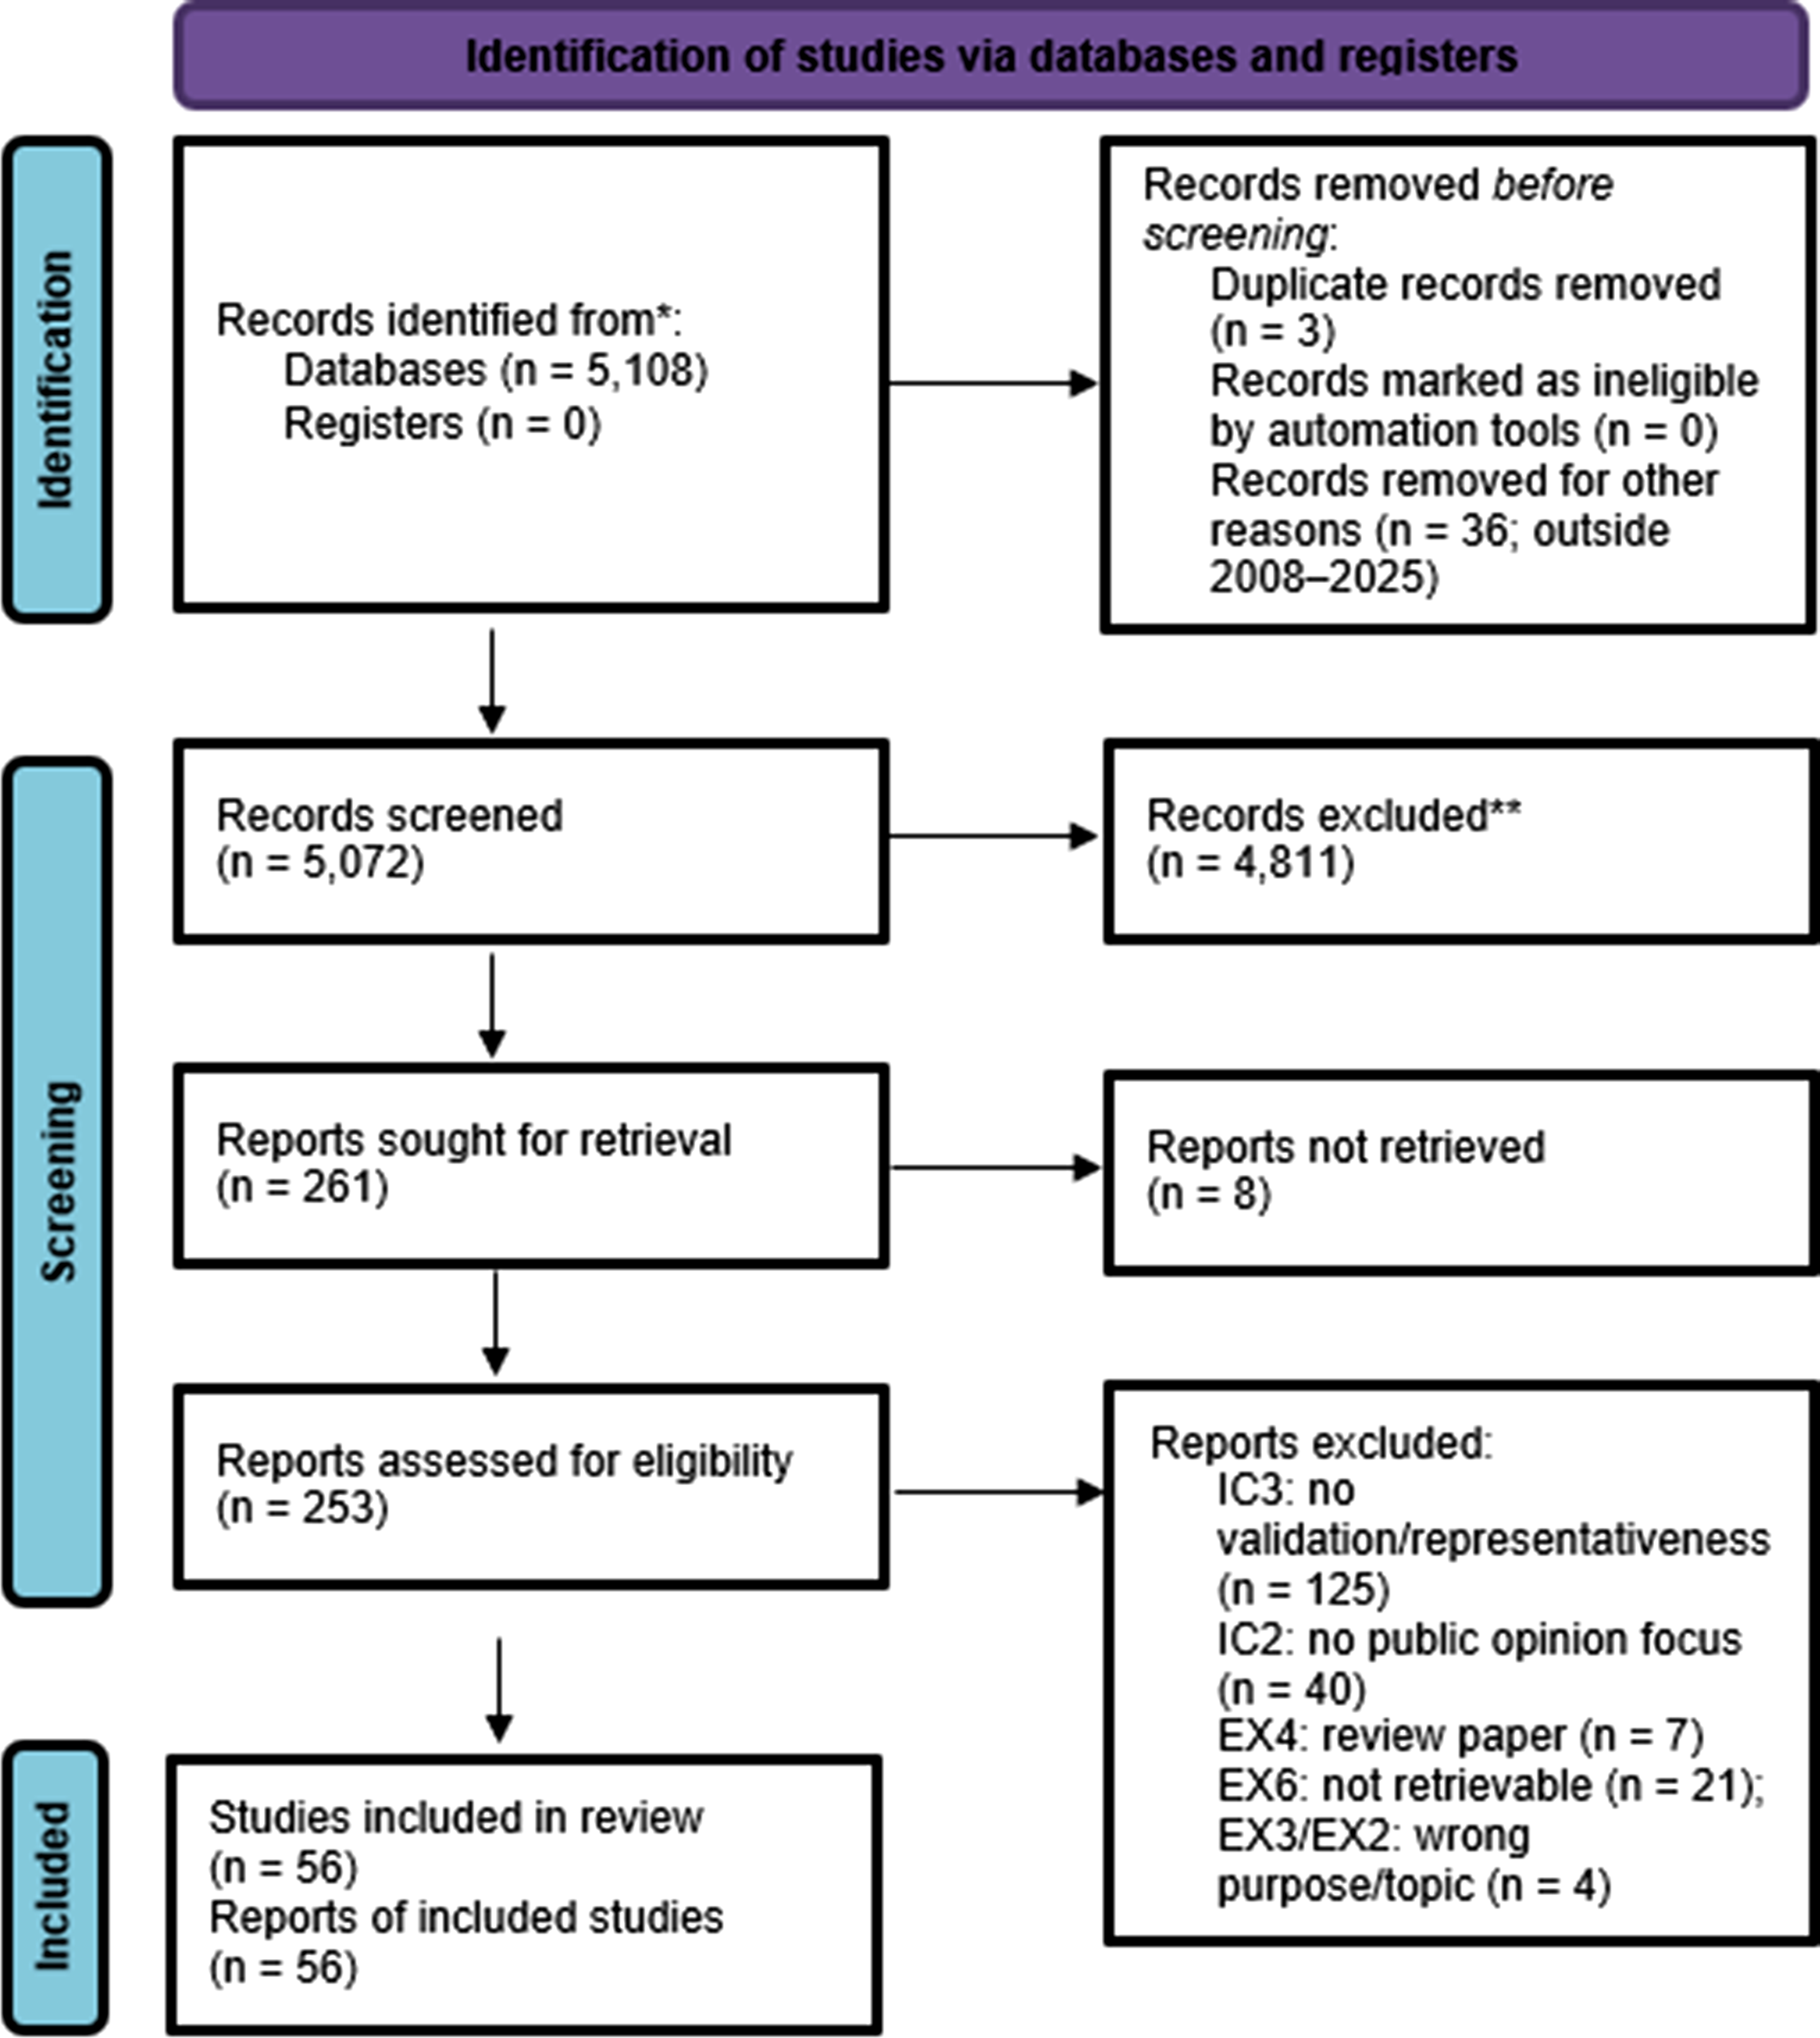
Single-Coder Approach: Justification and Safeguards
All screening and data extraction were conducted by a single reviewer. This decision was made due to resource constraints and is acknowledged as a limitation of this review. Empirical evaluations of single-coder screening have found that reviewers miss a median of 3–5% of relevant studies, and in many cases, missed studies do not substantively alter meta-analytic conclusions (Waffenschmidt et al., 2019). Single-coder approaches are considered acceptable in rapid reviews and systematic reviews with limited resources, provided that: the reviewer is experienced, rigorous procedural safeguards are implemented, and the limitation is transparently reported (Gartlehner et al., 2020). Nelson et al. (2025) identify coding manuals, pilot testing, and intrarater reliability checks as the key safeguards for single-coder reviews.
To mitigate single-coder risk, four safeguards were applied. First, a detailed coding manual was developed and refined through pilot testing on 10% of studies (n = 7), operationalising all inclusion criteria and decision rules (Appendix A). Second, borderline cases were flagged and documented during screening. Third, intrarater reliability was assessed by re-coding 10 randomly selected studies 1 week after initial coding, yielding 95% agreement on categorical variables. Fourth, the full coding manual is provided as Appendix A to enable independent replication.
Data Extraction and Quality Assessment
Data were extracted using a standardised form covering study characteristics (authors, year, venue, geographic focus, substantive topic), methodological characteristics (computational method, platform, sample size, time period), sentiment representation (classification scheme, aggregation approach), validation procedures (type, data source, reported metrics), and limitation recognition and action (limitations acknowledged, actions taken).
Study quality was assessed using a custom rubric adapted from systematic review guidelines for observational studies. The rubric evaluated three dimensions: (1) methodological rigour (0–3 points); (2) measurement validity (0–3 points); and (3) limitation recognition (0–3 points). Scores were summed to create an overall quality score ranging from 0 to 9. Studies scoring 7–9 were classified as high quality, 4–6 as moderate quality, and 0–3 as low quality. Quality scores were used descriptively to characterise the evidence base but did not determine inclusion or exclusion.
Qualitative synthesis included thematic analysis of limitation discussions and narrative synthesis organised around the three research questions. The recognition-action gap was calculated as the share of studies acknowledging a limitation but taking no action to address it.
Results
Study Selection and Characteristics
The three-stage screening process described in Section 3.4 yielded 56 included studies from 5,108 initial records.
Temporal and Geographic Distribution
The 56 included studies were published between 2011 and 2025. Their temporal distribution across the three eras was as follows: nine studies (16.1%) were published in 2011 to 2015, 12 studies (21.4%) in 2016 to 2020, and 35 studies (62.5%) in 2021 to 2025. The absence of pre-2011 studies reflects the IC3 criterion: early CPOM work (2008–2010) rarely compared social media sentiment to external benchmarks, and such studies were therefore excluded. The concentration in 2021–2025 (62.5%) reflects both the growth of CPOM as a field and increasing engagement with validation requirements following methodological critiques from Gayo-Avello (2013), Jungherr et al. (2017), and others.
Geographic focus varied substantially across the 56 included studies. Geographic focus was coded based on the location of the data or population studied, not the institutional affiliation of the authors. North America accounted for 19 studies (33.9%), Europe for 16 studies (28.6%), Asia for 12 studies (21.4%), Latin America for seven studies (12.5%), and Africa for two studies (3.6%). Compared to prior CPOM reviews, this corpus shows greater geographic diversity, with Asian and Latin American studies more prominently represented. This shift reflects the broadening of CPOM research beyond Anglophone and European contexts. The underrepresentation of Africa and limitations of English-language inclusion criteria remain important caveats.
Substantive Topics
Politics and elections was the dominant substantive focus, comprising 36 studies (64.3%). Public health topics, principally vaccine sentiment, COVID-19 attitudes, and mental health discourse, were covered by six studies (10.7%). Social issues such as immigration attitudes, police sentiment, and autonomous vehicle acceptance accounted for five studies (8.9%). Policy-focused studies addressing topics including Universal Basic Income, speed regulations, and menu labelling comprised four studies (7.1%). Environmental topics (Three Gorges Dam opinion, bioplastics discourse, climate change framing) comprised three studies (5.4%), and economic topics (economic indicators, banking opinion) comprised two studies (3.6%). The dominance of political and electoral topics reflects the strong selection pressure of the IC3 criterion: electoral outcomes provide a natural, readily available external benchmark for validation, making electoral CPOM studies disproportionately likely to survive screening. Researchers working on non-electoral topics face a higher burden of proof to pass IC3, which may partly explain the relative scarcity of environmental and economic CPOM studies in this corpus.
RQ1: Computational Methods and Sentiment Representations
Evolution of Computational Methods
Distribution of Computational Methods Across Eras
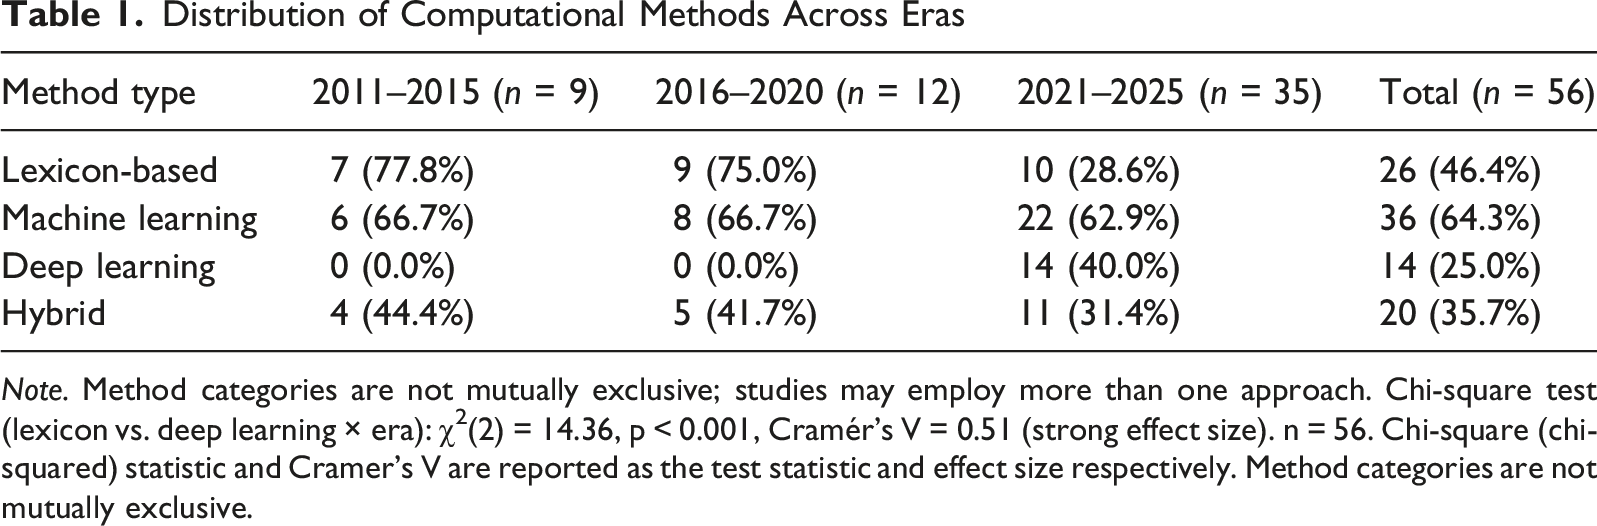
Note. Method categories are not mutually exclusive; studies may employ more than one approach. Chi-square test (lexicon vs. deep learning × era): χ2(2) = 14.36, p < 0.001, Cramér’s V = 0.51 (strong effect size). n = 56. Chi-square (chi-squared) statistic and Cramer’s V are reported as the test statistic and effect size respectively. Method categories are not mutually exclusive.
This methodological evolution reflects broader trends in natural language processing, where transformer-based models (BERT, RoBERTa, GPT variants) have achieved state-of-the-art performance on sentiment classification benchmarks (Devlin et al., 2019). However, the shift toward more complex methods does not necessarily correspond to improved measurement validity, as discussed in Section 5.
Social Media Platforms
Twitter/X was the dominant platform, analysed in 48 studies (85.7%). Facebook was analysed in four studies (7.1%), Reddit in four studies (7.1%), Weibo in 1 study (1.8%), and YouTube in 1 study (1.8%); 10 studies (17.9%) employed multi-platform approaches. These percentages sum to more than 100% because many studies analysed multiple platforms simultaneously. The overwhelming focus on Twitter/X reflects both its historically open API and its established role as a platform for political discourse (Tumasjan et al., 2010). This concentration raises generalisability concerns, as Twitter/X users differ demographically and behaviourally from both other platform users and the general population (Sen et al., 2021).
Sentiment Representations and Aggregation
Drawing on full-text review, studies employed diverse sentiment classification schemes. Ternary classification (positive/negative/neutral) was most common, used in 44 studies (78.6%), followed by binary classification (positive/negative) in eight studies (14.3%), multi-dimensional emotion taxonomies in three studies (5.4%), and continuous sentiment scores in 1 study (1.8%). The choice of sentiment representation was rarely justified theoretically or empirically, and few studies discussed whether their chosen classification scheme aligned with the structure of public opinion on the topic being measured.
Aggregation approaches also varied; categories are non-exclusive as some studies combined approaches. Temporal trend analysis was dominant, appearing in 47 studies (83.9%), reflecting the prevalence of election and approval-rating tracking studies. Topic-level aggregation appeared in nine studies (16.1%), geographic aggregation in six studies (10.7%), and individual-level aggregation in three studies (5.4%). Temporal aggregation may obscure individual heterogeneity (Sen et al., 2021), while individual-level analysis may amplify the impact of highly active, unrepresentative users.
RQ2: Validation Procedures
Quantitative Validation Against Surveys
Within-Corpus Studies Conducting Quantitative Comparison with Polling or Survey Data (n = 11)
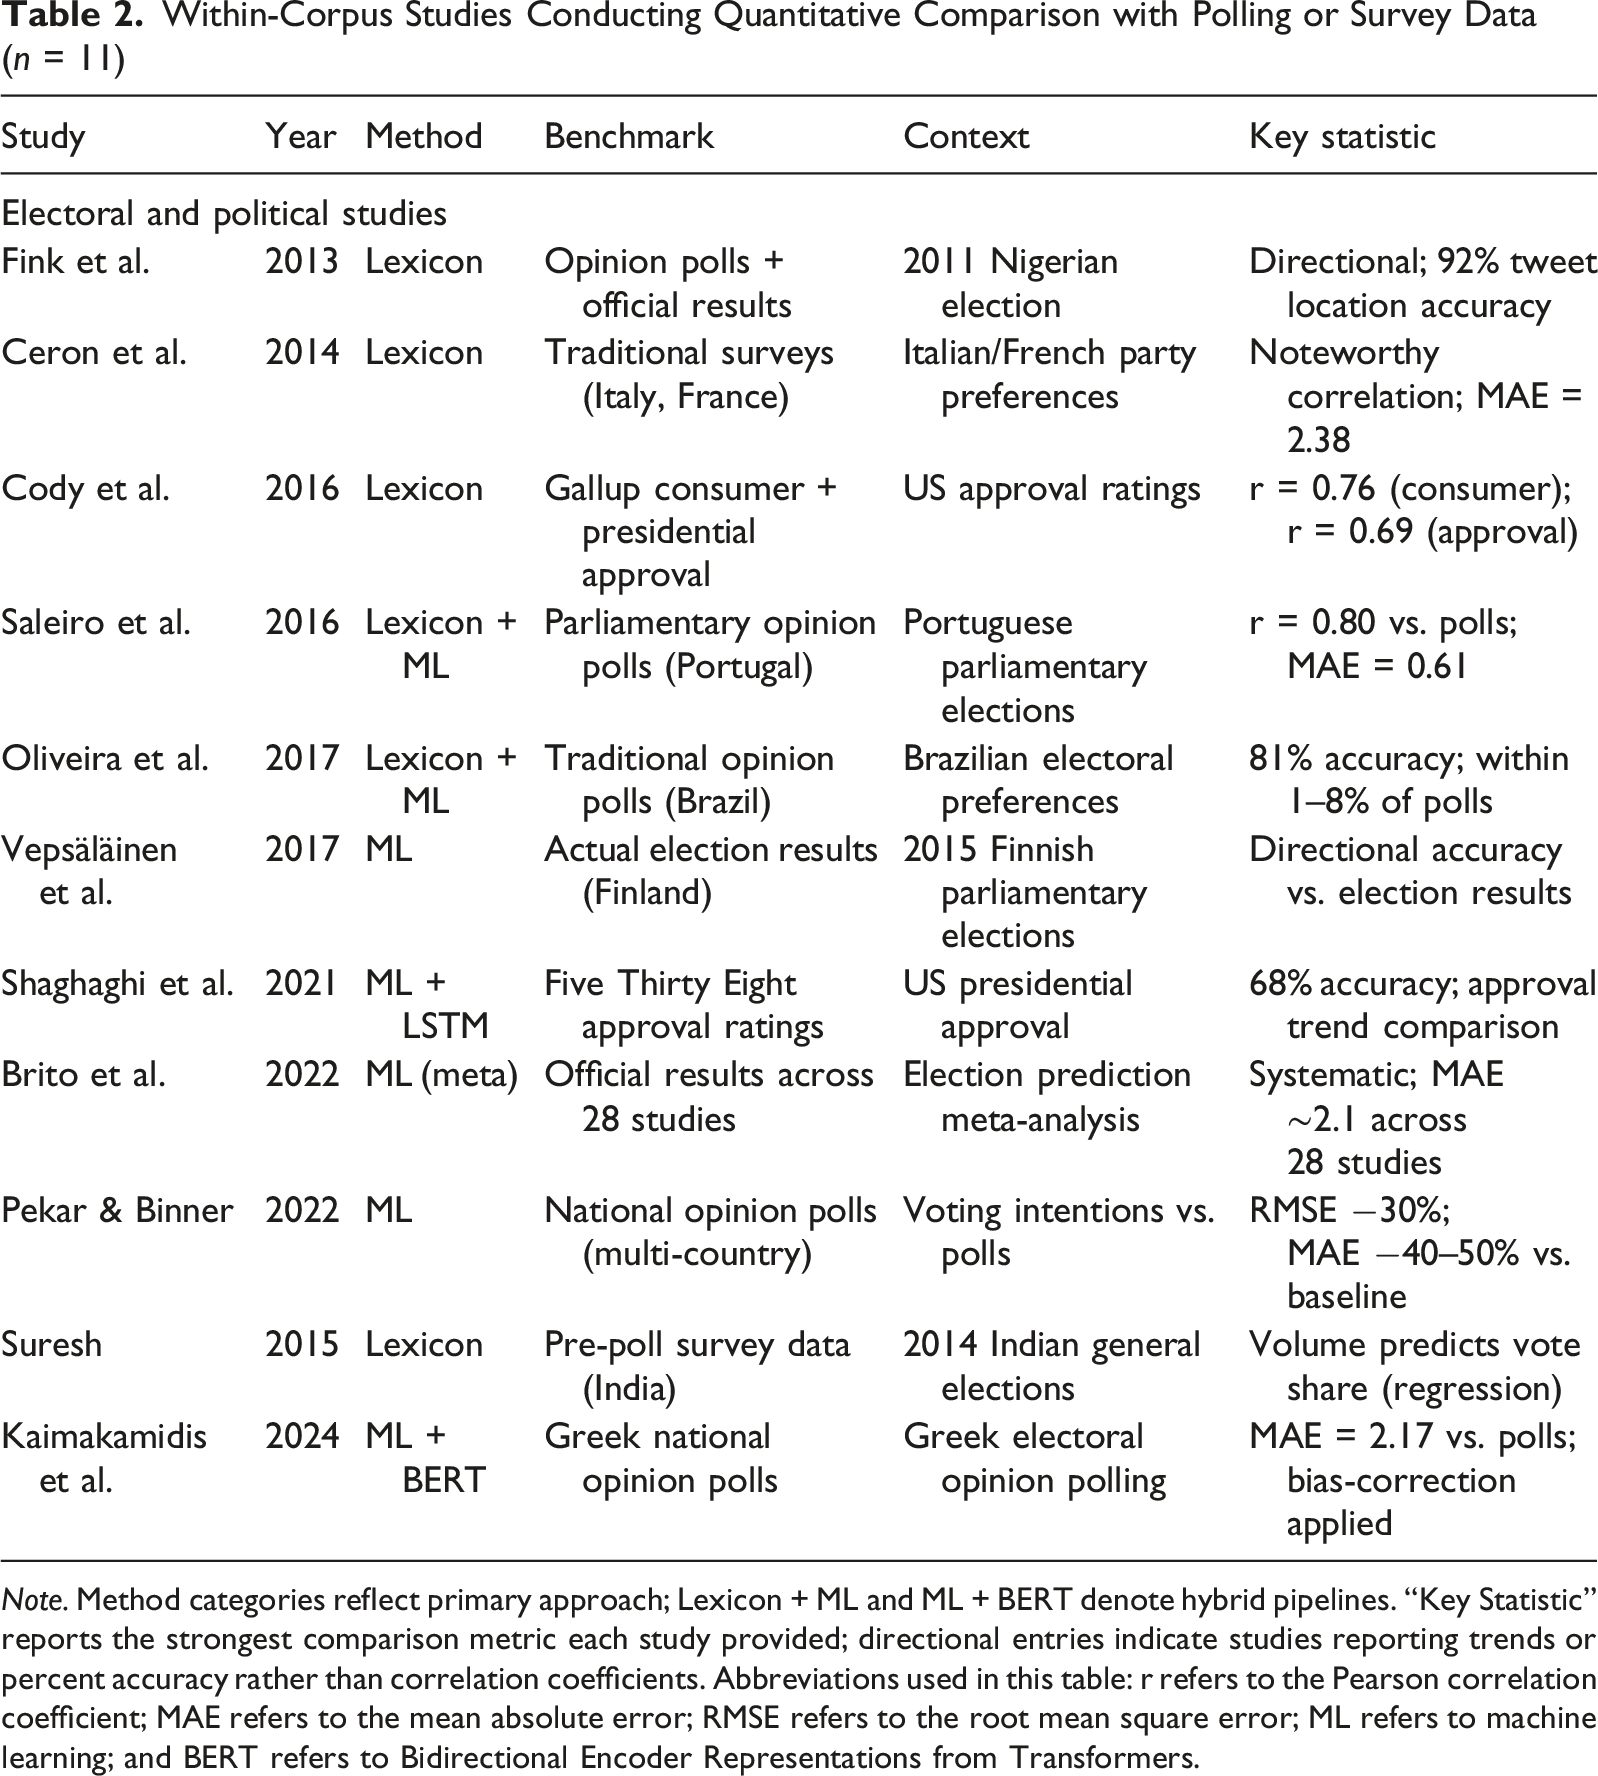
Note. Method categories reflect primary approach; Lexicon + ML and ML + BERT denote hybrid pipelines. “Key Statistic” reports the strongest comparison metric each study provided; directional entries indicate studies reporting trends or percent accuracy rather than correlation coefficients. Abbreviations used in this table: r refers to the Pearson correlation coefficient; MAE refers to the mean absolute error; RMSE refers to the root mean square error; ML refers to machine learning; and BERT refers to Bidirectional Encoder Representations from Transformers.
The correlation values available in the corpus range from r = 0.69 to r = 0.80 for studies reporting Pearson-type coefficients (Cody et al., 2016; Saleiro et al., 2016), with error metrics (MAE, RMSE) more common than r in electoral prediction studies. This is methodologically informative: MAE and RMSE measure prediction accuracy relative to a ground-truth vote share or poll result, while r measures co-variation, and neither is strictly superior. The key observation is that all quantitative comparisons in this corpus concern electoral or political approval contexts, where clear numerical benchmarks exist. No corpus study in a public health, environmental, or social issue domain reported a quantitative comparison statistic, consistent with the context-dependency finding from prior validation research (Bovet et al., 2018; Chen et al., 2022). Method sophistication does not explain this pattern: the two most technically advanced studies in this group (Kaimakamidis & Pitas, 2024; Shaghaghi et al., 2021) used ML + DL hybrid pipelines and still reported accuracy and MAE metrics rather than survey correlation coefficients.
Qualitative and Alternative Validation Approaches
Within the corpus, validation quality varied substantially across four tiers. The first and most rigorous tier comprises the 11 studies that computed a quantitative statistic against an external benchmark (Table 2). The second tier, 41 studies (73.2% of the corpus), compared their findings directionally or narratively to surveys, polls, or approval ratings without computing a number: reporting that social media sentiment tracked polling trends or was broadly consistent with survey findings without computing a statistic. This directional tier is the dominant mode of validation engagement even within a corpus selected precisely because it engaged with validation. The third tier comprises four studies (7.1%) that relied solely on electoral outcomes (vote shares) as benchmarks without comparing to pre-election polls. Such comparisons offer strong predictive validity for forecasting and could reasonably anchor a higher tier in a typology centred on behavioural prediction. In a typology centred on whether CPOM measures public opinion, however, the more informative benchmark is the survey-based opinion measure that sits between the signal and the election: alignment with vote shares is consistent with a valid opinion measure, but is also consistent with other platform dynamics that correlate with electoral outcomes. The tier structure reflects this scoping decision rather than a judgement about the underlying studies. A fourth tier of four studies (7.1%) engaged only with representativeness discussion without any external comparison. The 78.8% of survey-engaging studies that stopped at directional comparison represents a within-corpus quantitative-action gap that mirrors the field-level gap at a finer scale: just as the field overwhelmingly lacks validation engagement, those studies that do engage overwhelmingly stop short of computing a validation statistic.
Validation Across Eras
Validation practices among included studies were high and increased across eras. Survey-based comparison rates were 88.9% (8 of 9) in 2011–2015, 91.7% (11 of 12) in 2016–2020, and 94.3% (33 of 35) in 2021–2025. TSE framework engagement, explicit discussion of representativeness, selection bias, or demographic coverage, increased more substantially: 44.4% (4 of 9) in 2011–2015, 66.7% (8 of 12) in 2016–2020, and 80.0% (28 of 35) in 2021–2025. This trend indicates genuine methodological progress among validation-engaged researchers. However, this improvement occurs within the selected corpus; the broader field-level pattern is documented by the IC3 exclusion rate, which indicates that a substantial portion of published CPOM research has not yet engaged with these validation requirements, a gap quantified directly in Section 4.4.
RQ3: Limitation Recognition and the Recognition-Action Gap
Acknowledged Limitations
All 56 included studies acknowledged at least one methodological limitation related to representativeness, construct validity, or measurement error; this was a condition of inclusion under IC3. The rates reported below therefore reflect a selected sample: studies that engaged with no such acknowledgement were excluded, meaning the recognition figures represent a ceiling rather than a field-wide average. The most commonly discussed limitations were: representation bias (social media users not representative of the general population) in 40 studies (71.4%), platform-specific bias in 32 studies (57.1%), construct validity concerns in 28 studies (50.0%), temporal specificity in 19 studies (33.9%), and language or cultural context in 14 studies (25.0%). The field-level recognition-action gap is evidenced by the IC3 screening exclusions: 125 full-text papers (49.4%) that conducted CPOM without any such engagement. Within the corpus, the gap takes a more nuanced form: studies consistently acknowledged limitations but varied substantially in whether and how they took methodological action to address them.
Actions Taken to Address Limitations
Concrete methodological actions to address representativeness and validity concerns within the corpus included: demographic weighting or post-stratification in nine studies (16.1%), multi-platform comparison in 10 studies (17.9%), quantitative survey correlation in nine studies (16.1%), sensitivity analyses in 14 studies (25.0%), and temporal robustness checks in eight studies (14.3%). TSE framework application, the most comprehensive form of error-aware analysis, was employed in 40 studies (71.4%). Across all action types, rates were low relative to the corresponding acknowledgement rates, indicating a systematic gap between recognising a limitation and taking steps to address it.
The Recognition-Action Gap
The recognition-action gap quantifies the disconnect between acknowledging limitations and addressing them. The field-level gap is documented by the IC3 exclusion rate: 125 of 253 full-text-assessed papers (49.4%) provided no external benchmark comparison or representativeness engagement. Within the corpus, a residual gap persists: representation bias was acknowledged in all 56 studies but addressed through demographic weighting in only 9 (16.1%); platform bias was acknowledged in 32 studies but addressed through multi-platform replication in only 10 (31.3%).
Critically, the gap did not shrink over time; it widened. TSE recognition grew substantially across eras: 44.4% (2011–2015), 66.7% (2016–2020), and 80.0% (2021–2025). Yet the rate of quantitative empirical validation moved in the opposite direction: 33% of studies in 2011–2015, 33% in 2016–2020, and only 11% in 2021–2025. Expressed as a recognition-action gap within TSE-engaged studies, this stands at 25% in the earliest era, widens to 50% in 2016–2020, and reaches 86% in 2021–2025. This temporal pattern directly challenges the view that the gap is simply a feature of a young field in which issues are identified before being addressed: the most recent and methodologically mature era shows the largest gap, not the smallest. Recognition has grown; action has not.
Quality Assessment Summary
These patterns of limitation recognition and validation action are reflected in the overall quality scores assigned to studies in the corpus. Quality assessment scores across the 56 included studies were distributed as follows: high quality comprised 12 studies (21.4%), moderate quality comprised 21 studies (37.5%), and lower quality comprised 23 studies (41.1%). Studies reporting quantitative correlation coefficients consistently scored highest on the measurement validity dimension, confirming that systematic survey comparison remains the clearest marker of methodological rigour in CPOM research.
Discussion
Methodological Evolution Without Validation Progress
The findings reveal a striking method-sophistication paradox at the heart of CPOM research. Computational methods have advanced rapidly, with deep learning architectures comprising 40.0% of studies in 2021–2025 compared to 0% before 2021. Yet none of the 14 pure deep learning studies in the corpus conducted quantitative numerical comparison with polling or survey data. All 11 corpus studies that did so used lexicon-based or classical machine learning methods; the two most recent (Shaghaghi, 2021; Kaimakamidis, 2024) used hybrid ML + DL pipelines but were primarily ML-driven. Most deep learning papers engaged with surveys directionally (12 of 14, 86%) and acknowledged TSE concerns (9 of 14, 64%), but none translated this engagement into a quantitative validation statistic, confirming the broader pattern that 78.8% of all survey-engaging papers in the corpus stopped at directional comparison. Technical sophistication does not predict criterion validation rigour. This paradox is consistent with broader trends in computational social science where methodological sophistication outpaces theoretical and empirical grounding (Lazer et al., 2020): as models grow more complex, the distance between model performance on held-out sentiment tasks and the validity of the underlying measurement claim grows larger, not smaller. The broader field context reinforces this picture: 49.4% of all full-text-assessed papers provided no validation engagement whatsoever, confirming that the method-sophistication paradox operates against a backdrop of near-universal validation failure.
Complexity does not guarantee validity: a model achieving 95% accuracy on a sentiment benchmark may still fail to measure public opinion if its training data or aggregation approach is misaligned with the construct. Algorithmic curation complicates interpretation further, as platform recommendation systems may amplify certain viewpoints (Lazer et al., 2020; Sen et al., 2021).
The Recognition-Action Gap: Awareness Without Accountability
This disconnect between technical progress and validation rigour leads directly to a second, more troubling pattern in the corpus. The recognition-action gap, evidenced most powerfully by the 125 IC3 full-text exclusions (49.4% of all assessed papers), represents a failure of scientific accountability at the field level. One might expect such a gap in a young field, where early studies naturally identify problems before the community has developed tools to address them. The temporal data, however, refute this explanation. The recognition-action gap widened across eras: quantitative validation was achieved by 33% of studies in both the earliest eras (2011–2015 and 2016–2020) but fell to 11% in 2021–2025, even as TSE recognition reached 80%. The field has grown more aware of the validation problem while becoming proportionally less likely to address it, the opposite of what a maturing field would show. Acknowledging limitations in a discussion section is insufficient when those limitations are not addressed in the research design.
Several factors may explain this gap. First, academic publishing rewards novelty and technical sophistication over methodological rigour (Munafò et al., 2017). Second, addressing representation bias through demographic weighting requires access to user demographic data, which is often unavailable due to privacy restrictions (Sen et al., 2021). Third, CPOM research spans computer science, communication, political science, and other disciplines with different methodological standards. Fourth, the relationship between social media sentiment and public opinion remains theoretically underspecified, leaving researchers uncertain about what actions would constitute adequate validation or bias mitigation.
The recognition-action gap is nonetheless problematic: acknowledging potential bias without acting on it risks producing misleading evidence that informs flawed policy or scientific conclusions.
What Does CPOM Actually Measure?
CPOM typically assumes social media sentiment reflects public opinion, but this is rarely tested. Several alternative constructs are plausible: expressed sentiment of active users (younger, more educated, more partisan); salient considerations amplified by platform algorithms (Zaller, 1992); performative expression designed for an audience rather than reflecting private attitudes (Boyd, 2010); or elite discourse, since a small share of users produces most content (Wojcik & Hughes, 2019). Each is a valid construct for specific questions, but none is equivalent to population-level public opinion. The validation deficit documented here means we currently lack evidence to know which construct CPOM captures, or when it approximates the intended one. This ambiguity is consequential: the 80.4% of studies that did not compute a quantitative validation statistic could be tracking any of these constructs, making their findings about public opinion uninterpretable without knowing which one their measures actually reflect. A further concern compounds these conceptual issues. Since the October 2022 acquisition of Twitter and the subsequent removal of the free academic API tier in early 2023, research-grade data from the platform has become substantially harder and more expensive to obtain. This raises serious questions about the comparability and replicability of pre- and post-2023 Twitter/X-based CPOM studies, and about the long-term viability of the platform as an evidence base for opinion research.
The implications of this conceptual ambiguity extend beyond methodology. When CPOM studies are cited in policy discussions, journalism, or further academic research as evidence of what “the public” thinks, the construct slippage from online expression to population-level opinion is rarely flagged. Schober et al. (2016) and Sen et al. (2021) both argue that this slippage is the most consequential validity problem in the field, because it converts a measurement uncertainty into a confident downstream claim. The evidence assembled here, in which the overwhelming majority of studies engage with validation only directionally or not at all, suggests that the field is not currently positioned to support such confident claims. A more honest framing would distinguish explicitly between studies that measure online expression as a substantive phenomenon in its own right and those that claim to measure public opinion through online expression as an indicator: the former are common and methodologically defensible, the latter are common but currently undersupported by validation evidence.
Implications for Research and Practice
CPOM should routinely report quantitative validation against surveys, with correlations and sensitivity analyses. Where demographic data allow, post-stratification or MRP should correct for representation bias (Wang et al., 2015). Multi-platform replication strengthens generalisability. For practitioners, CPOM signals can complement surveys but should not replace them; any application should verify the study addressed representation bias.
Beyond individual study practices, structural changes at the field level would help. Journals reviewing CPOM submissions could treat quantitative external validation as a default publication condition, paralleling the data-availability requirements now standard in many quantitative social-science journals. CPOM-specific reporting standards, analogous to STROBE or PRISMA, would set a minimum specification for sampling frame, construct definition, validation procedure, and limitation analysis (Schober et al., 2016), and would let directional-only studies be aggregated into quantitative meta-analyses rather than remain in isolation.
Limitations of This Review
Before drawing implications for the field, several limitations of the present review should be acknowledged. Several limitations should be noted. First, all screening and coding were conducted by a single reviewer; despite the safeguards described in Section 3.4.1, a median miss rate of 3-5% remains plausible. Second, the English-language restriction systematically excludes non-English CPOM research, particularly work published in Chinese, Spanish, and Arabic outlets, where platforms such as Weibo and regionally dominant networks are studied without an English-language publication incentive; this likely understates the geographic diversity of CPOM practice and overstates Western methodological norms. Third, quality scoring involved subjective judgements that another reviewer might calibrate differently. Fourth, restricting inclusion to peer-reviewed journals, conference proceedings, and quality-screened preprints introduces publication bias: studies with null or negative validation results are less likely to be published, meaning this corpus may overrepresent favourable validation outcomes relative to the true distribution of CPOM research. Fifth, study heterogeneity in methods and contexts precluded formal meta-analysis of validation statistics. Despite these limitations, the IC3 criterion is a methodological contribution that makes exclusion statistics primary findings rather than procedural overhead, enabling a field-level audit that prior reviews could not conduct.
Conclusion
This systematic review of 56 studies (2008–2025) finds that empirical validation in CPOM remains the exception, not the rule. Only 11 of 56 studies (19.6%) computed a quantitative statistic against an external benchmark such as a survey or opinion poll. The remaining 80.4% either compared directionally without a number or provided no external comparison at all. This is the central finding: a field that routinely claims to measure public opinion almost never demonstrates that its measures correspond to one. A method-sophistication paradox sharpens this picture further: deep learning grew from 0% to 40.0% of studies across eras, yet none of the 14 deep learning papers reached the quantitative validation threshold, while all 11 that did used lexicon-based or classical ML. A field-level recognition gap compounds this: 49.4% of all full-text-assessed papers were excluded precisely because they conducted CPOM without any validation engagement. The recognition-action gap also widened over time rather than closing: TSE recognition grew from 44.4% to 80.0% across eras, yet quantitative validation rates fell from 33% to just 11% in the most recent era. The field has become more aware of the validation problem while becoming less likely to act on it.
CPOM currently measures expressed sentiment of a self-selected, demographically skewed user base, which may diverge from population-level public opinion. Closing this gap requires journals to treat external validation as a default requirement, and individual studies to compute quantitative comparison statistics, apply demographic correction, and replicate across platforms. CPOM’s promise as a complement to surveys can only be realised through rigorous validation and transparent reporting.
Supplemental Material
Supplemental Material - Computational Public Opinion Measurement: A Systematic Review of Methods and Methodological Limitations
Supplemental Material for Computational Public Opinion Measurement: A Systematic Review of Methods and Methodological Limitations by Eun Gyo Joung in Social Science Computer Review.
Footnotes
Acknowledgements
I would like to acknowledge that this research was made possible through the BK21 Fostering Outstanding Universities for Research (Technology Management, Economics, and Policy Program and the Integrated Major in Smart City Global Convergence), funded by the Ministry of Education (MOE, Korea) and the National Research Foundation of Korea (NRF).
Ethical Considerations
Ethical approval was not required for this study as it involved secondary analysis of publicly available data and did not involve human participants directly.
Consent to Participate
This systematic review analysed published literature and did not involve human participants.
Consent for Publication
This manuscript does not contain data from individual persons.
Author Contributions
Eun Gyo Joung: Conceptualization, Methodology, Formal analysis, Investigation, Data curation, Writing – Original Draft, Writing – Review and Editing, Visualization, Project administration. List the contribution of each author according to CRediT taxonomy or similar framework.
Funding
The authors disclosed receipt of the following financial support for the research, authorship, and/or publication of this article: This research was supported by the BK21 Fostering Outstanding Universities for Research, funded by the Ministry of Education (MOE, Korea) and the National Research Foundation of Korea (NRF).
Declaration of Conflicting Interests
The authors declared no potential conflicts of interest with respect to the research, authorship, and/or publication of this article.
Data Availability Statement
The data extraction forms, search strategies, and supplementary materials supporting the findings of this systematic review are available from the corresponding author upon reasonable request. The list of included studies is provided in the References section of the manuscript.
Supplemental Material
Supplemental material for this article is available online.
Author Biography
References
Supplementary Material
Please find the following supplemental material available below.
For Open Access articles published under a Creative Commons License, all supplemental material carries the same license as the article it is associated with.
For non-Open Access articles published, all supplemental material carries a non-exclusive license, and permission requests for re-use of supplemental material or any part of supplemental material shall be sent directly to the copyright owner as specified in the copyright notice associated with the article.