
Abstract
The current study examined whether a work–family culture measure can be used across diverse income groups. We compared measure structure and criterion-related validity for low-income (n = 327) and high-income (n = 400) samples. Differences in measurement structure between the two groups were examined using measurement invariance, and differences in prediction were examined using multiple regression. Results indicate work-family culture facets are not equivalent across groups, and some relationships are weaker for low-income workers compared to high-income workers. Findings suggest that research using work–family culture measures developed on high-income populations may not generalize to low-income populations. New or revised measures are needed. This study contributes to our understanding of work–family measurement, work–family culture in low-income contexts, and the generalizability of measures and results using high-income samples to lower income counterparts. The results have clear implications for questioning equivalence of commonly used measures across income levels.
A supportive work–family culture is a desirable commodity for today’s organizations. Companies that support workers’ family needs are lauded in prestigious lists such as Working Mother magazine’s “100 best companies for working moms” and Fortune’s “100 best companies to work for.” Workers are also drawn to and are more likely to remain in family-friendly organizations (Thompson & Prottas, 2006). Furthermore, informal organizational support for work–family challenges is related to numerous outcomes of interest, including work–family conflict (Butts, Casper, & Yang, 2013), job satisfaction (Hammer, Kossek, Yragui, Bodner, & Hanson, 2009), and physical and psychological health (Thompson & Prottas, 2006).
One limitation, however, is that the majority of research on family-friendly workplace culture or related constructs uses measures developed using primarily student, professional, and white-collar samples (e.g., supervisor family support; Kossek & Nichol, 1992). Even beyond workplace supportive constructs and measures, researchers have lamented the limited focus on professional white-collar samples in work–family research (Agars & French, 2011; Casper, Eby, Bordeaux, Lockwood, & Lambert, 2007). Thus, although our study focuses on a single measure of family-friendly workplace culture, we argue more broadly that measures used to study organizational phenomena may not be applicable across diverse worker populations.
The near-exclusive focus on educated, professional samples for measurement development and validation is problematic for two reasons. First, low-income workers make up a substantial portion of the workforce. In the United States, 59% of jobs (75.3 million workers) can be classified as hourly, and 3.6 million workers report an hourly wage at or below the national minimum (Bureau of Labor Statistics, 2012). Thus, in focusing on professional white-collar workers, we exclude the majority of workers from our research. Second, the working environment for low-income positions differs from that of their high-income counterparts. Rather than relying on formal policies and practices, low-income workers typically have limited control and few formal flexibility arrangements (Swanberg, McKechnie, Ojha, & James, 2011) and rely heavily on coworkers and informal arrangements (Lambert, Haley-Lock, & Henly, 2012). Given these distinct characteristics of work–family culture for low-income workers, the generalizability of current measures of work–family experiences to low-income contexts is suspect.
The purpose of this article is to examine the appropriateness of Thompson, Beauvis, and Lyness’s (1999) work–family culture measure for use among low-income workers. Thompson et al.’s (1999) measure is commonly used, as it was one of the first measures to capture the construct of organizational work–family support. In addition, the measure captures multiple dimensions of work–family culture, allowing us to examine each facet separately to determine whether specific aspects of culture are equivalent between low- and high-income groups. We examine the measure’s psychometric properties (i.e., measurement structure) and criterion-related validity (i.e., relationships with variables in the work–family culture nomological network).
To test measure adequacy for both high- and low-income groups, we compare low-income workers to high-income workers in two ways. First, we examine measurement invariance (also known as measurement equivalency or commensurability). Measurement invariance is a statistical test in which multiple group confirmatory factor analysis (CFA) models are compared to determine whether the same construct is measured. Measures that are invariant (i.e., equivalent, commensurate) have the same factors, loadings, and intercepts across groups. Testing for invariance is a common suggestion of measurement developers (e.g., Netemeyer, Boles, & McMurrian, 1996), yet is often unexplored. Second, we use differential prediction to examine differences in criterion-related validity across groups. Differential prediction is a form of regression that is used to identify group differences and possible test bias (Lautenschlager & Mendoza, 1986). This approach allows us to identify if relationship strength between work–family culture and correlates varies by income group. Further, we are able to see if work–family culture systematically over- or underpredicts correlates for high- versus low-income groups.
Work–Family Culture
Thompson et al. (1999) defined work–family culture as “shared assumptions, beliefs, and values regarding the extent to which an organization supports and values the integration of employees’ work and family lives” (p. 394). Work–family culture consists of three components: organizational time demands, career consequences, and managerial support (see items in Table 1). Organizational time demands occur when the organization requires employees to devote excess time to paid work, prioritizing work over family time. Career consequences occur when employers punish workers for using family-friendly policies or prioritizing family over work by withholding opportunities or giving negative performance evaluations. Managerial support occurs when managers are helpful and empathetic to workers’ challenges in managing work and family responsibilities.
Work–Family Culture Scale Items.

Note. (R) indicates a reverse-coded item.
aItem used in the Revised Manager Support Scale.
The work–family culture measure captures the shared perception that the organization is supportive of employee family demands. The three facets are capable of predicting outcomes independently as well. Studies have assessed both work–family culture as an overall construct (e.g., Behson, 2005), and each facet independently (e.g., Beauregard, 2006). Because each dimension is conceptually distinct and differentially related to outcomes (e.g., Beauregard, 2006), it is recommended that researchers examine each facet independently. Work–family culture helps employees navigate work–family challenges, decreasing work–family conflict (Major, Fletcher, Davis, & Germano, 2008). Because work–family culture is supportive of employee needs, employees who perceive their workplace as family-friendly are more likely to be satisfied with their job and family, experience work–family enrichment (Macky & Boxall, 2008; Wayne, Randel, & Stevens, 2006), and are less likely to report turnover intentions (Behson, 2005).
Work–Family Culture in Low-Income Contexts
Low-income workers endure unique hardships that shape their experiences of work–family culture. One of the most prevalent is a lack of family-friendly work design. Low-income workers frequently occupy low-wage, inflexible shift work positions. These jobs require irregular hours, making it difficult to meet family responsibilities (Bromer & Henly, 2009). Shifts are also assigned on short notice with little employee input exacerbating difficulties in childcare and transportation (Swanberg, James, Werner, & McKeachnie, 2008).
Low-income workers also have limited access to formal supports. Benefits, such as on-site childcare or flextime, are largely unavailable. Instead, they must rely on interpersonal skills to develop informal work–family benefits (Swanberg, 2005). Indeed, informal practices are necessary for an accurate picture of the low-income work–family interface due to lack of policy and inconsistent adherence to policy (Henly, Shaefer, & Waxman, 2006). Research has increasingly demonstrated the importance of informal support for mitigating work–family related strain, work–family conflict, and well-being (e.g., Griggs, Casper, & Eby, 2013).
Low-income positions are typically inflexible, lack autonomy, and limit employee control over working hours. For white-collar workers, perceptions of control are tied to the ability to constrain working hours or the integration of work and family roles (Kossek, Lautsch, & Eaton, 2006). For low-income workers, however, control is tied to the ability to gain working hours and increase stability in hours (Lambert et al., 2012). Further, flexibility in the timing and place of work is often unavailable to low-income workers (Lambert & Haley-Locke, 2004). When low-income workers attempt to exert control and flexibility, it is often dependent on factors outside of their control, such as the willingness of coworkers to exchange shifts (Lambert et al., 2012).
Relevancy of Work–Family Culture Items for Low-Income Workers
Given the differences between the work–family experiences of low- and high-income workers, the applicability of work–family culture for low-income workers is questionable. Thompson et al. (1999) measure organizational time demands with 4 items designed to tap into the extent to which employees are expected to work excess hours and prioritize work over family. Previous research demonstrates supervisors in low-wage positions may prioritize hiring or scheduling workers who can put in excess hours, as they are perceived to be more dedicated (Henly et al., 2006). However, 2 items assessing this dimension are likely irrelevant for low-income workers, because they assess working at home (i.e., “employees are expected to take work home at night and/or on the weekends” and “To get ahead at my work organization, employees are expected to work more than 50 hr a week, whether at the workplace or at home”). Although taking work home may be common for a higher income worker, for low-income workers, the design of work often mandates work be performed at the workplace.
Career consequences (5 items) reflect the extent to which individuals are punished by supervisors and coworkers for prioritizing family or using family-friendly policies (Thompson, Beauvis, & Lyness, 1999). Due to the limited career opportunities in low-wage positions (Sheely, 2010), the concept of career consequences (i.e., lack of promotion or option for transfer) may be irrelevant. Furthermore, 3 of the 5 items refer to formal work–family benefits (e.g., extended leaves), which are rarely available to low-income workers (Swanberg, 2005).
Lastly, manager support (11 items) reflects the extent to which management provides instrumental and emotional support to help employees manage work–family challenges (Thompson et al., 1999). Not only is manager support relevant for low-income workers, but it is arguably one of the most influential work resources available to low-income workers (Swanberg et al., 2011). Although the concept of manager support is commensurate with previous research in low-income contexts, item-specific questions emerge. For example, the item “in my work organization it is very hard to leave during the workday to take care of personal or family matters” may be irrelevant because leaving during the workday may depend on the availability and willingness of coworkers to cover the workload (Lambert et al., 2012). Similarly, the item “my work organization is supportive of employees who want to switch to less demanding jobs for family reasons” may have limited relevance because low-income workers often have limited mobility and strive for increased hours (i.e., more demands), rather than reduced demands (Lambert & Haley-Lock, 2004; Lambert et al., 2012).
Current Study
Due to the inconsistencies between Thompson et al.’s (1999) operationalization of work–family culture and research describing work–family culture for low-income workers, this measure may lack commensurability when used with members of low-income populations. Therefore, our study is guided in part by the following research question:
In addition to evaluating measurement equivalence, we investigate the extent that Thompson et al.’s (1999) work–family culture measure predicts outcomes similarly across groups. We examine the five outcomes outlined previously: work–family conflict, work–family enrichment, job satisfaction, family satisfaction, and turnover intentions.
However, because the measure items are designed to assess work–family culture for the middle- to upper-class white-collar worker and consequently appear to have a lack of content validity, we expect the relationships between work–family culture and its correlates will be attenuated for the low-income group in comparison to the high-income group.
There are also dimensions of culture not assessed by Thompson et al.’s (1999) measure that are important for assessing work–family culture in low-income environments. Specifically, the coworkers support for meeting family responsibilities (Lambert et al., 2012), the ability to control schedule timing, increase scheduling stability or advanced notice (Swanberg et al., 2011), and the control over receiving a minimum number of hours (Lambert, 2009). We expect these deficiencies will also moderate the relationship between work–family culture and its correlates, such that relationships will be weaker for low-income workers compared to high-income workers.
Method
Participants and Procedure
Two samples of working adults were recruited: a low-income sample and a high-income sample. Low income was defined as working individuals who reported a household income of 200% of the federal poverty level or less; all individuals in the high-income sample reported a household income above 200% of the federal poverty level (determined using household size and household income; Bernstein, 2004; U.S. Department of Health and Human Services, 2012).
The low-income sample was recruited primarily (55%) through community partners who provided services to those experiencing financial hardship. Participants filled out paper-and-pencil surveys at community events (e.g., food banks). We also used snowball sampling at a university in the southwestern United States. Students were instructed to recruit a nonstudent low-income friend or family member working full-time with family responsibilities. Community participants were compensated with a US$5 gift card, and students were compensated with extra credit. The high-income sample was recruited through an online Qualtrics panel sample. To ensure data quality, participants were removed due to short response time, inattentiveness to bogus items, and Internet protocol (IP) addresses redundancy. Participants with missing data on the study variables were also removed (i.e., work–family culture, work–family conflict, work–family enrichment, job satisfaction, family satisfaction, turnover intentions, and/or income; n = 35). All participants with missing data also failed quality checks and did not provide income information. An additional 41 participants were not eligible due to reporting a household income at or below 200% of the poverty line. The final high-income sample consisted of 400 individuals. Qualtrics compensated high-income participants by providing a small monetary award (US$0.70–US$1.20).
The low-income sample (n = 327) reported a mean household income from US$20,000 to US$25,000. Participants were primarily female (68.8%), middle-aged (M = 38.15), and diverse in terms of race and ethnicity: Hispanic (51.4%), White/Caucasian (17.4%), and African American (13.8%). Most individuals were married or in a committed relationship/domestic partnership (58.1%), had children (83.8%), and worked 40–49 hr per week in a variety of industries. The high-income sample (n = 400) was primarily female (54.5%), middle-aged (M = 40.47), and White (84.3%). Most individuals were married or in a committed relationship/domestic partnership (70.1%) and had children (57.8%). On average, participants worked 40–49 hr per week in a variety of industries and had a yearly household income of US$70,000–US$79,999.
Measures
Work–family culture
Work–family culture was measured using Thompson et al.’s (1999) 20-item scale (total: α = .83 for low income, α = .92 for high income; managerial support: α = .83 for low income, α = .90 for high income; organizational time demands: α = .80 for low income, α = .84 for high income; career consequences: α = .75 for low income, α = .79 for high income). Higher scores indicated a more supportive work–family culture.
Work–family conflict
Netemeyer, Boles, and McMurrian’s (1996) scale measured the extent that the responsibilities of the work role make it difficult to meet the responsibilities of the family role. Both work-to-family (WIF) and family-to-work (FIW) conflict were scored, so higher levels indicated more conflict (WIF: low income α = .93 and high income α = .94; FIW: α = .91 for both).
Work–family enrichment
Carlson, Kacmar, Wayne, and Grzywacz’s (2006) 18-item scale measured the extent that knowledge, skills, and experiences gained in one role positively impact performance in the other. Both work-to-family enrichment (WFE; 9 items) and family-to-work enrichment (FWE; 9 items) were assessed. Higher scores indicated greater enrichment (WFE: low income α = .95, high income α = .94; FWE: low income α = .94, high income α = .92).
Job satisfaction
The extent that an individual likes various aspects of his or her job was measured using the 20-item Minnesota Satisfaction Questionnaire; higher scores indicated more satisfaction (α = .93 for both samples; Weiss, Dawis, & England, 1967).
Family satisfaction
Kopelman, Greenhaus, and Connolly’s (1983) 3-item measure was used to assess the extent that an individual likes his or her current family situation. Higher scores indicated more satisfaction (low income α = .58 and high income α = .75).
Turnover intentions
Four items from Mitchel (1981) measured the extent that an individual is looking to leave his or her current organization for another opportunity. Higher values indicated greater intention to turnover (low income α = .65 and high income α = .66).
Demographics
Items assessed age, gender, race/ethnicity, income, parental status, relationship status, occupational status, tenure, and partner occupational status.
Results
CFA and Measurement Invariance
We ran four CFAs in Mplus (Version 7.7; Muthén & Muthén, 2012) to determine the most appropriate measure structure for each group separately: a single-factor model, a three-factor model (managerial support, career consequences, and time demands factors) in which factors were not allowed to covary, a three-factor model in which factors were allowed to covary, and a four-factor higher order model in which the three factors loaded on a general latent factor. We interpret χ2 model fit, comparative fit index (CFI), root mean squared error of approximation (RMSEA), and standardized root mean squared residual (SRMR) indices to evaluate model fit. Cutoffs (CFI > .90, RMSEA < .08, SRMR < .08; Hu & Bentler, 1999) are used to determine acceptable model fit. We focus on CFI and SRMR values, as they are robust to incorrectly specified models (Hu & Bentler, 1999). Fit indices for all models were below the acceptable cutoffs, indicating the a priori measurement structure did not hold for either group (Table 2). Therefore, we examined separate CFAs for each lower order factor. Fit indices for at least one group for each lower level factor model met the minimum acceptable criteria (Table 2).
Multigroup Confirmatory Factor Analysis Results.
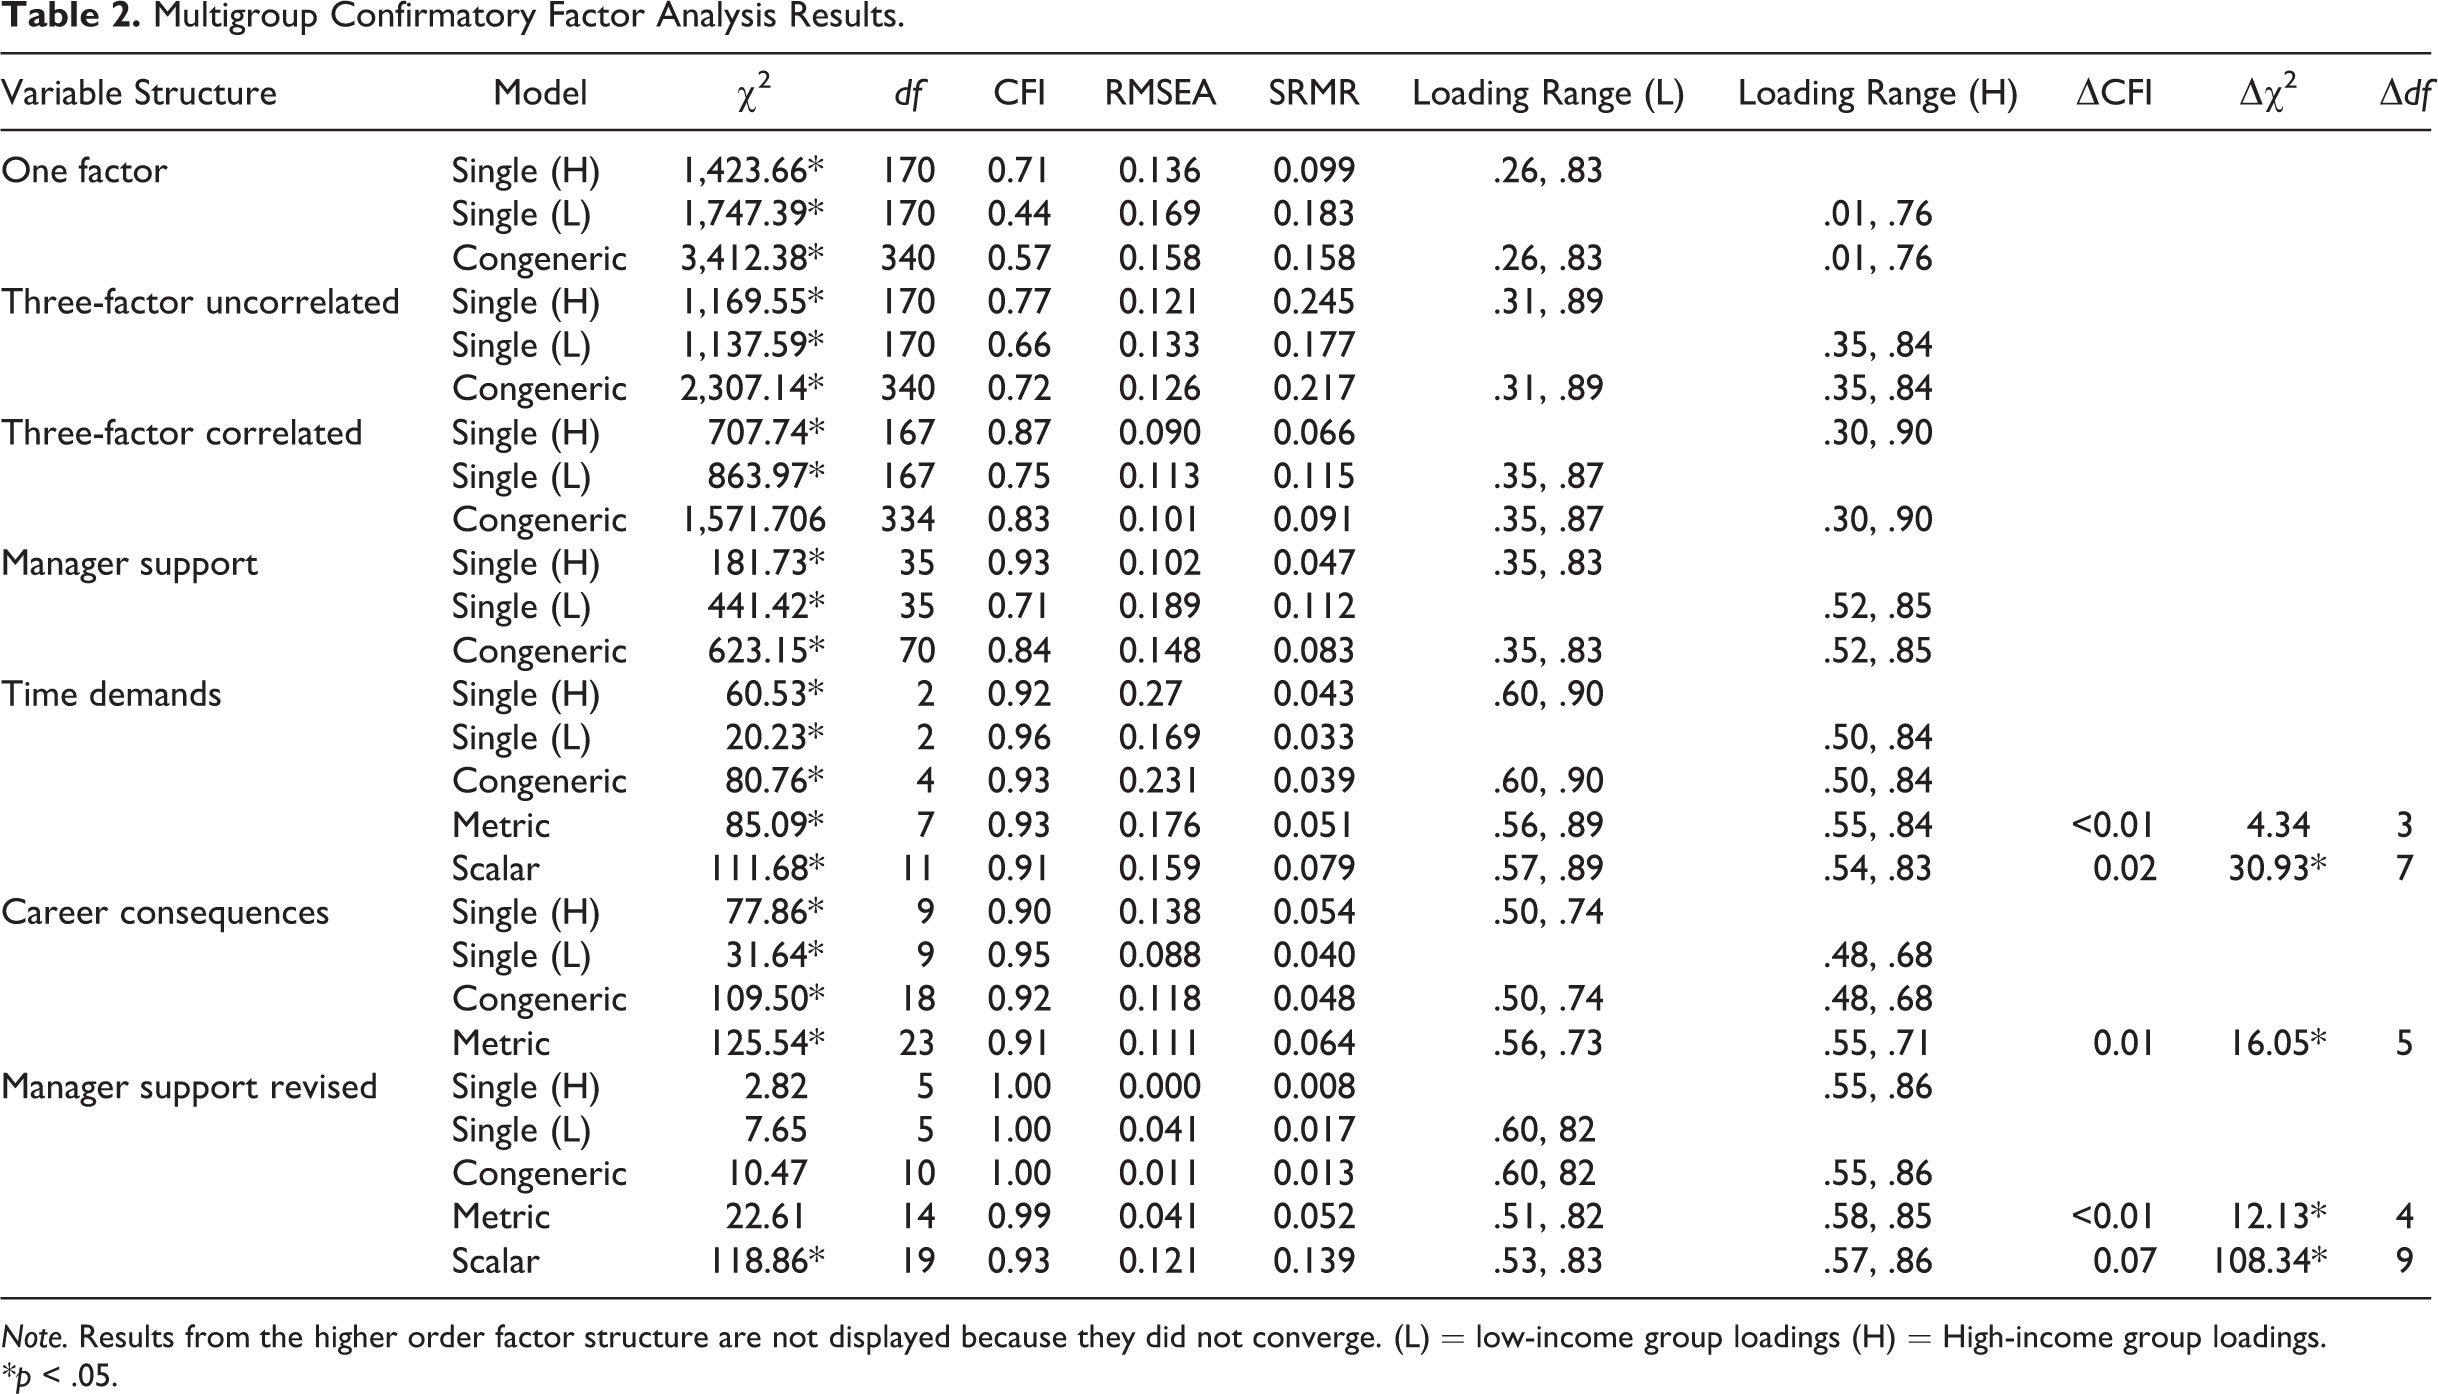
Note. Results from the higher order factor structure are not displayed because they did not converge. (L) = low-income group loadings (H) = High-income group loadings.
*p < .05.
From these tests, we can conclude the a priori measurement structure for the work–family culture measure did not hold for either group. However, when examining each facet separately, we found for at least one group, the items adequately loaded onto their appropriate construct. Thus, we focused on the lower level factors separately when testing for measurement invariance.
For measurement invariance, we used a sequential approach (Meredith, 1993; Meredith & Teresi, 2006). This approach first establishes measurement models that are appropriate for each group, as in the previous step. Next, a series of multiple group CFAs are used to estimate overall model fit for the measurement model across both groups. The first model, the configural model, estimates the same factors for each group but allows the loadings, intercepts, and errors to vary across groups. Next, the metric model is run in which the same factors are identified for each group and loadings are constrained to be equal across group; item intercepts and errors are allowed to vary across groups. Finally, the scalar invariance model is run in which the same factors are identified for each group and both loadings and intercepts are constrained to be equal across groups; errors are allowed to vary across groups. A significant decrease in the χ2 model fit statistic from the configural model to the more restrictive models (metrics, scalar) indicates a lack of measurement invariance (Cheung & Rensvold, 2002). Because χ2 tests are sensitive to sample size (Meade, Johnson, & Braddy, 2008), we also considered change in CFI, which is robust to sample size. A CFI difference of >.01 is considered evidence for lack of invariance (Cheung & Rensvold, 2002). When χ2 indicated significant change but CFI did not, we interpreted the results as showing equivalence across groups to avoid Type I error. We do, however, interpret these mixed findings with caution. Results are shown in Table 2.
Managerial support
When examining CFAs for each group separately, the managerial support facet demonstrated adequate fit for the high-income group (CFI = 0.93, RMSEA = .10, SRMR = .047) and did not fit well for the low-income group (CFI = 0.71, RMSEA = .19, SRMR = .11). The congeneric model did not fit well (CFI = 0.84, RMSEA = .15, SRMR = .08), due to CFI, RMSEA, and SRMR values less than the acceptable model cutoffs (Hu & Bentler, 1999). Because the congeneric model did not meet acceptable fit cutoffs, we conclude the measurement model for managerial support is not equivalent across low- and high-income groups.
Organizational time demands
When examining individual group CFAs, the organizational time demands facet also demonstrated adequate fit for both groups (low-income CFI = 0.96, RMSEA = .17, SRMR = .03; and high-income CFI = 0.92, RMSEA = .27, SRMR = .04). The congeneric model indicated less than adequate fit, as CFI and SRMR were in the acceptable range, but RMSEA was not (CFI = 0.93, RMSEA = .23, SRMR = .04). Because CFI and SRMR were acceptable, we continued to test for invariance in the factor loadings. When constraining factor loadings to be equal across groups to test metric invariance, there was no significant decrease in χ2, Δχ2(3) = 4.34, p > .05, nor decrease in CFI greater than .01 (ΔCFI < .01). Thus, we conclude loadings were equivalent across groups. When further constraining item intercepts to be equivalent (i.e., scalar invariance), there was a significant decrease in model fit compared to the congeneric model, Δχ2(7) = 30.93, ΔCFI = 0.02. We conclude that the factor structure and factor loadings for organizational time demands are equivalent across low- and high-income groups; however, item intercepts are not equivalent.
Career consequences
Finally, separate CFAs for career consequences demonstrated good fit in the low-income group (CFI = 0.95, RMSEA = .09, SRMR = .04) and poorer fit for the high-income group (CFI = 0.90, RMSEA = .14, SRMR = .05). The congeneric model yielded adequate fit, as CFI and SRMR were in the acceptable range, although RMSEA was not (CFI = 0.92, RMSEA = .12, SRMR = .05). Factor structure was therefore deemed equivalent across groups. When constraining the factor loadings to be equal (i.e., metric invariance), there was a statistically significant change in model fit, Δχ2(5) = 16.05, but the change in CFI was small, indicating practical equivalence (ΔCFI = 0.01). Because evidence for factor loading equivalence was practically supported, we continued testing scalar invariance. The scalar invariance model was again statistically, Δχ2(11) = 23.94, but not practically (ΔCFI = 0.01) different from the congeneric model, indicating mixed evidence for equivalence of item intercepts.
Measurement invariance conclusions
Across all invariance tests, there is mixed evidence for loading equivalence across groups. Factor loadings were invariant for time demands, mixed results were found for career consequences, and factor loadings were not equivalent for managerial support. Factor loading invariance must be met in order to compare relationships between a construct and correlates across groups (Meredith & Teresi, 2006). Lack of factor loading invariance for managerial support therefore precludes comparing correlation coefficients for work–family culture across low- and high-income groups. Item intercepts were not equivalent for all facets. Consequently, work–family culture means are not comparable across groups, as the same mean represents different levels of the construct for each group (Meredith & Teresi, 2006).
Correlation and Differential Prediction
To test Hypothesis 1, we examined correlations between work–family culture and the correlates using SPSS (Version 22.0; IBM Corp, 2013; Table 3). Hypothesis 1 received overall support in that most relationships were in the expected direction and significant for both groups.
Means, Standard Deviations, and Correlation Matrix of the Variables Used in the Differential Prediction Analyses.
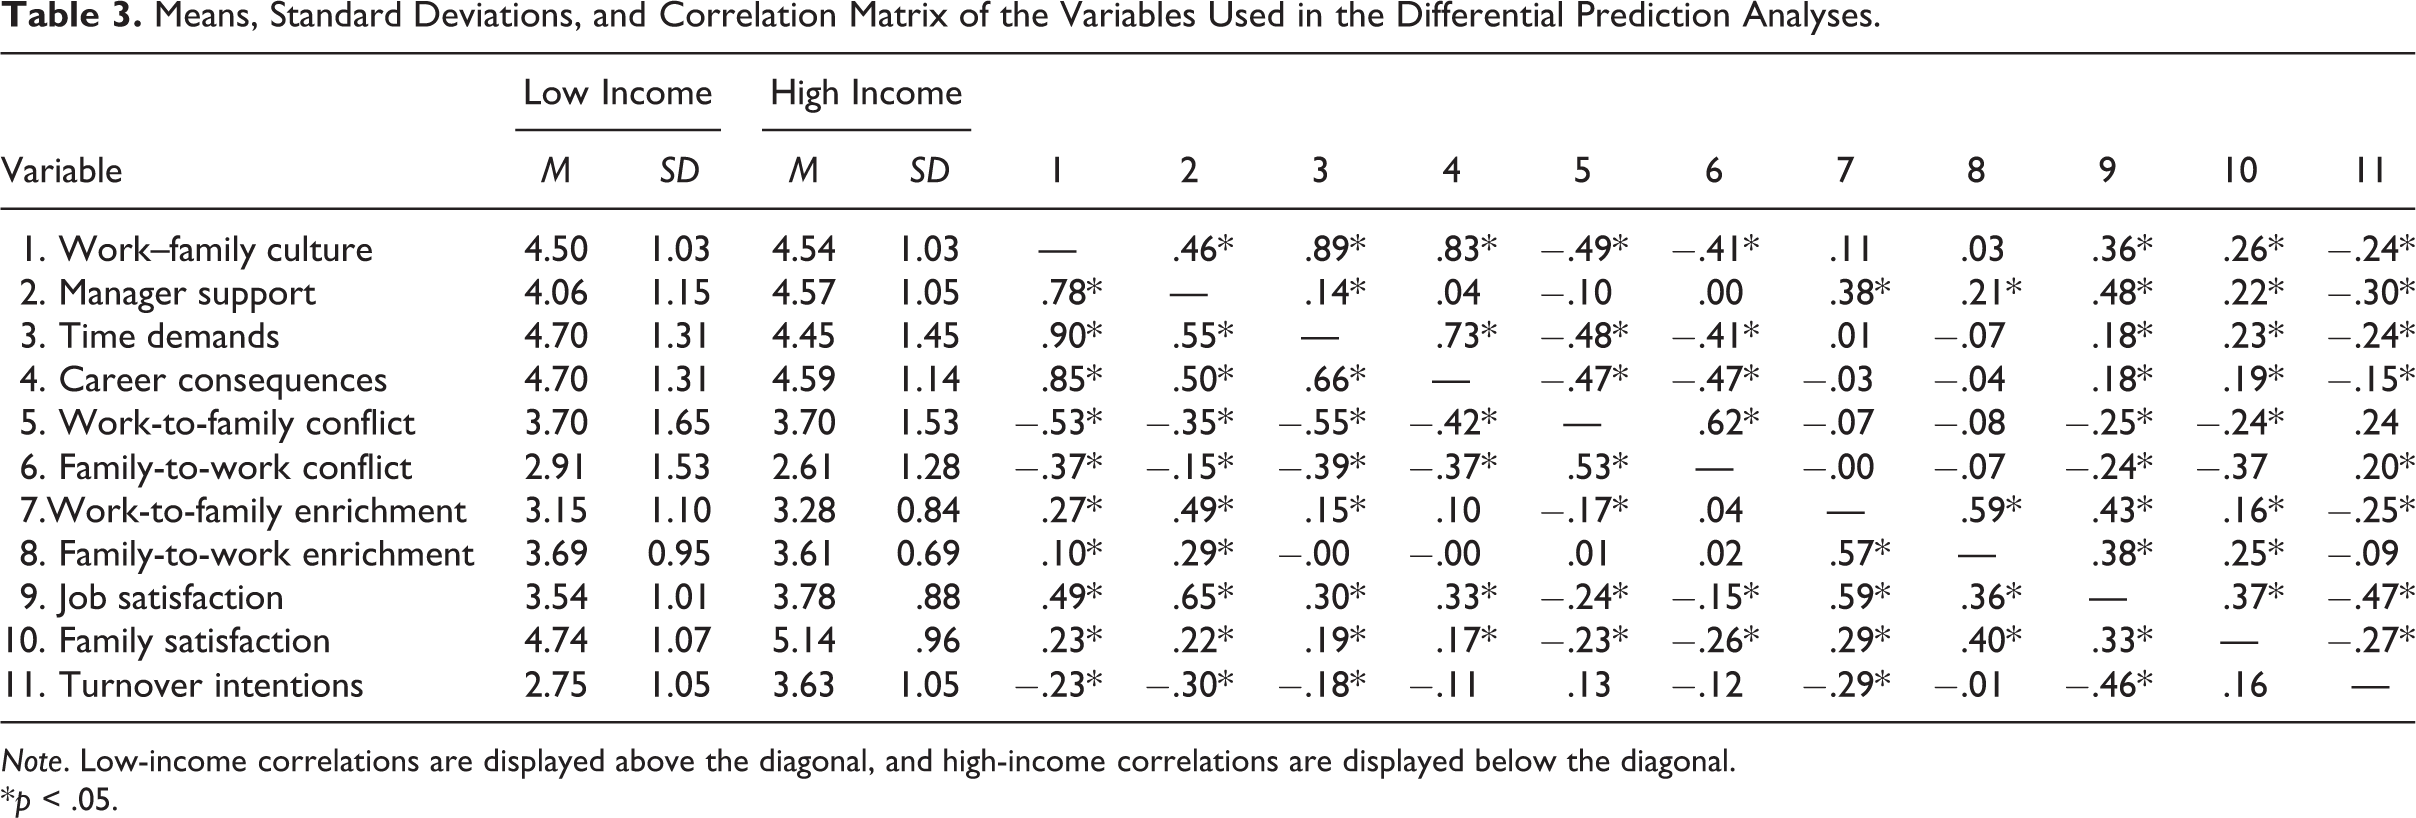
Note. Low-income correlations are displayed above the diagonal, and high-income correlations are displayed below the diagonal.
*p < .05.
To test Hypothesis 2, we used differential prediction. Differential prediction (Lautenschlager & Mendoza, 1986) is a procedure to test for bias in psychological measurement. This approach uses multiple regression to determine if bias exists, and if so, if the bias is due to differences in group intercepts or slope. First, Model 1 tests the null where only the predictor (work–family culture) is entered into the regression equation predicting a relevant outcome (one of the five correlates). Model 1 is compared to Model 2 which includes the predictor (work–family culture), group (low- vs. high-income sample), and interaction term (work–family culture by low- vs. high-income group). A significant change in variance explained indicates there is bias due to group membership. If evidence for bias exists, further comparisons are made to determine whether bias is due to group differences in slope, intercept, or both. To determine whether bias is due to differences in intercept, Model 3 (includes predictor and interaction term) is compared to Model 2. To determine whether bias is due to differences in slope, Model 4 (includes the predictor and group term) is compared to Model 2. Hypotheses 2a–2e are supported if there are significant differences in slope, and the low-income slope is weaker than the high-income slope. Although we did not explicitly hypothesize intercept differences, these were also explored as bias sources.
We recognize that because the managerial support and career consequences facets did not meet congeneric or metric invariance, it is problematic to compare group relationships using these measures. However, we continue with these analyses to demonstrate how results may be biased. As discussed in the literature review, we also believe lack of equivalence is due to measurement contamination and deficiency, which should influence differential prediction of outcomes. Therefore, differential prediction should be a related symptom of the underlying issue, namely, inappropriate measurement of low-income work–family culture.
Table 4 contains the results from the differential prediction analyses. Bias due to differential group slopes was significant for the relationships between manager support and both WIF and job satisfaction and between career consequences and job satisfaction. In each case, the relationship between the work–family culture facet and correlate was weaker for the low-income group compared to the high-income group. Hypothesis 2 therefore received some support, in that managerial support and career consequences facets of work–family culture demonstrated weaker relationships with job satisfaction, and managerial support demonstrated a weaker relationship with WIF for the low-income group in comparison to the high-income group. All other relationships showed no significant difference in slope.
Differential Prediction Regression Results.
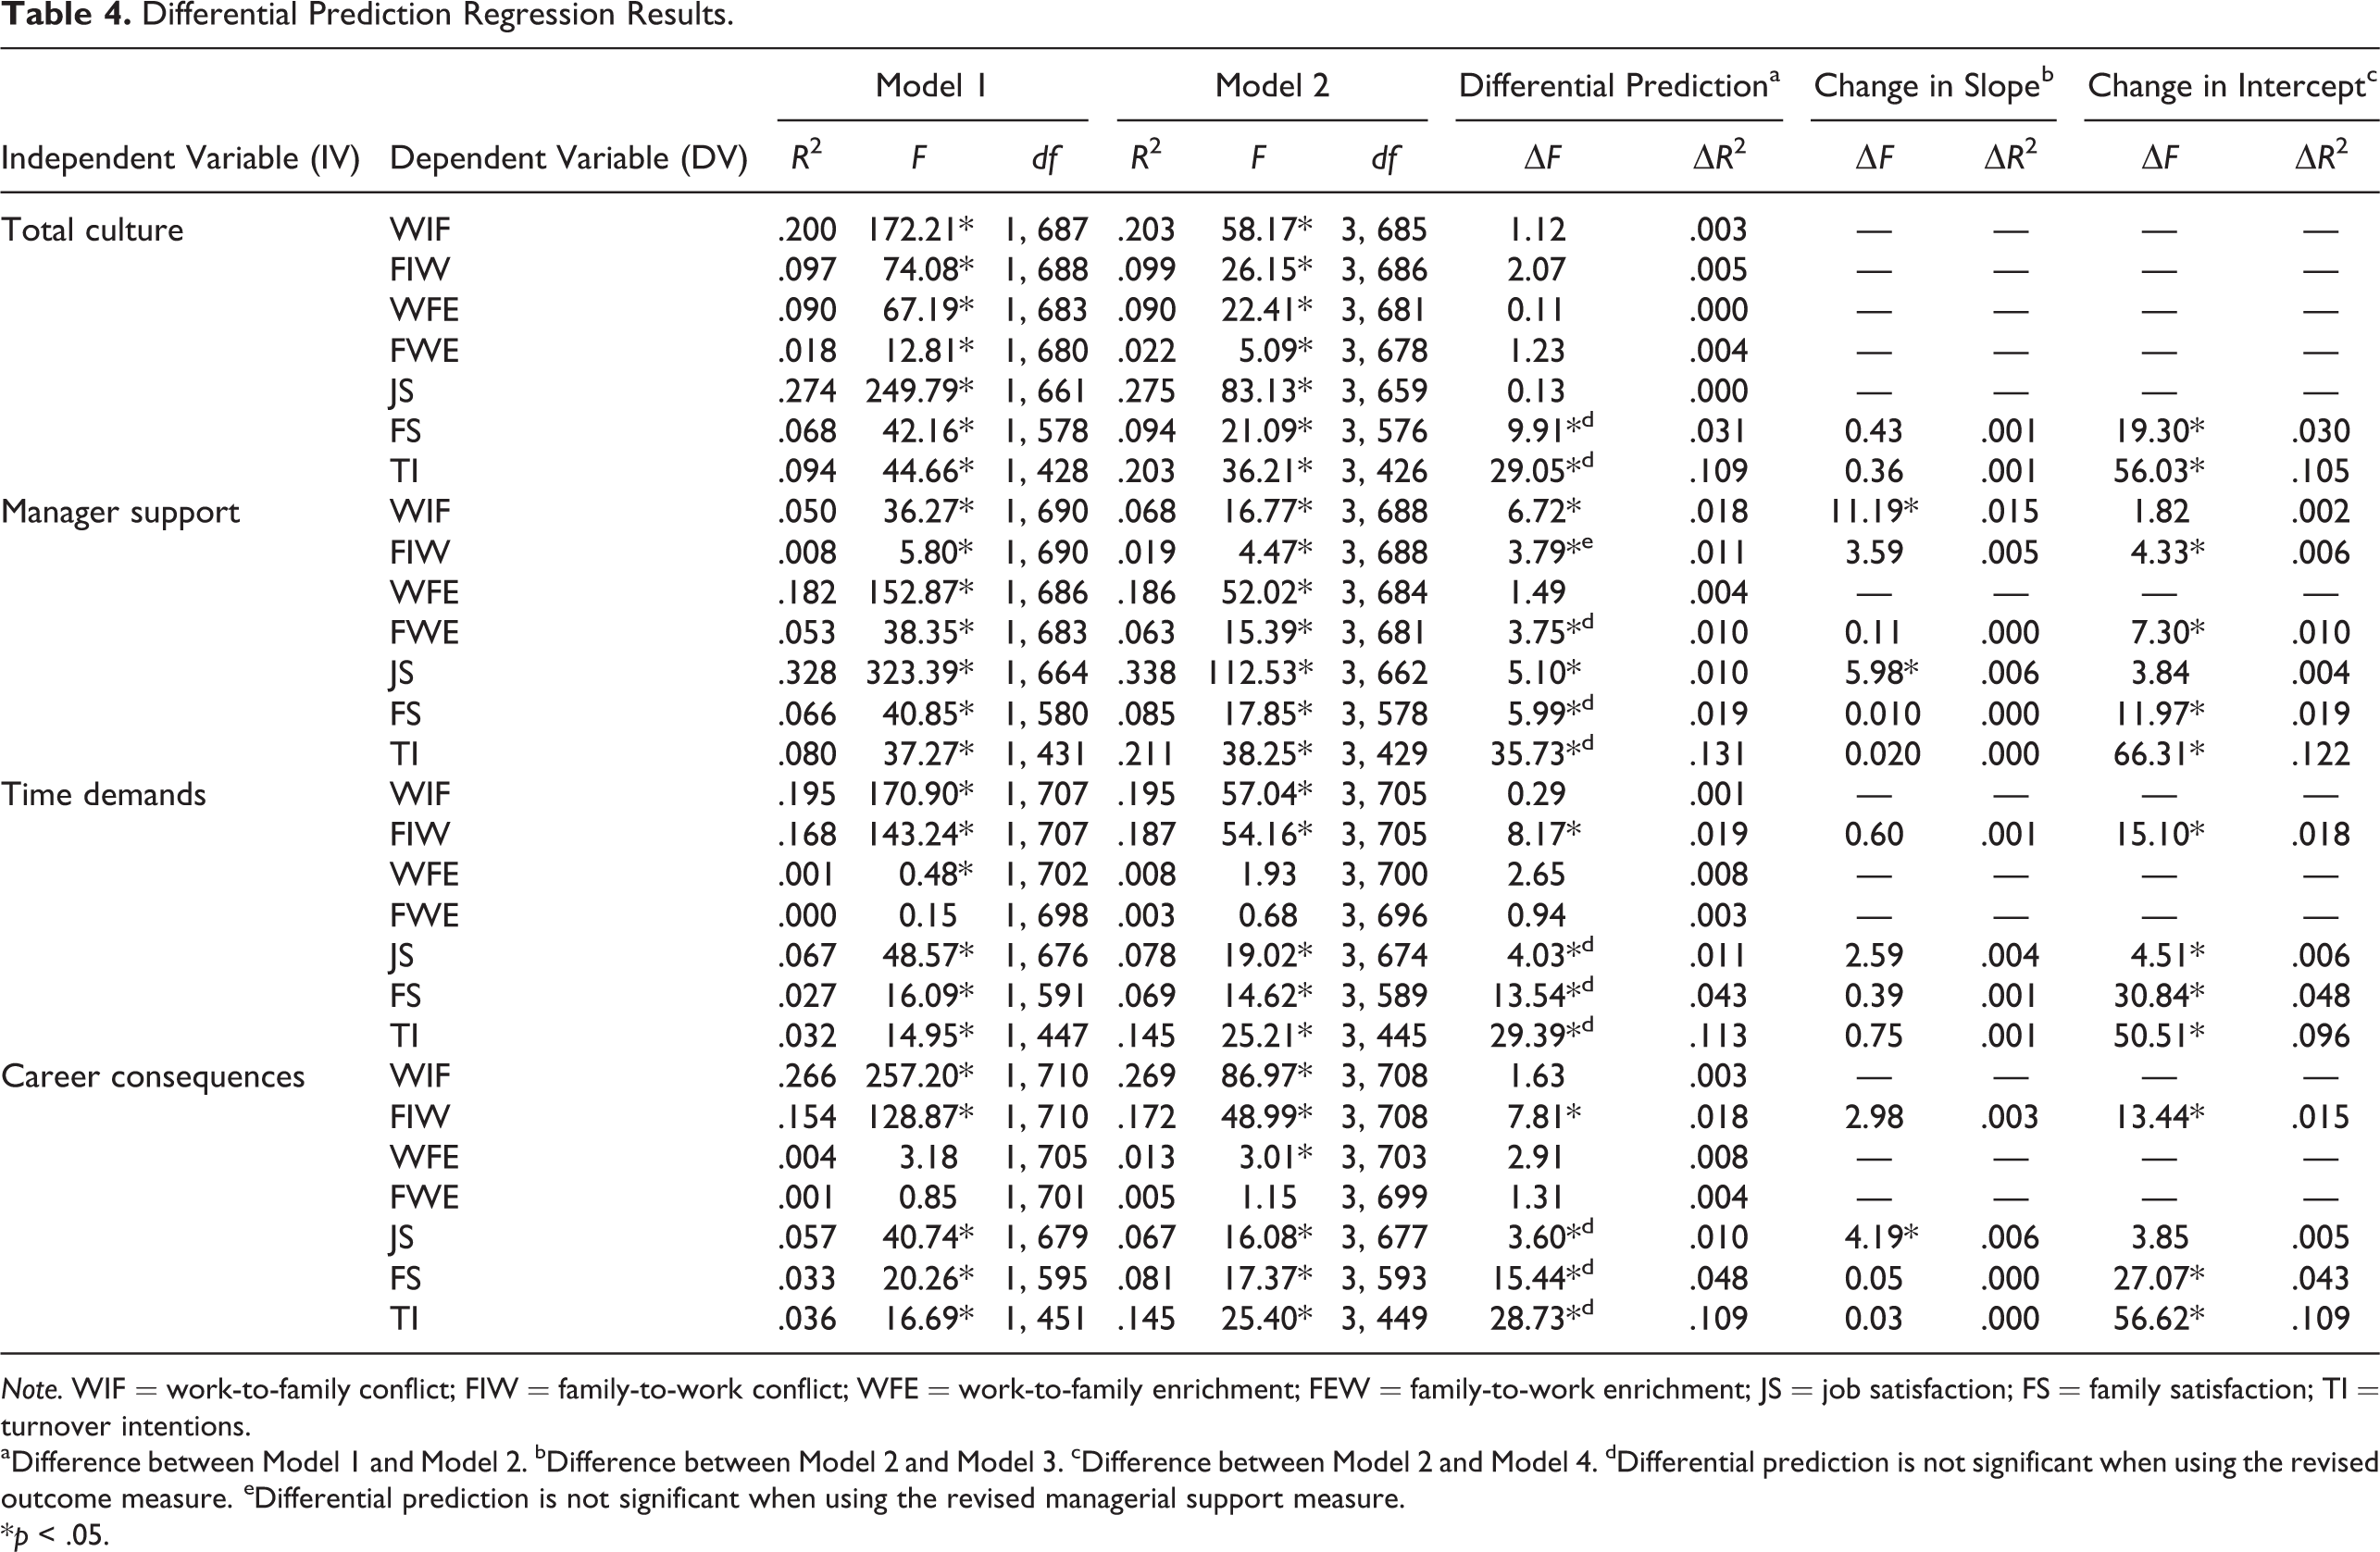
Note. WIF = work-to-family conflict; FIW = family-to-work conflict; WFE = work-to-family enrichment; FEW = family-to-work enrichment; JS = job satisfaction; FS = family satisfaction; TI = turnover intentions.
aDifference between Model 1 and Model 2. bDifference between Model 2 and Model 3. cDifference between Model 2 and Model 4. dDifferential prediction is not significant when using the revised outcome measure. eDifferential prediction is not significant when using the revised managerial support measure.
*p < .05.
Work–family culture facets consistently demonstrate bias when predicting FIW, job satisfaction, family satisfaction, and turnover intentions. Biases are due to differences in intercepts, indicating predicted outcome means differ based on income group. Work–family culture facets underpredict FIW (ΔR 2 ranged from .01 to .02, p < .05), family satisfaction (ΔR 2 ranged from .019 to .048, p < .05), and turnover intentions (ΔR 2 ranged from .10 to .12, p < .05) within the low-income sample. In addition, managerial support shows bias due to intercept difference for FWE, and time demands demonstrated bias due to intercept differences for job satisfaction; however, it should be noted the effect sizes were small (ΔR 2 = .01 and ΔR 2 = .01, respectively). General work–family culture also underpredicted family satisfaction (ΔR 2 = .03, p < .05) and turnover intentions (ΔR 2 = .11, p < .05) for the low-income group.
Post Hoc Exploratory Analyses
After testing the hypothesized relationships, we were left with two questions. First, is there a portion of the managerial support measure that demonstrates invariance? Finding an invariant solution may be helpful for those who want to use the work–family culture measure. Using an equivalent measure would also allow us to test the robustness of the differential prediction results. Second, is the measurement of each outcome equivalent across groups, and if not, is lack of measurement equivalence in the outcomes driving income group differences? The correlate measures were purposefully chosen because they are widely used throughout the organizational sciences literature, albeit rarely for exclusive focus on minority samples (for exceptions, see Griggs et al., 2013; Lankau & Scandura, 1996). Meta-analyses and primary studies that include these measures often use eclectic samples or professional workers (e.g., Carlson, Kacmar, Wayne, & Grzywacz, 2006; Netemeyer et al., 1996). The nomological net among these variables is established; positive constructs (job/family satisfaction, work–family enrichment) are negatively related to negative constructs (turnover intentions, work–family conflict; e.g., Amstad, Meier, Fasel, Elfering, & Semmer, 2011). Measurement invariance in the outcomes could expand our understanding measurement equivalence across income groups. Furthermore, establishing correlate equivalence would rule out the alternate explanation that differential prediction findings may be due to problematic correlate measurement.
To address the first question, we ran exploratory factor analysis using principle axis factoring with geomin rotation on the managerial support items for each income group. The high-income group generated a one-factor model, χ2(34) = 137.19, p < .01, CFI = 0.96, Tucker–Lewis index (TLI) = .93, RMSEA = .087, SRMR = .031, whereas the low-income group generated a three-factor model, χ2(25) = 39.08, p = .04, CFI = 0.99, TLI = .98, RMSEA = .042, SRMR = .020. Five items were chosen for the revised managerial support measure (Table 1). These items assessed ease of work–family balance, talking about family at work, sensitivity to employee family concerns, and accommodation of family-related needs. Items loaded highly for both groups on the first facet (greater than .55) and were conceptually appropriate for each income group.
We tested measurement invariance on the revised 5-item managerial support measure. Congeneric invariance (CFI = 1.00, RMSEA = .011, SRMR = .013) and metric invariance, Δχ2(4) = 12.13, p > .05, ΔCFI = 0.006, were supported, indicating equivalent factor structure and loadings across groups. However, scalar invariance was not supported, Δχ2(9) = 108.34, p < .05, ΔCFI = 0.07; Table 2, indicating item intercepts were not equivalent across groups. Thus, for the Revised Managerial Support Scale, relationships between work–family culture and correlates are comparable across low- and high-income groups. However, mean levels of work–family culture are not comparable. Differential prediction results using this 5-item measure remained the same, with the exception of FIW which no longer showed group differences (Table 4).
To address the second question, we explored the extent that outcome measures are invariant across groups. We found work–family conflict and work–family enrichment demonstrated configural, work–family conflict: χ2(68) = 323.62, p < .05, CFI = 0.96, RMSEA = .102, SRMR = .048; work–family enrichment: χ2(256) = 704.86, p < .05, CFI = 0.96, RMSEA = .097, SRMR = .046, and metric invariance, work–family conflict: Δχ2(8) = 11.17, p > .05, ΔCFI = 0.001; work–family enrichment: Δχ2(12) = 21.39, p > .05, ΔCFI = 0.001. Although scalar invariance tests showed statistically significant decrease in fit, the practical difference in fit was small, work–family conflict: Δχ2(16) = 36.66, p < .05, ΔCFI = 0.004; work–family enrichment: Δχ2(30) = 78.78, p < .05, ΔCFI = 0.004. Thus, we conclude work–family conflict and work–family enrichment have equivalent factor structures and loadings, but only partial support for equivalent intercepts across high- and low-income groups. Family satisfaction and turnover intentions met configural invariance, χ2(16) = 88.24, p < .05, CFI = 0.92, RMSEA = .112, SRMR = .067, but not metric invariance, Δχ2(4) = 5,543, p < .05, ΔCFI = 0.059. These results show family satisfaction and turnover intentions factor loadings are not equivalent across groups. Finally, job satisfaction did not meet configural invariance, χ2(340) = 1,862.19, p < .05, CFI = 0.79, RMSEA = .112, SRMR = .066.
To test the possibility that differential prediction may have been due to invariance issues in the outcomes, we revised these measures to achieve configural and metric invariance. We removed the reverse-coded family satisfaction and turnover intentions items, and we selected the 8 job satisfaction items with sufficient loadings (>.70). When using the revised scales, all differential prediction results became nonsignificant with the exception of managerial support predicting job satisfaction (Table 4).
Discussion
The current study examined the equivalence of work–family culture across low- and high-income groups. Our results suggest the Thompson et al. (1999) measure is not appropriate for assessing work–family culture among low-income populations. Measurement invariance tests reveal each facet of work–family culture is not equivalent across income groups, and manager support showed the most egregious violation of equivalence. It is unlikely managerial support as a construct is irrelevant across groups, given its benefits. It may be that indicators of managerial support differ for low- and high-income workers due to differences in scheduling and control (Lambert et al., 2012; Swanberg et al., 2008). Managerial support for low-wage workers may come in the form of early notification of schedules, consistent scheduling, and supplying a sufficient number of hours (Lambert, 2009); none of these are represented in the current scale. A subset of managerial support items demonstrated commensurability, showing a more commensurate measure is possible with careful selection of items. However, caution is needed, as our data do not address criterion deficiency.
In addition to lack of commensurability, managerial support demonstrated weaker relationships with work–family conflict and job satisfaction correlates for the low-income group in comparison with the high-income group. Lack of commensurability, contamination, and deficiency may account for these weaker relationships. These results remained even after revising managerial support and outcome measures to items that were commensurate. We therefore conclude managerial support as currently measured may be a relatively weak predictor of work–family conflict and job satisfaction for low-income workers, and consequently research and theory supporting these relationships may be limited to high-income workers.
Although career consequences and organizational time demands demonstrated equivalent measurement structure and loadings across income groups, both showed evidence for lack of intercept invariance, rendering means incomparable. Again, these findings are consistent with the expectation that many of the items are conceptually inappropriate for the design of low-wage work. In addition, the differential prediction results indicated career consequences and organizational time demands both underpredicted FIW, job satisfaction, family satisfaction, and turnover intentions. However, because these facets demonstrated lack of intercept invariance across groups, we caution interpreting results as true differences in the construct levels predicted by work–family culture facets across groups. We also note that the differential prediction results may be due in part to incommensurability in the outcomes tested, as many of our differential prediction results were nonsignificant when using the revised commensurate outcome measures.
Implications
The results indicate Thompson et al.’s (1999) work–family culture measure is not comparable across income groups. We argue this is due to the inapplicability of items to low-income workers. Low-income workers are distinct from higher income workers in that they tend to work shift positions, are more likely to depend on informal support, are less career focused, and have a relative dearth of resources (e.g., Bromer & Henly, 2009; Lambert et al., 2012; Swanberg et al., 2011). Researchers should therefore use caution when comparing study findings, particularly means, from socioeconomically diverse samples. Moving forward, researchers might consider alternative variables when developing theory and studies focusing on work–family support within low-income groups.
When using Thompson’s Work–Family Culture Scale across high- and low-income populations, we recommend practitioners and researchers use the invariant items identified in our study. Further, vocational measures should be scrutinized, especially if only validated and used within a specific population. We recommend at least reviewing items for conceptual applicability for the intended sample to identify and possibly remove inappropriate items. We also recommend piloting items and testing measurement invariance when working with diverse samples. If looking to capture a similar construct to work–family culture for low-income workers, practitioners and researchers may consider measures such as scheduling control (e.g., Swanberg et al., 2011) or informal supervisor support (e.g., Hammer et al., 2009).
Limitations and Future Recommendations
This study is limited in a few notable ways. First, our sampling strategies may raise concerns about generalizability. However, because low-income individuals are difficult to obtain, community events and snowball sampling were necessary to gain access and consistent with other research on low-income samples (e.g., Griggs et al., 2013). To mitigate data quality concerns, eligibility questions were screened to ensure participants were working, had family responsibilities, and met the income requirements for their respective groups. Finally, studies show Qualtrics samples are comparable to alternative sampling methods (Gosling, Vazire, Srivastava, & John, 2004).
Second, the 5-item Revised Managerial Support Scale was not cross-validated with an additional sample. The purpose of this revised scale was to identify if an invariant measure could be derived from the original scale, and to see if rectifying invariance of the predictor would alter differential prediction results. Future research should replicate the revised scale.
Third, we used a cutoff to create income groups. Although the use of household income is conceptually appropriate for differentiating low- and high-income workers, we recognize samples also reflect differences in ethnic and cultural background, job types, and socio-economic status. Although we could statistically control for such factors, these controls would confound true variability due to income, muddying interpretation of group differences. We also did not directly measure factors such as cultural values, scheduling issues, lack of control, or coworker support that were discussed as possible explanations for the results. We believe these differences represent critical complexities inherent in cross-income comparisons that warrant future attention.
Fourth, the data are cross-sectional and therefore conclusions about causality are not warranted. Fifth, the data are self-report, which increase the likelihood of single-source bias. However, the study purpose of investigating measurement invariance warranted using a single source, and single-source bias cannot account for lack of measurement equivalence.
As a final point, the results raise concerns as to the equivalence of alternative measures. We found work–family conflict and enrichment measures were equivalent, but job satisfaction, family satisfaction, and turnover intentions were not. We note the family satisfaction and turnover intentions measures had low reliability and therefore some caution should be used when interpreting these results. Future research should investigate invariance of alternative measures and avoid assuming measure interpretation is the same for individuals across different contexts (e.g., income, job design).
Conclusion
Our ability to advance work and family scholarship and to promote impactful practice is limited by the appropriateness of our measurement tools. The underlying impetus of the current study was the concern that existing measures of work and family constructs may be insufficient because of the reliance on white-collar professional workers during development, validation, and subsequent research. Our assessment of Thompson et al.’s (1999) measure of work and family culture reveals that such concerns are warranted, at least as it pertains to low-income workers. We urge organizational scholars to carefully consider measurement equivalence when examining different groups, especially those based on income.
Footnotes
Acknowledgments
The authors wish to thank Matt Riggs and Janelle Gilbert for their helpful comments in the early development of this project, as well as Catholic Charities of San Bernardino and Riverside Counties, Community Action Partnership of San Bernardino County, and the Agars Lab research assistants who helped to collect data. We also wish to thank Marcus Butts for his insightful guidance regarding the study analyses.
Declaration of Conflicting Interests
The author(s) declared no potential conflicts of interest with respect to the research, authorship, and/or publication of this article.
Funding
The author(s) disclosed receipt of the following financial support for the research, authorship, and/or publication of this article: This research was supported in part by the Sunshine Education and Research Center at the University of South Florida. The Center is supported by Training Grant No. T42-OH008438 from the Centers for Disease Control and Prevention/National Institute for Occupational Safety and Health (NIOSH).