
Abstract
Objectives
To evaluate the application of different tube voltages and image-reconstruction algorithms in paranasal-sinus computed tomography (CT) and optimizes the scanning protocols for paranasal-sinus CT while balancing between image quality and radiation dose.
Methods
Ninety patients were randomly divided into three groups (A, B, and C). Group A used conventional scanning parameters: tube voltage of 120 kVp, tube current uDose level 1, and the Karl iterative reconstruction algorithm. Groups B and C used tube voltages of 100 and 80 kVp, respectively, and tube current uDose level 1. The Karl iterative reconstruction algorithm and artificial intelligence iterative reconstruction (AIIR) algorithm were used. Optimal image reconstruction noise levels were selected for each group, and the image quality and radiation doses of the best images were statistically analyzed.
Results
The best image reconstruction noise levels for Groups A, B, and C were Karl level 5, AIIR level 5, and AIIR level 4, respectively. The signal-to-noise ratio, contrast-to-noise ratio, figure of merit, and subjective score values of the images in Groups B (AIIR level 5) and C (AIIR level 4) were higher than those in Group A (Karl level 5). The patients from Groups B and C had the CT dose-index volume, dose-length product, and size-specific dose estimate based on the water-equivalent diameter that were 68.86%, 71.76%, 69.84%, 84.39%, 85.95%, and 85.50% lower, respectively, than those of Group A (P < 0.001).
Conclusions
A low tube voltage combined with the AIIR algorithm effectively improves image quality and decreases the radiation doses for patients undergoing paranasal-sinus CT. The optimal parameters for paranasal-sinus CT are 80 kVp, uDose level 1, and AIIR level 4.
Keywords
Introduction
Owing to their specific anatomical structure and physiological characteristics, the paranasal sinuses are highly susceptible to inflammatory lesions and other diseases. 1 Computed tomography (CT) offers clear and precise imaging of the sinuses, including detailed visualizations of the mucosa, surrounding tissues, and sinus-wall bone, from multiple orientations and angles. 2 Therefore, CT is widely used in clinical practice. However, the scanning range of paranasal-sinus CT includes organs that are highly sensitive to ionizing radiation, such as the crystalline lens and salivary glands, which raises concerns regarding the associated risks of radiation exposure. 3 Consequently, multiple researchers have attempted to reduce the radiation dose of paranasal-sinus CT examinations while still guaranteeing image quality. 4
The Karl iterative reconstruction (IR) algorithm overcomes the limitations of the traditional filtered back projection (FBP) algorithm in terms of image noise and artifacts, and it can effectively reduce image noise caused by the low tube voltage. 5 However, if the noise level of the Karl iterative reconstruction algorithm is excessively high, the noise distribution in the original data may be altered, which could affect the image texture, decrease the image spatial resolution, and cause details to be lost. These phenomena would adversely affect the image quality and thereby result in leakage and misdiagnoses. 6 The artificial intelligence iterative reconstruction (AIIR) algorithm employs a convolutional neural network-based deep learning (DL) model to replace the regularization term used in the model-based iterative reconstruction (MBIR) algorithm. 7 By leveraging the powerful data learning capabilities of the DL model, AIIR minimizes the loss function during the iterative reconstruction process to reduce the error, approximate the original signal or image, and quickly and effectively reduce the image noise. 8 The AIIR algorithm has currently demonstrated significant application value in areas of research such as thoracic, abdominal and vascular computed tomography angiography.9–12 However, the AIIR algorithm involves 1–5 noise levels with different levels of noise-reduction and image-processing abilities. The optimal noise level may vary for different parts of the human body as well as specific scanning conditions.
This study explores the impacts of various tube voltages and image reconstruction algorithms in paranasal-sinus CT to identify the optimal scanning parameters that minimize the associated radiation dose while meeting clinical diagnostic requirements.
Materials and methods
General information
We prospectively enrolled 90 patients (46 males and 44 females) who underwent paranasal-sinus CT examinations at our institution between April and July 2024. The patients were randomly divided into three groups (A, B, and C) of 30 patients each.
The inclusion criteria were as follows.
Clinical symptoms, such as recurrent nasal congestion, runny nose, sinus pressure, and pain. Patients who required a CT examination in conjunction with their medical history and a physical examination.
The exclusion criteria were as follows.
Age < 18 years. Unconsciousness, agitation, or an inability to cooperate.
The study was approved by the ethics committee of our hospital (Approval No. HDFYLL-KY-2024-029), and all patients or their immediate family members have signed an informed-consent form.
CT acquisition and image reconstruction
All patients underwent a 320-row spiral CT (uCT968, United Imaging Healthcare, Shanghai, China) to complete the paranasal-sinus CT examination. They lay in the supine position, and the scanning range was from the top of the frontal sinus to the bottom of the maxillary sinus. Table 1 lists the scanning parameters and image-reconstruction algorithms for the three patient groups.
CT scan and reconstruction parameters of the three groups of patients.
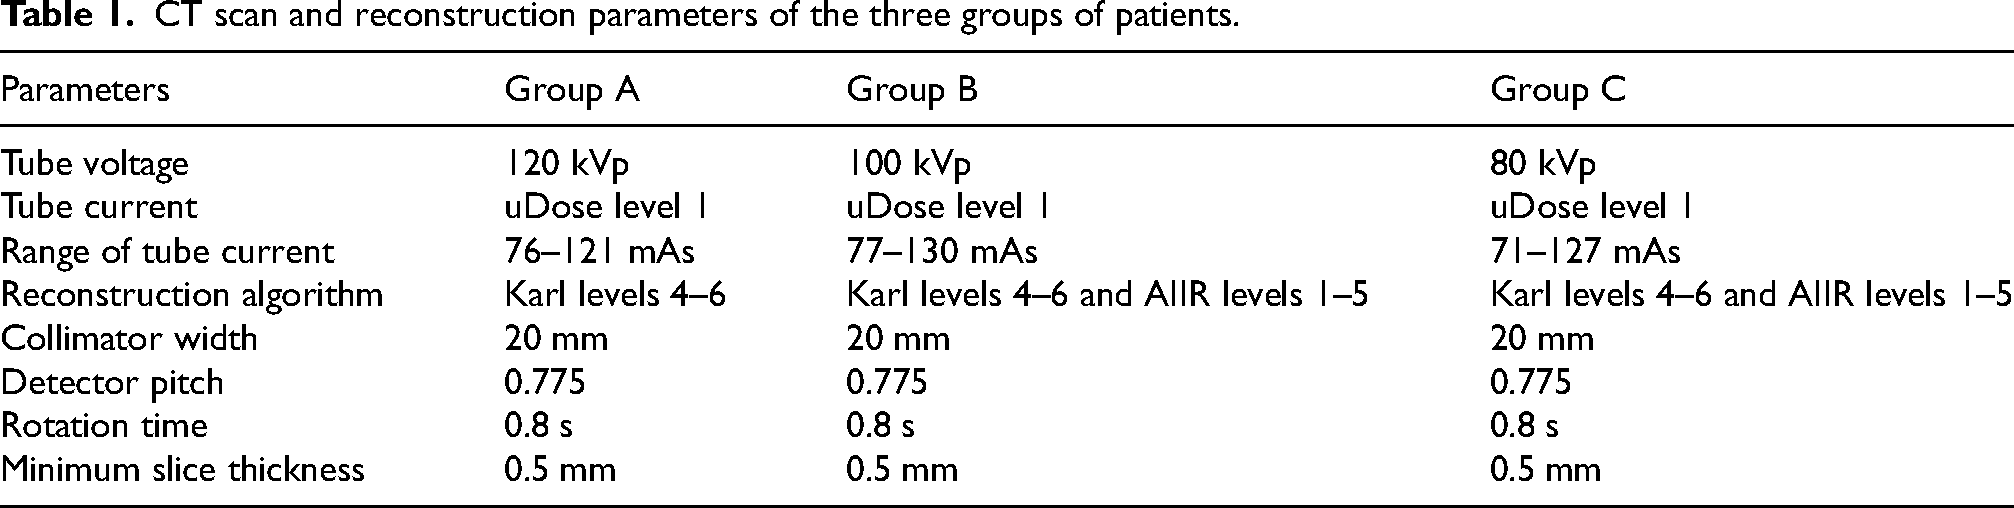
Image quality evaluation
Objective evaluation of image quality
A circular region of interest (ROI) with an area of 10 mm2 was placed at the centre of the nasopharyngeal cavity, and its CT value was measured. The standard deviation (SD) of the CT value was considered to represent the noise value. ROIs of the same size were placed in the bilateral inferior turbinate mucosa and bilateral infratemporal fossa fat3,4 to access the CT and noise values, as shown in Figure 1.
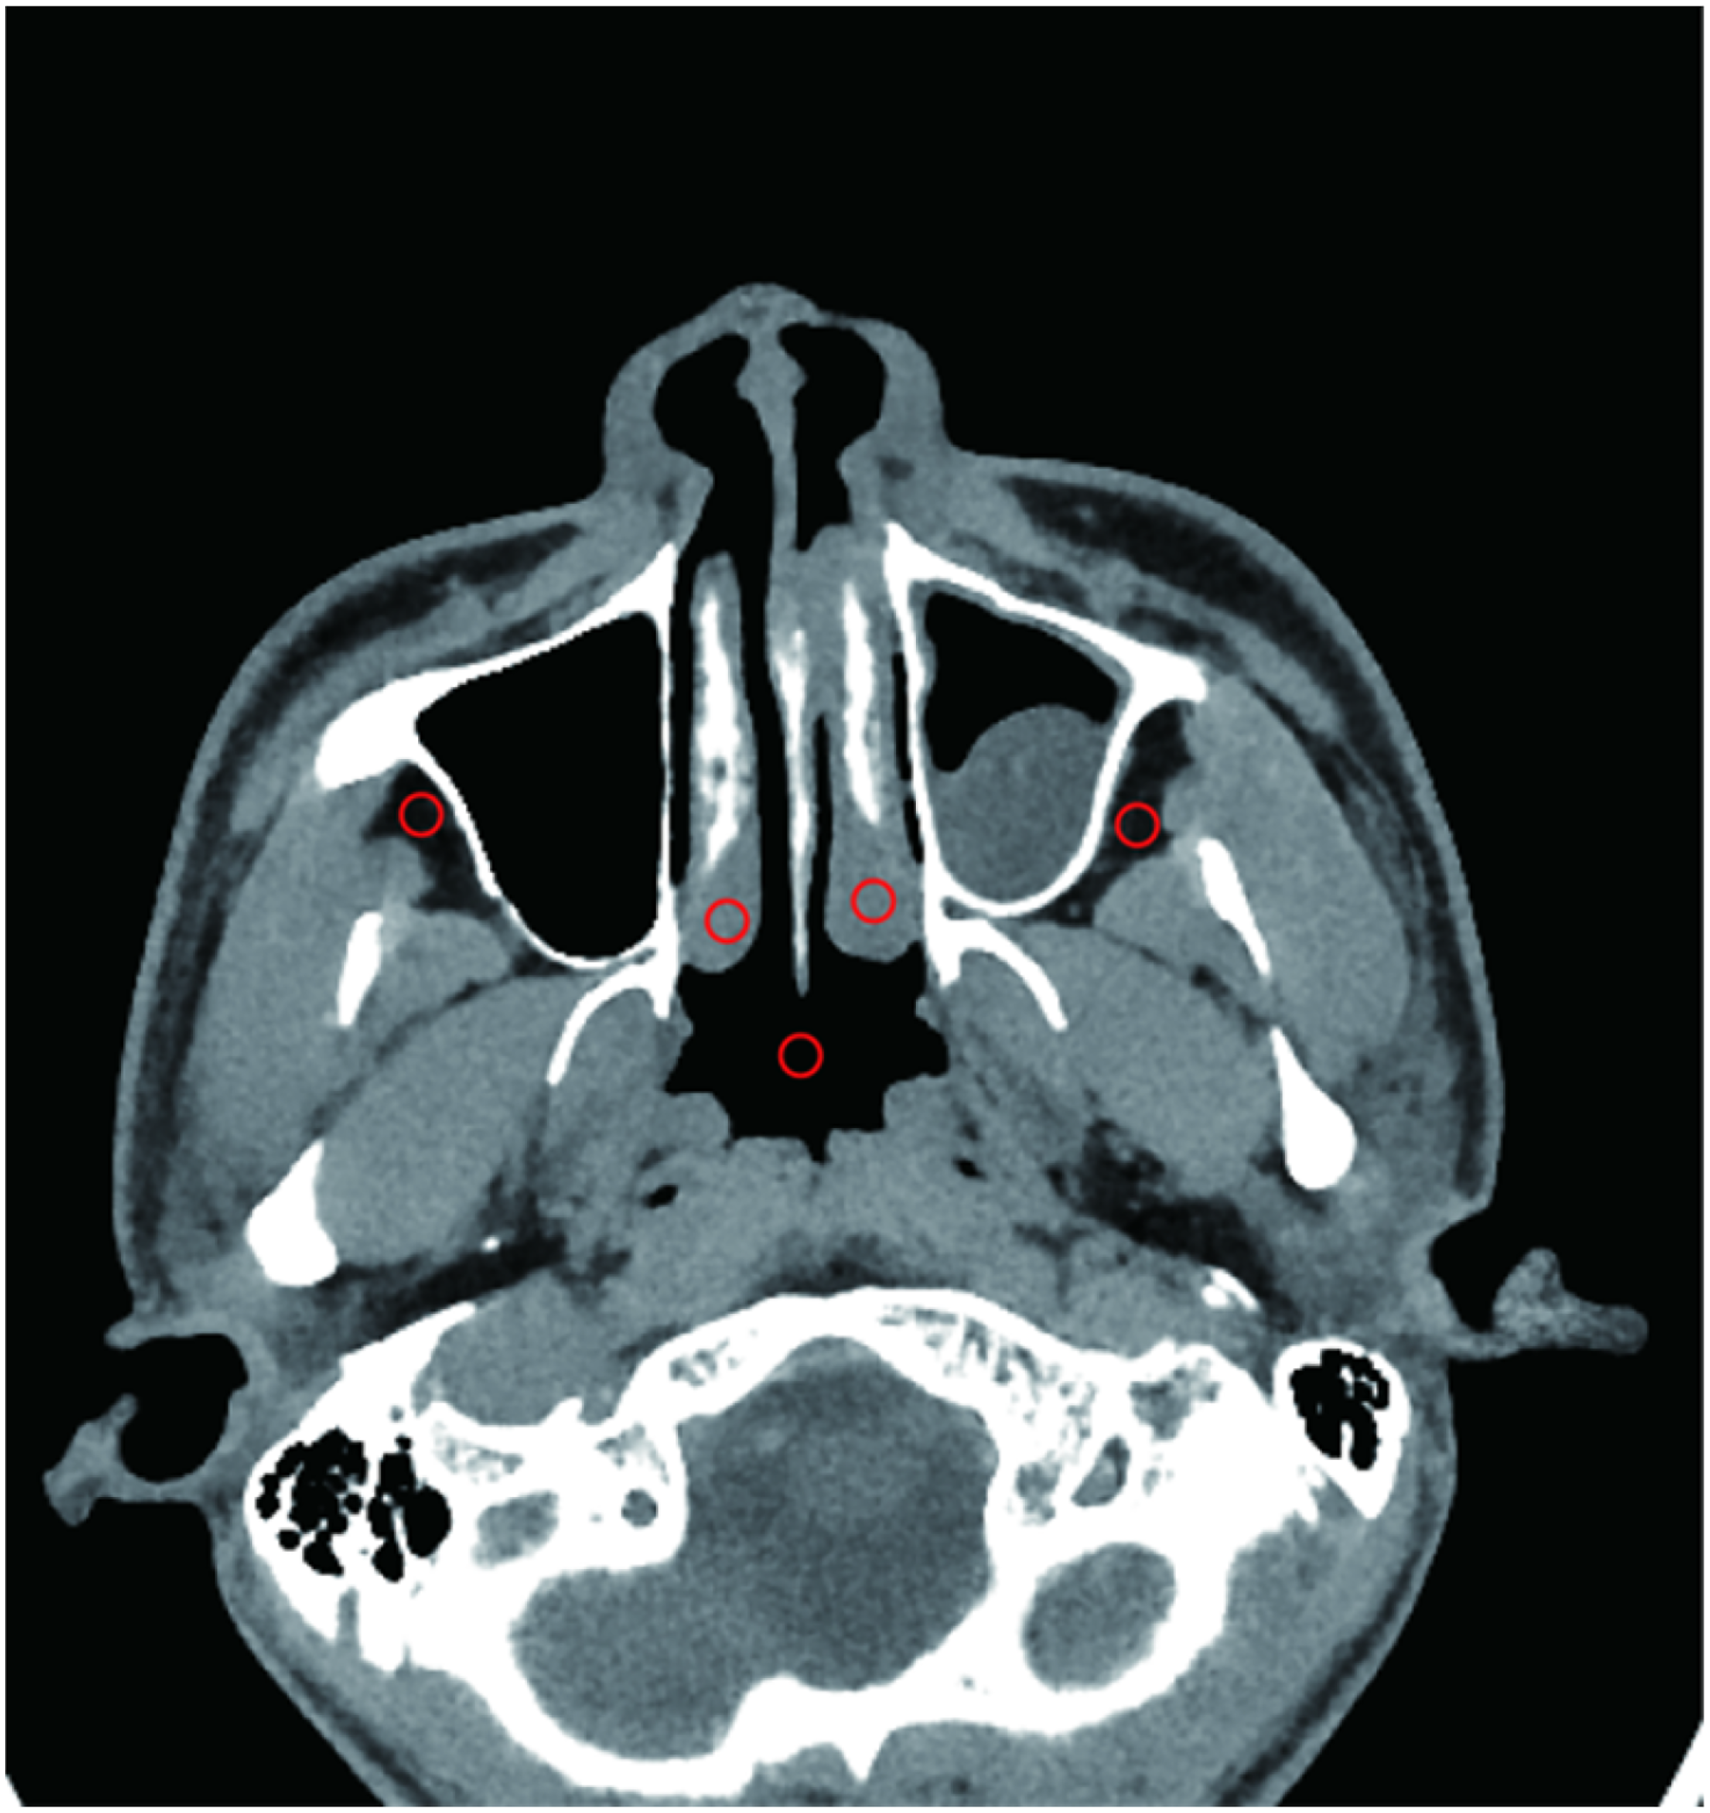
Schematic diagram of ROIs placement for objective measurement. ROIs of the nasopharyngeal cavity, bilateral inferior turbinate mucosa, and bilateral infratemporal fossa fat, successively from the centre to the sides (indicated by circles).
The signal-to-noise ratio (SNR), contrast-to-noise ratio (CNR), and figure-of-merit (FOM) were calculated for all images. The formulae are as follows:


Subjective evaluation of image quality
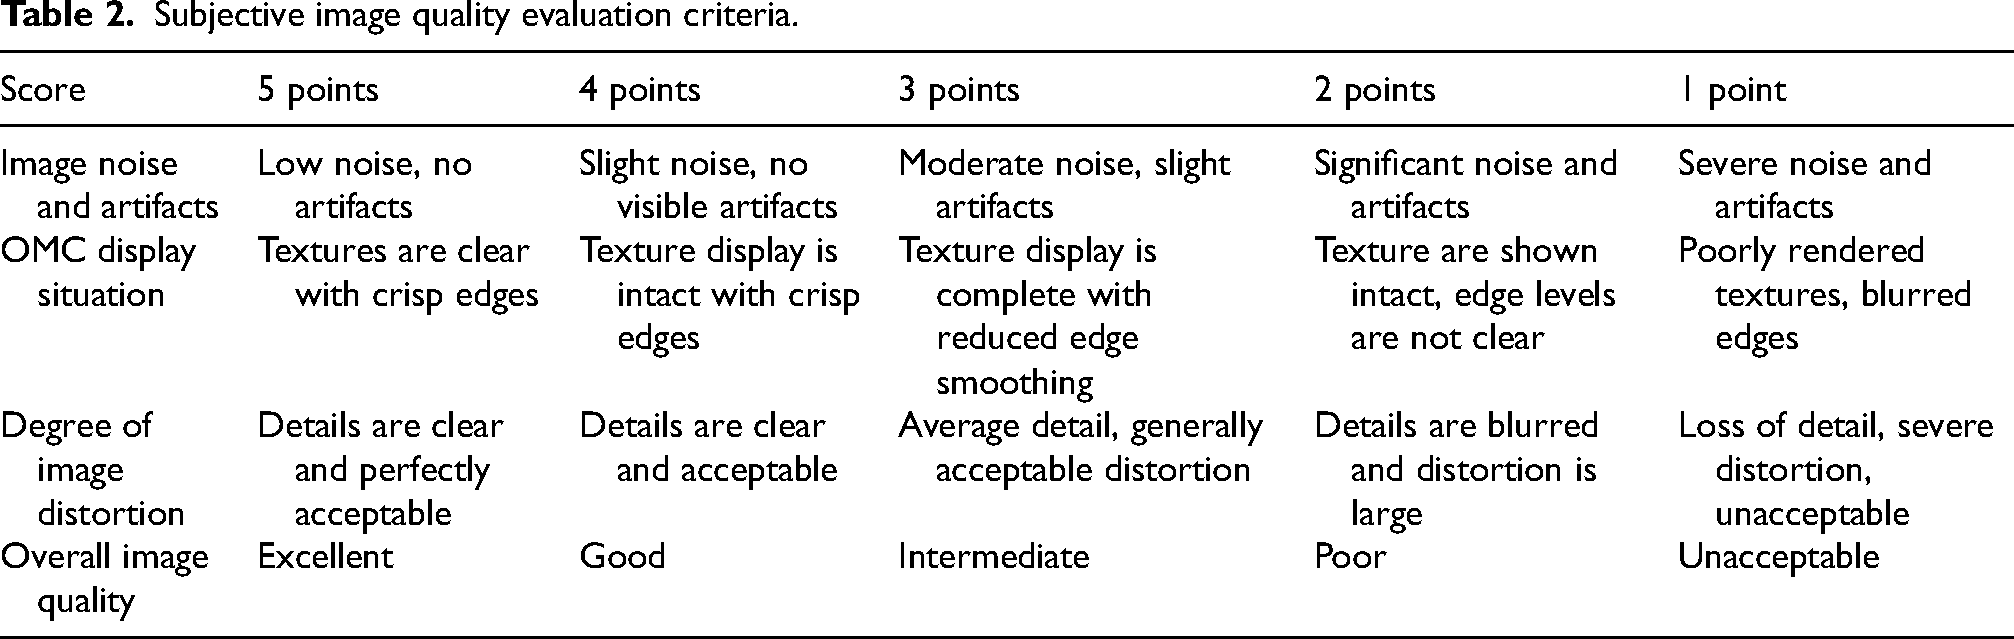
Two physicians, each with more than 10 years of experience in diagnostic sinus imaging, were asked to double-blindly score all images for noise and artifacts, presentation of the ostiomeatal complex (OMC), image distortion, and overall quality using a 5-point scale, as summarised in Table 2. The images were considered to violate the clinical diagnostic requirements if the subjective score was less than 3. A physician who was not involved in the scoring numbered, accessed, and calculated the relevant data for all images.
Subjective image quality evaluation criteria.
Radiation dose
The CT dose-index volume (CTDIvol) and dose-length product (DLP) were recorded for all patients. The size-specific dose estimate (SSDE) based on the water-equivalent diameter (DW) was proposed by the American Physical Society (APS). 13 The CTDIvol, DLP, and SSDEDW together represent the radiation dose received by the patients. A minimum irregularly shaped ROI containing all anatomical structures was automatically outlined at the maxillary-sinus level in the image using the IndoseCT software. 14 The corresponding CTDIvol values from the dose report were inputted, and the SSDEDW was calculated.15–17
Statistical analysis
All data were statistically analyzed using the SPSS 29.0 software (IBM Corp. Armonk, NY). The chi-square test was used to compare the sex differences between the three groups of patients. A one-way analysis of variance was used to compare the radiation dose, mean noise values, SNR, CNR, and FOM for all images. Two-way comparisons were performed via multiple comparisons using the Bonferroni correction or Welch’ ANOVA, expressed as the mean ± SD (
Results
General information
There were no statistically significant difference in age or sex among the patients in each group (P > 0.05), as shown in Table 3.
General information and radiation dose for the three groups of patients (
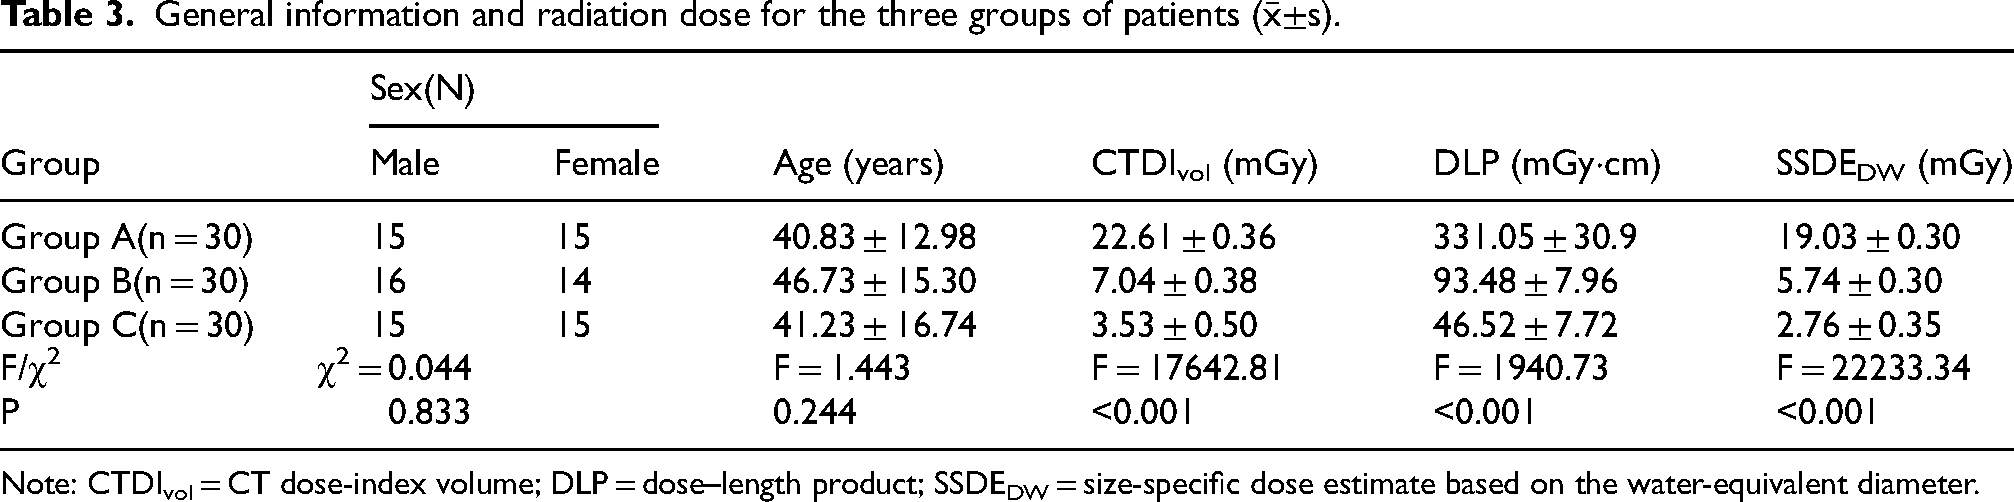
Note: CTDIvol = CT dose-index volume; DLP = dose–length product; SSDEDW = size-specific dose estimate based on the water-equivalent diameter.
Image quality evaluation
Tables 4 and 5 summarize the objective and subjective scores of the patient images in each group. The subjective scores of the two radiologists were in good agreement (all with κ > 0.75).
Objective evaluation of images with different reconstruction algorithms (subjective score value ≥ 3) (
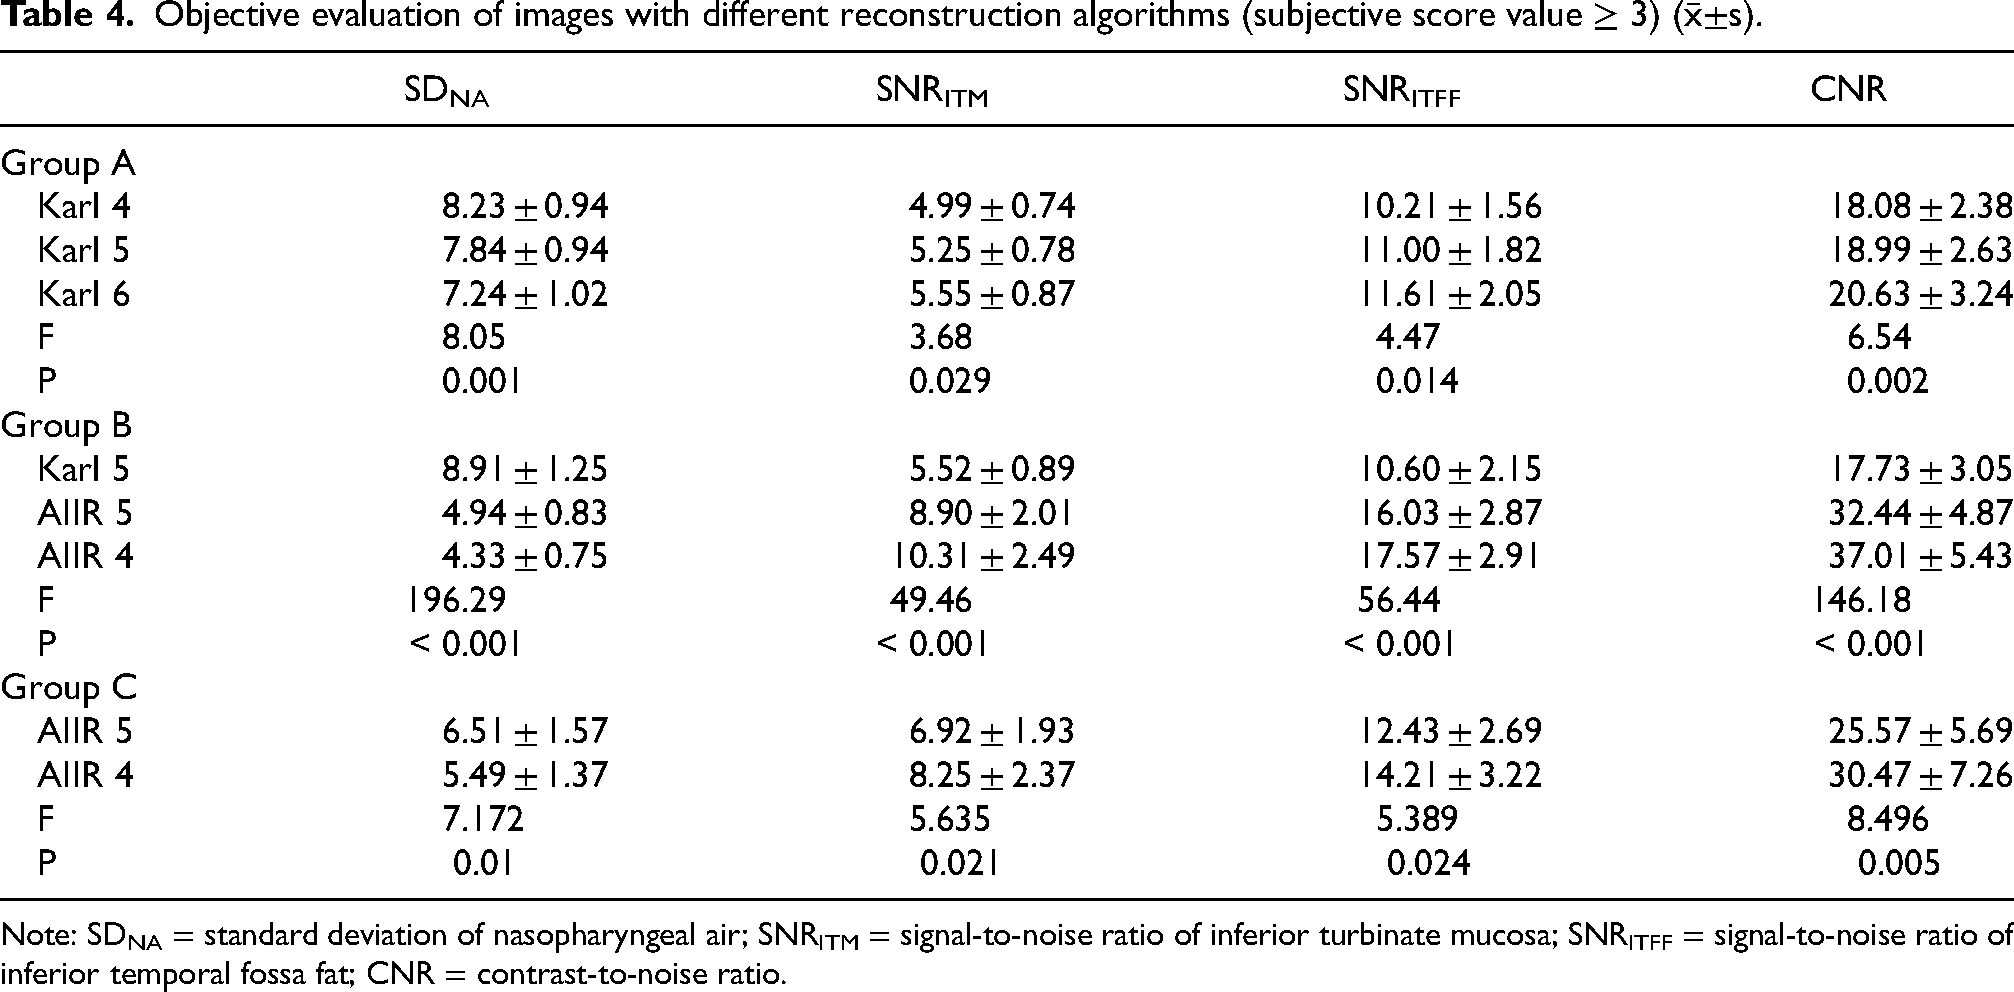
Note: SDNA = standard deviation of nasopharyngeal air; SNRITM = signal-to-noise ratio of inferior turbinate mucosa; SNRITFF = signal-to-noise ratio of inferior temporal fossa fat; CNR = contrast-to-noise ratio.
Subjective evaluation of images with different reconstruction algorithms.
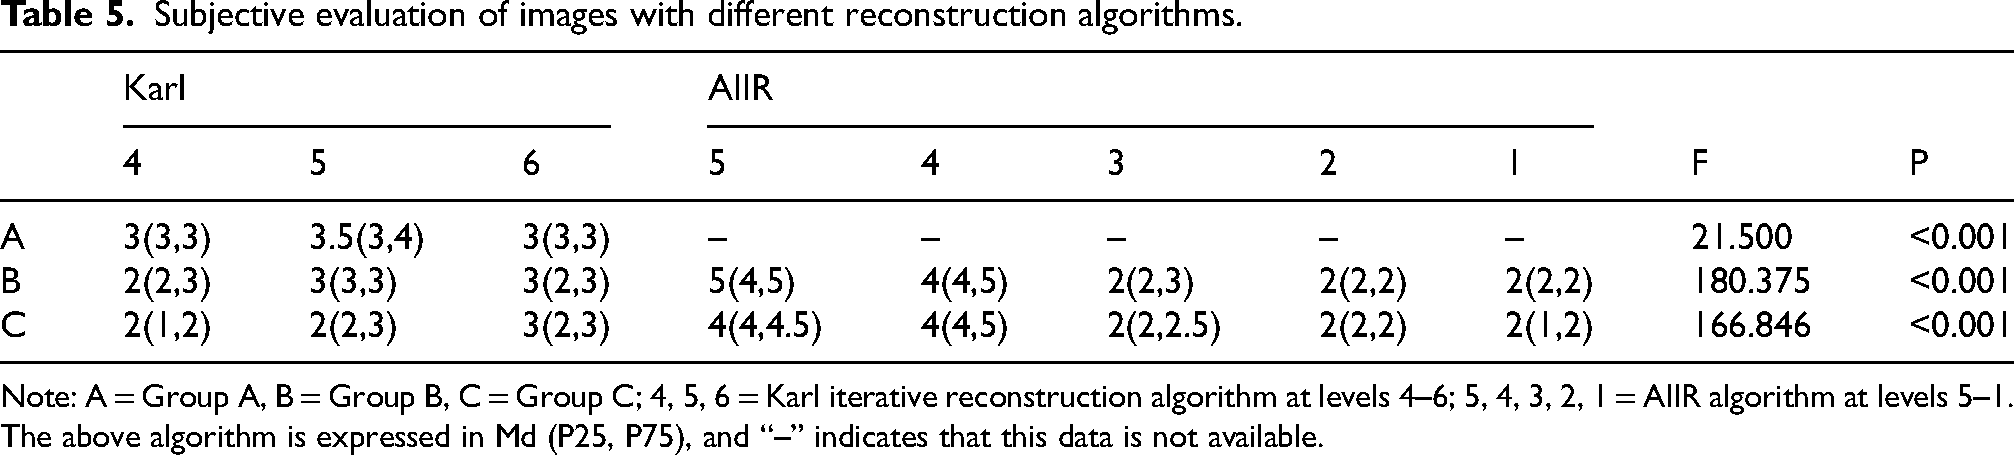
Note: A = Group A, B = Group B, C = Group C; 4, 5, 6 = Karl iterative reconstruction algorithm at levels 4–6; 5, 4, 3, 2, 1 = AIIR algorithm at levels 5–1. The above algorithm is expressed in Md (P25, P75), and “–” indicates that this data is not available.
Intergroup image quality in Group A patients
As shown in Figure 2, all images with Karl levels of 4–6 in Group A met the clinical diagnostic requirements. The mean noise, CNR, SNRITM, and SNRITFF values of the Karl level 5 images were not statistically different from those of Karl levels 4 and 6 (P > 0.05). The subjective scores of the Karl level 5 images were superior to those of Karl levels 4 and 6 (P < 0.05). Therefore, Karl level 5 was the optimal noise level for the images of the patients in Group A, as listed in Tables 4 and 5.

CT images of paranasal sinuses with different reconstruction algorithms in group A. Case 1, male, using a 120 kVp tube voltage and a uDose level 1 of tube current. Of Karl levels 4–6, Karl level 5 has the highest subjective score value, good soft tissue contrast, a clear sense of hierarchy, and good image quality.
Intergroup image quality in Group B patients
Noise was evident in the Karl level 4 images, and the sharpness and soft-tissue contrast decreased in the Karl level 6 images. The images from AIIR levels 1, 2, and 3 exhibited excessively smooth tissue–structure boundaries and severe image distortion. Moreover, the mean values of the subjective scores of the aforementioned images were < 3, which violated the clinical diagnostic standards (Figure 3).
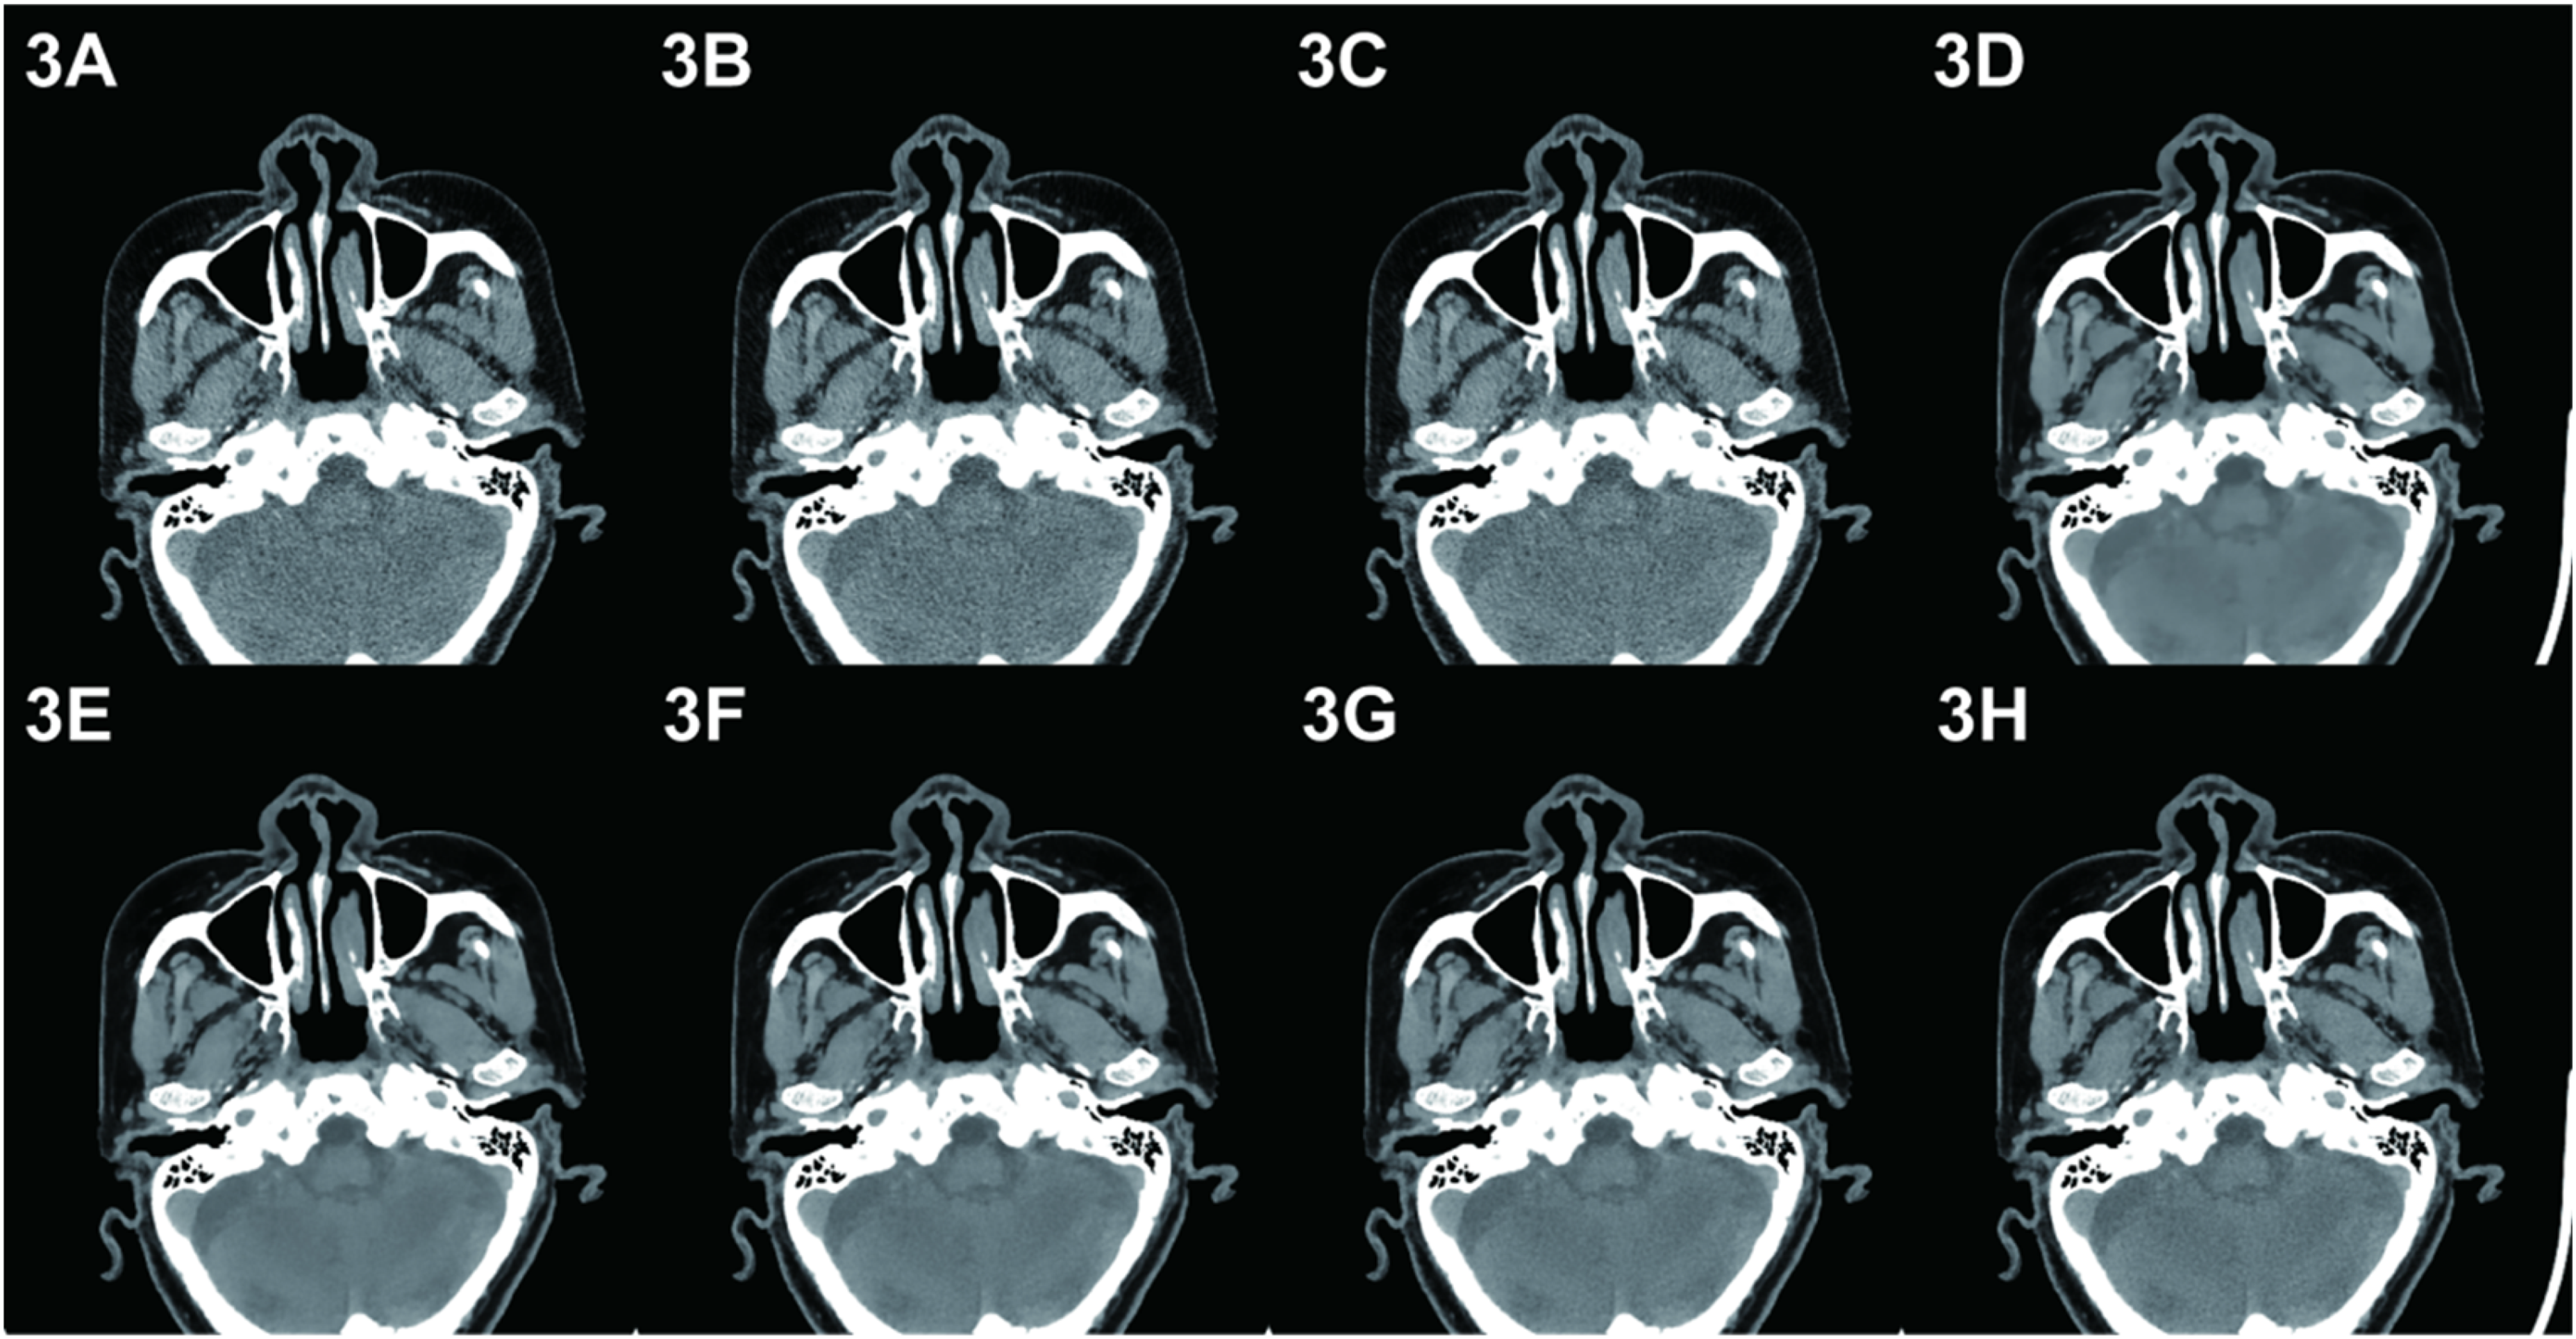
CT images of paranasal sinuses with different reconstruction algorithms in group B. Case 2, female, using a 100 kVp tube voltage and a uDose level 1 of tube current. A–C depict the Karl levels 4–6 images in sequence. The Karl level 4 image noise is obvious, and the Karl level 6 reconstruction image sharpness and soft tissue contrast decrease. D–F depict the AIIR levels 1–3 images in sequence. These images had excessively smooth tissue–structure boundaries and severe image distortion. The mean values of the subjective scores of the above images were < 3, which violated the clinical diagnostic standards. G–H depict the AIIR levels 4–5 images, in which the structure and edges are clear and the sharpness is good. The details of the AIIR level 5 images are clearer, and the subjective scores are higher.
The mean noise values in the images with AIIR levels of 4 and 5 were lower than those of the images with Karl level 5. Moreover, the mean values of the CNR, SNRITM, SNRITFF, and subjective scoring were higher than those of the Karl level 5 images. The mean values of the noise, SNRITM, and SNRITFF of the AIIR level 5 images were not statistically different from those of the AIIR level 4 images. However, the mean subjective scoring values were better than those of the AIIR level 4 images, as summarized in Tables 4 and 5. Therefore, AIIR level 5 was the optimal noise level for the images of the patients in Group B.
Intergroup image quality in Group C patients
Karl levels 4–6 had obvious noise, the details of AIIR levels 1, 2, and 3 were lost and severely distorted, and the subjective score values of the above images were all < 3, which violated the clinical diagnosis requirements (Figure 4). The mean noise value of the AIIR level 4 images was lower than that of the AIIR level 5 images, and the mean values of the CNR, SNRITM, SNRITFF, and subjective scoring were higher than those of the AIIR level 5 images, as summarized in Tables 4 and 5. Therefore, AIIR level 4 was the optimal noise level for the images of the patients in Group C.
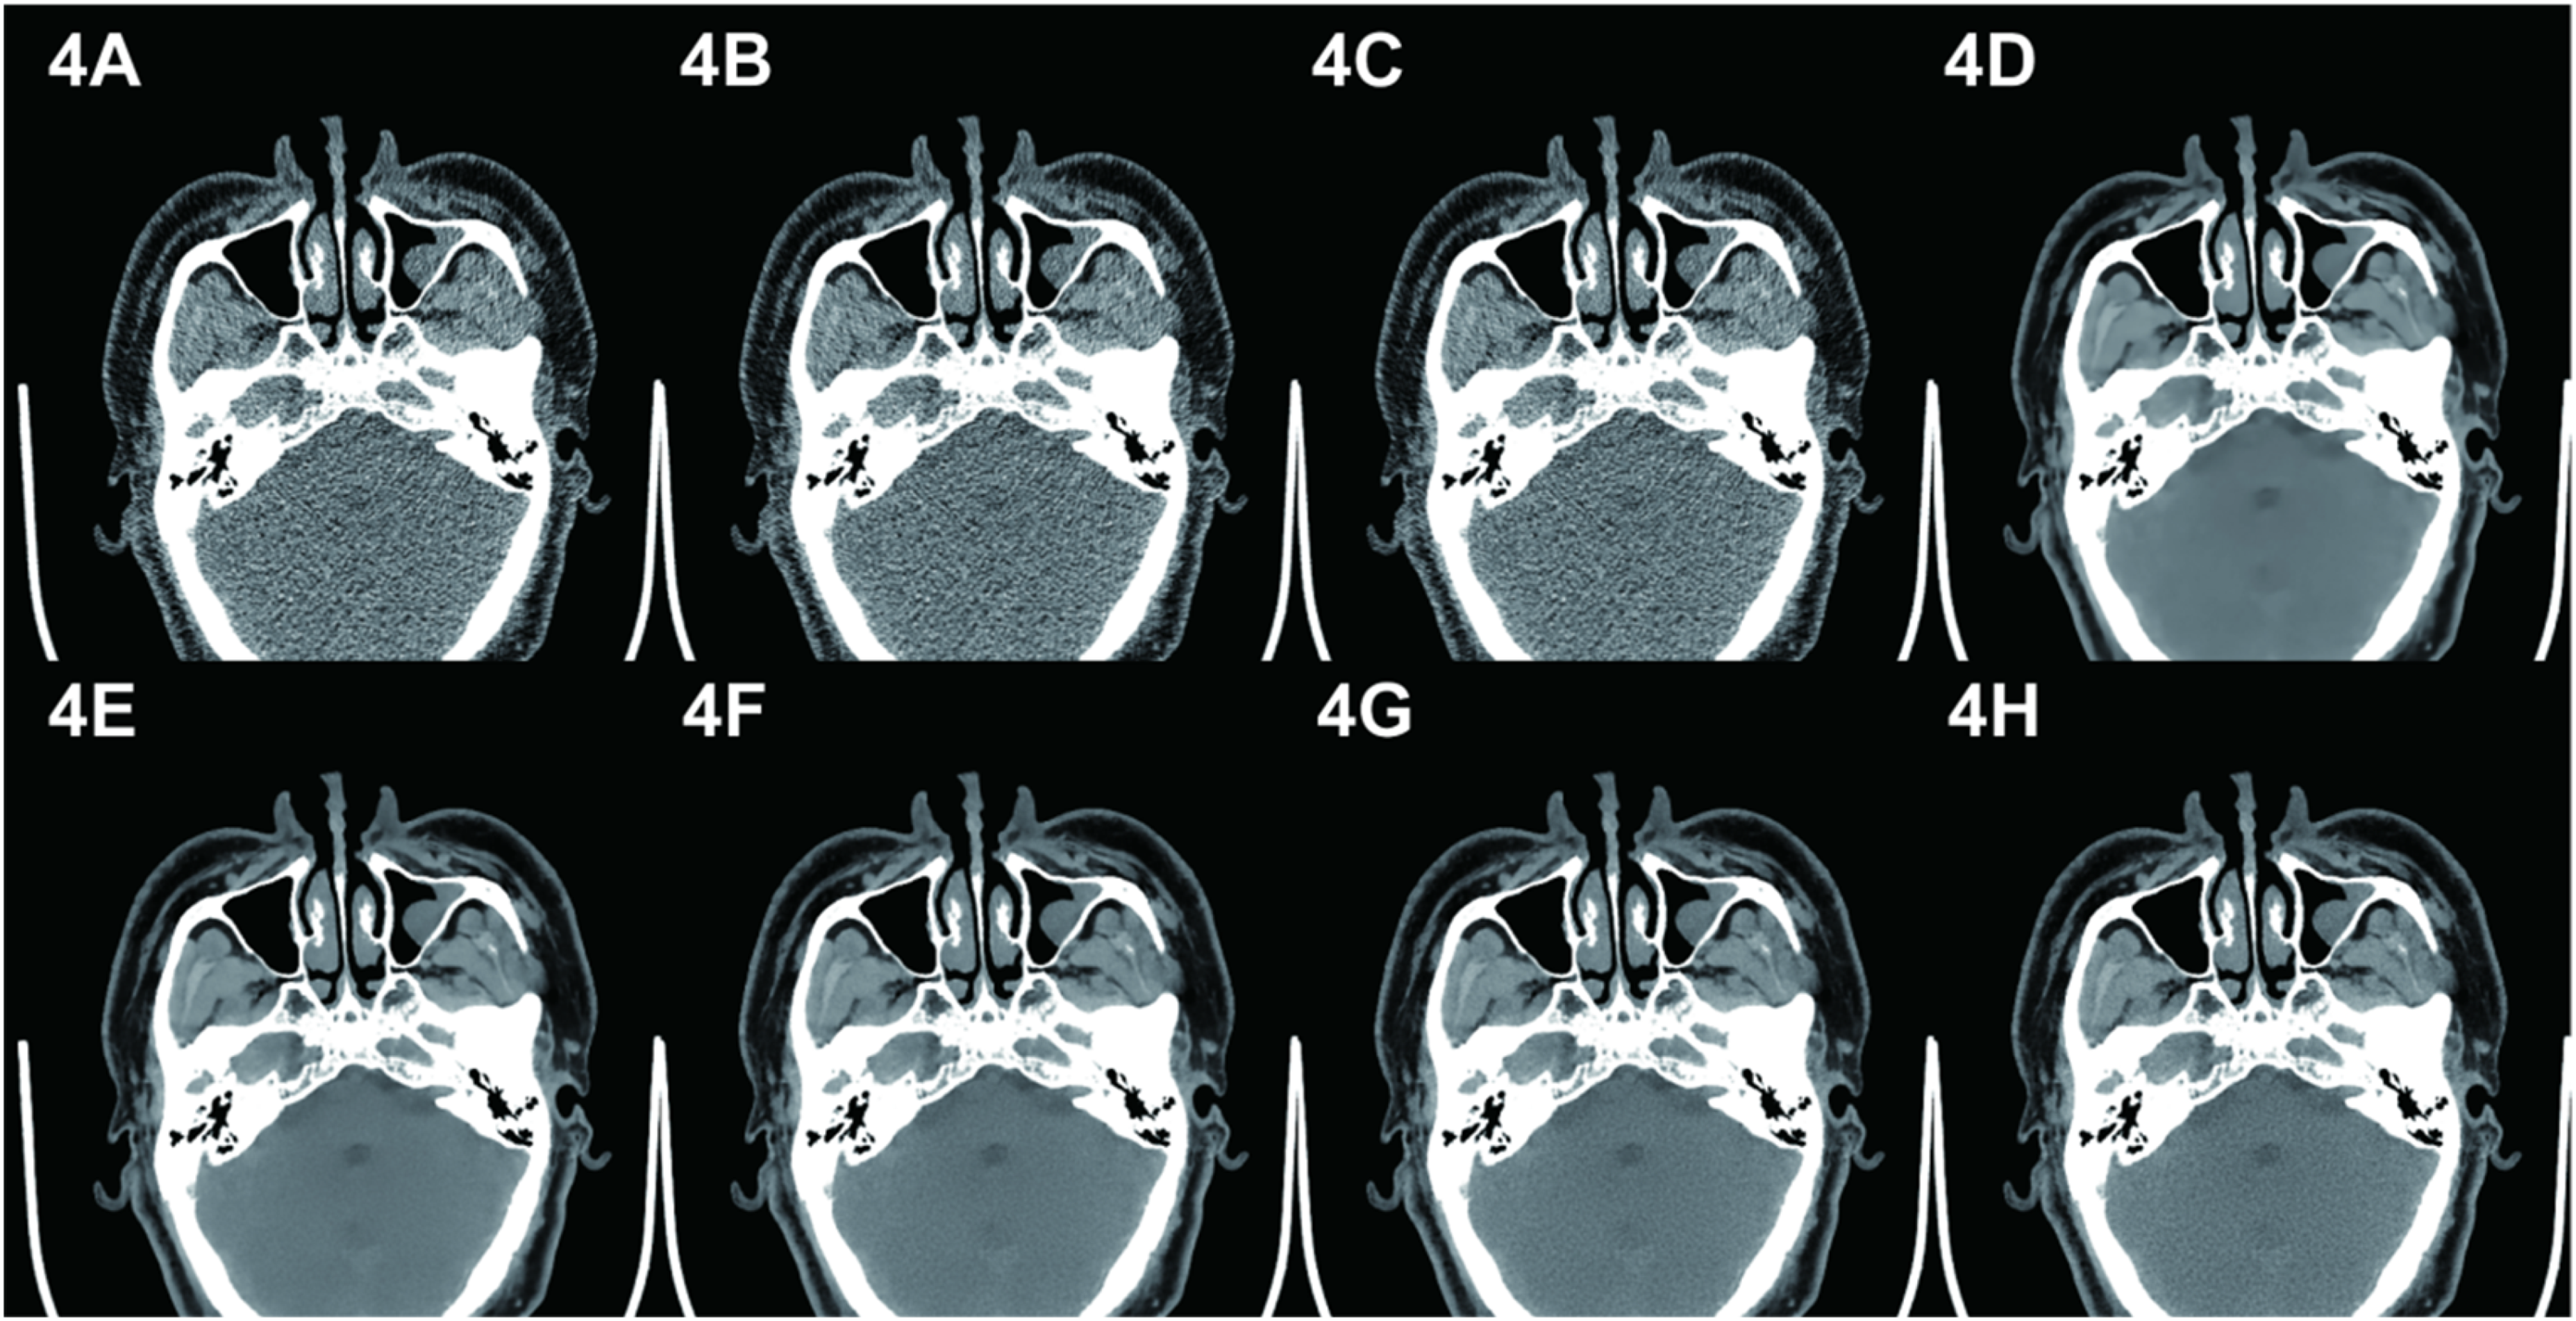
CT images of paranasal sinuses with different reconstruction algorithms in group C. Case 3, male, using an 80 kVp tube voltage and a uDose level 1 of tube current. A–C depict the Karl levels 4–6 images in sequence. These images contain obvious image noise and therefore cannot be used for diagnosis. D–F show the AIIR levels 1–3 images in sequence. These images contain obvious image distortion. The soft tissue contrast is poor, the edges are poorly displayed, and the sense of hierarchy is poor. G–H depict the AIIR levels 4–5 images. High-frequency noise is recovered as the noise level increases, and image details are clearly displayed. AIIR level 4 exhibits lower noise and higher subjective scores.
Comparison of the optimal image quality for the three patient groups
The mean noise values of the images in Groups B (AIIR level 5) and C (AIIR level 4) were lower than those of the images in Group A (Karl level 5). Moreover, the mean values of the SNRITM, SNRITFF, CNR, FOM, and subjective scores were higher (P < 0.05) than those of the images in Group A (Karl level 5), as shown in Figure 5.
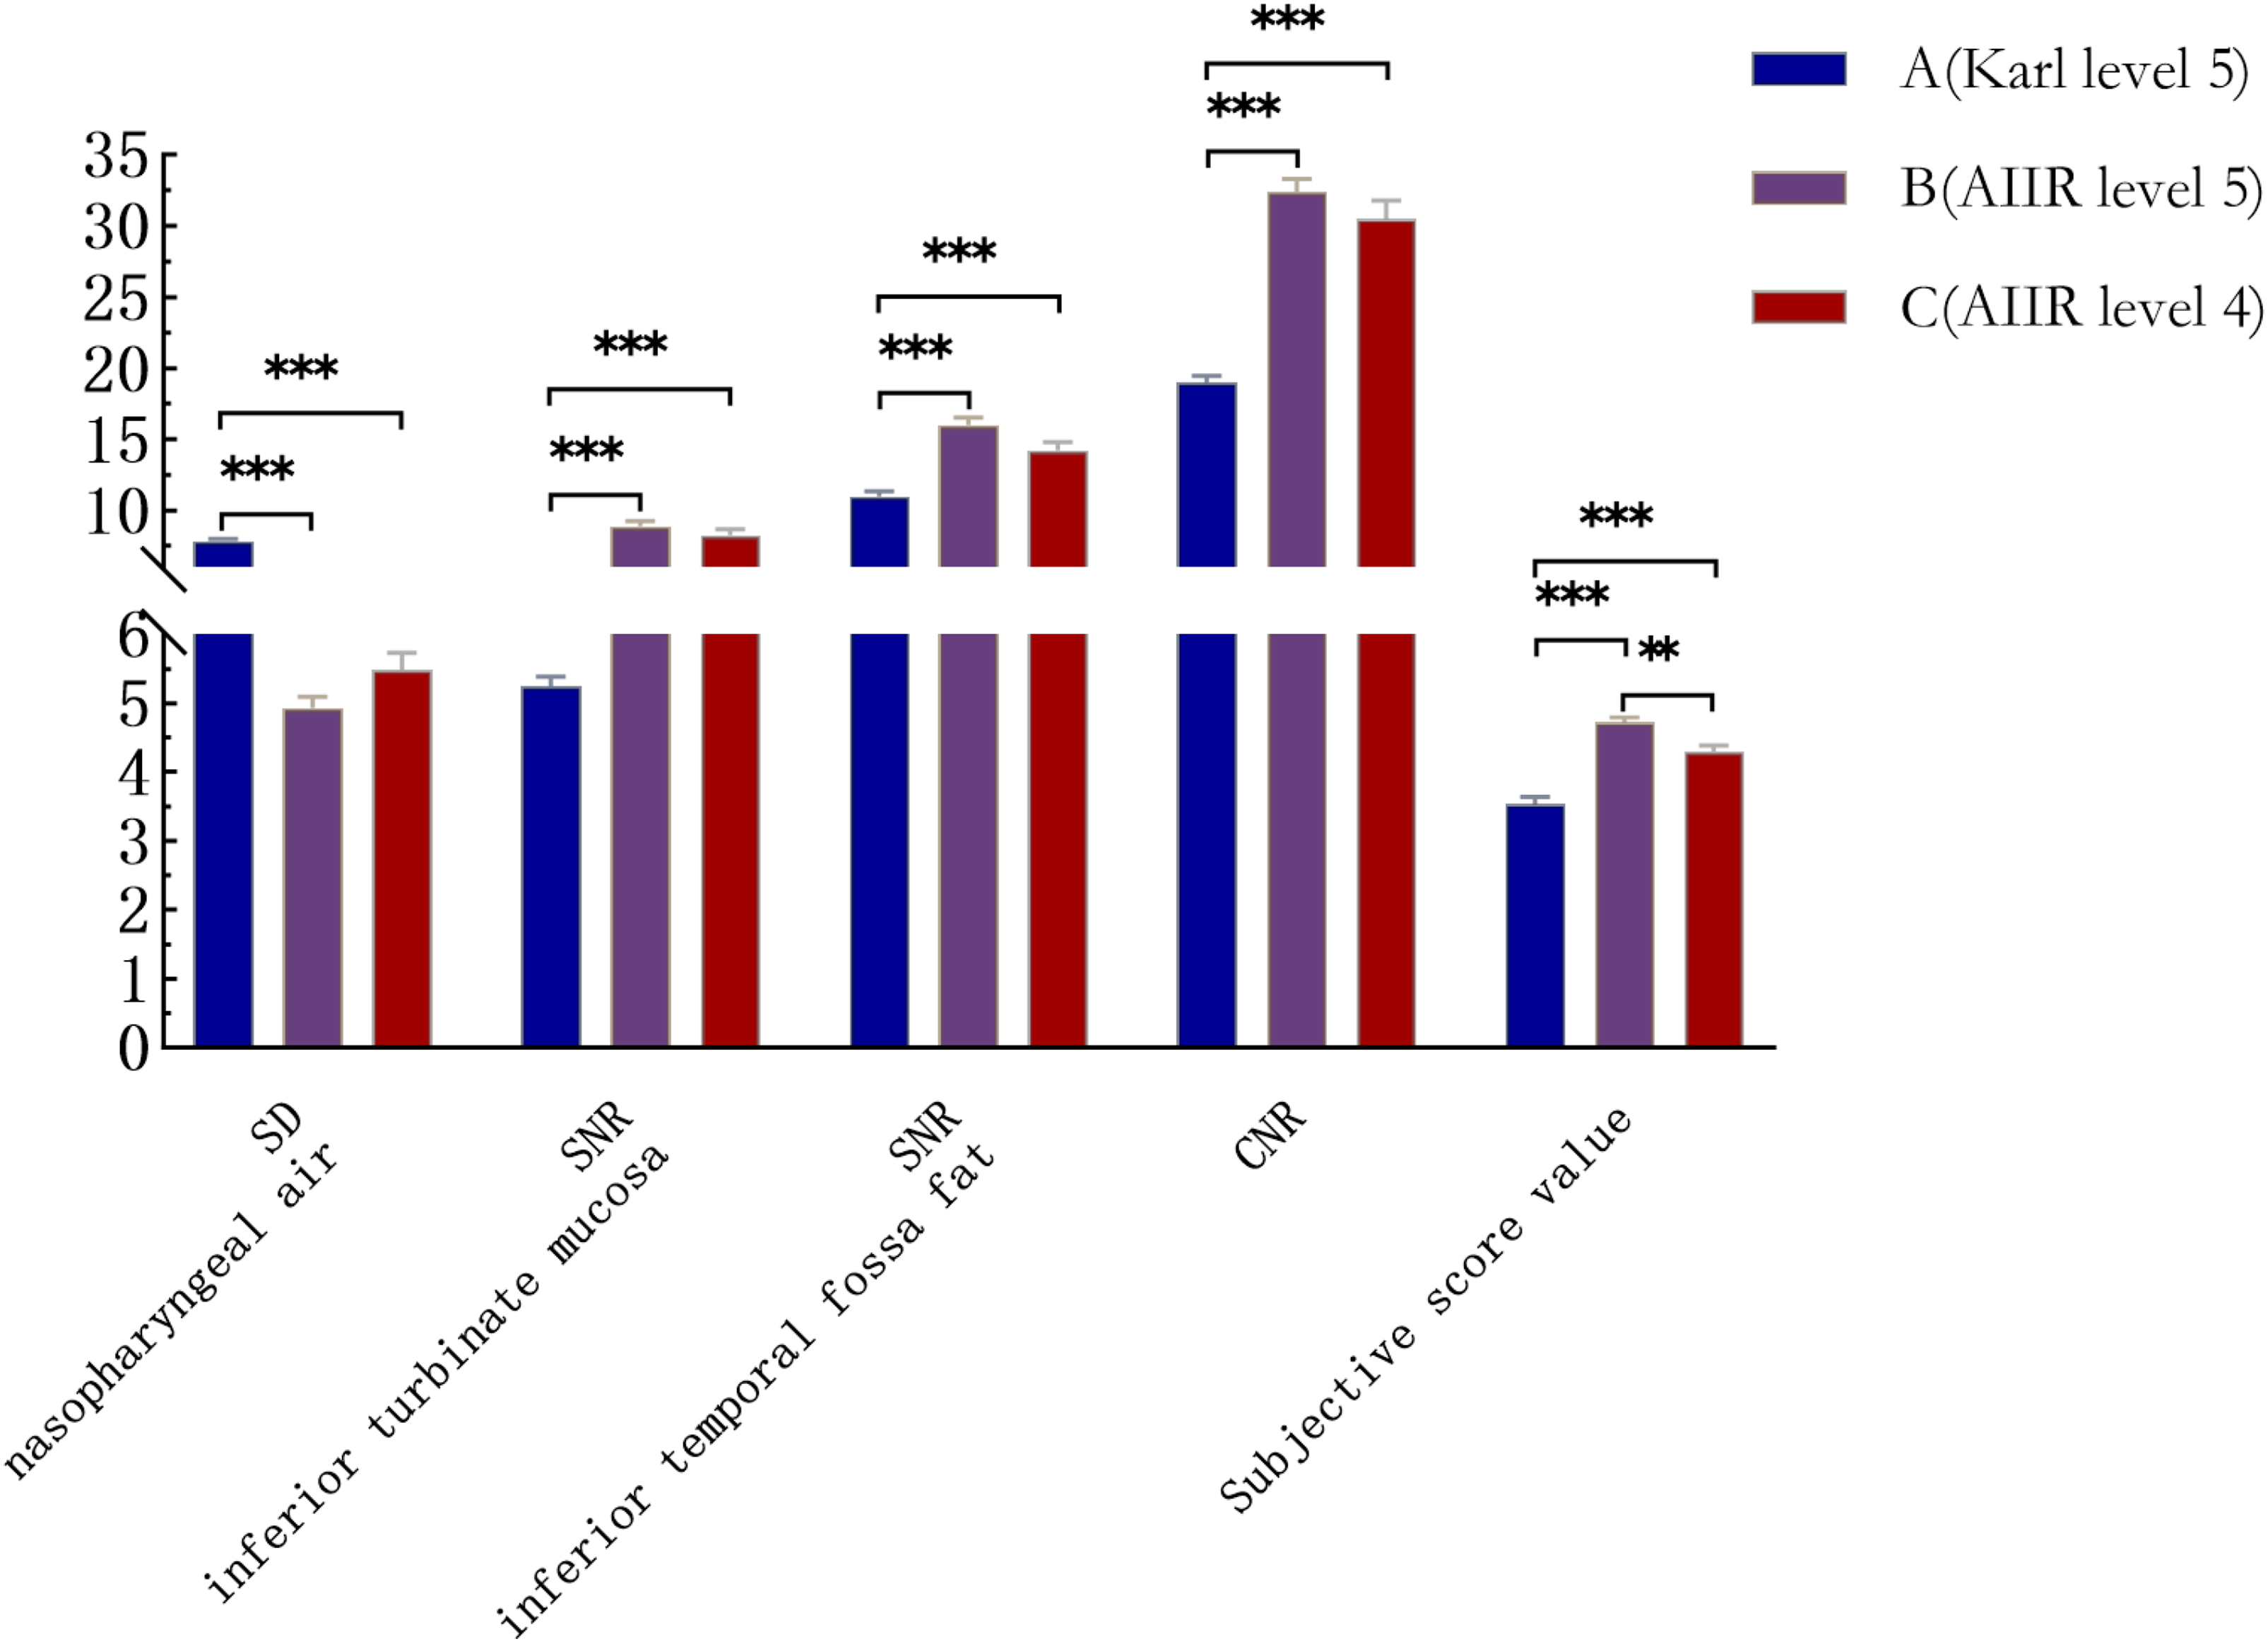
Comparison of the image noise, SNR, CNR and subjective score values of the best images of the three patient groups. Note: *** indicates P < 0.001, ** indicates P < 0.01.
The mean noise values of the images in Groups B (AIIR level 5) and C (AIIR level 4) were reduced by 37.0% and 30.0%, respectively, compared with that of the images in Group A (Karl level 5). The mean values of the CNR, SNRITM, and SNRITFF in Groups B and C were increased by 70.8%, 69.5%, 45.7%, 60.5%, 57.1%, and 29.2%, compared with those of the images in Group A (Karl level 5) images, respectively. The mean values of the noise, SNRITM, SNRITFF, and CNR of the Group C (AIIR level 4) images were not statistically different from those of the Group B (AIIR level 5) images; however, the FOM value was better than that of the Group B (AIIR level 5) images.
Radiation dose
The mean values of the CTDIvol, DLP, and SSDEDW in the patients in Groups B and C were reduced by 68.9%, 71.8%, 69.8%, 84.4%, 86.0%, and 85.5%, respectively, compared with those of the patients in Group A. Those in Group C were reduced by 49.9%, 50.2%, and 51.9%, respectively, compared with those in Group B, as listed in Table 3.
Discussion
CT scanning is the predominant imaging method for clinically examining paranasal-sinus lesions. 18 The sinus structures have high natural contrast, which provides the possibility of low-dose scanning. 19 Currently, the primary methods by which to reduce the radiation dose of paranasal-sinus CT scanning are reducing the tube voltage and current20–21; however, these methods also produce a large amount of quantum noise when the CT image reduces the radiation dose, which affects the image quality and thus causes leakages and misdiagnoses.22–23 Therefore, the reducing radiation dose associated with CT examinations while ensuring image quality has become a critical concern.3–4,24–27
In this study, different tube voltages were used to perform CT scans of the paranasal sinuses. The results demonstrated that the mean CTDIvol, DLP, and SSDEDW values in patients with paranasal-sinus CT scans using 80 kVp were reduced, compared with those using 120 and 100 kVp, by 84.4%, 86.0%, 85.5%, 49.9%, 50.2%, and 51.9%, respectively. These results suggests that 80 kVp is more effective at reducing the radiation dose to the patient during paranasal-sinus CT scanning, which can significantly reduce the harmful effects of ionizing radiation on the lens, thyroid, and other parts of the body. These results are attributable to the CTDIvol being proportional to the square of the tube voltage. Consequently, reducing the tube voltage significantly reduces the radiation dose. The sinuses mainly comprise air in the sinus cavity, bone, and mucosa of the sinus wall, with good natural contrast. Conversely, sinus lesions are relatively simple, mostly inflammatory lesions, sinus cysts, and congenital variants. Therefore, an appropriate reduction in tube voltage has less impact on the clinical diagnosis and treatment of sinus diseases.
The results of our study demonstrated that Karl level 5 was the optimal reconstruction algorithm for paranasal-sinus CT scanning in Group A. The mean values of the noise, SNRITM, SNRITFF, and CNR of the reconstructed images of Group A (Karl level 5) were not statistically different from those of Group B (Karl level 5). The differences between Groups A and C (Karl level 5) were statistically significant. These results indicate that the noise-reduction ability of the Karl IR technique was affected by the tube voltage. When the tube voltage decreased within a certain range (< 20 kVp), the noise-reduction ability of the Karl IR technique on paranasal-sinus CT images was less limited by the tube voltage. When the tube voltage decreased beyond a certain range (> 40 kVp), the image noise increased, and the noise-reduction ability of the Karl IR technique was limited, which resulted in a decrease in image quality. These results may also be related to the tube current dose modulation technique used in this study, in which the tube current can be compensated to increase within a certain range when the tube voltage drops. When the tube voltage decreased sufficiently, the compensatory increase in the tube current was insufficient to compensate for the increase in image noise caused by the decrease in X-ray intensity, which thereby affected the image quality.
The results of this study also demonstrated that the mean noise value of the AIIR level 5 images in Group B decreased by 37.0% and that the mean values of the CNR, SNRITM, and SNRITFF of the images increased by 70.8%, 69.5%, and 45.7%, respectively, compared with those of the Karl level 5 images in Group A. In Group C, the mean noise value of the AIIR level 4 images decreased by 30.0%, and the mean values of the CNR, SNRITM, and SNRITFF of the images increased by 60.5%, 57.1%, and 29.2%, respectively, compared with those of the Karl level 5 images in Group A. These results are mainly attributable to the use of the AIIR algorithm, which combines artificial intelligence and MBIR. Millions of high-quality images generated by the model iterative reconstruction algorithm and the corresponding simulated low-dose images, which make up the training dataset, are used to continually train the algorithms to adequately learn relationships and distinguish between the signal and noise in the images. 28 After several iterations, the Karl algorithm changes the noise distribution in the original data, whereas the AIIR algorithm optimizes the image quality through multiple forward-backward projection iterations in the sinusoidal and image domains. Moreover, the AIIR algorithm considers the image noise reduction and maintains the image quality without changing the frequency distribution of the image noise and texture. 29
The results of this study also suggest that the mean noise value from the images used in the AIIR algorithm is significantly lower than that of the Karl algorithm in Group B. Moreover, the mean values of the SNR and CNR of the images used in the AIIR algorithm are significantly higher than those of the images used in the Karl algorithm, indicating that the AIIR algorithm has a more powerful noise-reduction capability than does the Karl algorithm.In addition, the subjective scores of the AIIR level 5 images in Group B were higher than those of the Karl level 5 images in Groups A and B because the AIIR algorithm did not change the original texture details of the images while reducing the noise. Moreover, clinicians preferred the perceptions of the AIIR images.
The AIIR algorithm offers 1 to 5 noise levels with varying abilities of noise reduction. They have different effects on image quality. In this study, we found that the sinus images reconstructed using AIIR levels 1, 2, and 3 were excessively smooth, resulting in ‘waxy appearance’ and distorted artifacts, and that the image sharpness was reduced. These phenomena affect the display of anatomical structures and the edges of the lesions, which thereby affects the clinical diagnoses. As the AIIR noise levels change from 1 to 5, some of the high-frequency noise is restored, the powerful noise-reduction ability of AIIR is demonstrated without changing the texture of the sinus image, and the image quality is significantly improved.
The results of this study indicate that the image quality of the AIIR level 4 reconstructed images in Group C is better than that of the AIIR level 5 images, which was the best noise level for the sinus images of Group B patients. This result suggests that the noise-reduction effect of AIIR may be affected by high or low tube voltages. Therefore, the AIIR noise level should be chosen based on a comprehensive analysis of the objective and subjective scores of the images, and an appropriate noise level should be selected for different body parts and scanning parameters.
The results of this study also demonstrated that the subjective and objective scores of AIIR level 4 images in Group C were better than those of the Karl level 5 images in Group A. Moreover, the FOM values in Group C were better than those of the AIIR level 5 images in Group B. Additionally, the radiation dose to patients in Group C were significantly lower than those in Groups A and B. These results indicate that 80 kVp, combined with the AIIR level 4, can significantly reduce the radiation dose to patients while satisfying clinical diagnostic requirements.
This study has the following limitations.
The relatively concentrated timeframe (April–July 2024) for sample collection may lead to insufficient diversity in the disease spectrum of cases. Future studies will extend the sample collection period and increase sample size for more comprehensive investigation. In order to avoid additional radiation exposure to the subjects, this study did not conduct dual-mode collection of conventional and low-dose for the same subjects, so the effects of different radiation dose levels on image quality could not be accurately assessed, but the independent sample design and the principle of randomization could minimize the differences between groups. Considering the majority of non-neoplastic disease in sinonasal imaging, this phase of research focused on quantitative image quality metrics (SD, SNR, CNR) and clinical diagnostic adequacy. Diagnostic accuracy assessment of reconstructed images was not conducted and will be explored in subsequent studies involving other regions.
Conclusions
A low-tube voltage combined with the AIIR algorithm can meet clinical diagnostic needs while significantly reducing the radiation dose associated with paranasal-sinus CT scans. The optimal parameters for paranasal-sinus CT scanning were 80 kVp, uDose level 1, and an AIIR level 4. Establishing standardized scanning protocols can improve the diagnostic efficiency of clinicians and strengthen cross-regional collaboration and communication.
Footnotes
Ethics approval and consent to participate
All procedures performed in the study involving human participants were in accordance with the ethical standards of the Affiliated Hospital of Hebei University and with the 1964 Helsinki declaration and its later amendments or comparable ethical standards. This article does not include any studies of animal experiments by any of the authors.
This study was approved by the Ethics Committee of the Affiliated Hospital of Hebei University (Approval Number: HDFYLL-KY-2024-029). Before the examination, patients or their immediate family members signed the informed consent form for the examination. Verbal informed consent was obtained for anonymised patient information to be published in this article.
Funding
This study was funded by Hebei Provincial Government Clinical Medicine Excellent Talent Training Program (grant number: ZF2026433), Hebei Province Medical Technology Tracking Project (grant number: GZ2023093), Key Fund of the Affiliated Hospital of Hebei University (grant number: 2024ZB01), and Baoding Science and Technology Plan Project (grant number:2141ZF307).
Conflict of interest
We declare that we do not have any commercial or associative interest that represents a conflict of interest in connection with the work submitted.