
Abstract
Many nation-states have realized the importance of tertiary education and the world has seen a corollary increase in tertiary education enrollments. Using Berry and Berry’s event history model as a framework, this study tests both the internal features of each country and the influence that nation-states have on each other with regard to setting tertiary enrollment policies. As expanding tertiary education is an important policy worldwide, we use Trow’s classification to define two levels of tertiary education expansion: first, increasing gross tertiary enrollment rates above 15% (from elite to massified), and second, above 50% (from massified to universal). Analyzing a unique cross-national panel dataset, which spans the time period from 1999 to 2005, our findings show that both internal determinants (secondary education participation rates and the political landscape) as well as diffusion factors (proximity to a pioneering nation and regional variables) influence nations in setting tertiary enrollment policies.
Introduction
Many nation-states have invested in tertiary education seeking to improve national economic development, to develop a well-educated citizenry, and to enhance national competitiveness. Accordingly, the world has seen an increase in tertiary education enrollments. From 1995 to 2003, average tertiary education enrollments across countries in the Organisation for Economic Co-operation and Development (OECD) grew by approximately 33% (Wagner, 2006). This study aims to understand the factors that influence national investment in tertiary education enrollments, an area of scholarship that is vital both for national interests and individuals in an increasingly globalized world.
This study aims to add knowledge to the field by extending Trow’s developmental theory of higher education to explain the change in national-level policy as reflected in the trend of increasing enrollment at the tertiary education level worldwide. Trow (1972) defines higher education growth in three enrollment stages: (a) elite systems with gross tertiary enrollment rates less than 15%, (b) massified systems with gross tertiary enrollment rates between 15% and 50%, and (c) universal systems with gross tertiary enrollment rates above 50%. As higher education enrolls more students, its size, curriculum, structure, and governance change. With the shift from elite to mass systems, higher education changes from educating students in wealthy and powerful families to educating students with diverse backgrounds; from shaping quality of mind and character to preparing for professional occupations; and from a more collegial institution to a more business-like organization (Trow, 1976). Thus, this study uses the average tertiary enrollment rate in a nation as the index of whether this nation has an elite, mass, or universal system. Schofer and Meyer (2005) indicate that countries worldwide have similar patterns of higher education growth, and almost all countries experienced higher education expansion after 1960 resulting from increasing democratization, human rights, scientization, and the advent of development planning. Interrelated global trends are encouraging the worldwide expansion of higher education, but countries reach different levels of expansion at different rates.
Higher education expansion, from an elite to a mass or a universal system, stems from both society’s increasing educational demands for the workforce and society’s responsibility to promote social justice (Trow, 1976, 2000). Although there are some critiques of higher education expansion, such as concerns over declines in the quality of higher education and the value of credentials, higher education expansion marks both the potential for economic development and a more equal society. As Furth (1978) notes, “ . . . many of their [educational systems’] present problems are related to the very success these systems have achieved in the recent past” (p. 259). Modern higher education systems, as defined by Trow as mass or universal systems, are a more economically efficient and productive way to prepare students for serving in a variety of professional fields, which further promotes national economic growth.
Policy Invention and Policy Innovation
In a study of tertiary education policy related to enrollment rates, we need to distinguish between policy invention and policy innovation. A policy invention is the creation of a new idea for policy that has not been implemented anywhere before. A policy innovation happens when a nation adopts a program or policy that is new to that nation (Berry & Berry, 2007). As we will not argue that national policies for tertiary education enrollment rates are entirely new, this study is interested in policy innovation. This approach is common in the diffusion literature on higher education (see, for instance, Cohen-Vogel & Ingle, 2007; Doyle, 2006; McLendon, Hearn, & Deaton, 2006; McLendon, Heller, & Young, 2005). We argue that recent increases in enrollment rates represent non-incremental changes in the enthusiasm by which nations are enrolling unprecedented numbers of students and in the role that higher education plays in the economic investments and development of nations.
Event History Analysis
There are two primary explanations for how nation-states can adopt a new policy to increase tertiary enrollment. The first argues that the internal features of a country (the political, economic, and social characteristics that are unique to each nation-state) are the forces that cause a country to adopt a particular policy. The second explanation describes a process of diffusion whereby nation-states adopt policies previously adopted in other nations (Berry & Berry, 2007). Diffusion can be thought of as taking place through one or more of the following processes: learning, competition, and peer-pressure (either coercive or normative).
This study uses Berry and Berry’s (1990, 2007) unified model of policy innovation, which they have termed event history analysis. This model combines the internal determinants model with diffusion. It conceives of nation-states entering a “risk set” and being at risk of adopting a particular policy in a given year. Therefore, the variables of interest in this study become the probability that nation-states in the risk set will adopt a policy to increase tertiary enrollment rates above 15% (shifting from elite to massified systems) and above 50% (shifting from massified to universal systems) in a given year.
Event history models have been used in the study of higher education, but the literature is primarily focused on institutions (see, for instance, DesJardins, Ahlburg, & McCall, 1999, 2002a, 2002b; Murtaugh, Burns, & Schuster, 1999) or the U.S. states (see, for instance, Doyle & Delaney, 2010; McLendon et al., 2006; McLendon et al., 2005). Event history models have also been used in cross-national contexts for general studies of policy innovation (see, for instance, Brooks, 2005; Simmons, 2000; Simmons & Elkins, 2004). However, event history models have not yet been used for cross-national policy studies related to tertiary education except in our prior work on the topic (Delaney & Yu, 2013, 2014). This study seeks to fill that hole in the literature and uses event history modeling to better understand the factors that influence changes in gross tertiary enrollment rates across nations.
Research Questions
This study seeks to answer the following research questions:
The article is organized as follows: first, we present a short review of related literature; then we present the data, methods, conceptual model, and hypotheses used in this work; next we present a background section to describe tertiary enrollment trends over the time period of the study. We next present our results. In this section, the Kaplan–Meier curves are presented for each threshold to answer our first research question. The Cox proportional hazard models are presented for both the elite-to-massified threshold and the massified-to-universal threshold to answer the second research question and each of the sub-research questions. Finally, the study presents its conclusions and policy implications.
Literature Review
Johnstone and Marcucci (2010) argue that “Higher education is viewed as one of the major engines—perhaps even the major engine—for economic development of any country, which is a major rationale for public investment in higher education” (p. 276). Tertiary education has been found to contribute to both individual future earnings and national economic growth. McMahon (2009) shows that, compared with a 10% rate of private market return for high school graduates in the United States, the rates of private market return for graduates who earned an associate degree and a bachelor’s degree were 16% and 14% in 2005, respectively. He further notes that higher future earnings of college graduates are also observed in other developed countries (such as the United Kingdom, Sweden, Denmark, Norway, Netherlands, France, Spain, Portugal, Australia, Japan, and South Korea). In addition, many studies find that investment in tertiary education (usually measured by expenditures on tertiary education) contributes to the economic development of nations in America, European, Asia, and Africa (Keller, 2006; McMahon, 2009; Schultz, 1998), although investment in tertiary education appears to be more beneficial to developed countries than to developing and least-developed countries. As expanding tertiary enrollment benefits not only individuals but also national economic development, understanding how tertiary enrollment rates increase across countries is a fundamental area for research.
Research in the United States has examined the effects of federal, state, and institutional financial aid policies on tertiary enrollment (DesJardins, 2001; Heller, 1997, 2002; Leslie & Brinkman, 1987). Many U.S. scholars in the field (such as Cabrera & La Nasa, 2000; Perna, 2000; St. John, 1990) further investigate the differences in tertiary enrollment among socioeconomic and racial groups, to identify policies for increasing tertiary enrollments of disadvantaged students. Previous literature has focused on internal features of each nation in studying tertiary enrollment patterns. However, the literature has not yet empirically explored how nation-states influence each other in setting policy to increase tertiary enrollment rates. This study seeks to fill this hole in the literature by proposing and testing a cross-country model of expanding tertiary enrollment.
Data, Methods, Conceptual Model, and Hypotheses
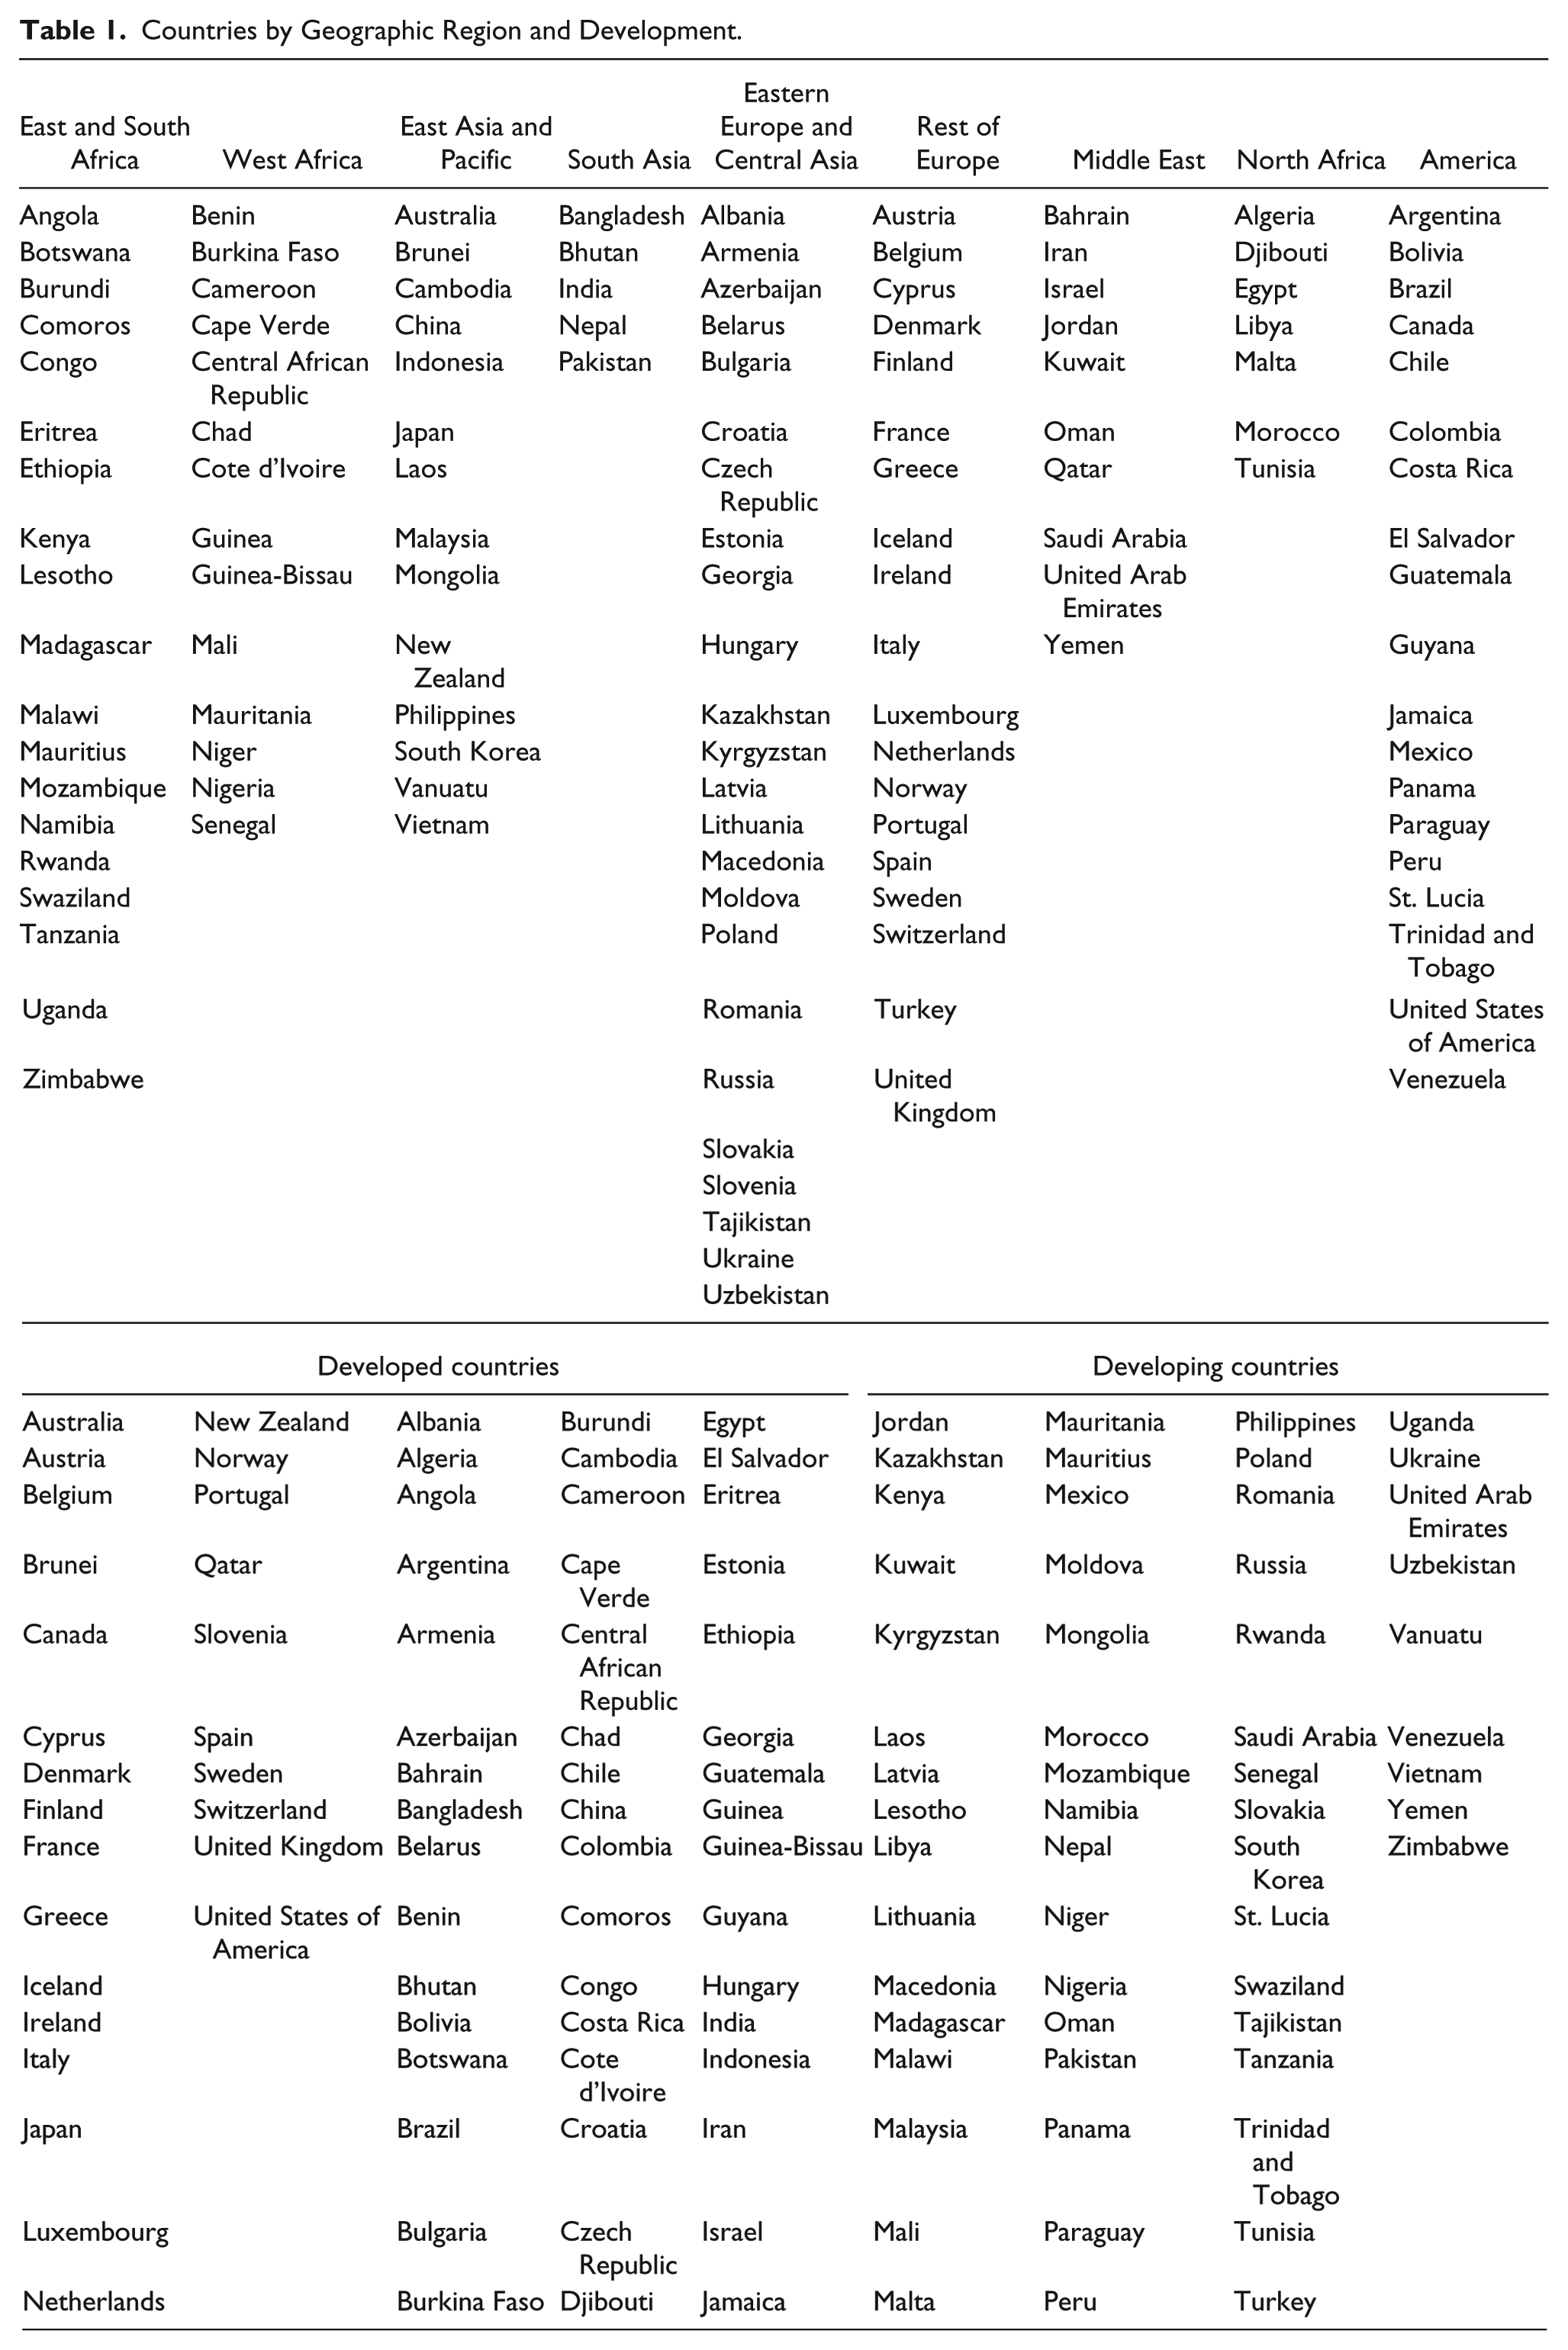
We compiled data from a variety of sources to construct a unique longitudinal dataset that spans from 1999 to 2005. The dataset is a cross-sectional time series and is identified by country-year. Because not all countries collect or report data on their higher education systems every year, we only include nations that reported two or more observations of tertiary enrollment rates to the World Bank during the time period of our analysis. The years used for analysis were also bounded due to the availability of data as some measures used in this study were not collected for a majority of nations prior to 1999. After making adjustments for missing values, our estimating sample includes 131 nations. We do not attempt to define what is (and what is not) a country in our analysis and instead rely on the set of countries identified by each of the data sources used in this project. 1 A list of countries included in the dataset grouped by geographic region and development status can be found in Table 1.
Countries by Geographic Region and Development.
We selected event history modeling as our methodological technique and conceptual framework because it allows us to avoid common pitfalls associated with using cross-sectional data or traditional regression techniques to study temporal events (DesJardins, 2003). Because we are interested in the timing of gross tertiary enrollment rate expansion,
event history approaches allow us to use data that contain information not only about the state a unit or individual is in, but also how long they have been in that state or how long they remain in that state. (DesJardins, 2003, p. 426)
In describing our methodological approach, we also need to reflect on what we mean by tertiary education policy. Not all nations have an explicit policy to encourage specific tertiary enrollment levels. However, we do observe differing tertiary enrollment rates across countries and observe how policies at the national level can shape tertiary education outcomes. Following Doyle (2006), we modify Berry and Berry’s (1990, 2007) event history model such that our variable of interest is not the adoption of a particular policy but rather the outcome of policy adoption—namely, gross tertiary education enrollment rates. As opposed to constructing a variable of interest that depends on the passage of a single policy, this approach enables us to test nations that use a constellation of policies—related to institutional funding, student financial aid, labor markets, and so on—to impact tertiary enrollment rates. By modifying Berry and Berry’s event history model in this way, this study is able to test for substantial national investment in tertiary enrollment as it relates to Trow’s theoretical model of higher education growth.
Our measure of tertiary enrollment is from the UNESCO Institute for Statistics. Gross tertiary enrollment rates are the ratio of total number of students (regardless of age) enrolled in tertiary education to the population of the 5-year age group following on from the secondary school leaving age. We chose to use this gross enrollment rate measure because it is a good measure of the overall number of tertiary enrollments in a country and it allows for comparisons across nations with different population sizes. Source information for this measure is in Table 2.
Variable List, Descriptions, and Sources.
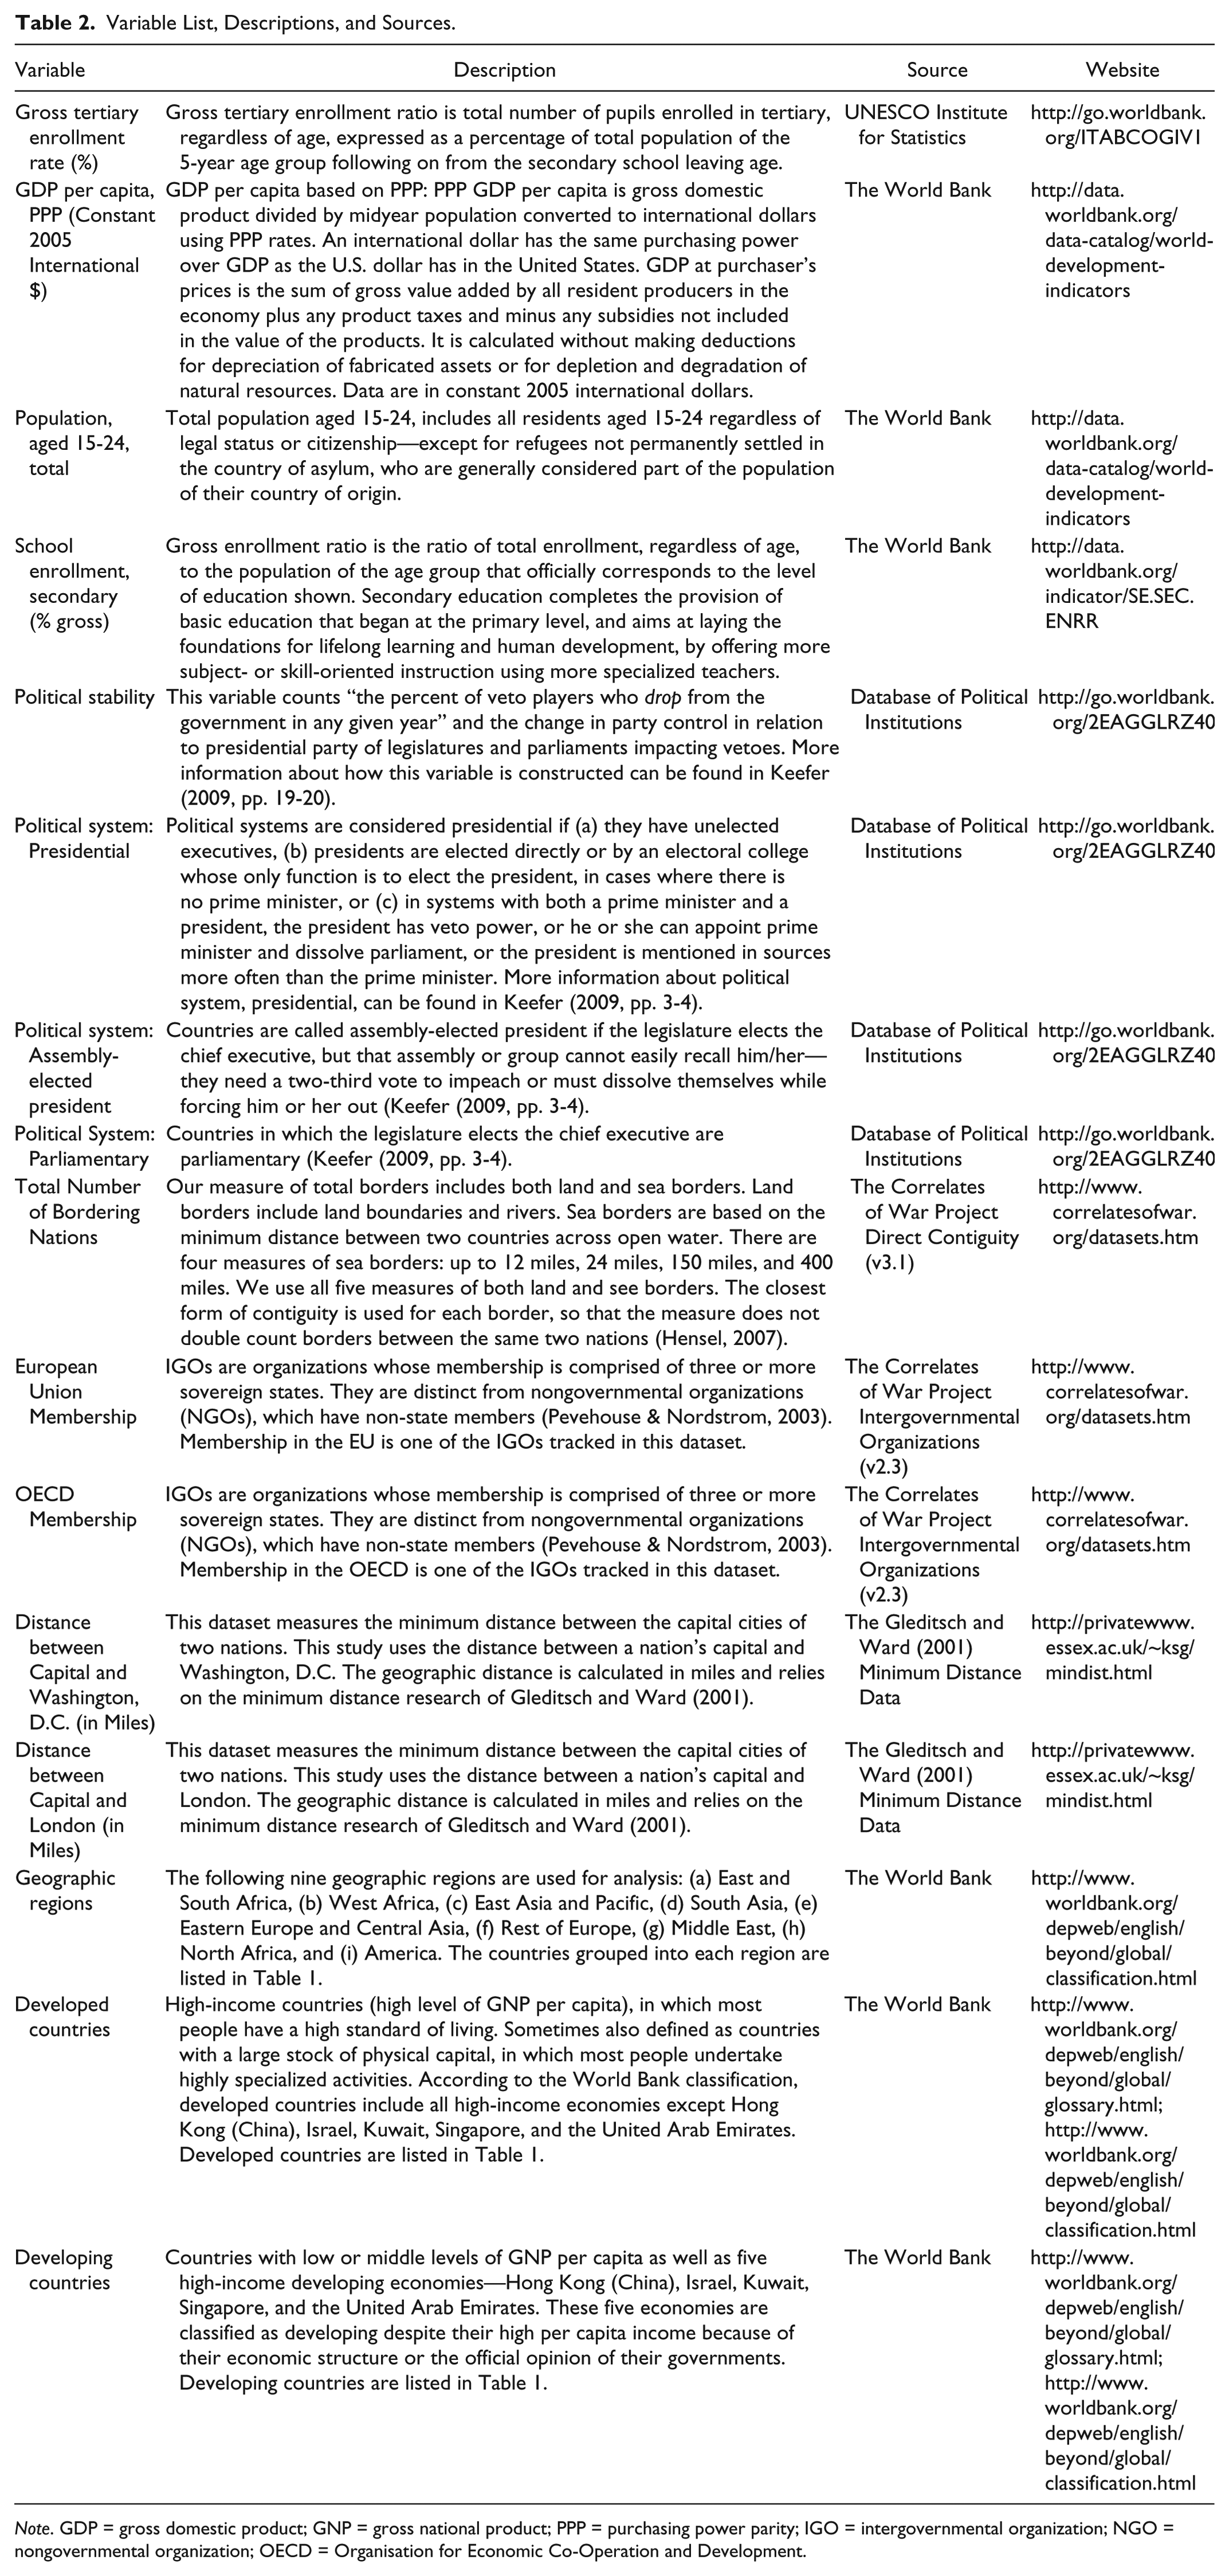
Note. GDP = gross domestic product; GNP = gross national product; PPP = purchasing power parity; IGO = intergovernmental organization; NGO = nongovernmental organization; OECD = Organisation for Economic Co-Operation and Development.
To construct our variable of interest for this analysis, we used Trow’s (1972) definition, which quantifies elite systems as having less than 15% gross enrollment rates, massified systems as having gross enrollment rates between 15% and 50%, and universal systems as having gross enrollment rates above 50%. In this study, we define two separate failure events—when a county achieves or surpasses the gross enrollment rate thresholds of 15% and 50%, achieving massified and universal systems, respectively. In our analysis, we are interested in how long (as measured by years) it takes for a nation to cross each of the gross enrollment rate thresholds. Hence, the dependent variable for this study is the hazard rate of surpassing each threshold.
To illustrate the coding used in this study, we created figures for two nations. The first country, Mauritius, is shown in Figure 1 and is used to illustrate the analysis related to the 15% gross enrollment threshold. In the first year of our analysis in 1999, Mauritius had an elite higher education system with a gross tertiary enrollment rate of 7.2%. From 1999 to 2002, for 4 years, Mauritius was part of the risk set for the massified threshold analysis. Although there were some ups and downs in gross tertiary enrollment rates in Mauritius, the nation did not surpass the 15% gross enrollment rate threshold until 2003. Therefore, the country experienced a failure event in 2003 and left the risk set. Gross enrollment rates remained above 15% for the remaining years of analysis, so Mauritius did not re-enter the risk set during our analysis.
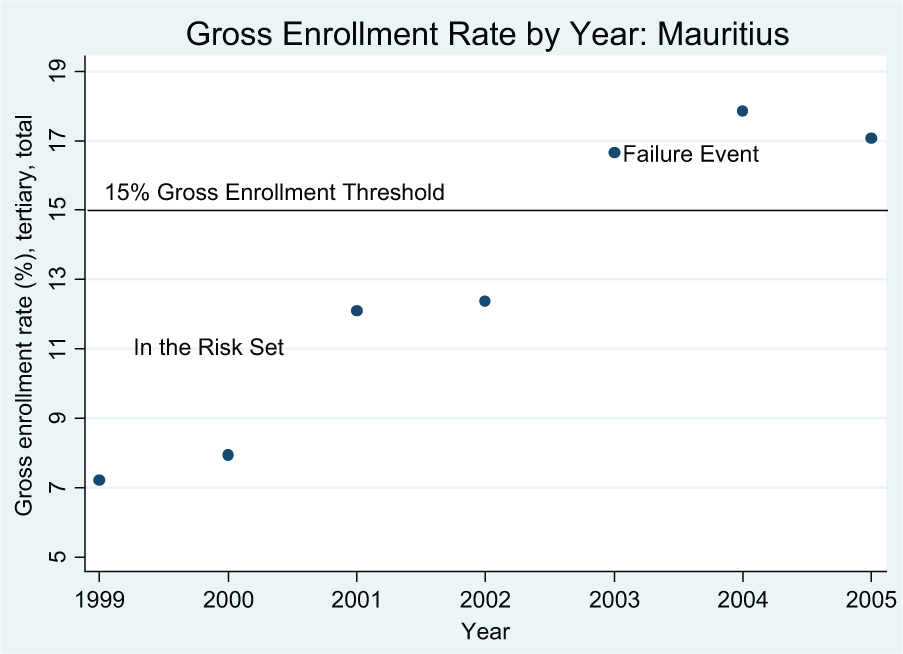
Mauritius’s gross tertiary enrollment rates, 1999-2005.
The second country, Japan, is shown in Figure 2 and is used to illustrate the 50% gross enrollment rate threshold. In the first year of our analysis, Japan’s gross tertiary enrollment rate was 45.18%, a massified system. Japan started in the risk set for the universal threshold analysis in 1999 and remained there for 3 years until 2001. In 2002, Japan experienced a failure event by crossing the threshold for having a gross tertiary enrollment rate greater than 50%. Gross enrollment rates remained above 50% for the remaining years of analysis, so Japan did not re-enter the risk set during the time period of the analysis.
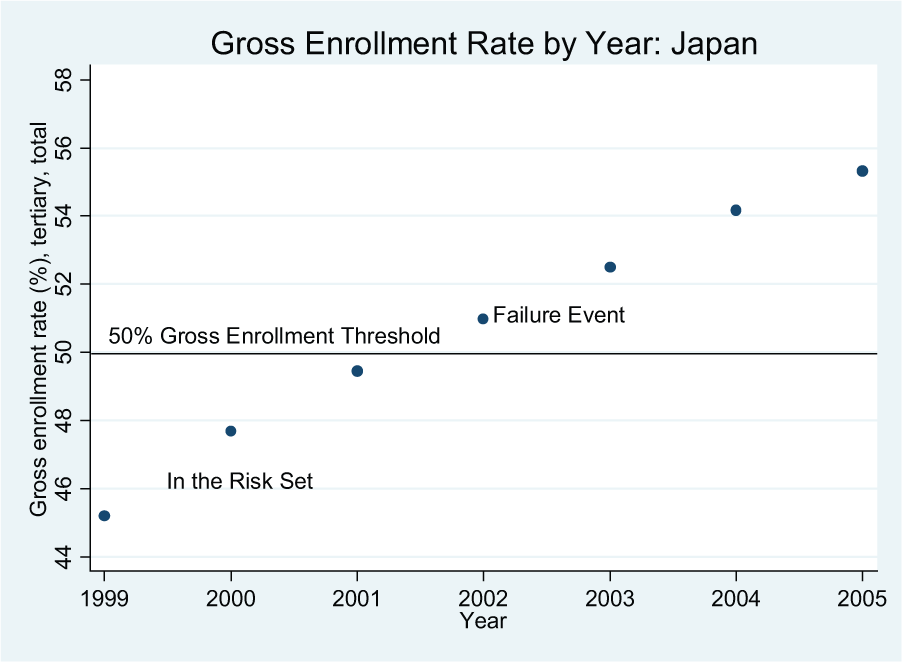
Japan’s gross tertiary enrollment rates, 1999-2005.
We conduct a similar analysis for each of the countries in our dataset, documenting the length of time each nation was below each of Trow’s enrollment thresholds and marking failure events in the year when nations moved above each threshold. Of course, not all nations surpassed both thresholds within the time period of our analysis. In addition, not all nations experienced increases in gross enrollment rates. Because nations can either increase or decrease their gross enrollment rates each year, we allowed countries to enter the risk set at any point during the analysis. In addition, nations can enter the risk set (or fall below the enrollment thresholds) more than one time during the analysis. We have adjusted our analysis and our application of Berry and Berry’s basic event history model to allow for re-entry into the risk set.
Our event history model defines the risk set to be the set of nations that are at risk of experiencing a failure event (or crossing one of the thresholds) at time t. Because we are interested in modeling two different events, we run our analyses for each threshold (15% and 50%) separately. A nation enters the risk set whenever their gross enrollment rate falls below the threshold. The event of interest is a nation that has increased its gross enrollment rate above the threshold. A country leaves the risk set every time its gross enrollment rates exceed the threshold. The dependent variable is then the hazard rate, or the rate of change in probability of leaving the risk set for exceeding the threshold.
In this article, we present two different analyses of our events of interest. The first is descriptive and is shown in Kaplan–Meier curves. Kaplan−Meier curves are derived from Kaplan−Meier estimates (Kaplan & Meier, 1958). A generalization of this sample survivor function for censored data (Kalbfleisch & Prentice, 2002) is

where,

where,
tj, j = 1 . . . k denotes the times at which failure occurs
nj is the number at risk of failure just before time tj
dj is the number of failures at time tj
The failure function is

The second analysis used in this article is a technique called a Cox proportional hazards model, which estimates the influence of various control variables on the hazard rate of surpassing the gross enrollment threshold. “The hazard rate provides information about the risk of having an event at a specific point in time, given that the event did not occur prior to that time” (DesJardins, 2003, p. 429). A description of the empirical specifications of this method can be found in Cox (1972). Cox specifies the hazard rate as
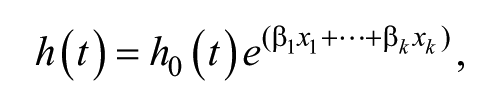
where,
t is the time, as measured in years,
countries are 1 . . . k,and
x is a 1 ×k vector of covariates for each country.
The baseline hazard h0(t) is not directly estimated, but the cumulative hazard H0(t) is. From the cumulative hazard, an estimate of the baseline survivor function S0(t) is calculated. We use the Breslow method to handle tied failures to base our estimates on the largest possible risk pool for each tied failure event (STATACorp, 2009).
In our analysis from 1999 to 2005, there are both left and right censoring issues. Left censoring exists in our analysis as some of the countries in the dataset surpassed the enrollment thresholds defined in this study before 1999; thus, we cannot detect the exact year in which they achieved these thresholds. Right censoring also occurs because some countries did not cross the enrollment thresholds by the end year of the dataset (by 2005), but these countries might do so after 2005. Again, we cannot detect the year that they crossed these thresholds as our analysis ends before all possible events have occurred (Allison, 2010). This study uses the Cox proportional hazards model to understand how within-country characteristics and diffusion factors affect the hazard rate of the gross tertiary enrollment rate surpassing the thresholds (15% and 50%) defined by Trow.
Time-Dependent Covariates
As part of our Cox models, we include a number of time-dependent covariates (control variables) in our analysis. They are clustered into two primary groups—internal determinants and diffusion factors. Table 2 contains detailed descriptions and source information for each variable.
We use five measures of internal determinants in our model. These are all variables that we hypothesize to be related to the tertiary education system and tertiary enrollment levels in each country. The first is data on per capita gross domestic product (GDP). For this variable, we use a measure from the World Bank that is in 2005 constant dollars and is a measure of purchasing power parity. We hypothesize that nations with more resources will be more likely to support larger tertiary education systems.
The second measure is a measure of the total college-aged population of a country, regardless of legal status or citizenship. This variable is also collected by the World Bank. We use a measure of population aged 15 to 24, as this is the best available World Bank age range that includes traditional college-aged populations for most nations. We hypothesize that nations with larger college-aged populations are more likely to invest in tertiary education than are other nations.
The third measure is the gross secondary school enrollment rate, which is collected by the World Bank. We hypothesize that countries with higher secondary school participation rates will have higher societal demand for tertiary education, which increases the probability of expanding tertiary education in a nation.
We also use data from the Database of Political Institutions (DPI) to capture the institutional characteristics of the political landscape of each country, including measures of stability and the political system (Beck, Clarke, Groff, Keefer, & Walsh, 2001). The first measure of stability is a measure of the amount of disunity among members of different political parties within each nation’s political system. The second measure captures the type of political system—presidential, assembly-elected president, or parliamentary. We hypothesize that countries with more stable government systems will be more likely to invest in tertiary education than other nations. In addition, we hypothesize that presidential systems of government will be more likely to invest in tertiary education because the head of state is directly elected and should be more responsive to the populous than more diffuse parliamentary systems.
We test for two different types of diffusion in our models—geographic diffusion and an international interaction model. The first type of diffusion assumes that diffusion occurs through geographic proximity to other nations. We use three primary measures of geographic diffusion. The first is a measure of the number of borders a nation shares with other nations. This model posits that nations that share a border are more likely to influence each other’s tertiary education policies than are nations not in proximity to each other. We hypothesize that nations with more neighbors are more likely to adopt a policy to increase their gross tertiary enrollment rates than are nations with fewer bordering nations. We use a measure of the total number of borders for each nation including both land and sea borders as defined by the correlates of war direct contiguity data project (Gochman, 1991; Stinnett, Tir, Schafer, Diehl, & Gochman, 2002).
Our second measure of geographic diffusion is a fixed-region model. This model posits that nations emulate policies of other nations within their region. We hypothesize that nations within regions, which contain many other nations that have surpassed a gross enrollment threshold, will be more likely to surpass the gross enrollment threshold than other nations. Based on World Bank classifications, we use nine regions in our analysis. A list of countries included in each region can be found in Table 1.
The third type of geographic diffusion that we test for is a proximity to a nation that is a pioneer in tertiary education. We conceptualize this as a modified geographic version of a leader-laggard model. This model assumes that some nations are pioneers in the adoption of tertiary education enrollment policy and that other nations follow the lead of these pioneers. We hypothesize that geographic proximity to a pioneering nation increases the likelihood that a nation will adopt the gross enrollment policy of that pioneering nation. In our model, we identified two nations that have historically been leaders in tertiary education—the United States and the United Kingdom. We selected these two nations because of their status as net importers of international students and the historic emulation of these higher education systems. To test for the geographic proximity of each nation in our dataset to these two countries, we relied on a measure of geographic distance between a nation’s capital city and either Washington, D.C., or London. Our data on geographic distance are a measure (in miles) of the minimum distance between the two capital cities and was developed by Gleditsch and Ward (2001).
The second type of diffusion that we test for is an international interaction model. This model assumes an international communications network in which national officials learn about tertiary enrollment policies from leaders of other nations. To test this network idea, we use a measure of membership in intergovernmental organizations (IGOs). IGOs are organizations whose membership is comprised of three or more sovereign states. We hypothesize that the networks within these IGOs are likely to influence policy in member nations. Our data on IGOs come from the correlates of war IGO dataset (Gochman, 1991; Pevehouse & Nordstrom, 2003). From this dataset, we selected two IGOs—the European Union (EU) and the OECD—that are active in tertiary education policy. We hypothesize that nations that are members of these IGOs will be more likely than non-member nations to increase their tertiary enrollment rates.
Background
Figure 3 shows increases in the minimum, mean, and maximum gross tertiary enrollment rates across all countries each year, from 1999 to 2005. On average, 25.32% of students who graduated from secondary school enrolled in tertiary education in 1999. In 2005, the mean of gross tertiary enrollment rates increased to 32.86%. The range of gross tertiary enrollment rates among countries spanned from a minimum of 0.27% in Djibouti in 1999 to a maximum of 91.99% in Finland in 2005.
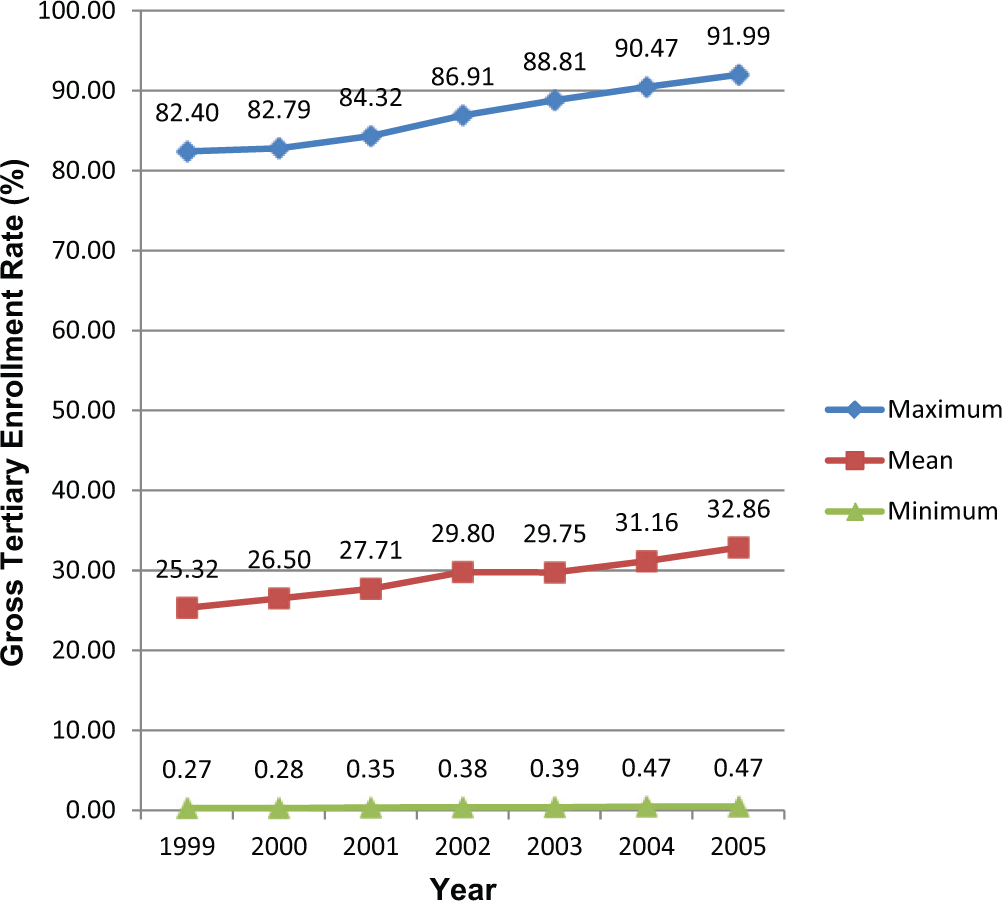
Minimum, mean, and maximum of gross tertiary enrollment rate (%) across countries by year, 1999-2005.
Table 3 presents the percent change in gross tertiary enrollment rates by country between 1999 and 2005. Not all nations provided data on gross tertiary enrollment rates to the World Bank each year; thus, only nations for which there were observations in both 1999 and 2005 are listed in Table 3. This table shows that 84 countries’ gross tertiary enrollment rates increased, with 15 countries having a very large increase of more than 100%. Only 13 countries (Austria, Azerbaijan, Bulgaria, Central African Republic, Egypt, Kuwait, Mauritania, Philippines, Qatar, Swaziland, United Kingdom, Uzbekistan, and Yemen) experienced a decrease in gross tertiary enrollment rates, with the decrease rate ranging from 0.4% to 46.02%. In general, the global trend is toward increasing gross tertiary enrollment rates.
Change in Gross Tertiary Enrollment Rates Between 1999 and 2005, by Country.
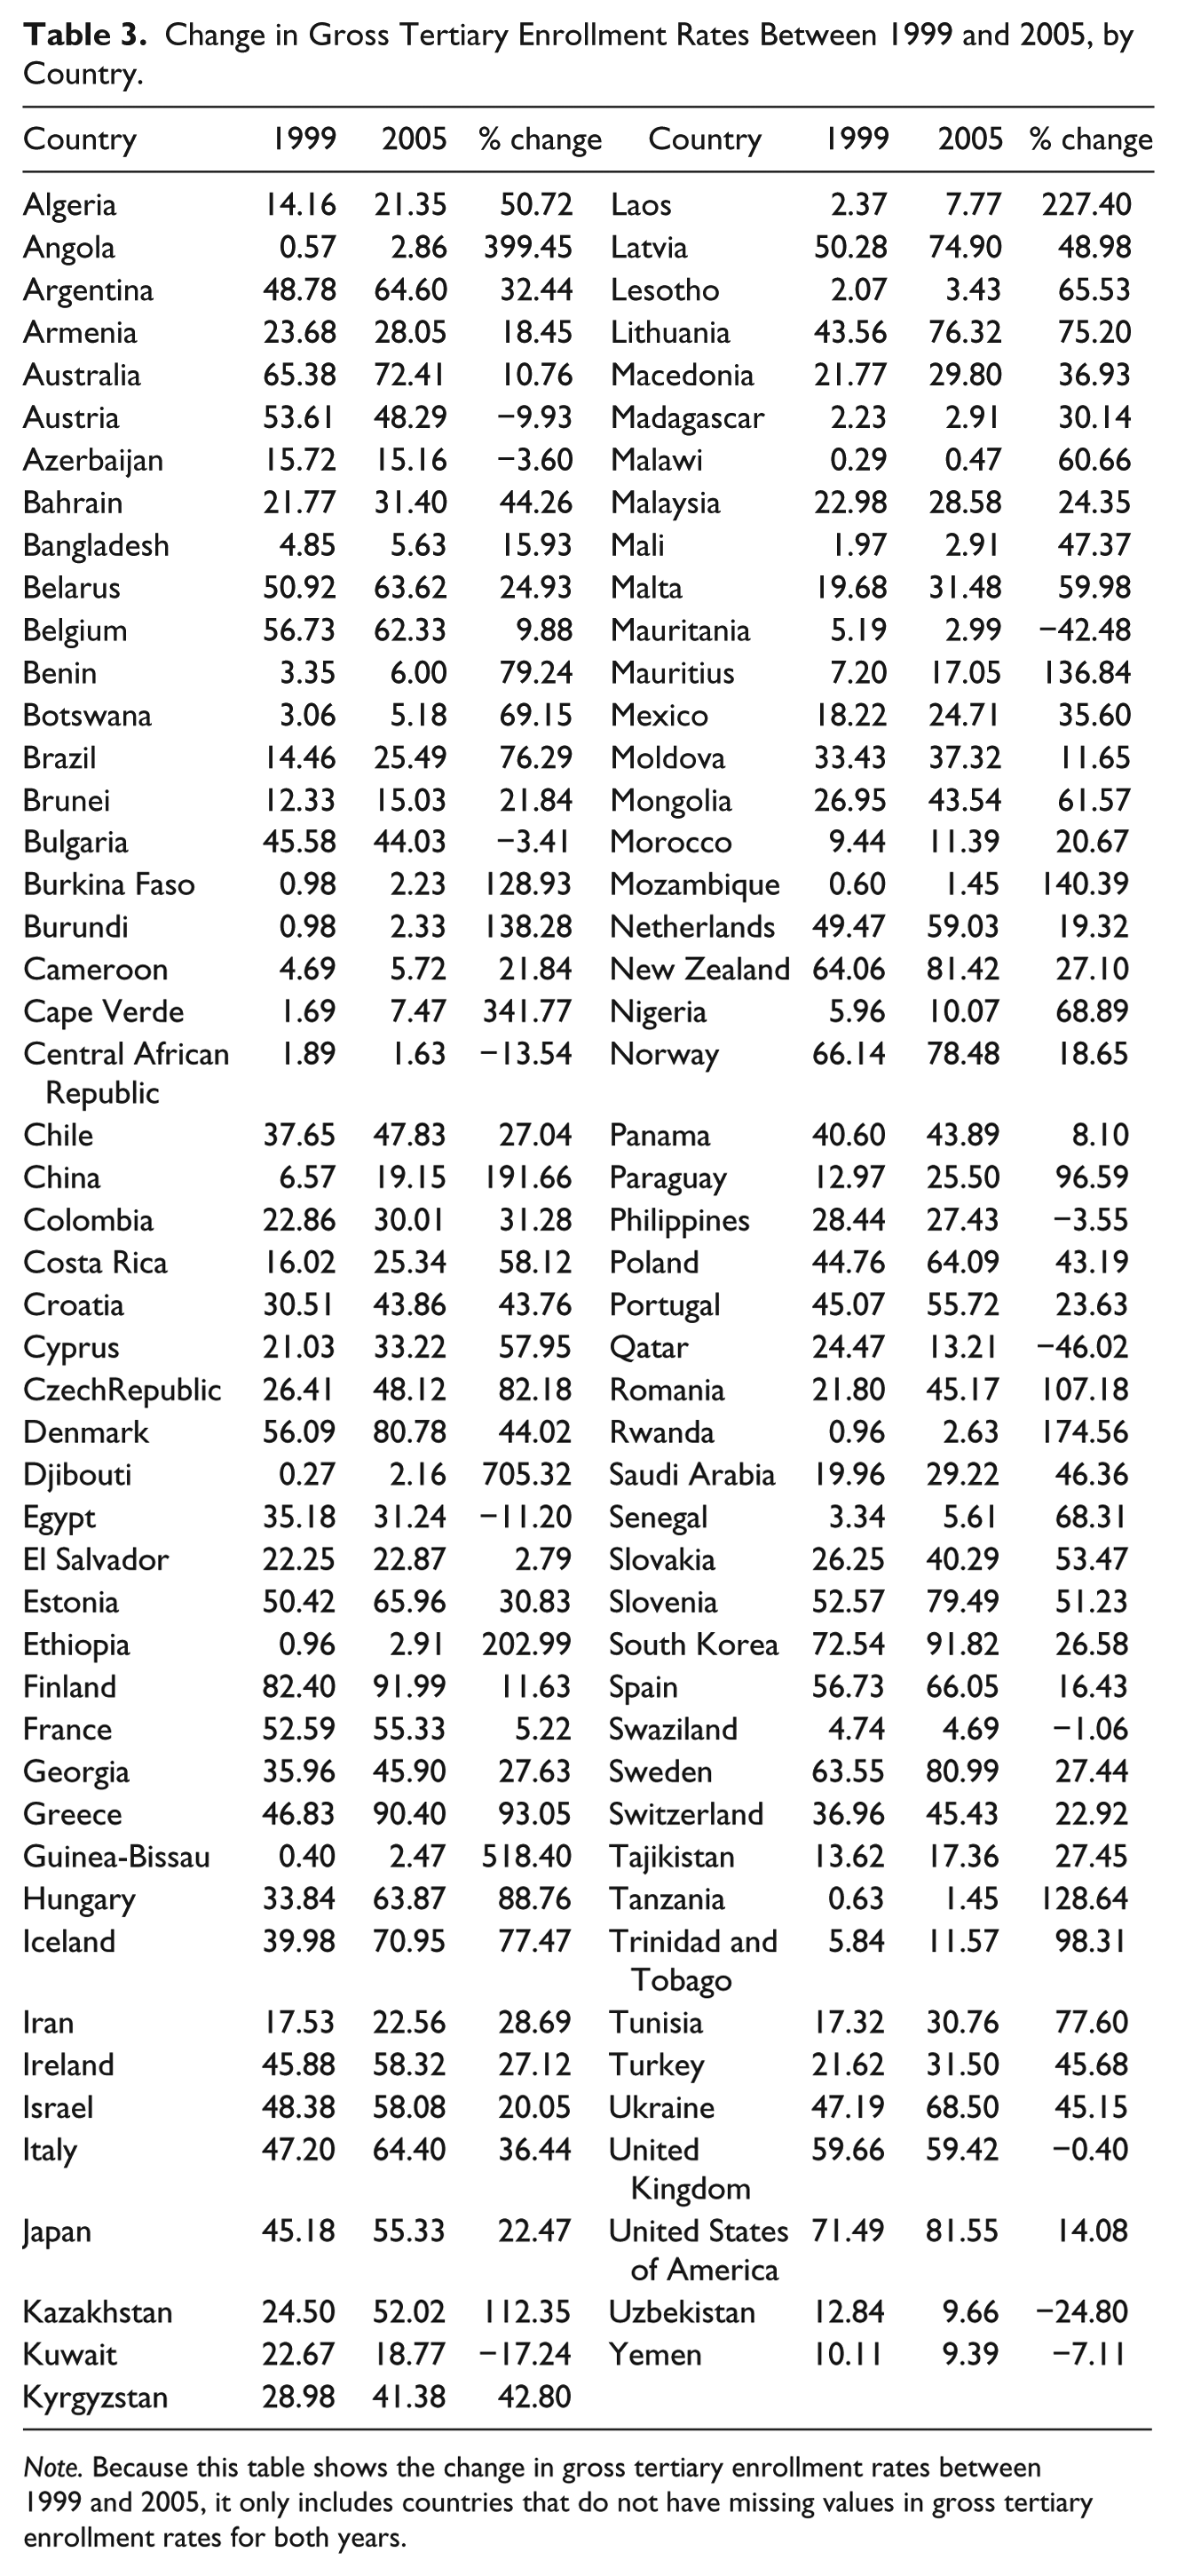
Note. Because this table shows the change in gross tertiary enrollment rates between 1999 and 2005, it only includes countries that do not have missing values in gross tertiary enrollment rates for both years.
Results
This study plots Kaplan–Meier curves and uses the Cox proportional hazard models to examine countries’ hazard rates of experiencing two levels of higher education growth identified by Trow: elite-to-massified (or broader) systems and massified-to-universal systems. Descriptive statistics for variables used in this study are shown in Table 4.
Descriptive Statistics for Variables in Analysis.

Note. Standard deviations are not adjusted for clustering. PPP = purchasing power parity; OECD = Organisation for Economic Co-Operation and Development.
From Elite to Massified: Crossing the 15% Gross Tertiary Enrollment Rate Threshold
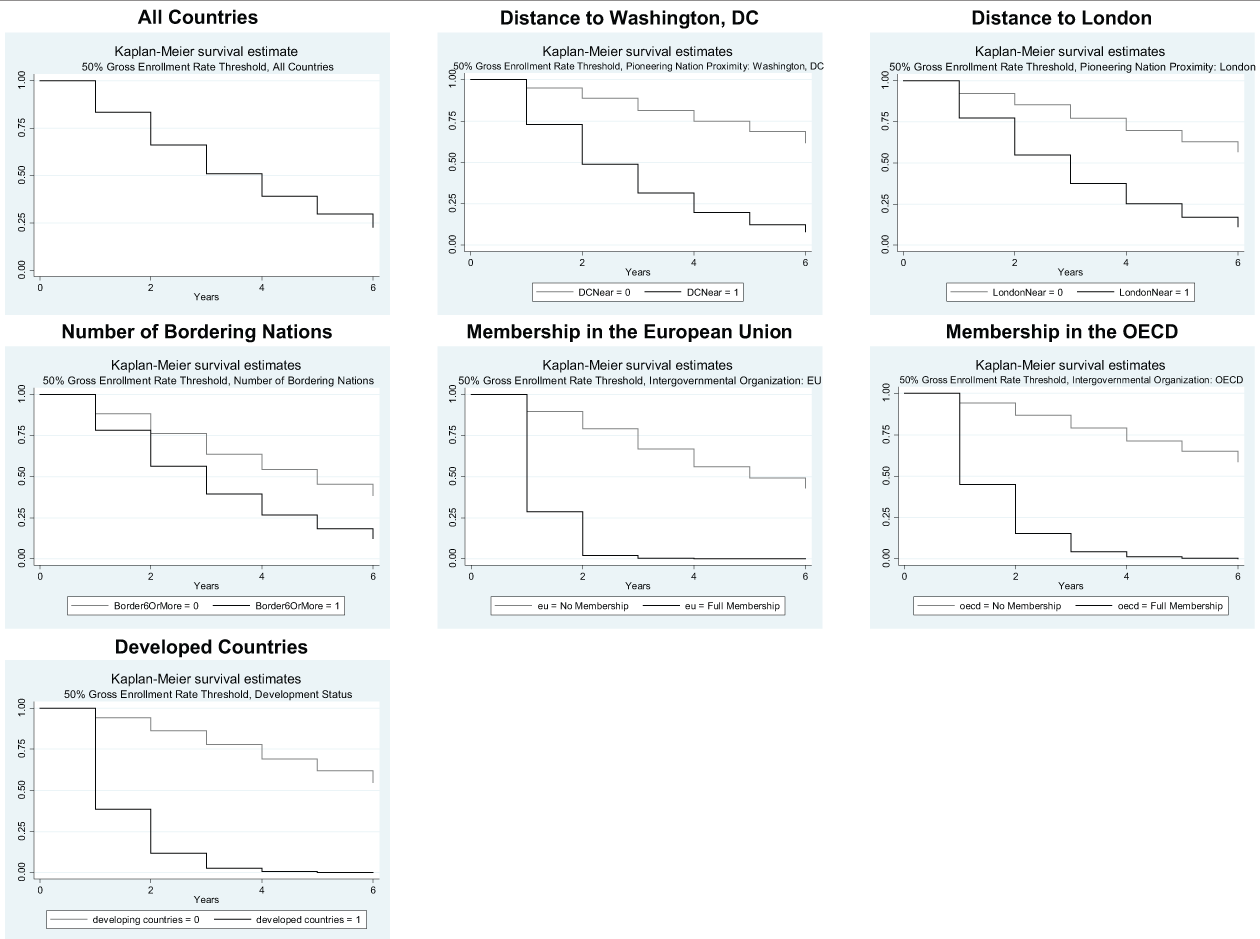
We begin analyzing Kaplan–Meier curves for the first threshold—shifting from an elite to a massified system, or increasing gross tertiary enrollment rates above 15%—over time, from 1999 to 2005. Figures 4 and 5 plot Kaplan–Meier curves of survival rates for all countries, by distance to higher education centers (Washington, D.C., and London), number of bordering nations, membership in two IGOs (the EU and OECD), development status, and geographic region.
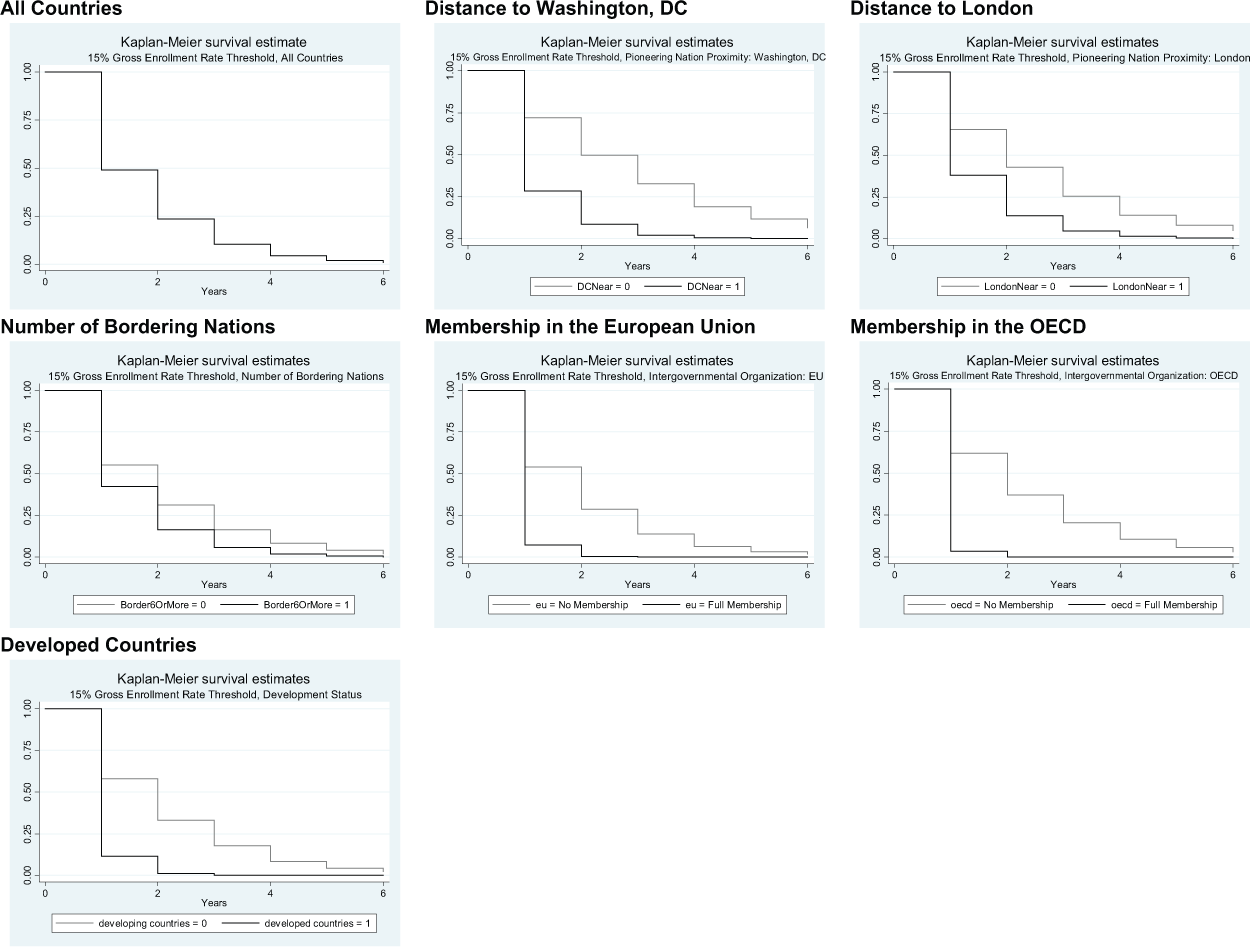
Kaplan–Meier curves for the 15% gross tertiary enrollment rate threshold, for all countries, and by number of bordering nations; distance to Washington, D.C., and London; membership in the European Union and OECD; and development: 1999-2005.

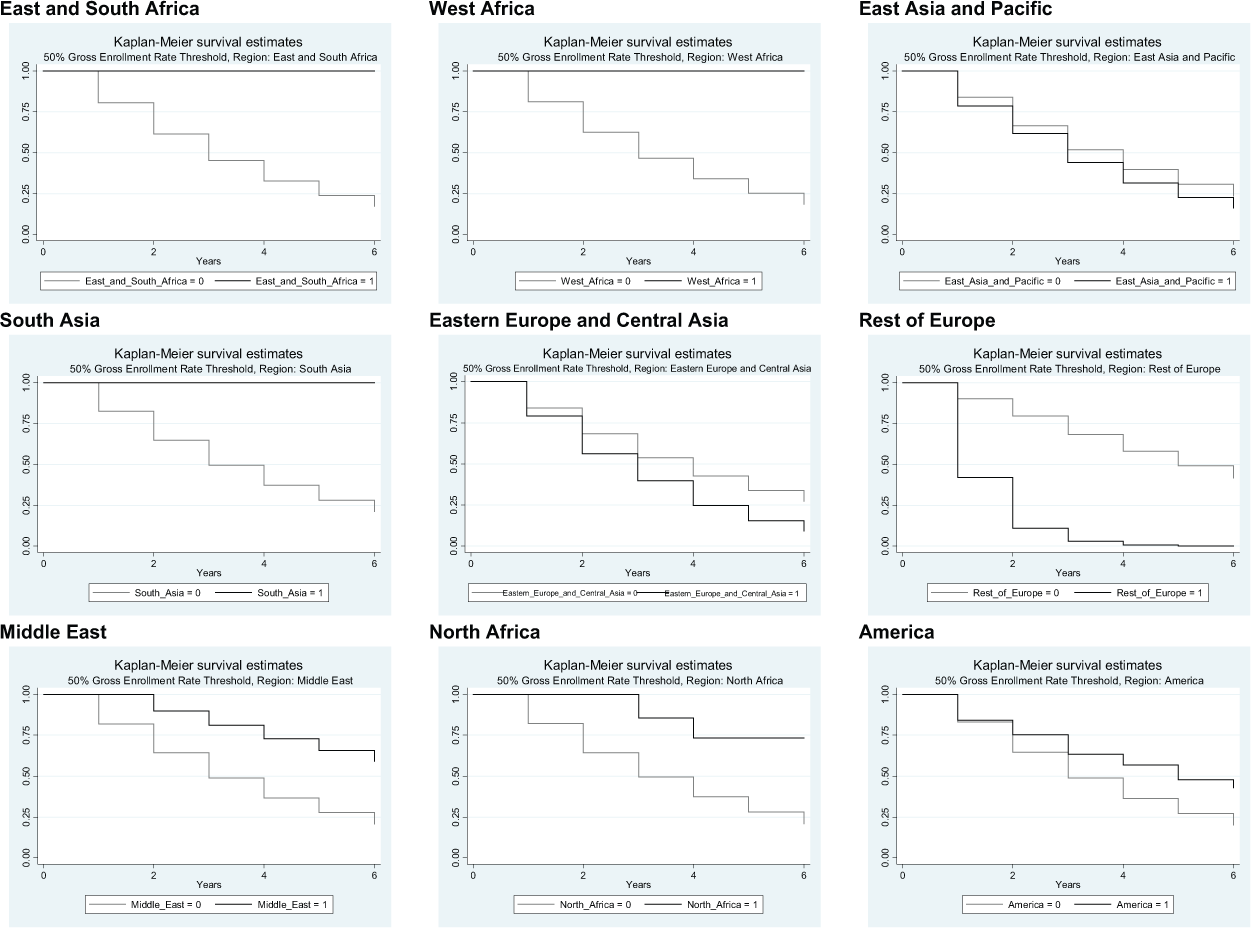
Kaplan–Meier curves for the 15% gross tertiary enrollment rate threshold, by geographic regions: 1999-2005.
The first Kaplan–Meier curve shows the survival function allowing for re-entry for the 15% enrollment threshold for all nations. The Kaplan–Meier curves show the survival function allowing for re-entry, which relates to the nations that remain in the risk set and do not experience a failure event by crossing the threshold. Considering the diffusion factors that we hypothesized to influence the policy of increasing tertiary enrollment, Kaplan–Meier curves in Figure 4 show that countries near higher education pioneers, with more neighbors, with membership in the EU and OECD, and developed countries surpassed the 15% gross tertiary enrollment rate threshold more quickly than nations that do not share these characteristics between 1999 and 2005. Countries in different geographic regions achieved this threshold at different rates and with different proportions (see Figure 5).
Countries whose capital cities are located geographically close to higher education centers—Washington, D.C., and London—shifted their higher education systems from elite to massified more quickly than countries located farther from these pioneering nations. Countries with six or more bordering nations reached the 15% threshold more quickly than countries with five or fewer neighbors. In contrast to member countries, countries without membership in either the EU or OECD took longer to move from an elite to a massified tertiary education system. Compared with developed countries, developing countries passed the 15% threshold much more slowly.
As Figure 5 shows, Eastern Europe and Central Asia, and the Rest of Europe are two geographic regions where countries surpassed the 15% gross enrollment threshold much faster than nations in other regions. Countries located in the Middle East and America reached the 15% threshold more quickly than other countries, but not as markedly as nations located in Eastern Europe and Central Asia, and the Rest of Europe. In East Asia and Pacific, and North Africa, nations were about equal to the average survival function for the rest of the globe. None of the countries in West Africa and South Asia met this threshold. This study next uses Cox proportional hazard models to empirically predict the hazard rate of increasing gross enrollment rates above 15%, controlling for both within-country characteristics and diffusion factors.
Our empirical analysis begins by examining the effects of a set of within-country characteristics on the hazard rate of achieving a massified tertiary education system (see Model 1 in Table 5). The set of within-country characteristics tested in this model includes per capita GDP, college-aged (15-24) population, gross secondary school enrollment rates, and characteristics capturing each country’s political landscape: political stability and system. In this model, per capita GDP has a significant but negative effect (p< .05) on surpassing the 15% threshold of gross tertiary enrollment rates, although the magnitude of this effect is small—a $1,000 international dollars increase in per capita GDP decreases the hazard rate of crossing the massified threshold by 1.2%, that is, 1,000 × (100 [1 − 0.999988]%). Gross secondary school enrollment rates significantly and positively influence the shift from an elite to a massified tertiary enrollment rate (p< .01). A one percentage point increase in gross secondary school enrollment rates increases a country’s hazard rate of moving to massified tertiary enrollment by 2.7%, that is, 100 (1.027 − 1)%. Compared with countries whose political systems are presidential, those with parliamentary systems are significantly less likely to move their tertiary education from elite to massified (p< .1). Having a parliamentary political system reduces the hazard rate for a country to reach the 15% tertiary enrollment threshold by 19%, that is, 100 (0.81 − 1)%. Countries with higher GDPs, higher secondary school enrollment rates, and presidential systems of government are more likely to increase tertiary enrollment rates to the massified level.
Cox Proportional Hazard Model, Gross Enrollment Rates Massified, Allowing Re-Entry.
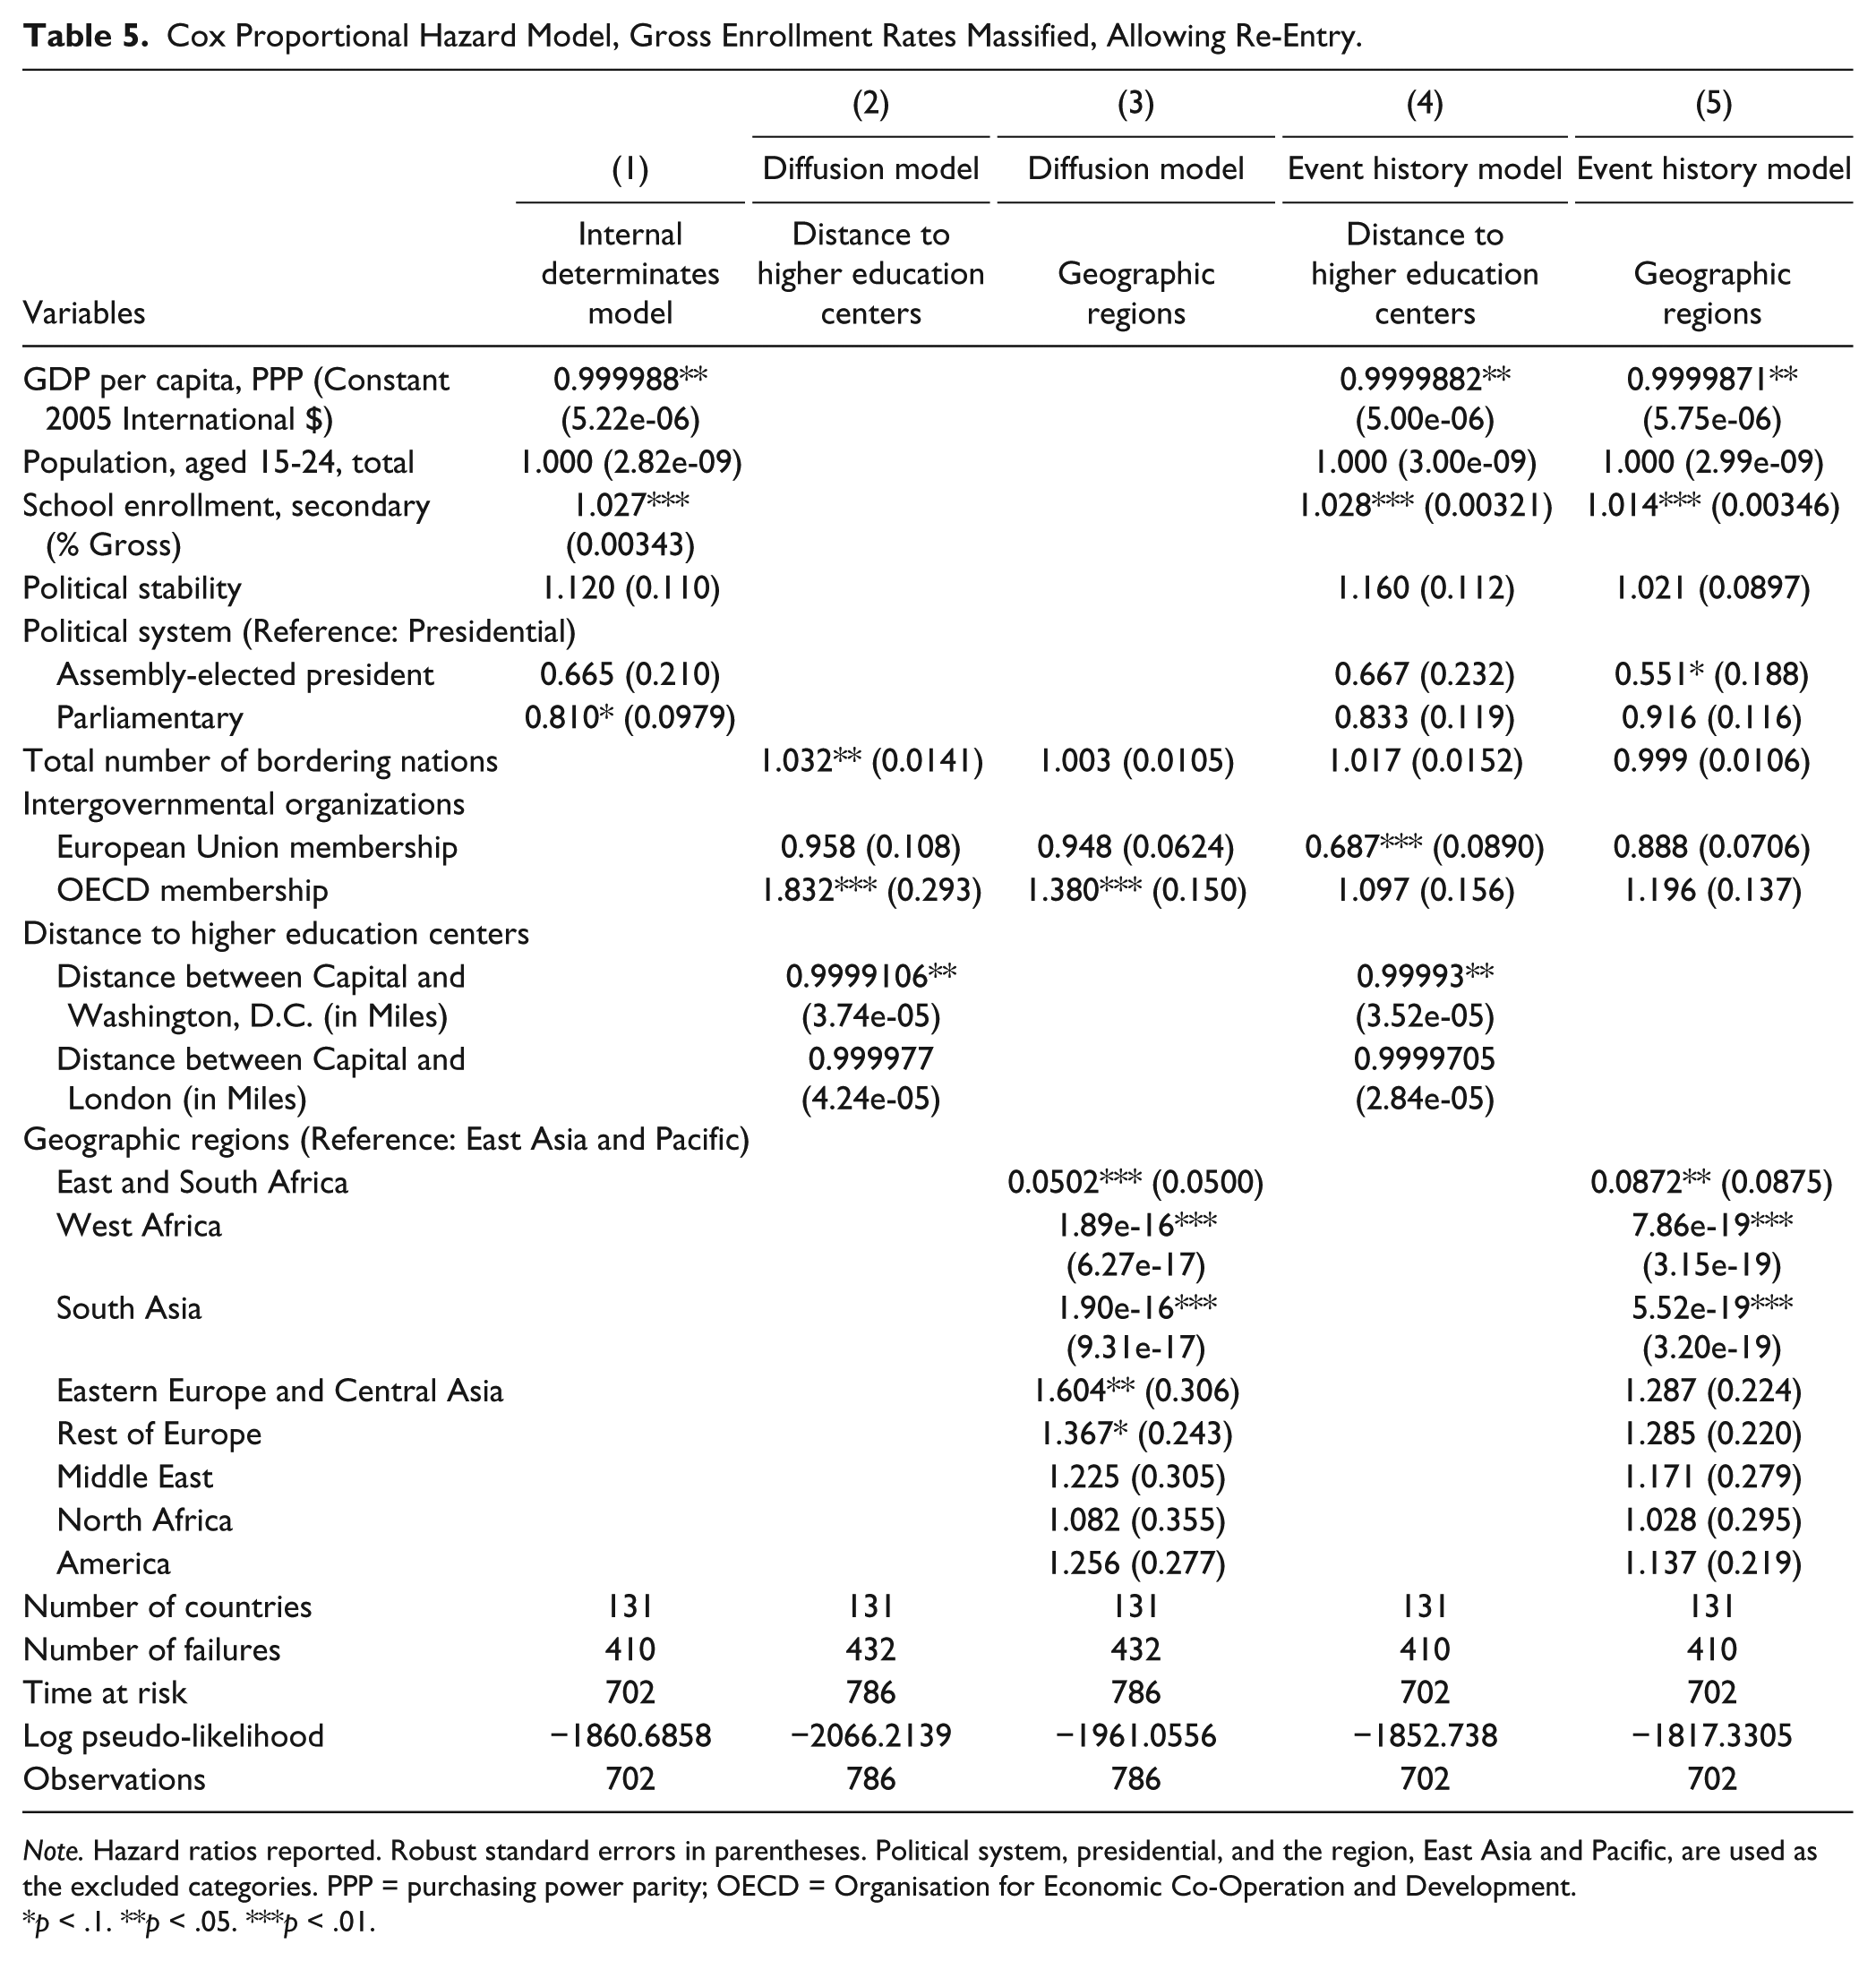
Note. Hazard ratios reported. Robust standard errors in parentheses. Political system, presidential, and the region, East Asia and Pacific, are used as the excluded categories. PPP = purchasing power parity; OECD = Organisation for Economic Co-Operation and Development.
p < .1. **p < .05. ***p < .01.
Next, this study investigates how diffusion factors affect nations’ policy to shift from elite to massified levels of tertiary enrollment rates. We run two separate diffusion models because measures capturing proximity to higher education centers (Washington, D.C., and London) are correlated with the regional measures. Model 2 in Table 5 includes two diffusion factors capturing proximity to higher education centers. Being 1,000 miles more distant from Washington, D.C., reduces a country’s hazard rate of expanding to massified tertiary enrollment by 8.94% (p< .05), indicating that being closer to Washington, D.C., is favorable for increasing gross tertiary enrollment rates above 15%. In this model, there are two other diffusion factors (total number of bordering nations and OECD membership) that have significant and positive effects on the shift from elite to massified tertiary education (p< .05 or smaller). Having one more neighbor increases a country’s hazard rate of surpassing the 15% tertiary enrollment threshold by 3.2%. Being a member country in the OECD greatly increases this hazard rate by 83.2%. The second diffusion model tested, Model 3 in Table 5, includes eight geographic regions with the ninth (East Asia and Pacific) as the comparison group. In this model, the significant effect of total number of bordering nations disappears; however, the positive and significant effect of the OECD membership still holds (p< .01). Compared with countries in East Asia and Pacific, countries in East and South Africa, West Africa, and South Asia are significantly less likely to achieve the massified level of tertiary enrollment (p< .01). Countries located in Eastern Europe and Central Asia as well as the rest of Europe significantly increase the hazard rate by 70.6% and 43.2%, respectively (p< .1 or smaller).
By running the full event history model, which combines within-country characteristics and diffusion factors (including two measures capturing proximity to higher education centers), the results in Model 4 of Table 5 show a significant negative effect of per capita GDP, but the magnitude of this effect is small (p< .05). A one percentage point increase in gross secondary school enrollment rates increases a country’s hazard rate of crossing the 15% gross tertiary enrollment rate threshold by 2.8% (p< .01). Regarding diffusion factors, being located geographically closer to Washington, D.C., has a significant effect on the move from elite to massified tertiary enrollment (p< .05). One surprising result shows that, after controlling for within-country characteristics, having the membership in the EU significantly reduces the hazard rate of moving to massified tertiary enrollment by 31.3% (p< .01). The results shown in Model 5 of Table 5, which incorporates the regional factors, show a negative but small effect of per capita GDP and a positive effect of gross secondary school enrollment rates on tertiary enrollment expansion to the massified level (p< .05 or smaller). The hazard rate of moving to massified tertiary enrollment for countries with an assembly-elected president is only a half of those for countries with a presidential system (p< 0.1). Countries in East and South Africa, West Africa, and South Asia are significantly less likely than East Asia and Pacific to reach the 15% tertiary enrollment threshold (p< .05 or smaller).
From Massified to Universal: Crossing the 50% Gross Tertiary Enrollment Rate Threshold
This section presents the results for the second level of tertiary education growth—moving from a massified to a universal system between 1999 and 2005. By plotting Kaplan–Meier curves, Figures 6 and 7 show the survival rates of achieving the 50% gross tertiary enrollment rate threshold for all countries and by the following diffusion factors: distance to higher education centers (Washington, D.C., and London), number of bordering nations, membership in two IGOs (the EU and OECD), development status, and geographic region. As Figure 6 illustrates, the survival function for all countries is more extended for the 50% threshold than it is for the 15% threshold (as shown in Figure 4), which shows that fewer nations crossed the 50% threshold than the 15% threshold. Being geographically close to a higher education center, having more neighbors, holding membership in either the EU or OECD, and being economically developed are conditions favorable for shifting from massified to universal tertiary education systems. Different survival rates also exist in nine geographic regions (see Figure 7).
Kaplan–Meier curves for the 50% gross tertiary enrollment rate threshold, for all countries, and by number of bordering nations; distance to Washington, D.C., and London; membership in the European Union and OECD; and development: 1999-2005.
Kaplan–Meier curves for the 50% gross tertiary enrollment rate threshold, by geographic regions: 1999-2005.
Countries whose capital cities are located close to either Washington, D.C., or London surpassed the 50% gross enrollment threshold faster than those with capital cities far from these two higher education pioneers. The rates of reaching the 50% gross enrollment threshold varied among countries with different numbers of neighbors. Countries with six or more bordering nations increased gross tertiary enrollment rates to the universal threshold more quickly than countries with fewer neighbors. Countries with membership in the EU or OECD were more likely to cross the 50% threshold than countries that do not hold membership in these IGOs. Likewise, developed nations more quickly moved over the 50% threshold than do developing nations.
Figure 7 shows Kaplan–Meier curves for the 50% gross tertiary enrollment rate threshold by geographic region. Among nine geographic regions, countries located in the Rest of Europe crossed the universal threshold much faster than nations in other regions. Although nations located in Eastern Europe and Central Asia, as well as East Asia and Pacific took longer than the Rest of Europe to reach the 50% gross enrollment threshold, being located in these two regions still appeared to be advantageous in passing the universal threshold. No countries in East and South Africa, West Africa, or South Asia met the universal threshold between 1999 and 2005. To empirically test how these factors affect the hazard rate of surpassing the 50% gross enrollment rate threshold, this study next uses Cox proportional hazard models.
Model 1 in Table 6 shows that two within-country characteristics—gross secondary school enrollment rates and political stability—significantly influence the hazard rate of crossing the universal tertiary enrollment threshold (p< .01). A one percentage point increase in gross secondary school enrollment rates increases a country’s hazard rate of passing the 50% threshold of gross tertiary enrollment rates by 3.6%. Having a more stable government system (increasing the political stability index by one unit) increases this hazard rate by 69.4%. These results indicate that secondary school enrollment rates and government system stability are significant factors in the length of time it takes for a nation to expand gross tertiary enrollment rates from massified to universal.
Cox Proportional Hazard Model, Gross Enrollment Rates Universal, Allowing Re-Entry.
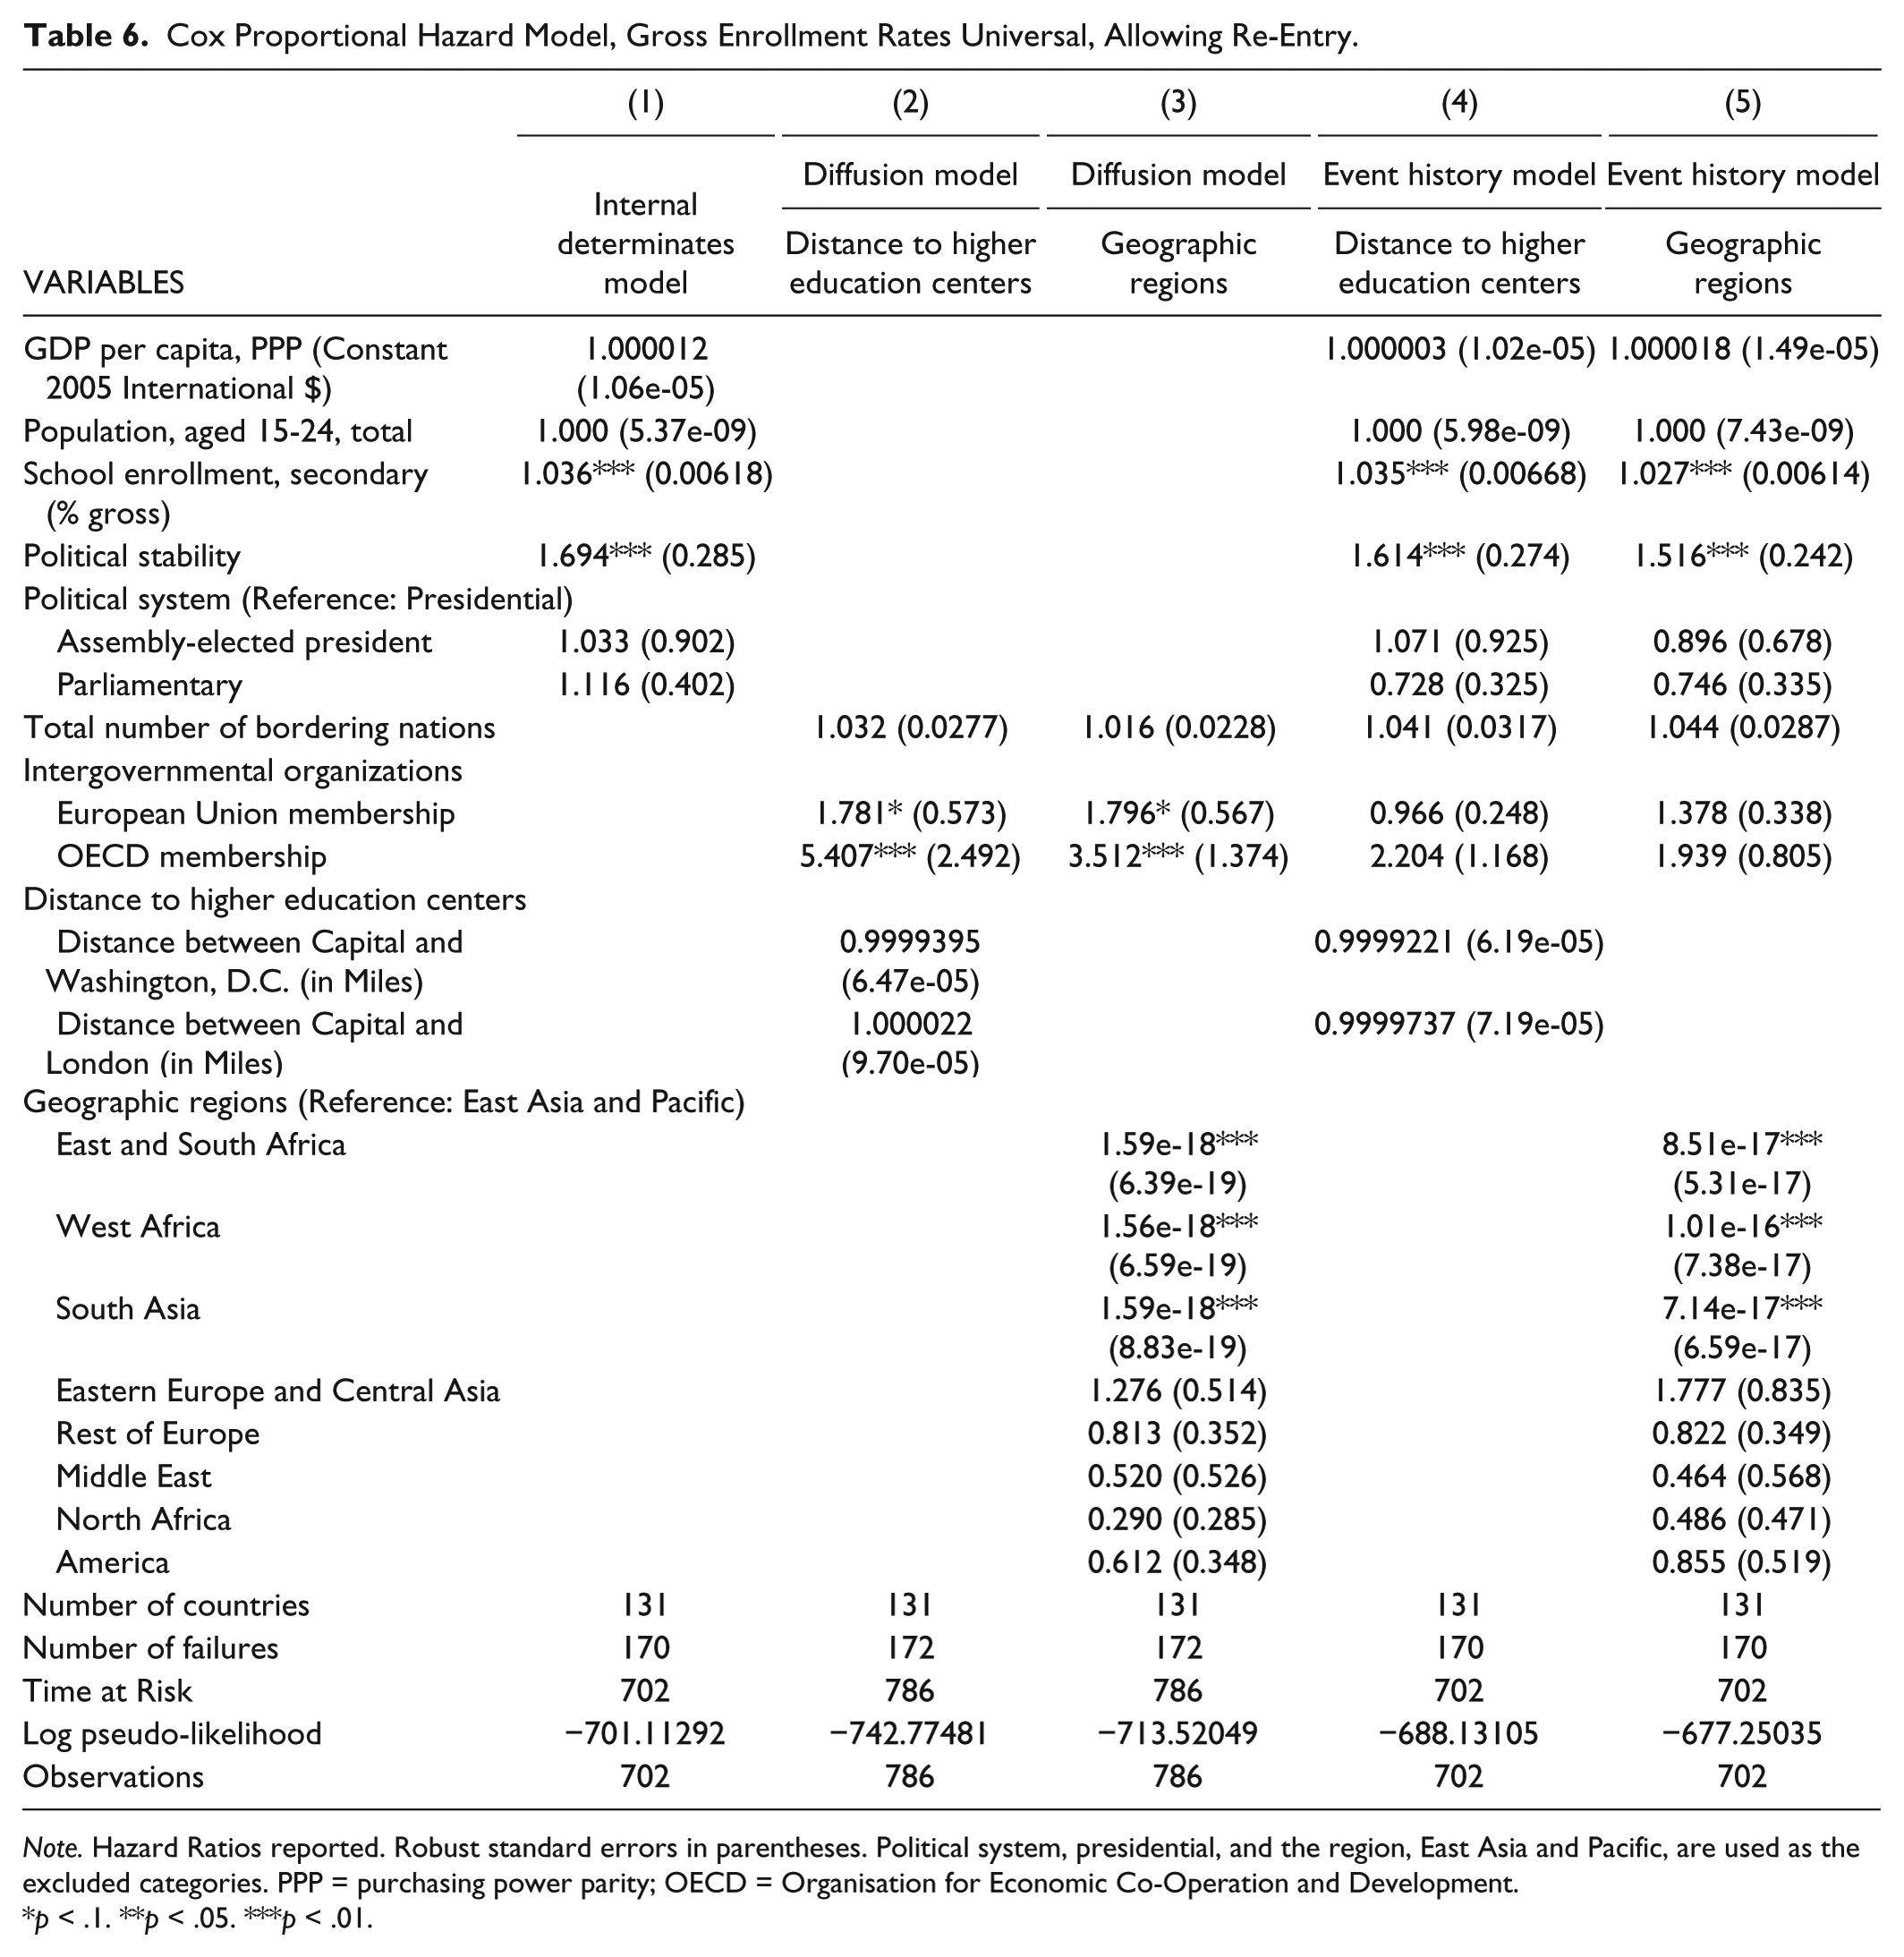
Note. Hazard Ratios reported. Robust standard errors in parentheses. Political system, presidential, and the region, East Asia and Pacific, are used as the excluded categories. PPP = purchasing power parity; OECD = Organisation for Economic Co-Operation and Development.
p < .1. **p < .05. ***p < .01.
By using two diffusion models, this study separates the regional measures from measures capturing proximity to either Washington, D.C., or London because these two geographic measures are correlated. As shown in Model 2 of Table 6, which includes measures capturing proximity to higher education centers, the two IGO networks have positive and significant effects in influencing their member countries to increase gross tertiary enrollment rates to the universal level (p< .1 or smaller). Being an EU member country significantly increases a country’s hazard rate of moving toward a universal tertiary education system by 78.1%. The OECD even has a greater impact. The hazard rates of crossing the universal tertiary enrollment threshold are more than 5 times higher for OECD member countries than for non-OECD member countries. In the second diffusion model, Model 3 of Table 6, which includes regional measures, the significant and positive effects of these two IGOs still hold (p< .1 or smaller). In addition, countries in East and South Africa, West Africa, and South Asia are significantly less likely than countries in East Asia and Pacific to cross the 50% threshold (p< .01).
With the combination of within-country characteristics and diffusion factors, Model 4 of Table 6 shows the full event history model, which includes proximity to higher education centers. This model shows significant and positive effects of gross secondary school enrollment rates and political stability (p< .01). A one percentage point increase in gross secondary school enrollment rates results in a 3.5% higher hazard rate of expanding tertiary enrollment to the universal level. Having a more stable government system (increasing the political stability index by one unit) increases this hazard rate by 61.4%. No other factor in this model has significant effects. By including regional measures in the full event history model, Model 5 of Table 6 also reveals significant and positive effects of gross secondary school enrollment rates and political stability (p< .01). Increasing gross secondary school enrollment rates by one percentage point and having a more stable government system (increasing the political stability index by one unit) increases a country’s hazard rate of surpassing the 50% gross tertiary enrollment rate threshold by 2.7% and 51.6%, respectively. In this model, after controlling for within-country characteristics, the effect of regional diffusion still holds (p< .01). Compared with East Asia and Pacific, being located in East and South Africa, West Africa, and South Asia have a much lower hazard rate of crossing the 50% threshold and achieving a universal tertiary education system.
Conclusions and Policy Implications
The global trend of expanding tertiary education enrollment rates is remarkable. Between 1999 and 2005, 86.6% of countries in this analysis experienced tertiary education expansion, and 17.9% of these countries increased gross enrollment rates more than 100%. This study finds that not only do internal conditions within a country but also the diffusion of ideas across borders promotes tertiary education expansion.
Tertiary education expansion consists of two levels in Trow’s theoretical model. In the first level—transforming from elite to massified tertiary education—we find that the wealth of a country (measured by per capita GDP), secondary school enrollment rates, a presidential governmental system, membership in the EU, distance to Washington, D.C., and the regional variables are factors that influence a country’s hazard rate of expanding gross tertiary education enrollment rates to the massified level. The second level of expansion is the shift from massified to universal tertiary education systems. In our analysis of this level of expansion, we find that secondary enrollment rates, political stability, and the regional variables are significant factors in a country’s hazard rate of expanding gross tertiary education enrollment rates to the universal level.
Gross secondary enrollment rates is an important internal determinant of gross tertiary enrollment rates. Countries that invest in secondary schools to prepare students for tertiary education have higher hazard rates of expanding tertiary education to both the massified level and the universal level. This is an important policy finding and one that speaks to the interconnectedness of secondary and tertiary education systems. It is simply not enough for nations to invest in tertiary education without also investing in a solid foundation for students at the secondary level to move into tertiary education. Thus, nations that aim to expand tertiary education for economic growth should also invest in secondary education.
The political landscape of nations is also an important predictor of gross tertiary education enrollment rates. The 15% threshold of gross tertiary enrollment rates is more likely to be achieved by a presidential system of government. As compared with governmental structures with either an assembly-elected president or a parliamentary system, nations with presidential government systems are more likely to expand to massified tertiary enrollment levels. This indicates that having a single governmental leader enhances tertiary enrollment policy and that the bully pulpit is important in focusing national attention and policy on tertiary education. In addition, a more stable government system benefits the achievement of crossing the 50% threshold. More stable government systems provide important foundations for the expansion of tertiary education enrollments. To achieve or sustain gross tertiary enrollment levels at the universal level, a well-functioning government and a stable political system is needed to both support institutional capacity and individuals’ ability to partake of tertiary education. From a policy perspective, it is important to recognize that political features of a nation matter for tertiary education expansion.
Diffusion factors also shape national tertiary education policy. The distance between a nation’s capital and Washington, D.C., is a significant factor for the hazard rate that a nation passes the massified tertiary enrollment threshold. Being located geographically closer to Washington, D.C., promotes the expansion of tertiary enrollment to the massified level, which indicates that a leader-laggard framework might help promote better understanding of the influence that nations have on each other in setting tertiary education policy. In other words, our results indicate that other nations are influenced by pioneering nations. This shows that tertiary education policy is not limited to with-in country policy but that pioneering nations can serve as leaders for shaping tertiary education enrollment growth policy for the world. This places pioneering nations as leaders in a diffusion process and raises the possibility that tertiary enrollment policy changes in a pioneering nation have the potential to shape the policies of other nations. If, for instance, the United States changed its policy with regard to tertiary access and equity, other nations, especially those geographically proximate, are likely to be influenced to react in a similar manner through a leader-laggard diffusion process.
The other diffusion factors that are consistently significant across models for both massified and universal tertiary enrollment thresholds are regional effects. This finding supports the idea that not only internal characteristics of a nation are important in setting tertiary education policy, but so too are the influences of other nations. For surpassing either the massified or universal threshold, three regions—East and South Africa, West Africa, and South Asia—have a negative, significant effect as compared with East Asia and Pacific. These findings indicate a relatively strong influence of regions in expanding tertiary education systems. Nations within a region do appear to be influenced by other nations within that same fixed geographic region. From a policy perspective, the idea that tertiary policy can be shaped by regions is important for understanding pathways to spread tertiary education policy globally. Given the significant influences of regions on tertiary enrollment policy, it seems likely that regional actors and regionally based cross-national organizations can shape tertiary education enrollment policy for the betterment of individuals and nations across entire regions of the world, perhaps through a mechanism similar to the Bologna process in Europe. Because of the strength of this diffusion finding, additional regional tertiary education policy development should be pursued in the future.
Future Directions for Research
We hope that this cross-national study of gross tertiary enrollments will encourage additional work in this area, especially work that uses cross-national analyses. The remarkable expansion of tertiary enrollments worldwide is ripe for additional study. This article provides an important look at the factors that influence the timing of tertiary enrollment expansion. The robust finding about the importance of both internal detriments and diffusion factors highlights the importance of researching both aspects of policy development at a cross-national level. Diffusion is less well understood in the education literature and we hope that more research can be done to better understand how diffusion influences international tertiary education policy. In addition, more qualitative research is needed to compliment the quantitative work presented in this article. In particular, we hope that future research can explore how pioneering nations influence each other, how the influence of pioneering nations can be described using a leader-laggard framework, and how nations within the same region influence each other.
Over all, this work has presented the results of event history analyses to better understand tertiary education expansion to two levels—the massified and universal. Better understanding the factors that influence investment in expanding tertiary education enrollment is important from a research perspective and has important implications for policy in an increasingly globalized world.
Footnotes
Authors’ Note
This article benefited from feedback received at the 2012 Globalizing Education in the 21st Century: The Bologna Reform and Beyond Conference, Champaign, Illinois; the 2012 Midwest Political Science Conference in Chicago, Illinois; the 2011-2012 Higher Education Student Association Brownbag series at the University of Illinois at Urbana–Champaign; and the 2011 American Education Research Association Annual Conference in New Orleans, Louisiana. However, any remaining errors or omissions are our own.
Declaration of Conflicting Interests
The author(s) declared no potential conflicts of interest with respect to the research, authorship, and/or publication of this article.
Funding
The author(s) received no financial support for the research, authorship, and/or publication of this article.