
Abstract
Introduction
Driving is a key component of mobility and functional independence for many older adults (Choi, Adams, & Mezuk, 2012; Dickerson et al., 2007). The process of driving cessation has been associated with a host of negative consequences for psychosocial and physical well-being, including increased depressive symptoms (Fonda, Wallace, & Herzog, 2001; Marottoli, Mendes, Glass, & Williams, 1997), decreased out-of-home activity levels (Marottoli et al., 2000), reduced network of friends (Mezuk & Rebok, 2008), and accelerated health decline (Edwards, Lunsman, Perkins, Rebok, & Roth, 2009). Driving is an important means of retaining functional independence and personal autonomy for many older adults, but older drivers are at elevated risk of injury and mortality from vehicular accidents compared to other age groups (Centers for Disease Control and Prevention, 2011). In this context, competing public health needs arise in developing policy toward older drivers: promoting functional and psychosocial independence in later life while balancing potential harm to older adults and fellow drivers on the roadways.
The U.S. older population will grow more racially and ethnically diverse as it grows larger, reflecting the demographic changes in the U.S. population (Federal Interagency Forum on Aging-Related Statistics, 2010). In 2008, non-Hispanic Whites accounted for 80% of the population aged 65 and above; however, their proportion is projected to decrease to 59% by 2050 (Federal Interagency Forum on Aging-Related Statistics, 2010). Conversely, the proportion of Blacks in the older population is projected to increase from 9% in 2008 to 12% by 2050 (Federal Interagency Forum on Aging-Related Statistics, 2010). Considering the upcoming demographic changes and increasing diversity in the older population, it is important to identify factors that may contribute to functioning of older adults differently by race and gender in order to develop strategies that promote population health.
Previous studies have reported that women and ethnic minorities are more likely to be nondrivers or former drivers than non-Hispanic white men, even at similar levels of functioning (Choi & Mezuk, 2012; Freedman, Martin, & Schoeni, 2002; Mezuk & Rebok, 2008). It is unclear, however, what processes are most relevant in understanding these disparities. Previous work has indicated that women, particularly married women, stop driving at earlier ages than men (Kostyniuk, Trombley, & Shope, 1998); although it is unclear whether this trend is as robust for the baby boomer generation. Also, older Blacks are less likely than older Whites to be current drivers (Choi & Mezuk, 2012; Mann, McCarthy, Wu, & Tomita, 2005), and Blacks also report higher burden of functional limitations than other groups (Kelley-Moore & Ferraro, 2001).
Favorable social position (e.g., having a more prestigious occupation, more wealth, or being a member of a dominant social group) can become a resource that produces further relative gains and protects against losses (DiPrete & Eirich, 2006). Due to the interplay between institutional arrangements and individual life trajectories, patterns of inequality within and among cohorts emerge and persist over time (O’Rand, 1996). Given this concept of cumulative advantage and disadvantage, we hypothesize that the gender and racial disparities in driving cessation will widen with increasing age.
Therefore, building from this earlier work, we hypothesized that
Hypothesis 1: The factors that predict driving cessation will differ for men and women and for Whites and Blacks.
Hypothesis 2: Gender and racial disparities in driving cessation will widen with increasing age.
Hypothesis 3: The impact of participation in the Advanced Cognitive Training for Independent and Vital Elderly (ACTIVE) study on likelihood of driving cessation will differ by gender and race.
Methods
Study Sample
The ACTIVE study is a multisite, randomized, controlled, single-masked trial designed to determine whether cognitive training interventions can affect cognitively based measures of daily functioning (Clinical Trials identifier: NCT-00298558). Details of the sample and intervention strategy have been described previously (Jobe et al., 2001). Briefly, 2,802 participants aged 65 and over were randomly assigned to one of four treatment groups (memory, reasoning, speed of processing, or control) and assessed at baseline (Jobe et al., 2001). Follow-up interviews were conducted immediately after the intervention period (posttest), and then at 12, 24, 36, and 60 months following completion of training (Wolinsky et al., 2010). Interviews included measures of cognitively demanding everyday functioning, health-related quality of life, health-service utilization, and sociodemographic characteristics (Jobe et al., 2001). We limited the sample to ACTIVE participants who had considered themselves to be active drivers at some point in their lives (N = 2,645). At baseline the sample population was 74.8% women and 74.0% White, with a mean baseline age of 73.5 years (SD = 5.9). The majority (n = 394, 96%) of the 411 non-White participants were African American. We restricted our longitudinal analysis to those who were driving at the baseline and retained at the annual follow-ups (n = 1,789). Of this sample, 205 (11.5%) participants stopped driving at some point during the 5 years of observation. The ACTIVE Study was approved by Institutional Review Boards at each of the six sites. This secondary analysis received exemption status from the Institutional Review Board at Virginia Commonwealth University.
Measures
Driving status was assessed using the Driving Habits Questionnaire (DHQ), an 18-item measure of driving behaviors. Current drivers were defined as “someone who has driven a car within the last 12 months and would drive a car today if they needed to” (Edwards, Myers et al., 2009). Of the 2,645 participants, included 2,393 (90.5%) were current drivers at baseline, and 252 participants (9.5%) were former drivers who reported stopping driving before the baseline assessment. Driving cessation was defined as the change in driving status from current driver to former driver (coded as 1 = ceased driving, 0 = continued to drive). Of the 1,789 active drivers at the baseline, 205 (11.5%) stopped driving during the 5 years of observation.
Socioeconomic characteristics included age (treated as a continuous variable), gender (coded as 1 = men, 0 = women), race (coded as White = 1, non-White = 0 due to the limited number of racial and ethnic minorities), marital status (dummy coded as 1 = married, 0 = not married), and years of education (treated as a continuous variable).
Several functional characteristics that might influence driving cessation were measured (Edwards, Bart, O’Connor, & Cissell, 2010; Tennstedt et al., 1998). Cognitive impairment was assessed with the Mini-Mental Status Exam (MMSE), consisting of a brief assessment of orientation to time and place, recall ability, short-term memory, and arithmetic ability (Folstein, Folstein, & McHugh, 1975). Participants had to have a score of 23 or better to participate. Depressive symptoms were assessed using the Center for Epidemiological Studies—Depression (CES-D) scale (Radloff, 1977). The 12-item version of this measure asked participants to report the frequency (never, less than once a day, 1-2 days, 3-4 days, 5-7 days) during the past week that they experienced certain symptoms or feelings (score range: 0-36). Visual acuity was measured by performance on the Good-Lite LD-10 eye chart from a distance of 10 feet and was scored between 0 and 90 as detailed by Jobe et al. (2001). A far visual acuity of 20/50 or better (scores of 40-90) was required for inclusion. For the Turn-360 test, a dynamic measure of balance, participants were asked to turn in two complete circles. The number of steps required to turn each circle was counted, with fewer steps indicating better balance (Reuben & Siu, 1990). Speed of processing for visual attention was measured with the Useful Field of View (UFOV), and Complex Reaction Time (CRT) was measured with the Road Sign Test. The UFOV measures how well participants can notice objects around them (in the periphery) when they are paying attention to something in front of them. UFOV scores range from 16 to 500 for each of 4 subtests, and the composite score of four tasks was used in analyses (Edwards et al., 2005). The CRT test measures how quickly a participant can recognize that one of four possible traffic signs has changed relative to either three or six signs, with higher scores indicating slower reaction times. The average across the two conditions was used in analyses. Physical functioning was measured using the physical subscale of Medical Outcomes Study Short Form-36 (SF-36). This subscale indicates the extent to which respondents are limited in their physical activities due to health and ranges from 0 to 100, with higher scores reflecting better health and functioning (Stewart et al., 2001). Grip strength was measured directly by having participants squeeze the handle of a dynamometer as hard as possible with their dominant hand. Self-reported health was also assessed and collapsed into two levels for analysis (coded as 1 = excellent/very good/good, 0 = fair/poor).
Analytic Strategy
Initially, the baseline differences between former and current drivers in terms of sociodemographic characteristics and health conditions were examined using chi-square tests for categorical variables and t tests for continuous variables. Logistic generalized estimating equations (GEE) with an independent correlation structure and robust standard errors were used to identify predictors of driving cessation by gender and race over the 5-year study period. The GEE approach accounts for the correlation among repeated measures within individuals over time (Liang & Zeger, 1986). All models included main effects for age, race, and gender. We initially investigated the influence of 12 potential confounders: marital status, education, MMSE, CES-D, UFOV, visual acuity, CRT test, SF-36 physical functioning, grip strength, Turn-360, self-rated health, and ACTIVE intervention arm. We subsequently excluded covariates that were not significantly associated with driving status at baseline or were strongly correlated with other factors to avoid collinearity (e.g., SF-36 and self-rated health). The final models were adjusted for marital status, education, MMSE, UFOV, visual acuity, CRT test, and SF-36 scores. We evaluated whether the influence of demographic and functional characteristics differed by gender and race using stratified analyses and formally tested potential differences using interaction terms between cognitive interventions and gender as well as between cognitive interventions and race. We also evaluated whether the impact of the ACTIVE interventions on driving cessation differed by gender and race using interaction terms in separate logistic GEE models. Analyses were conducted using STATA v.11 statistical software, and all p values refer to two-tailed tests.
Results
About 1 out of 10 ACTIVE participants (n = 252) had stopped driving before the baseline assessment. These former drivers were distinct from current drivers in terms of sociodemographic characteristics and health conditions (Table 1). Former drivers were more likely to be women, older, non-White, less educated, and less likely to live with a spouse. Overall, former drivers had poorer functional and health status than current drivers. There were no significant differences in ACTIVE intervention status (randomization) between current and former drivers.
Baseline Characteristics of Current and Former Drivers in the ACTIVE Study.
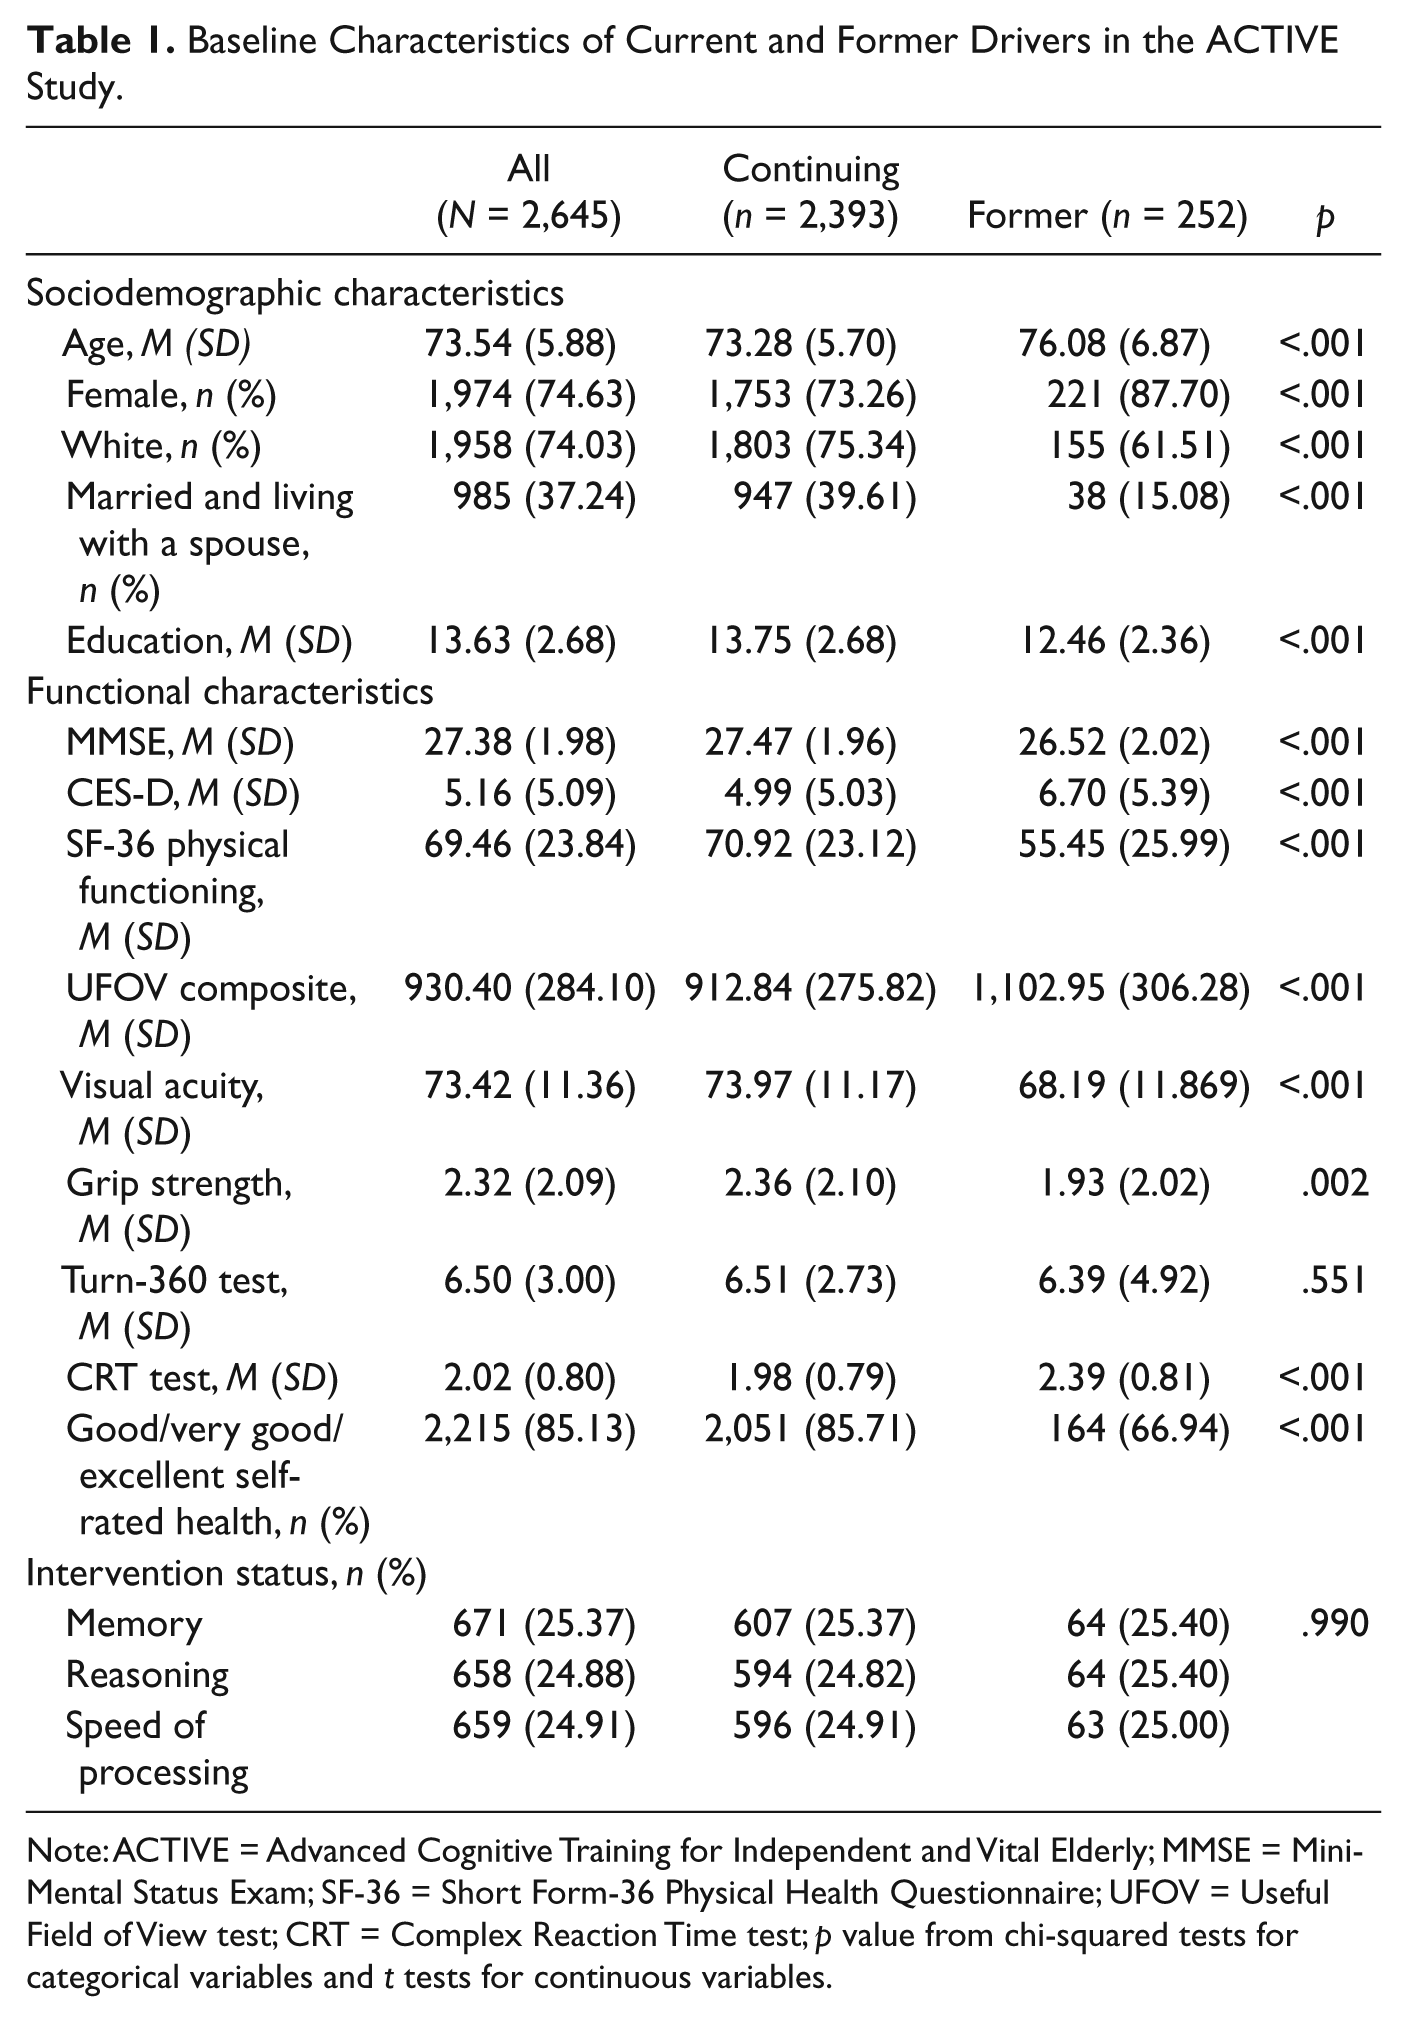
Note: ACTIVE = Advanced Cognitive Training for Independent and Vital Elderly; MMSE = Mini-Mental Status Exam; SF-36 = Short Form-36 Physical Health Questionnaire; UFOV = Useful Field of View test; CRT = Complex Reaction Time test; p value from chi-squared tests for categorical variables and t tests for continuous variables.
Predictors of Driving Cessation by Gender and Race
A total of 205 (11.5%) out of 1,789 participants stopped driving over the 5-year follow-up period. The majority of those who stopped driving were women (n = 165, 80.5%), and 56 (27.3%) were non-White. In fully adjusted models of the entire cohort, age was not significantly associated with increased likelihood of cessation (odds ratio [OR] = 1.04, 95% confidence interval [CI] = 0.99-1.08, p = .101). Consistent with our hypothesis, some of the factors predicting driving cessation differed by gender and race. Factors that affected cessation differently for men and women included marital status, years of education, MMSE, and SF-36 scores (Table 2). In stratified analyses, marital status was strongly associated with driving cessation for men but had no relationship with cessation for women. Men who lived with a spouse were about 6 times less likely to stop driving compared to men who were not married (OR = 0.18, 95% CI = 0.06-0.56, p = .003), and the interaction between gender and marital status was marginally significant (β = −1.02, 95% CI = −2.18-0.14, p = .084). Education was positively associated with cessation among men (OR = 1.40, 95% CI = 1.10-1.78, p = .006) but inversely associated with cessation among women (OR = 0.90, 95% CI = 0.82-0.98, p = .015). The interaction between gender and education confirmed this difference of effect (β = 0.28, 95% CI = 0.08-0.47, p = .005). MMSE scores were significantly associated with driving cessation for men only (OR = 0.76, 95% CI = 0.62-0.94, p < .01), but there was no significant interaction with gender (β = −0.12, p = .407). Finally, physical functioning, as measured by the SF-36, was significantly associated with cessation for women but not men, and the interaction term was marginally significant (β = 0.02, 95% CI = −0.01-0.03, p = .069).
Predictors of Driving Cessation by Gender and Race.
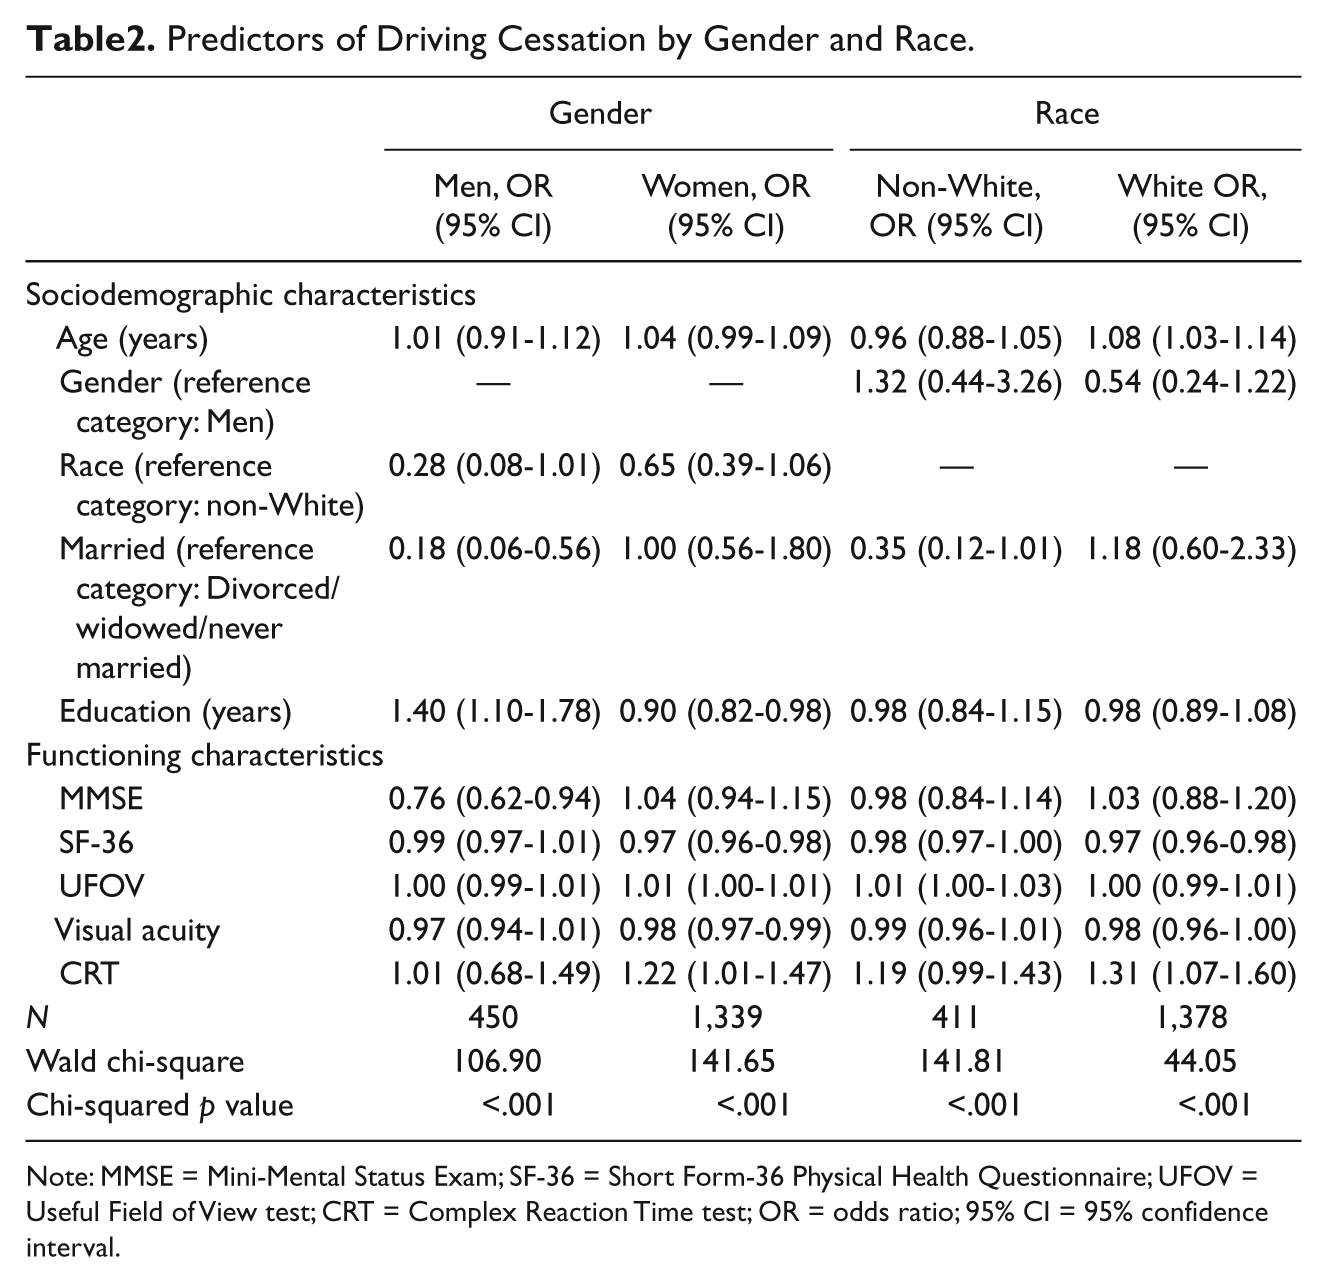
Note: MMSE = Mini-Mental Status Exam; SF-36 = Short Form-36 Physical Health Questionnaire; UFOV = Useful Field of View test; CRT = Complex Reaction Time test; OR = odds ratio; 95% CI = 95% confidence interval.
There were few racial differences in predictors of driving cessation. The only factor that affected cessation differently by race and ethnicity was age. Each additional year of age was associated with an 8% increase in the likelihood of cessation for Whites (OR = 1.08, 95% CI = 1.03-1.14) but was not significantly predictive of cessation for non-Whites (OR = 0.96, 95% CI = 0.88-1.05). This interaction was marginally significant (β = 0.08, 95% CI = −0.01-0.19, p = .092). No other factors significantly differed by race.
Gender and Racial Disparities by Age
Figures 1 and 2 show the predicted probability of driving cessation during the 5-year follow-up period by gender and race. These estimates are adjusted for all of the factors in Table 2. The predicted probability of driving cessation was consistently higher for women and non-Whites compared to their counterparts across all four age groups, but the absolute difference was largest in the group of participants aged 80 years and older. Visual inspection of the plot indicated that the gaps in the probability of cessation for men and women, and for Whites and non-Whites, were wider in the older age groups. However, the interaction between age and gender indicated that the influence of gender on cessation did not vary as a function of age (β = 0.01, 95% CI = −0.09-0.10, p = .924). As discussed above, the interaction between race and age was marginally significant, indicating that the racial disparities in driving cessation were wider at older ages.
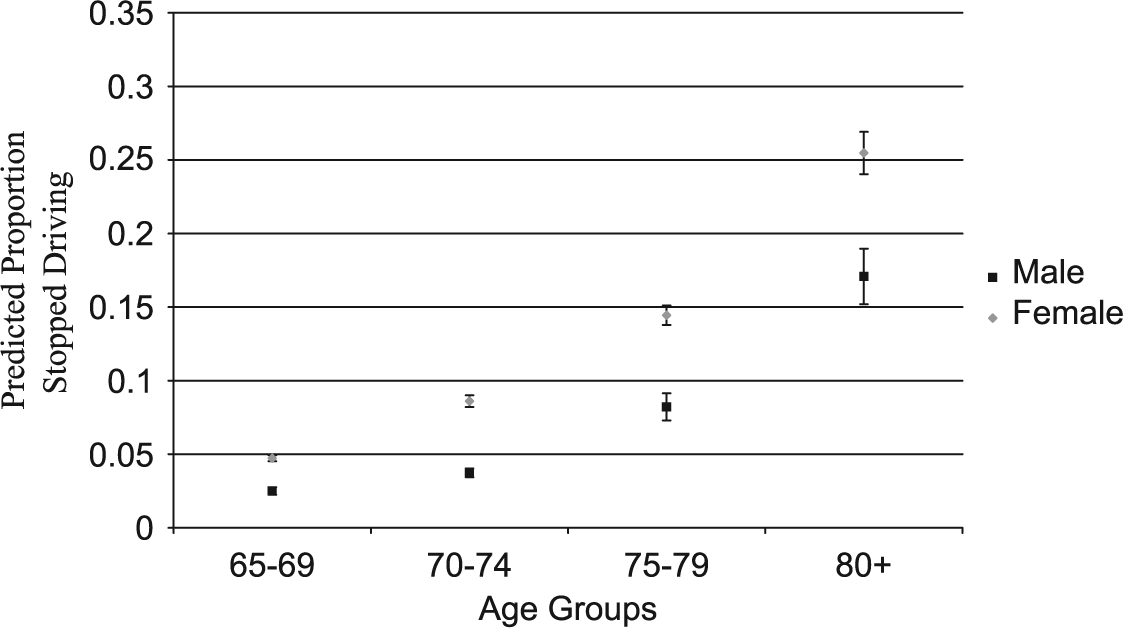
Predicted probability of driving cessation by age group and gender.
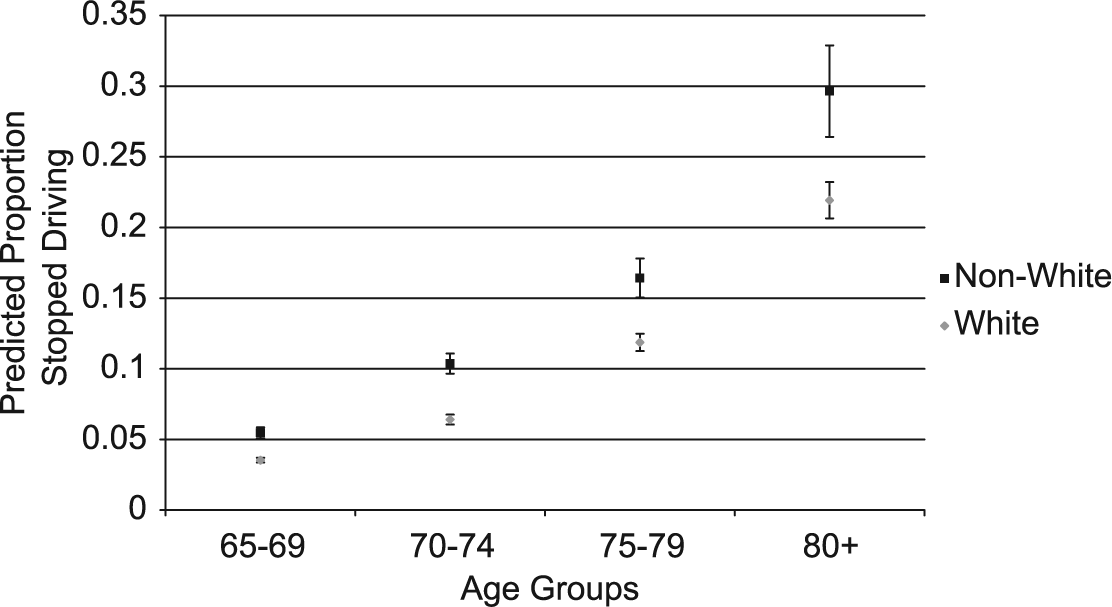
Predicted probability of driving cessation by age group and race.
Interactions of ACTIVE Training Arms With Gender and Race
None of the ACTIVE arms was significantly associated with driving cessation in the sample overall, and the influence of the interventions on cessation did not significantly vary by gender or race (Table 3). Thus, the hypothesis that the impact of ACTIVE interventions on the likelihood of driving cessation would differ by gender and race was not supported.
Interactions of ACTIVE Training Arm With Gender and Race in Predicting Driving Cessation.
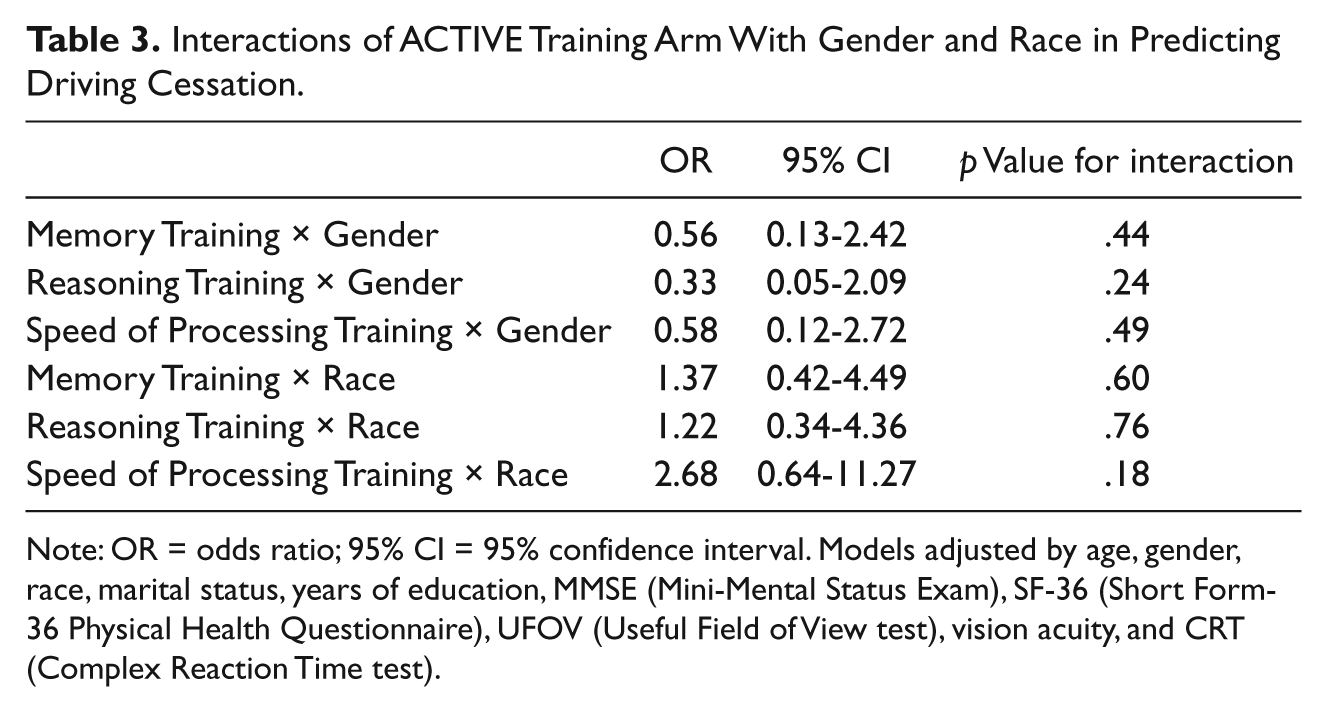
Note: OR = odds ratio; 95% CI = 95% confidence interval. Models adjusted by age, gender, race, marital status, years of education, MMSE (Mini-Mental Status Exam), SF-36 (Short Form-36 Physical Health Questionnaire), UFOV (Useful Field of View test), vision acuity, and CRT (Complex Reaction Time test).
Discussion
The primary finding from this study is that, at all ages, women and racial minorities are more likely to stop driving in later life than men and non-Hispanic Whites. Some factors, namely education and marital status, influenced the likelihood of cessation differently for men and women. More educated men were more likely to stop driving than men with less education, but the opposite was true for women. Married men were almost 6 times less likely to stop driving as nonmarried men, whereas marital status was not associated with driving cessation among women. Furthermore, our results were consistent with the hypothesis that racial disparities in likelihood of driving cessation widen with increasing age. Finally, there was no evidence that the influence of the ACTIVE interventions on cessation differed by gender or race. It is important to note that previous studies have shown that the ACTIVE speed of processing intervention significantly delayed driving cessation among older adults with preexisting impairments in cognitive speed (Edwards, Myers et al., 2009); our findings add to these results by demonstrating that the influence of the ACTIVE trial on driving cessation in the overall cohort did not vary by gender or race.
Consistent with previous work (Choi & Mezuk, 2012; Freeman, Gange, Munoz, & West, 2006; Mezuk & Rebok, 2008), we found that women and racial minorities are more likely to be former drivers than men and non-Hispanic Whites even after accounting for physical functioning. The fact that these differences have persisted across time and study settings suggest that these differences may be observed in the baby boomer generation. The findings that racial disparities in cessation persist, and may even widen, with increasing age mirrors other documented disparities in health and disability burden in later life (Kostyniuk et al., 1998). This disparity has important policy and programmatic implications as the U.S. older population will continue to grow more racially and ethnically diverse (Mann et al., 2005). Given the general lack of acceptable alternative transportation options for this demographic (Freedman et al., 2002; Johnson, 2000; Ostchega, Harris, Hirsch, Parsons, & Kington, 2000), driving will remain a critical component of mobility and functional independence (Federal Interagency Forum on Aging-Related Statistics, 2010). These findings also suggest that urban planning and transportation policies and programs should account for social determinants (e.g., education) and aim to address social disparities in mobility (Broome, Worrall, McKenna, & Boldy, 2010; Choi, Adams, & Kahana, 2012; Shope, 2003; Straight, 2003). Future research should also examine how contextual factors (e.g., neighborhood composition and socioeconomic characteristics, mix of commercial and residential zoning) influence individual-level determinants of driving cessation in particular and mobility in later life more generally.
Efforts to prolong driving mobility in the older population have taken many forms, including cognitive training, physical exercise interventions (Marottoli et al., 2007), and driver education programs (Edwards et al., 2010; Kua, Korner-Bitensky, Desrosiers, Man-Son-Hing, & Marshall, 2007). As mentioned earlier, cognitive speed of processing training may prolong safe diving mobility among older adults at risk for mobility loss based on their speed of processing performance (Edwards, Myers et al., 2009). Given that these training effects appear to operate independently of gender and race, this approach might offer one potential avenue for reducing disparities in driving cessation, assuming that equal access to the intervention can be provided.
Physical exercise programs are another promising means of enhancing older driver safety and thereby possibly prolonging mobility (e.g., see Marottoli et al., 2007). However, as most physical exercise interventions have recruited healthier, high-functioning individuals from nonminority samples (Katula et al., 2007; Stewart et al., 2001), health and racial disparities are likely to continue unless new public health interventions targeted at those individuals at greatest risk can be developed. High-intensity senior service programs like the Experience Corps® designed as health promotion programs could lead to sustained increases in physical activity in high-risk populations of older adults (Tan et al., 2009). Further research is needed on the association between participation in health promotion programs and maintaining independent driving mobility.
The results reported here should be interpreted in light of study limitations. The ACTIVE study is a randomized clinical trial involving relatively healthy high-functioning older adults. Thus, the study participants may not be representative of the general population of older adults (e.g., an MMSE score of 23 or greater was required for participation in the trial). Furthermore, we recognize cessation is a process that involves many behavioral adaptations before individuals stop driving permanently (Choi, Adams, & Mezuk, 2012), which we could not examine. We only examined one aspect of driving behavior (i.e., cessation). This study also has a number of strengths, including the prospective study design, longitudinal analysis, and the use of several performance-based measures of physical functioning.
Research suggests that disparities in access to transportation will have ripple effects to other sectors, including access to services (including health care), goods (including fresh fruits and vegetables), and general social participation and well-being (Dickerson et al., 2007; Webber, Porter, & Menec, 2010). This means that successful efforts to reduce disparities in transportation may likewise have compounded effects beyond simply improving mobility. Policy makers should be aware that programs to address mobility need to reflect the needs of the U.S. aging population as it becomes more diverse.
Footnotes
Authors’ Note
The content is solely the responsibility of the authors and does not necessarily represent the official views of the National Institute of Nursing Research, National Institute on Aging, or the National Institutes of Health. Representatives of the funding agency have been involved in the review of the manuscript but not directly involved in the collection, management, analysis, or interpretation of the data.
Declaration of Conflicting Interests
The authors declared the following potential conflicts of interest with respect to the research, authorship, and/or publication of this article: Dr. Rebok is a consultant for Compact Disc Incorporated (CDI), which is at this time in the process of developing an electronic version of the ACTIVE memory training program. He has received no financial support from them for ACTIVE, and the relationship is managed by the Johns Hopkins University according to its established conflict of interest policies.
Funding
The authors disclosed receipt of the following financial support for the research, authorship, and/or publication of this article: Dr. Mezuk is supported by the Building Interdisciplinary Research Careers in Women’s Health program at Virginia Commonwealth University (K12-HD055881). Additional support provided by the VCU Center for Clinical and Translational Research (UL13RR031990). Dr. Choi is supported by grants from the Office of the Executive Vice President for Research and the College of Social Work at the University of Kentucky. ACTIVE is supported by grants from the National Institute on Aging and the National Institute of Nursing Research to Hebrew Senior Life (U01NR04507), Indiana University School of Medicine (U01NR04508), Johns Hopkins University (U01AG14260), New England Research Institutes (U01AG14282), Pennsylvania State University (U01AG14263), University of Alabama at Birmingham (U01AG14289), and University of Florida (U01AG14276).