



Abstract
Keywords
Introduction
The global self-rated health (SRH) question “in general, how would you rate your health today?” and similar questions on functional ability, for example, mobility (“overall in the last 30 days, how much difficulty you had with moving around?”), cognition, sleep, self-care, and so forth, are used in national surveys to assess overall health and subjective well-being. The SRH question is known to predict health outcomes such as disease and death, independent of sociodemographic and known risk factors (DeSalvo, Bloser, Reynolds, He, & Muntner, 2006; Frankenberg & Jones, 2004). Such questions assessing functional disability ask respondents to rate their perceived level of health as discrete responses such as none, mild, moderate, severe, and extreme. An inherent problem with self-rating is that respondents from different populations may use response categories differently (Brady, 1985). Two persons or groups with identical functional ability may rate their functional limitation differently on the discrete scale based on their understanding of the categories and their expectations of their functions. This difference in reporting behavior referred to as response-category differential item functioning (DIF; King, Murray, Salomon, & Tandon, 2004) or reporting heterogeneity (RH; Bago d’Uva, Van Doorslaer, Lindeboom, & O’Donnell, 2008). DIF/RH has been studied largely in developed countries, across sexes (Grol-Prokopczyk, Freese, & Hauser, 2011), socioeconomic strata (Dowd & Zajacova, 2007), race and ethnicities (Menec, Shooshtari, & Lambert, 2007; Shetterly, Baxter, Mason, & Hamman, 1996), and countries (Jurges, 2007; Lindeboom & van Doorslaer, 2004; Murray, Tandon, Salomon, Mathers, & Sadana, 2002; Zimmer, Natividad, Lin, & Chayovan, 2000). Such RH, unless identified and adjusted for, can result in misleading and incorrect interpretations when comparing self-rating responses (Banks, Marmot, Oldfield, & Smith, 2007; King et al., 2004).
“Anchoring vignettes” is a promising strategy to overcome the problem of RH in survey questions (Murray et al., 2002; Tandon, Murray, Salomon, & King, 2003). Anchoring vignettes are brief texts describing a hypothetical character who exemplifies a certain fixed level of the trait of interest. The respondent is asked to rate the level of the trait for the vignette character as he or she would do for his or her own. Anchoring vignettes technique has been increasingly used in the last decade to improve interpersonal and cross-cultural comparability of survey questions in areas of political efficacy, work disability, job satisfaction, life satisfaction, health and health system responsiveness (Bago d’Uva, O’Donnell, & van Doorslaer, 2008; Bago d’Uva, Van Doorslaer, et al., 2008; Christensen, Herskind, & Vaupel, 2006; Hopkins & King, 2010; Kapteyn, Smith, & Van Soest, 2007; King et al., 2004; Kristensen & Johansson, 2008; Rice, Robone, & Smith, 2010). The application of anchoring vignettes requires two assumptions—vignette equivalence (VE) and response consistency (RC). VE assumes all respondents understand the level of trait represented in the vignette in the same way apart from random measurement error. RC assumes that each respondent uses the same response-category thresholds for rating vignettes and for rating the self-assessment question. Earlier studies have used informal checks such as looking for rank inconsistencies in ordering of vignette severity or non-parametric methods requiring fewer assumptions such as testing for systematic difference in vignette rankings to evaluate these assumptions (King & Wand, 2007; Kristensen & Johansson, 2008). Newer developments in hierarchical ordered probit (HOPIT) modeling techniques allow use of information from anchoring vignettes to adjust self-rating responses for RH (Bago d’Uva, Lindeboom, O’Donnell, & van Doorslaer, 2011; Datta Gupta, Kristensen, & Pozzoli, 2009; Rice et al., 2010; Van Soest, Delaney, Harmon, Kapteyn, & Smith, 2007).
The World Health Organization (WHO) Study on global AGEing and adult health (SAGE) implemented by the International Network for the Demographic Evaluation of Populations and Their Health (INDEPTH Network) aims to improve understanding of health and well-being of older adult and elderly populations in low- and middle-income countries. In this article, we use the Indian data from SAGE to evaluate the problem of RH in self-rated mobility and cognition.
Method
Ethics Statement
The SAGE was approved by the King Edward Memorial Hospital Research Center Ethics Committee, Pune, India and the Ethics Review Committee of the WHO, Geneva. All respondents participated in the study after an informed written consent.
Study Data
Our analysis was based on data from the first wave of the shortened version of the SAGE survey conducted in 2007 among older adults aged 50 years and above in a rural population under health and demographic surveillance system (HDSS) in Vadu, India (Kowal et al., 2012). A simple random sample of 6,000 individuals out of 14,749 adults aged 50 years and above was generated from the HDSS database for enrollment into SAGE. The short version of the SAGE questionnaire asked respondents to grade their ability to perform tasks in eight functional domains of health (mobility, self-care, pain, cognition, relationships, sleep, affect, and vision) in the preceding 30 days. Each domain included two self-rating questions, one for a lower and another for a higher level of functional ability. Respondents were randomly allocated to four groups and each group was administered a vignette set comprising two domains (affect/mobility, pain/relationships, care/cognition, and sleep/vision). Following the self-reported difficulties, a total of 10 vignettes in two functional domains were administered to a respondent at random. The vignettes for the two function domains in a set and the severity order of the vignettes were administered in random order. The names of the hypothetical persons in the vignettes were chosen so as to be of the same sex as the respondent and be locally and culturally appropriate. Before administering the vignettes, respondents were advised to think of the hypothetical person’s experience in the vignette as if they were their own. After each vignette, the exact same questions asked for self-assessment were then asked in the context of the hypothetical person in the vignette. For all assessments of self and vignette characters, the respondent was asked to rate on a 5-point ordinal scale of increasing difficulty (no difficulty, mild, moderate, severe, extreme difficulty). For this article, we used anchoring vignettes to evaluate RH in mobility (physical health) and cognition (mental health) for which objective measures required to test for assumption of RC were available (see the appendix).
To assess mobility and cognition more objectively, physical and cognitive tests were administered to a random subset of respondents. The time taken (seconds) to walk 4 m at normal and rapid speed was measured. Handgrip strength (kilograms) was measured separately for both hands using Smedley’s hand dynamometer. Word recall was tested both immediately and after a short delay during which other cognitive tests were performed. The average of the number of correct words recalled from a list of 10 words from three trials was taken as the score for the word recall test (maximum possible score 10). The length (number of digits) of the longest series of digits repeated by a respondent without error was taken as the score for the forward and backward digit span test (maximum possible score 9). The maximum number of animals correctly named by the respondent in 1 min was taken as the score for the verbal fluency test. All cognition test scores were rescaled from 0 to 1 with a higher score reflecting better performance. The SAGE survey questionnaires were translated into the local language and pre-tested. Local graduates were trained in administration of the questionnaire and conducting physical and cognitive tests using a detailed manual developed by the WHO. A random sample of 10% subjects was re-tested for quality assurance. All interviews, and physical and cognitive assessments were conducted in the respondent’s homes.
The SAGE data were linked to the HDSS database to include sociodemographic variables. Age was categorized as 50-59, 60-69, and 70+ years. Education was categorized into three groups: primary or less, secondary, and more than secondary. As part of HDSS, socioeconomic status (SES) of all households had been separately assessed 2 years earlier based on the Indian National Family Health Survey (NFHS) wealth index where the facilities (e.g., toilet, electricity, drinking water source, etc.) and physical assets (e.g., land and livestock ownership, household appliances like refrigerator, etc.) of each household were recorded, each asset was weighted with a factor score generated through principal components analysis, and the resulting asset scores were standardized and then summed to produce a wealth index score for each household. All households in the area were then assigned into quintile groups based on the wealth index score.
Statistical Methods
We based our vignette analysis on the statistical approach proposed by Tandon et al. (2003) and Bago d’Uva et al. (2011). If we assumed that the discrete response category (yi = k) that the respondent i chose to best describe his or her own health was generated from an underlying continuous latent variable


where

However, it is apparent that the generalized ordered probit model with varying thresholds (Equations 1a-1c) is underidentified, and estimation of β separately from γ k is possible only when additional information on RH (γ k ) is provided by anchoring vignettes as follows:


Similar to self-rating responses, we assumed that the discrete response (Vi) that the individual chose to best describe the health state depicted by the vignette was generated from an underlying continuous latent variable
To test the assumption of RC, additional information on objective measures of health was required. We tested for equality of the thresholds identified using the objective measures with those identified using the vignettes
Results
A total of 5,432 respondents responded to the survey (response rate 90%); 9% (568 individuals) of respondents who could not be traced due to migration and other reasons were not included in this study. A further 345 individuals (6%) were excluded as we were unable to match their identity information with the HDSS data set. Vignettes were not administered in 1 respondent. Of the 5,086 respondents, 1,307, 1,251, 1,287, and 1,241 were administered vignettes for mobility/affect, self-care/cognition, pain/relationships, and sleep/vision domains, respectively. The analysis for this article was restricted to 1,307 and 1,251 respondents who were administered mobility and cognition vignettes, respectively. Information on objective measures for mobility and cognition required for testing the assumption of RC was available in a random subset of 287 and 318 respondents, respectively.
There was no significant difference in the mean age between men (65.2 years) and women (64.8 years). A significantly higher proportion of women (98%) were less educated than men (85%). The proportion of men and women in the poorest and richest SES quintile was similar. There were more women who lacked spousal support compared with men (42% vs. 12%, respectively, p < .001). A significantly higher proportion of men (63%) reported good or very good health than women (52%). Men reported significantly less limitation in their functional ability across all health domains than women (Table 1). Men scored significantly better than women in handgrip strength test, but women did significantly better in the mobility test of 4-m normal walking speed (p = .040). Men performed significantly better than women in all cognitive tests (except for delayed verbal recall where difference in scores was not significant). Less than 2% respondents reported severe or extreme difficulty in memory or learning new tasks compared with 4% for moving around and 13% for performing vigorous activity. A high proportion of rank ties (43%-57%) were seen for cognition vignette ratings. Inconsistent ratings between vignette severity Levels 4 and 5 (9%-11%) were seen for cognition vignettes. There were no inconsistent ratings or high proportion of ties for mobility vignettes (results not shown).
Sociodemographic and Health Characteristics of Men and Women, Vadu, India (N = 2,558).
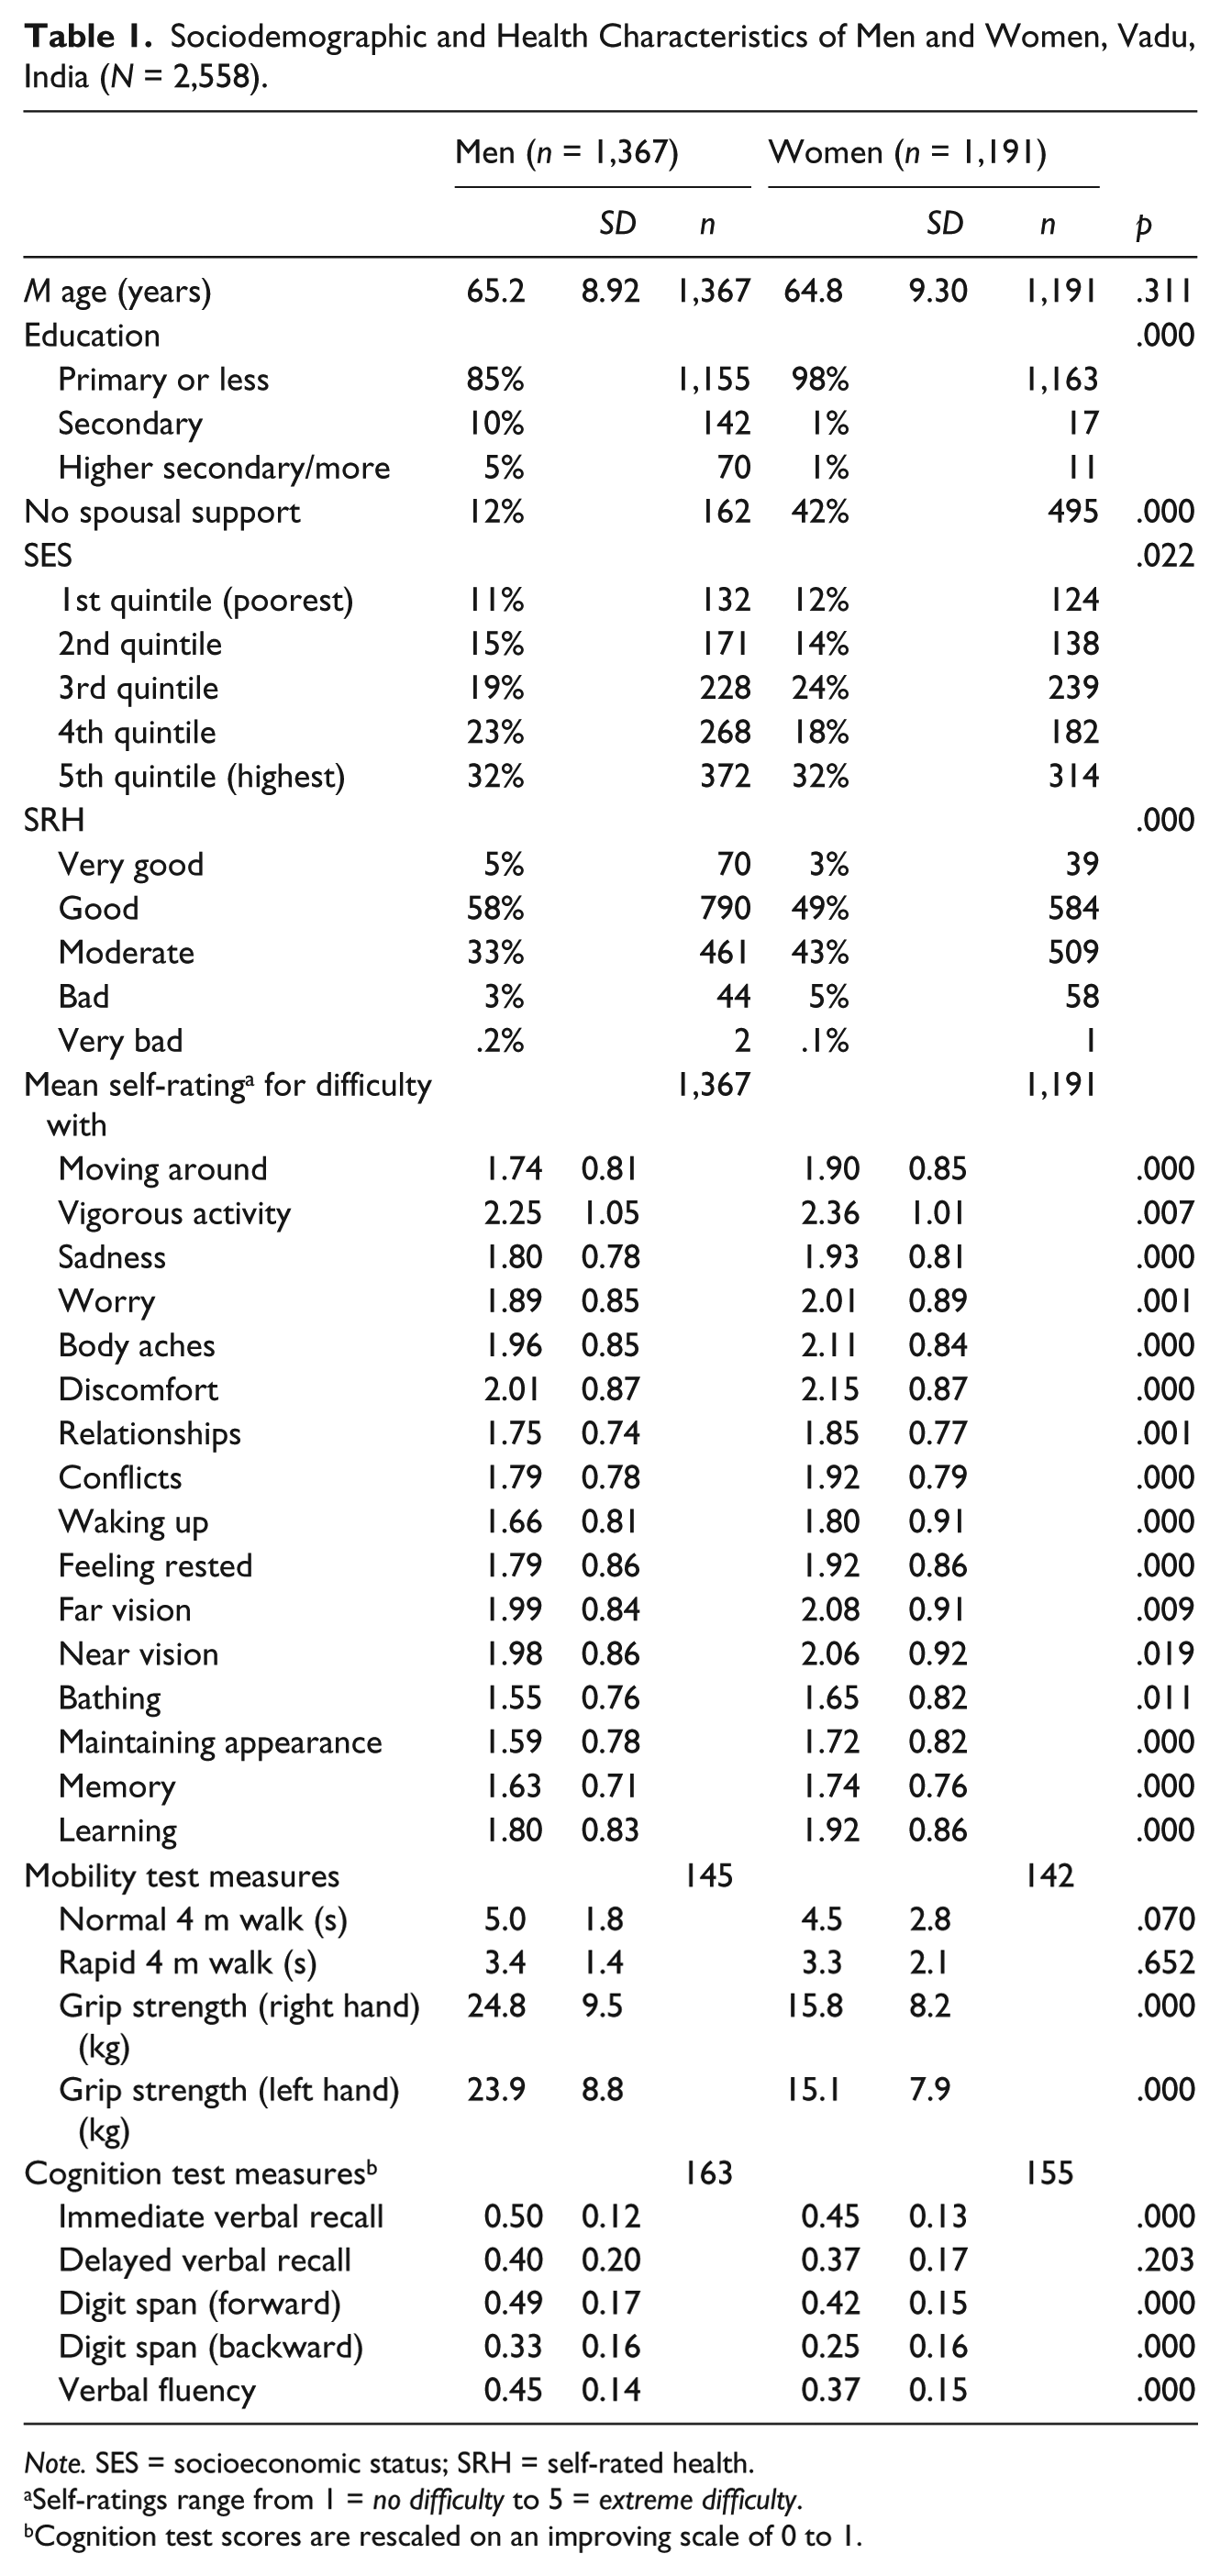
Note. SES = socioeconomic status; SRH = self-rated health.
Self-ratings range from 1 = no difficulty to 5 = extreme difficulty.
Cognition test scores are rescaled on an improving scale of 0 to 1.
Testing Assumptions
Mean vignette ratings increased as vignette severity level increased except for the cognition vignette severity Level 5 (Table 2). The global tests showed that the assumption of VE was met except for the difficulty in learning (χ2 = 56.59, p = .016) that seemed to be largely driven by SES (Table 3).
Mean Ratings a of Vignettes for Mobility (n = 1,307) and Cognition (n = 1,251), Vadu, India.
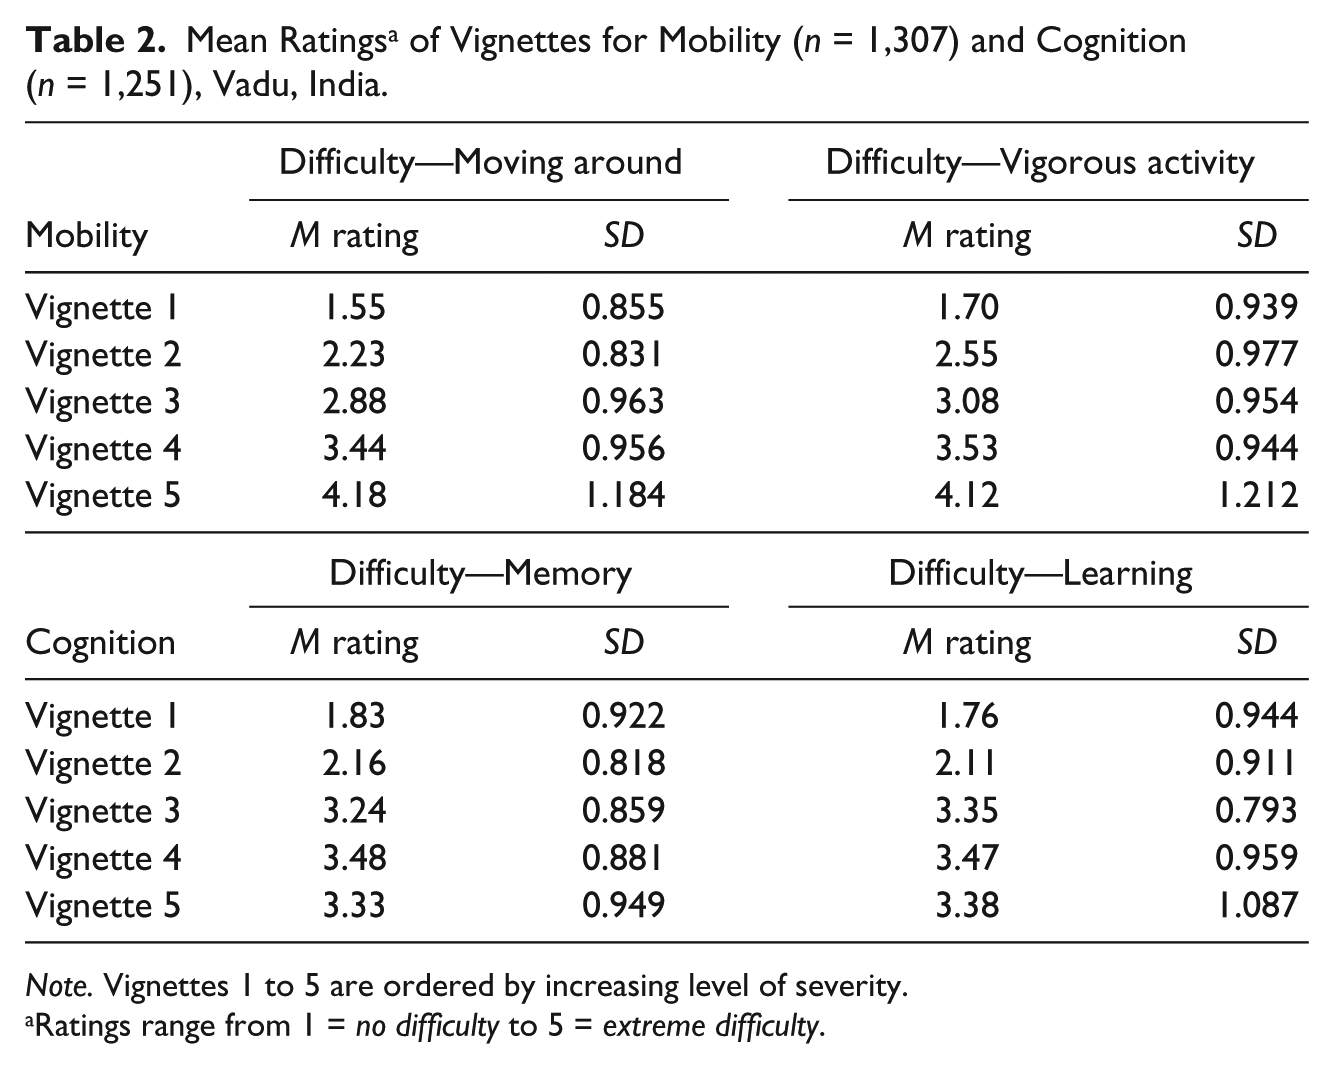
Note. Vignettes 1 to 5 are ordered by increasing level of severity.
Ratings range from 1 = no difficulty to 5 = extreme difficulty.
Wald Tests for Vignette Equivalence and Likelihood Ratio Tests for Response Consistency for Mobility and Cognition Domain, Vadu, India.

Note. SES = socioeconomic status.
The global tests showed that the assumption of RC was not met for both mobility and cognition vignettes (Table 3) largely driven by age, sex, SES, and education. Normal timed walk was a significant predictor for both difficulty in moving around and vigorous activity while all cognitive tests were significant predictors of perceived latent cognition (results not shown). The two sets of thresholds predicted from entirely different set of variables (vignettes and objective measures) seemed to be concordant (Figure 1). However, the thresholds predicted from the vignettes and objective measures were less similar for the “moving around” subdomain of mobility.
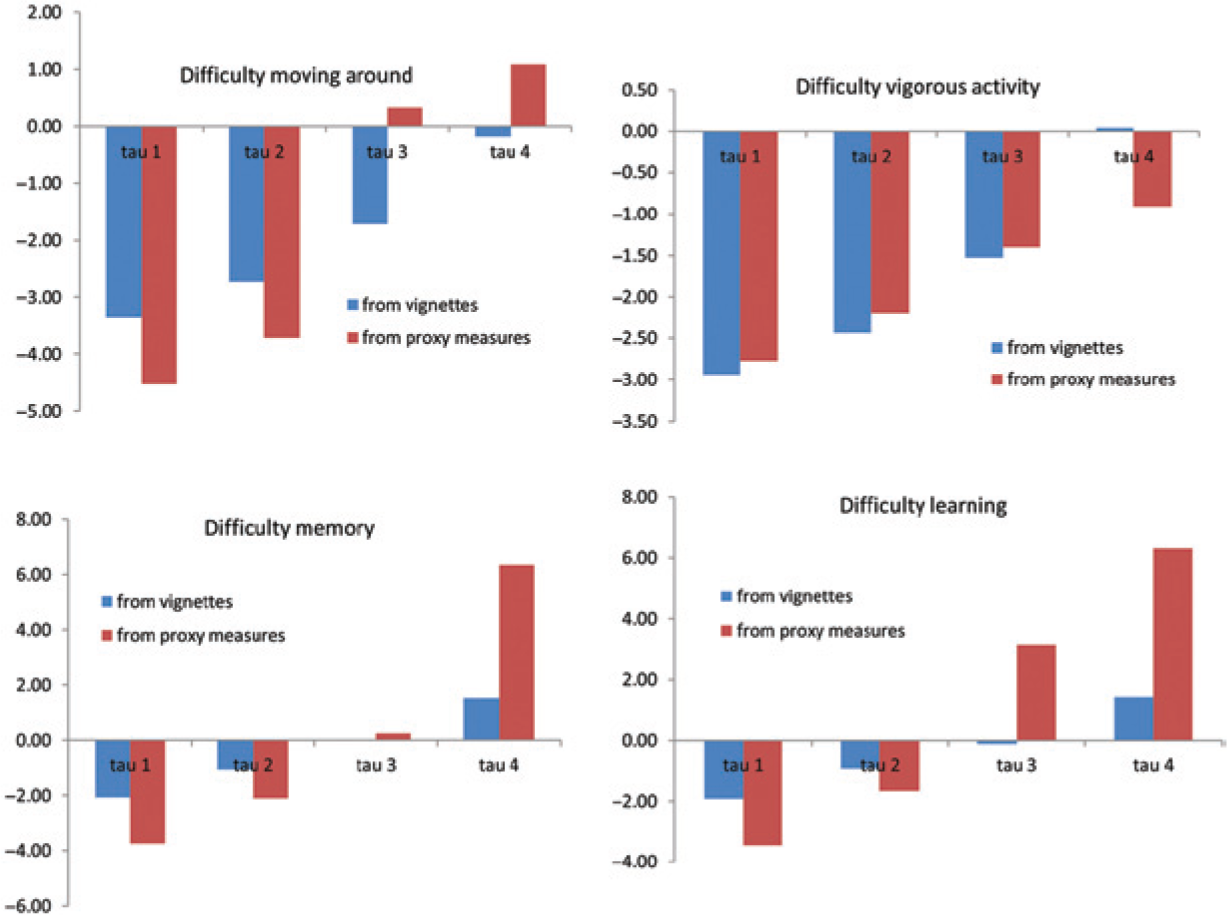
Threshold locations for mobility and cognition predicted from vignettes and from objective measures.
Evaluating Self-Rating Responses for RH
Table 4 presents the results of the joint HOPIT model with self-rating and vignette rating components that shared the same thresholds that varied with the effect of covariates. Positive coefficient implied increased difficulty in mobility or cognition. Men (β = −.16) and higher SES (β = −.08) were significantly less likely to report difficulty in moving around. This pattern was also seen for difficulty in vigorous activity and for cognition but was not significant. Similarly, older respondents were significantly more likely to report difficulty in moving around (β = .09) with the same but non-significant pattern seen for difficulty in vigorous activity and for cognition. Higher educated respondents were also significantly less likely to report difficulty with memory (β = −.35; similar pattern but not significant for learning and mobility). There was no significant effect of SES or education on thresholds used for mobility ratings. In the cognition domain, higher SES significantly lowered the “none–mild” threshold (τ1 = −.25), that is, higher SES respondents were more demanding in ratings of their difficulty in cognition (Table 4). Similar results were also seen for the effects of education on cognition thresholds.
HOPIT Model Parameters for Predictors for Perceived Latent Mobility (n = 1,103) and Cognition (n = 1,065), Vadu, India.
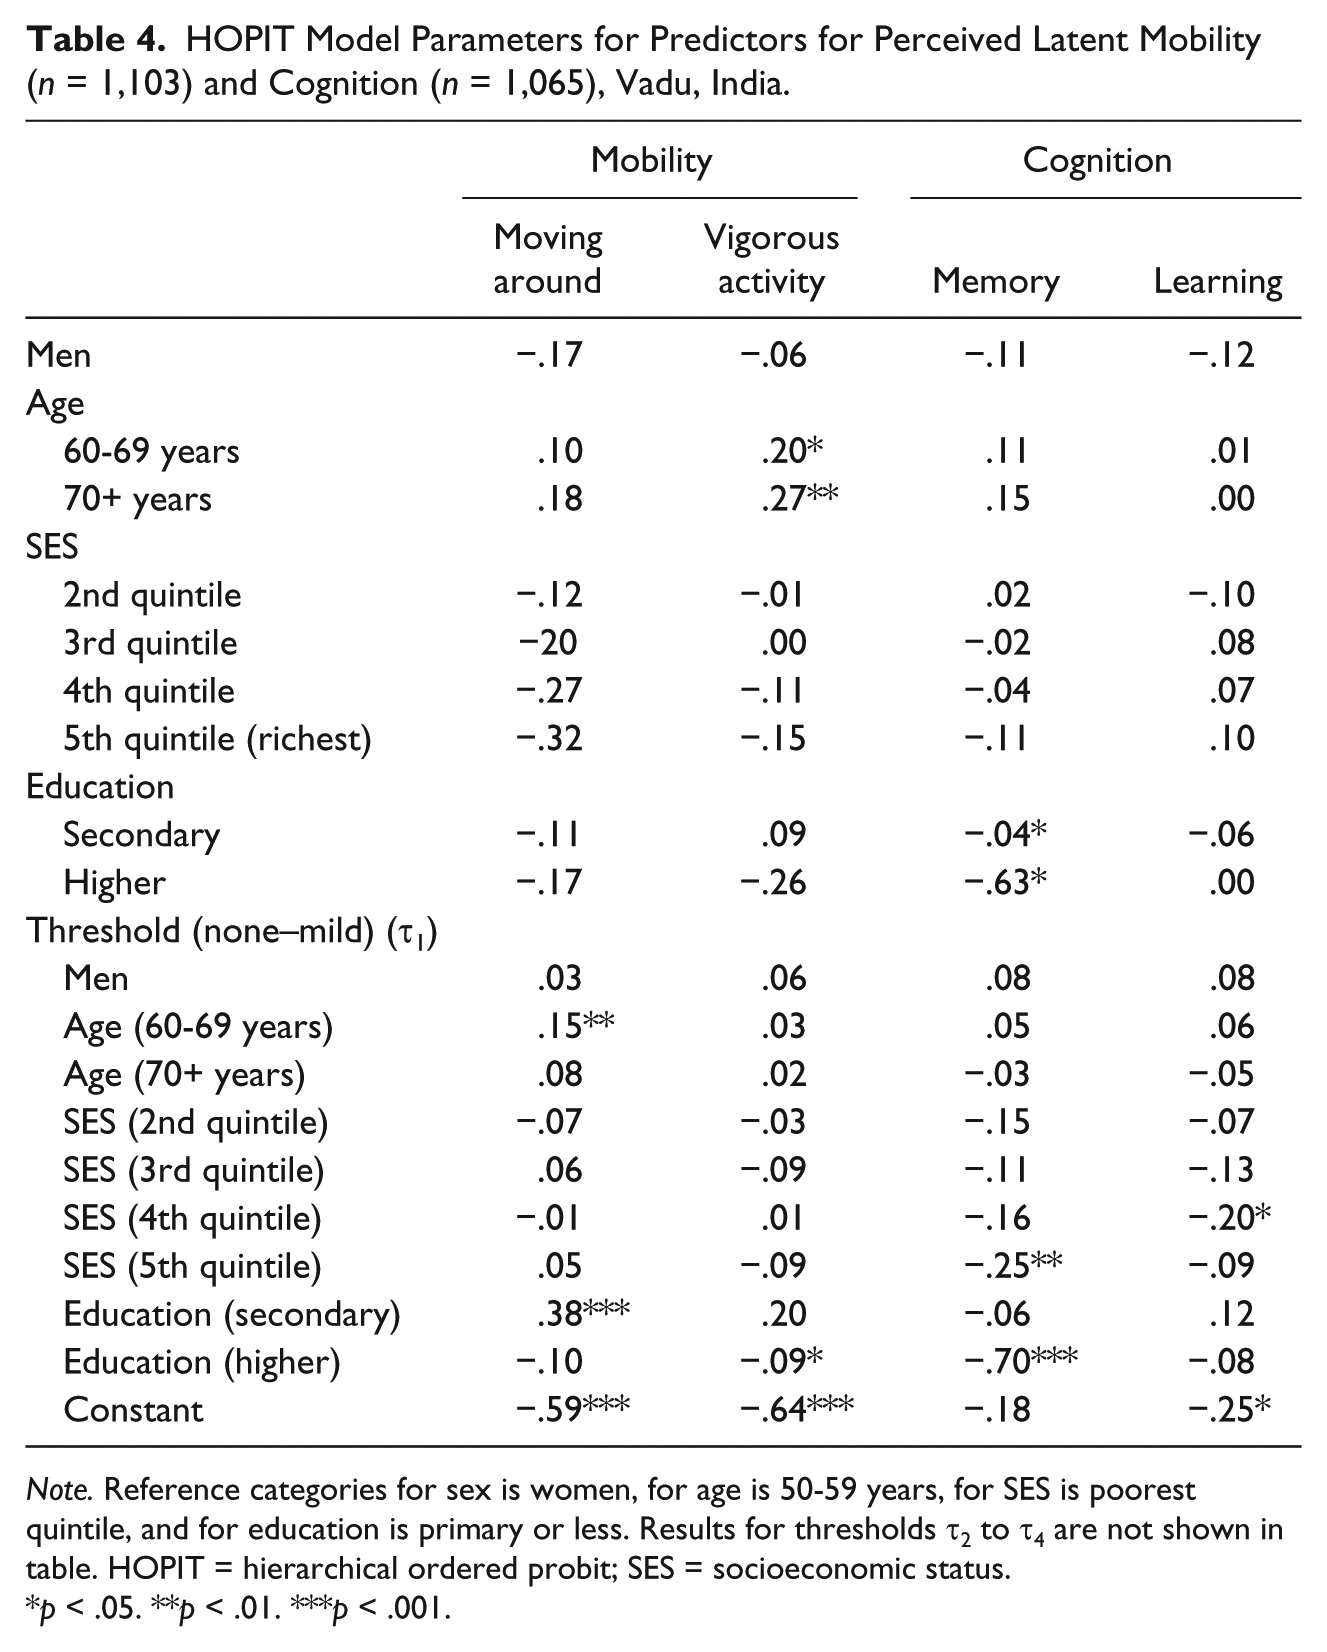
Note. Reference categories for sex is women, for age is 50-59 years, for SES is poorest quintile, and for education is primary or less. Results for thresholds τ2 to τ4 are not shown in table. HOPIT = hierarchical ordered probit; SES = socioeconomic status.
p < .05. **p < .01. ***p < .001.
Discussion
RH in self-rating responses is often seen between populations of different countries and cultures. Our focus on the Indian context allows us to study the sociodemographic factors (other than country) that drive RH in self-rating health responses among older adults. The SAGE has vignettes data in eight function domains of health—in our article, we compared self-rating and vignette ratings in mobility (physical health) and cognition (mental health), two distinct and dissimilar aspects of elderly health known to be affected by RH (Gill, Desai, Gahbauer, Holford, & Williams, 2001; Reed, Jagust, & Seab, 1989). Our results showed strong evidence of systematic variation in reporting behavior when respondents were asked to self-rate their mobility and cognitive ability. Higher SES and higher educated respondents significantly lowered the “none–mild” response-category threshold for cognition ratings, that is, they were more likely to be “demanding” in self-rating their cognitive ability compared with lower SES and less educated respondents. After correction for RH, women, lower SES, and older respondents were significantly more likely to report greater difficulty in mobility. Similar pattern was seen for cognition self-rating but was not significant. Similar results are seen in other studies (Grol-Prokopczyk et al., 2011).
The assumptions of VE and RC cannot be taken for granted as some studies have found adherence while others have found violation of these basic assumptions (Bago d’Uva et al., 2011; Datta Gupta et al., 2009; Grol-Prokopczyk et al., 2011; Hirve et al., 2012; Rice et al., 2010; Van Soest et al., 2007). Earlier studies have used informal checks and less rigorous tests for testing these assumptions. In our study, the assumption of VE was met except for the learning vignettes. A strict parametric test (equality of location of thresholds) showed that the RC assumption was not met largely driven by age, sex, SES, and education of the respondents. However, a visual assessment of predicted thresholds used for self-rating and for vignette rating was similar, for both mobility and cognition. A lack of adherence to the assumptions using strict parametric tests does not discredit the overall use of vignettes approach in identifying RH. Using fewer vignettes, using fewer response categories, dealing with missing data, or using statistical models that relax assumptions to some degree are alternate strategies that may improve the adherence to the assumptions. We used vignettes adapted from the World Health Survey of 2003—further research is needed to see whether revising the contents and wordings of the vignettes improves their performance from the perspective of VE and RC.
This article focuses on using anchoring vignettes to improve interpersonal comparability of self-rating health responses. While this technique does not explain the reasons for differential reporting behavior, it allows us to adjust responses for these differences and study individual or group characteristics that may predict them. Vignettes could potentially be used to adjust for RH between sexes or across age, education or SES groups. It was beyond the scope of this study to assess some of the methodology issues in the use of anchoring vignettes—whether the sequence of the self-rating and vignette rating influences RC (Hopkins & King, 2010) or whether matching the age and sex of the vignette character and the respondent influences RH (Grol-Prokopczyk, 2010) or whether improving the wordings of the cognition vignettes would enable respondents to better differentiate between “memory,” a lower cognitive function based primarily on short-term memory, as compared with “learning,” a higher cognitive function requiring both prospective memory and executive function. It would be interesting to test whether vignette validity is higher in certain sociodemographic contexts or whether the assumptions of VE and RC are more likely to be upheld in panel studies.
Finally, as a note of caution, anchoring vignettes may be used to correct differential reporting behavior only, not for all forms of DIF (King & Wand, 2007). If respondents understand and interpret the rating question in fundamentally different ways, then anchoring vignettes may only partly fix the inferential problems. The question still remains on how to address these other aspects of interpersonal incomparability aside from RH.
Conclusion
The anchoring vignettes approach shows that there is strong evidence of RH in self-rating responses to questions on difficulty in mobility and cognition largely driven by education, SES, age, and sex of the respondent.
Footnotes
Appendix
Text of Mobility and Cognition Vignettes
| Domain question | Vignette |
|---|---|
| Mobility—Overall, in the last 30 days, how much difficulty did [you/name_] have . . . with moving around? . . . with vigorous activity (such as cycling, working in fields, etc.)? |
Severity Level 1: [name_a] has no problems with walking, running, or using her hands, arms, and legs. She jogs 4 km twice a week. |
| Severity Level 2: [name_b] is able to walk distances of up to 200 m without any problems but feels tired after walking 1 km or climbing up more than one flight of stairs. He has no problems with day-to-day physical activities, such as carrying food from the market. | |
| Severity Level 3: [name_c] does not exercise. She cannot climb stairs or do other physical activities because she is obese. She is able to carry the groceries and do some light household work. | |
| Severity Level 4: [name_d] has a lot of swelling in his legs due to his health condition. He has to make an effort to walk around his home as his legs feel heavy. | |
| Severity Level 5: [name_e] is paralyzed from the neck down. He is unable to move his arms and legs or to shift body position. He is confined to bed. | |
| Cognition—Overall, in the last 30 days, how much difficulty did [you / name_] have . . . with concentrating or remembering things? . . . learning a new task (e.g., learning how to get to a new place, learning a new game, learning a new recipe)? |
Severity Level 1: [name_a] is very quick to learn new skills at his work. He can pay attention to the task at hand for long uninterrupted periods of time. He can remember names of people, addresses, phone numbers, and such details that go back several years. |
| Severity Level 2: [name_b] can concentrate while watching TV, reading a magazine, or playing a game of cards or chess. He can learn new variations in these games with small effort. Once a week, he forgets where his keys or glasses are but finds them within 5 min. | |
| Severity Level 3: [name_c] can find her way around the neighborhood and know where her own belongings are kept but struggles to remember how to get to a place she has only visited once or twice. She is keen to learn new recipes but finds that she often makes mistakes and has to reread several times before she is able to do them properly. | |
| Severity Level 4: [name_d] cannot concentrate for more than 15 min and has difficulty paying attention to what is being said to him. Whenever he starts a task, he never manages to finish it and often forgets what he was doing. He is able to learn the names of people he meets but cannot be trusted to follow directions to a store by himself. | |
| Severity Level 5: [name_e] does not recognize even close relatives and gets lost when he leaves the house unaccompanied. Even when prompted, he shows no recollection of events or recognition of relatives. It is impossible for him to acquire any new knowledge as even simple instructions leave him confused. |

Acknowledgements
We thank Marton Ispany, Teresa Bago d’Uva, and Hanna Grol-Prokopczyk for sharing the STATA source codes for the hierarchical ordered probit (HOPIT) model and guidance for the analysis. We acknowledge the support of Kathy Kahn and Paul Kowal for coordinating this multi-country study. Thanks are due to the Vadu Health and Demographic Surveillance System (HDSS) team for their quality work and the older adult population of the Vadu Demographic Surveillance Area for their willing consent to contribute their knowledge to this study.
Declaration of Conflicting Interests
The authors declared no potential conflicts of interest with respect to the research, authorship, and/or publication of this article.
Funding
The authors disclosed receipt of the following financial support for the research, authorship, and/or publication of this article: This article uses data from World Health Organization (WHO) Study on Global AGEing and Adult Health (SAGE). The SAGE is supported by the U.S. National Institute on Aging through Interagency Agreements (OGHA 04034785, YA1323-08-CN-0020, Y1-AG-1005-01) and through a research grant (R01-AG034479). Health and Demographic Surveillance System, Vadu, is a member of the International Network for the Demographic Evaluation of Populations and Their Health (INDEPTH Network). This work was supported by the Umeå Centre for Global Health Research, Umeå University, with support from FAS, the Swedish Council for Working Life and Social Research (Grant 2006-1512) through its PhD Fellowship to the first author.