




Abstract
Epidemiological studies of psychiatric disorders are generally based on structured or semi-structured interviews eliciting self-ratings of symptoms and impairment. These self-ratings often provide reliable measures of experienced psychological distress and associated impairment. However, they are probably also influenced by variations in health norms and expectations as to how to rate different levels of distress and impairment (Guindon & Boyle, 2012), causing “reporting heterogeneity.” Cultural variations in health norms and expectations are especially likely to complicate comparisons of distress and impairment across countries or ethnic groups (Coyne & Marcus, 2006; Ladin, 2008; Lee-Winn, Mendelson, & Mojtabai, 2014). Self-ratings of health are often based on social comparisons with peers or cultural expectations. For example, in a culture in which it is accepted that older adults would have limited mobility, an older individual with a significant walking limitation may rate herself as “moderately” impaired, whereas another individual with the same objectively assessed level of mobility impairment, but living in a community in which older adults are expected to have no or little mobility impairment may rate herself as “severely” impaired (Jurges, 2007). Variations in the use of labels and descriptors may also affect responses to self-reports of health and well-being. Thus, different groups of people may have systematically different views of what they consider as “excellent,” “good,” or “poor” health (Hsee & Tang, 2007). Jurges provides the striking example of the use of the label “excellent” when applied to health in different languages:
. . . “excellent” is a term that is used in everyday parlance in the Anglo-Saxon world, but Germans would often consider “ausgezeichnet” as an ironic exaggeration, in particular if used in the context of health. (Jurges, 2007, p. 164)
While there is relatively little research on the causes of variations in health norms and expectations and on how these variations affect self-reports of health conditions, there have been recent attempts to improve comparison of self-ratings through the use of anchoring vignettes (Bago d’Uva, O’Donnell, & van Doorslaer, 2008; Bago d’Uva, van Doorslaer, Lindeboom, & O’Donnell, 2008; Guindon & Boyle, 2012; Jorm & Ryan, 2014; Kapteyn, Smith, & Van Soest, 2007; King, Murray, Salomon, & Tandon, 2004; Kok, Avendano, Bago d’Uva, & Mackenbach, 2012). This approach is based on the assumption that a person’s self-ratings are influenced by both his or her subjective experiences and norms regarding how any level of distress or impairment should be rated (Jurges, 2007). These norms can be investigated through the use of vignettes depicting hypothetical cases. The effects of variations in these norms on self-ratings of health can then be removed by appropriate statistical adjustment. Removing the effect of this reporting heterogeneity presumably improves the validity of self-rating comparisons across individuals and groups.
This approach, originally introduced in studies of political attitudes (King et al., 2004), has been successfully applied in a number of studies comparing health conditions across countries or racial/cultural groups within countries (Bago d’Uva, O’Donnell, & van Doorslaer, 2008; Bago d’Uva, van Doorslaer, et al., 2008; Dowd & Todd, 2011; Guindon & Boyle, 2012; Hirve et al., 2014; Kapteyn et al., 2007; King et al., 2004; Kok et al., 2012; Salomon, Tandon, & Murray, 2004). The use of anchoring vignettes is based on the assumptions that the vignettes and self-ratings are on the same scale (“response consistency”) and that the vignettes are similarly understood and interpreted by different individuals (“vignette equivalence”; Datta Gupta, Kristensen, & Pozzoli, 2010). Response consistency is guaranteed by using the same response scale for self- and vignette-ratings. Assessing vignette equivalence is more difficult and often relies on consistency in ranking vignettes representing differing levels of distress or impairment.
In the present study, anchoring vignettes were used to recalibrate self-ratings of depressed mood among middle-aged and older adults in nine European countries and the United States. In past epidemiologic research, self-reported mental health conditions have been found to be generally more prevalent in the United States than in other high income countries (Bromet et al., 2011; Castro-Costa et al., 2007; Demyttenaere et al., 2004; Zivin et al., 2010). For example, the prevalence of 12-month major depressive episodes in high income countries included in the World Mental Health Survey varied from as low as 3.0% in Germany to 8.3% in the United States (Bromet et al., 2011). Wide variations among European countries have also been noted (Castro-Costa et al., 2007; Kok et al., 2012). The reasons for these differences, however, are not well understood. Exploring the impact of reporting heterogeneity on self-reports of depression and other mental health problems may help explain these variations. The possibility that differences in mental health norms and expectations may, at least partly, explain the differences in self-reported mental health conditions has rarely been examined in past research. One study examining heterogeneity in self-reported depressive symptoms among European countries concluded that the differences were generally not explained by systematic cross-national reporting heterogeneity as reflected in vignette ratings (Kok et al., 2012). However, the potential contribution of reporting heterogeneity to differences between European countries and the United States have not been previously explored. It is conceivable that variations in expectations and norms between Americans and Europeans can explain at least part of the variations observed in self-reports of depressed mood (Castro-Costa et al., 2007; Zivin et al., 2010). A past study that found a higher self-reported level of disability among American adults compared with their Dutch peers also found that part of this difference could be explained by reporting heterogeneity across the two countries (Kapteyn et al., 2007).
Much of the past research on reporting heterogeneity has examined variations across various social or demographic groups, especially groups with different levels of education (Bago d’Uva, van Doorslaer, et al., 2008; Guindon & Boyle, 2012; Kok et al., 2012). The present study focuses on between-country differences. More specifically, this study tested the hypothesis that reporting heterogeneity, as reflected in vignette ratings, could explain differences in self-ratings of depressed mood among middle-aged and older Europeans and Americans, and that after adjusting for these differences, these two groups would not differ with regard to self-rated depressed mood.
If some of the between-country differences are attributable to reporting heterogeneity and can be adjusted for by using anchoring vignettes, the validity of cross-country comparative studies of mental health conditions could potentially be improved. Improved measurement of these phenotypes could potentially contribute to research into the causes of mental disorders and aid future prevention efforts (Leboyer et al., 1998; Pizzagalli, Jahn, & O’Shea, 2005).
Method
Samples
The samples for the study were drawn from three large and representative surveys of middle-aged and older adults in the United States, England, and eight other European countries conducted about the same time and using the same instrument with minor modifications (i.e., changes in the names and sexes of the characters presented in the vignettes). The U.S. data were drawn from a 2007 mail survey conducted with participants of 2006 Health and Retirement Study (HRS). The HRS is a nationally representative survey of the U.S. adults aged 50 years and older and their spouses. A total of 5,678 questionnaires were mailed, of which 4,639 (81.7%) were returned. For this study, data from the mail questionnaires were combined with HRS 2006 demographic information. More information on the design of HRS and the mail survey is available in other publications (Dowd & Todd, 2011; Juster & Suzman, 1995) and online at http://hrsonline.isr.umich.edu/.
The English data were drawn from the English Longitudinal Study of Aging (ELSA), which is a representative survey of adults aged 50 years old and older, and their partners of any age, living in private households in England. Data for this study were from the 2006 to 2007 ELSA, which administered the self-completion questionnaires containing self-ratings and the vignettes to a random subsample of 2,423 participants (86% response rate). More information on the design of ELSA and the self-completion questionnaire is available in other publications (Bago d’Uva, Lindeboom, O’Donnell, & van Doorslaer, 2011; Banks, Breeze, Lessof, & Nazroo, 2008) and online at http://www.esds.ac.uk/longitudinal/access/elsa/l5050.asp.
Data from the other European countries were drawn from the Survey of Health, Ageing, and Retirement in Europe (SHARE), which randomly sampled adults aged 50 years old and above (including spouses of selected participants) in 12 European countries. The first wave of SHARE data collected in 2004-2005 included supplementary samples, including a sample of participants who completed the self- and vignette-ratings in 8 of the 12 countries (Belgium, France, Germany, Greece, Italy, the Netherlands, Spain, and Sweden). The overall response rate in the vignette samples was 57.7% (42%-77% across different countries). Questionnaire data were available for a total of 4,514 participants from these countries. More information on the design of SHARE and the questionnaire is available in other publications (Bago d’Uva, O’Donnell, & van Doorslaer, 2008; Borsch-Supan et al., 2013) and online at http://www.share-project.org/.
The total sample for the study was further restricted to participants 50 years old and/or above who completed the self-rating of mood, and one or more of the mood-related vignettes (see below). A total of 11,125 participants met these criteria (4,468 from HRS; 4,350 from SHARE; and 2,307 from ELSA).
Assessments
Depressed mood was assessed by one question, asking the participants, “Overall in the last 30 days, how much of a problem did you have with feeling sad, low, or depressed?” Possible responses ranged from “none” (=0) to “extreme” (=4). This 1-item rating correlated strongly with more detailed ratings of depressed mood used in the three surveys (data not shown), with correlations coefficients ranging from 0.48 with the 8-item Center for Epidemiologic Studies Depression (CES-D; Mojtabai & Olfson, 2004) scale in HRS 2006 (approximately a year before the 1-item rating), to 0.65 for the 8-item CES-D used in ELSA.
Anchoring vignettes corresponding to this question included three scenarios worded very similarly across the three surveys. HRS and SHARE used randomly assigned alternative versions of the vignettes, which varied with regard to the sex and the name of the person depicted to reduce the potential effect of these factors. Appendix 1 presents the wording of the two versions of depression-related vignettes used in HRS. To assess the sensitivity of findings to the use of alternative versions of the instruments in only two of the surveys, analyses were repeated after limiting the sample of participants to those who were administered the same version across the three surveys.
The analyses were further adjusted for variations in the composition of the samples with regard to age, sex, and education level (higher education vs. no higher education). Higher education was defined by >12 years of education in HRS and equivalent years based on the International Standard Classification of Education (ISCED; United Nations Edicational, Scientific, and Cultural Organization, 1997) for the SHARE sample. Higher education in ELSA was defined by degree or equivalent, A-level, or higher education below degree (Banks et al., 2008).
Analysis
Analyses were conducted in three stages. First, a series of preliminary analyses were conducted to select anchoring vignettes that were ranked consistently by the majority of participants in the United States and Europe (Salomon et al., 2004). This is one aspect of the assumed vignette equivalence. To select vignettes that meet this assumption, the relative rating of vignettes were assessed across countries. For this, the ratings for vignettes were ranked in the total sample, and the proportion of participants in each country whose ratings were consistent with this ranking was computed. If participants in different countries interpret vignettes differently, the relative ranking of the vignettes would be expected to vary across these countries. Vignettes with consistent ranking across countries were selected for the next stage of the analysis.
Next, self-ratings of depressed mood were adjusted by the non-parametric method proposed by King and colleagues (King et al., 2004). In this method, self-ratings are recoded relative to the set of vignettes rated by the same individual. Self-ratings of depressed mood were compared among participants from different countries using ordinal probit regression models before and after this adjustment.
Standard ordinal probit models assume that the effect of independent variables included in the model is not different across different thresholds (“parallel lines” assumption; Williams, 2006). Thus, the standard model constrains the probit regression coefficients to be equal across thresholds. This assumption can be tested for each independent variable in the model using likelihood ratio tests for comparison of models with and without such constraint. The gologit2 routine with a probit link implemented in STATA 13.1 software was used to compute these unconstrained ordinal probit regression coefficients and to test the parallel line assumption. For the main analyses reported in the manuscript, the standard ordinal probit regression models implemented in STATA oprobit routine was used because this model provides a useful overall summary measure of self- and vignette-ratings. The results of unconstrained models are reported in Appendices.
The magnitude of the differences in self-reported depressed mood between European and American participants was computed by dividing the difference in average self-ratings between each European country and the United States by the standard deviation of the self-ratings. These computations were done before and after adjustment for anchoring vignettes to assess the impact of adjustments on between-country differences.
Finally, hierarchical ordered probit (HOPIT) models were used to compare self-ratings across the countries after adjusting for differences in ratings of vignettes (Angelini, Cavapozzi, & Paccagnella, 2012; Kristensen & Johansson, 2008; Paccagnella, 2011; Rabe-Hesketh & Skrondal, 2002). HOPIT models allow for adjustment of self-ratings by vignette ratings through simultaneously estimating the effects of sex, age, education, and country of residence on thresholds for rating of vignettes and estimating the individuals’ self-ratings of depressed mood based on these vignette thresholds. For these analyses, the HOPIT implementation in the gllamm module of STATA 13.1 was used (Rabe-Hesketh & Skrondal, 2002). Analyses were repeated with all the European countries combined.
Results
Characteristics of Participants
Participants in the three surveys were overall similar with regard to sex and age with minor differences. Fifty-seven percent of the participants were female (54% in SHARE, 56% in ELSA, and 60% in HRS), and the average age of the participants was 65 years (64, 65, and 66 years, respectively) with a standard deviation of 10 years in the three surveys. Approximately 30% had higher education (30% in SHARE and HRS and 33% in ELSA).
Selection of Anchoring Vignettes
Comparison of rankings of vignettes across countries produced mixed results. While Vignette A was rated as less depressed than Vignette B, which in turn was rated as less depressed than Vignette C, the three vignettes were ranked in that order by only 44% of participants across all countries (data not shown). However, 89% of the participants ranked Vignette C as more depressed than Vignette A, and the ranking was similar in the United States and the European countries as a group (92% and 87%, respectively). The majority of participants in individual European countries also ranked these two vignettes consistently (77%-93%). Therefore, only these two vignettes were used in the rest of the analyses reported here.
Vignette Ratings
The ratings of Vignettes A and C by American and European participants are presented in Figure 1. Participant with missing data on either of the vignettes and inconsistent ranking of vignettes were excluded. Participants with missing data on sex, age, and education were also excluded as these variables were used to standardize samples and also as covariates in regression models. Thus, a total of 9,657 participants were included in these analyses.
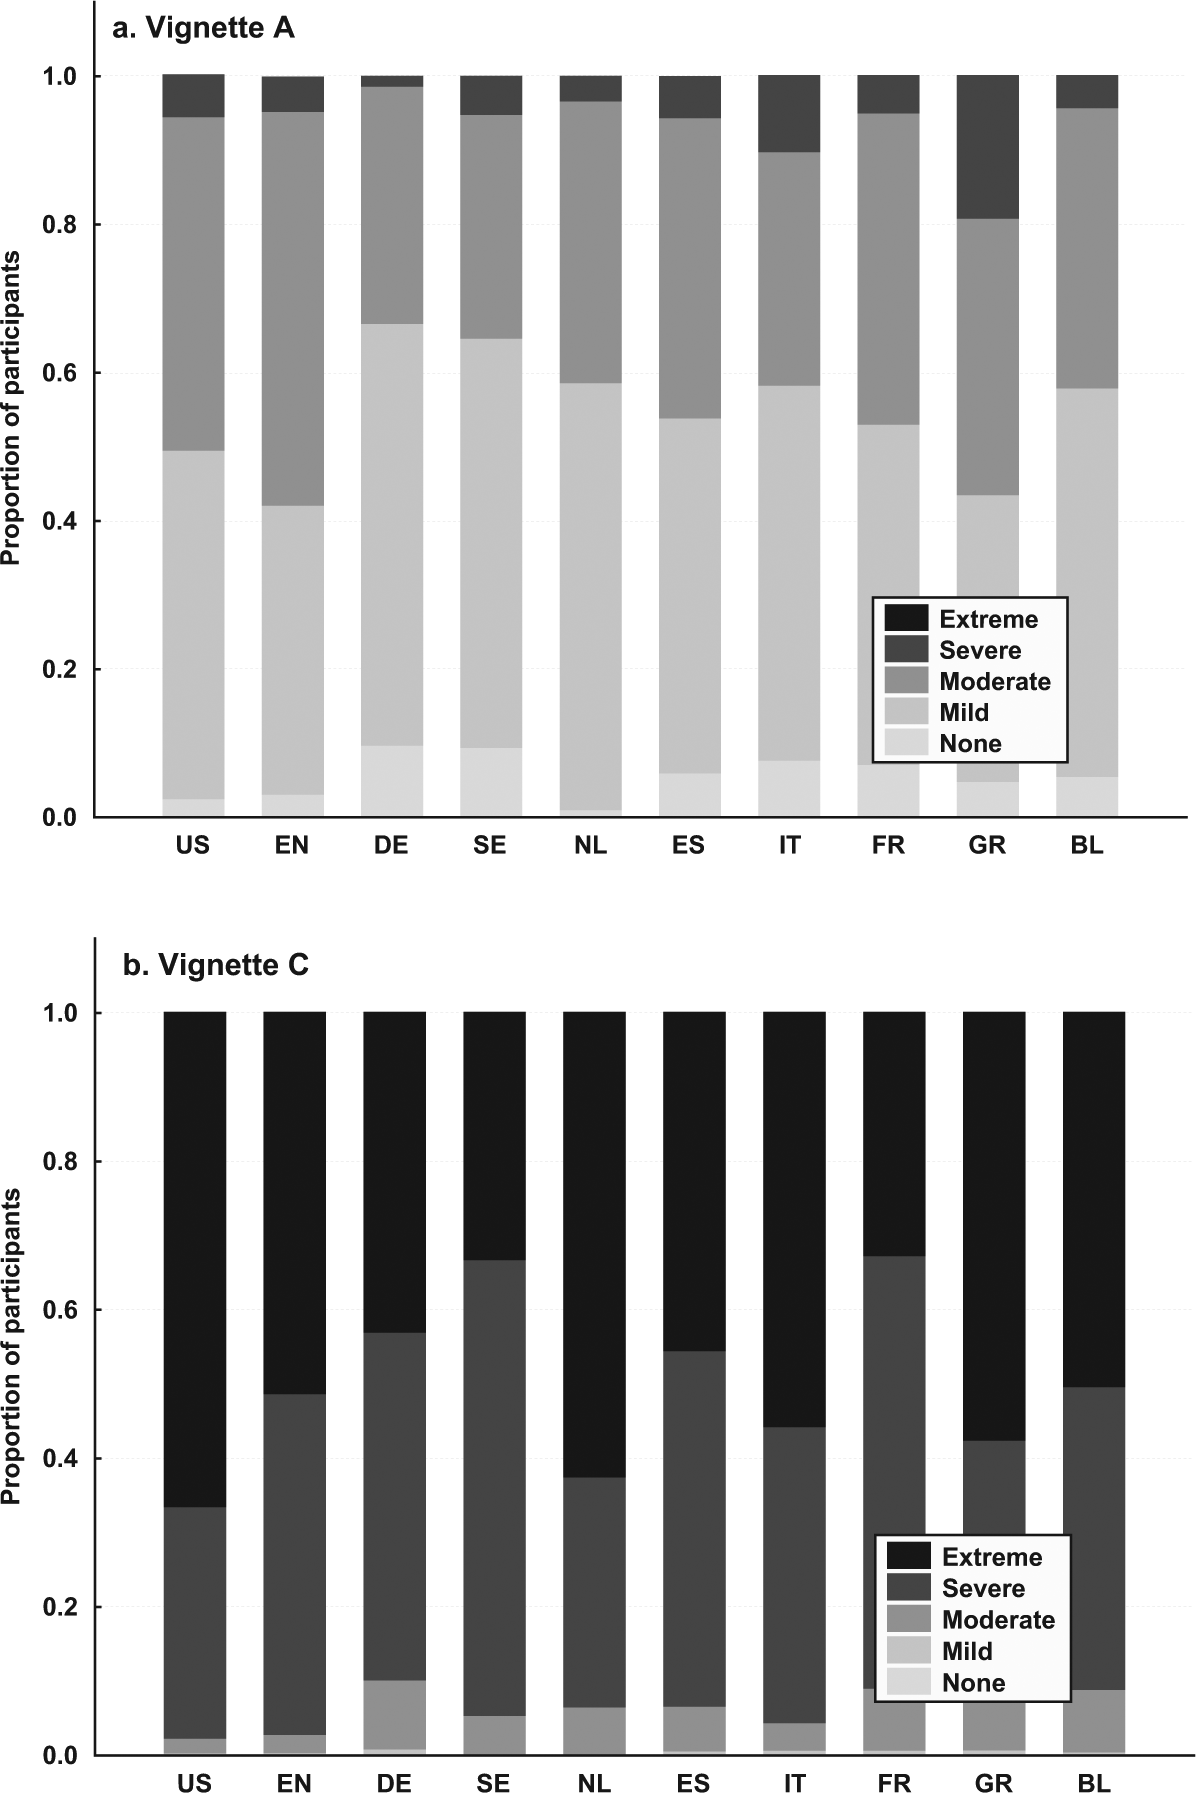
Ratings of Vignettes A and C of depressed mood by American and European older and middle-aged adults.
Participants in the U.S, and European countries differed significantly with regard to ratings of vignettes (Table 1), with both Vignettes A and C being rated as more depressed by Americans compared with participants from almost all included European countries, as indicated by the statistically significant negative coefficients of ordinal probit modes in Table 1. The only exception was rating of Vignette A as more depressed by the English than Americans. The results of these individual country comparisons were consistent with the results of comparisons when the participants from all nine European countries were combined and compared with the American participants (regression coefficient [B] = −.061, standard error = .023, p = .008 for Vignette A; B = −.475, standard error = .026, p < .001 for Vignette C; Table 1). The coefficients for most countries did not meet the parallel line assumption of the standard ordinal probit model, especially in the model for Vignette A (Appendix 2). However, the regression coefficient for all European countries combined in the model for Vignette C did not violate the parallel line assumption (Appendix 3).
Results of Ordinal Probit Models Comparing Vignette Ratings of Depressed Mood in American and European Older and Middle-Aged Adults.
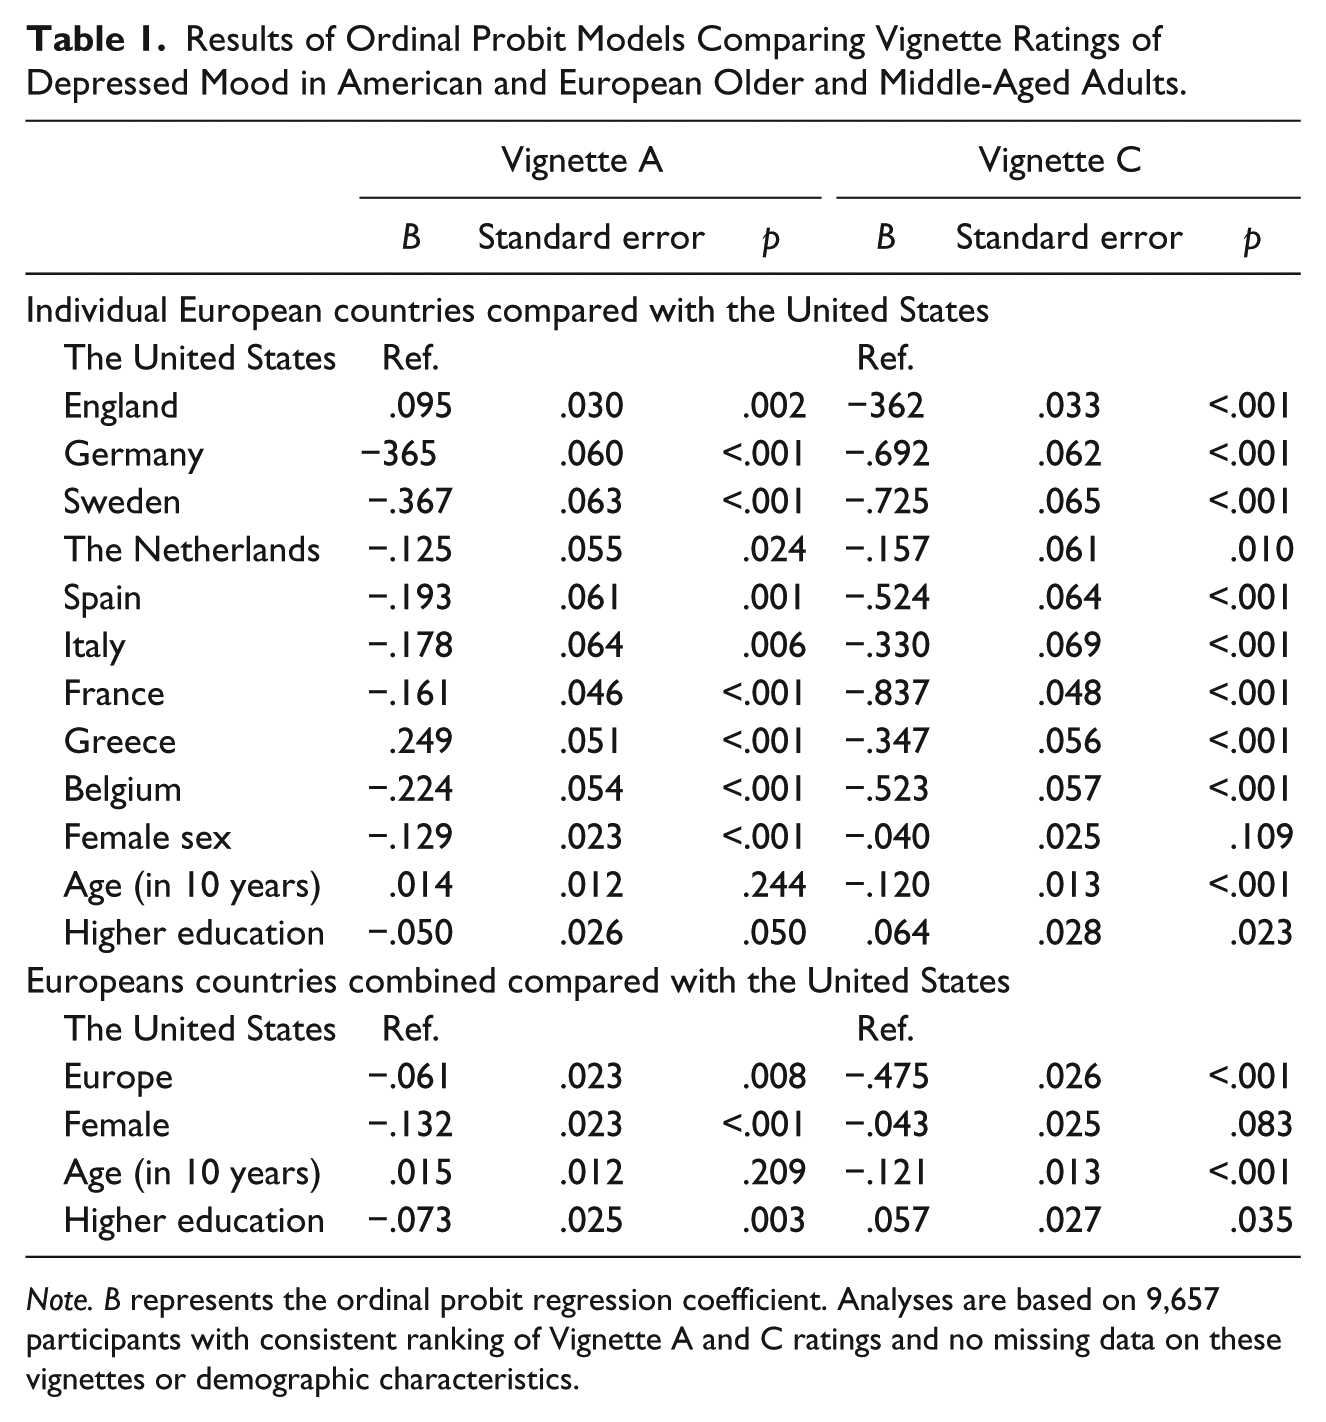
Note. B represents the ordinal probit regression coefficient. Analyses are based on 9,657 participants with consistent ranking of Vignette A and C ratings and no missing data on these vignettes or demographic characteristics.
Self-Ratings of Depressed Mood
Americans and Europeans also differed significantly with regard to self-ratings of depressed mood, with Americans reporting a higher average rating of depressed mood than the English and the Dutch but lower than the Swedish participants (Table 2). Combined together, Europeans reported themselves to be less depressed compared with their American counterparts (B = −.074, standard error = .024, p = .002). In further analyses, the difference appeared to be largest with regard to the “none” and “mild” ratings: 53.7% of Europeans reported having no problems with depressed mood in the past 30 days, compared with 47.4% of Americans. Along these lines, 34.8% of Americans compared with 28% of Europeans combined reported “mild” problems. The absolute differences were smaller with regard to “moderate,” “severe,” and “extreme” ratings (data not shown). The magnitude of differences in average depressed mood ratings between the European and the American participants was overall modest and ranged from −0.27 standard deviations between participants from the Netherlands and the United States to 0.16 standard deviations between Italians and Americans (data not shown).
Results of Ordinal Probit Models Comparing Self-Ratings of Depressed Mood in American and European Older and Middle-Aged Adults.

Note. B represents the ordinal probit regression coefficient. Analyses are based on 9,657 participants with consistent ranking of Vignette A and C ratings and no missing data on these vignettes or demographic characteristics. HOPIT = Hierarchical ordered probit.
The self-rating of depressed mood before and after non-parametric adjustment using the anchoring vignettes are presented in Figure 2. Adjustment by anchoring vignettes changed the results of the between-country comparison of self-ratings of depressed mood (Table 2). Specifically, after adjustment for anchoring vignettes, participants from Germany, Spain, Italy, and Belgium all had higher self-rated depressed mood compared with participants from the United States. Furthermore, the comparison of participants from European countries combined with the United States on the vignette-adjusted self-ratings was statistically non-significant (B = .022, standard error = .025, p = .370; Table 2).
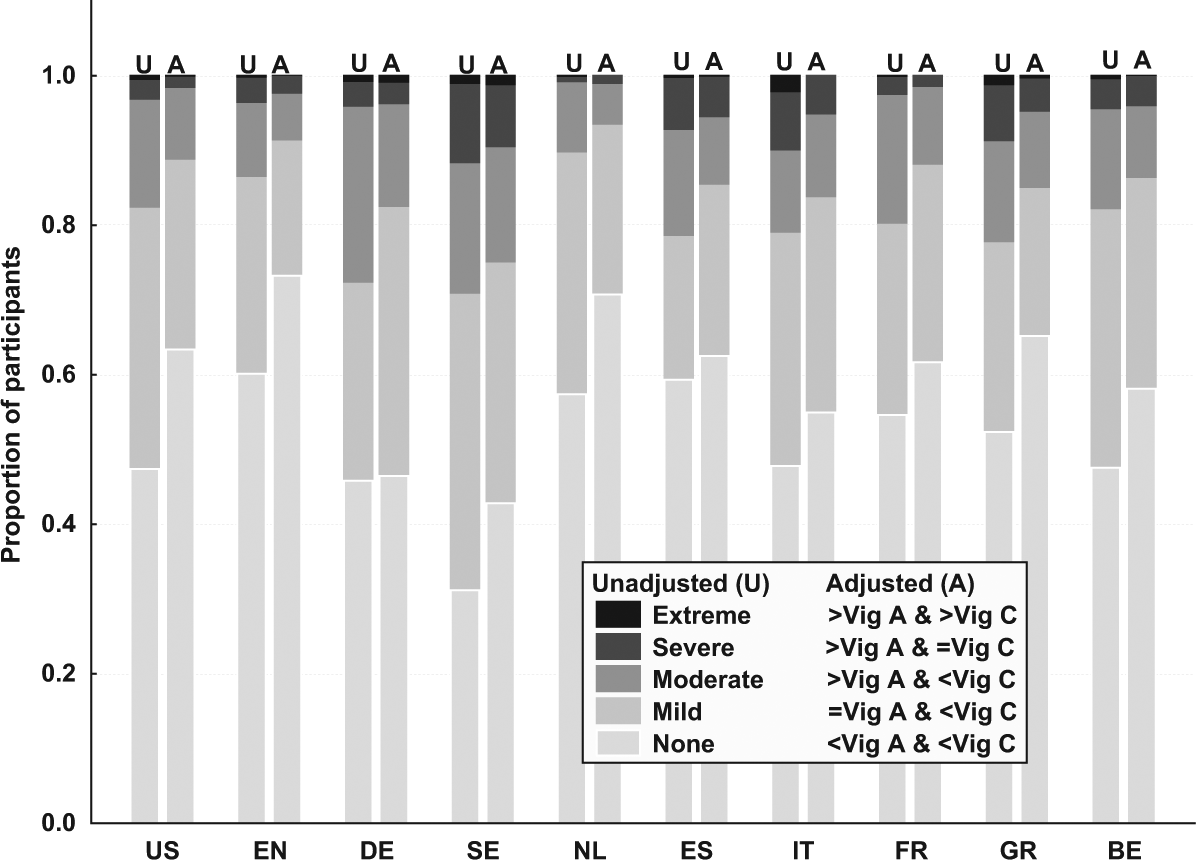
Self-ratings of depressed mood by American and European middle-aged and older adults.
The magnitudes of differences in average self-ratings of depressed mood between the European and the American participant after adjustment by anchoring vignettes ranged from 0.52 SDs for participants from Sweden compared with the United States to −0.19 for participants from the Netherlands compared with the United States. Overall, the magnitude of differences between European countries and the United States changed modestly after adjustment by anchoring vignettes (data not shown), the largest change being for the comparison of the average rating of Germans and Americans: from 0.01 before adjustment to 0.23 after adjustment by anchoring vignettes.
In sensitivity analyses, the impact of using alternate versions of the vignettes in HRS and SHARE was assessed. These analyses did not reveal any meaningful differences in results when the sample was limited to 5,807 participants who rated the same version of vignettes in all three surveys (data not shown).
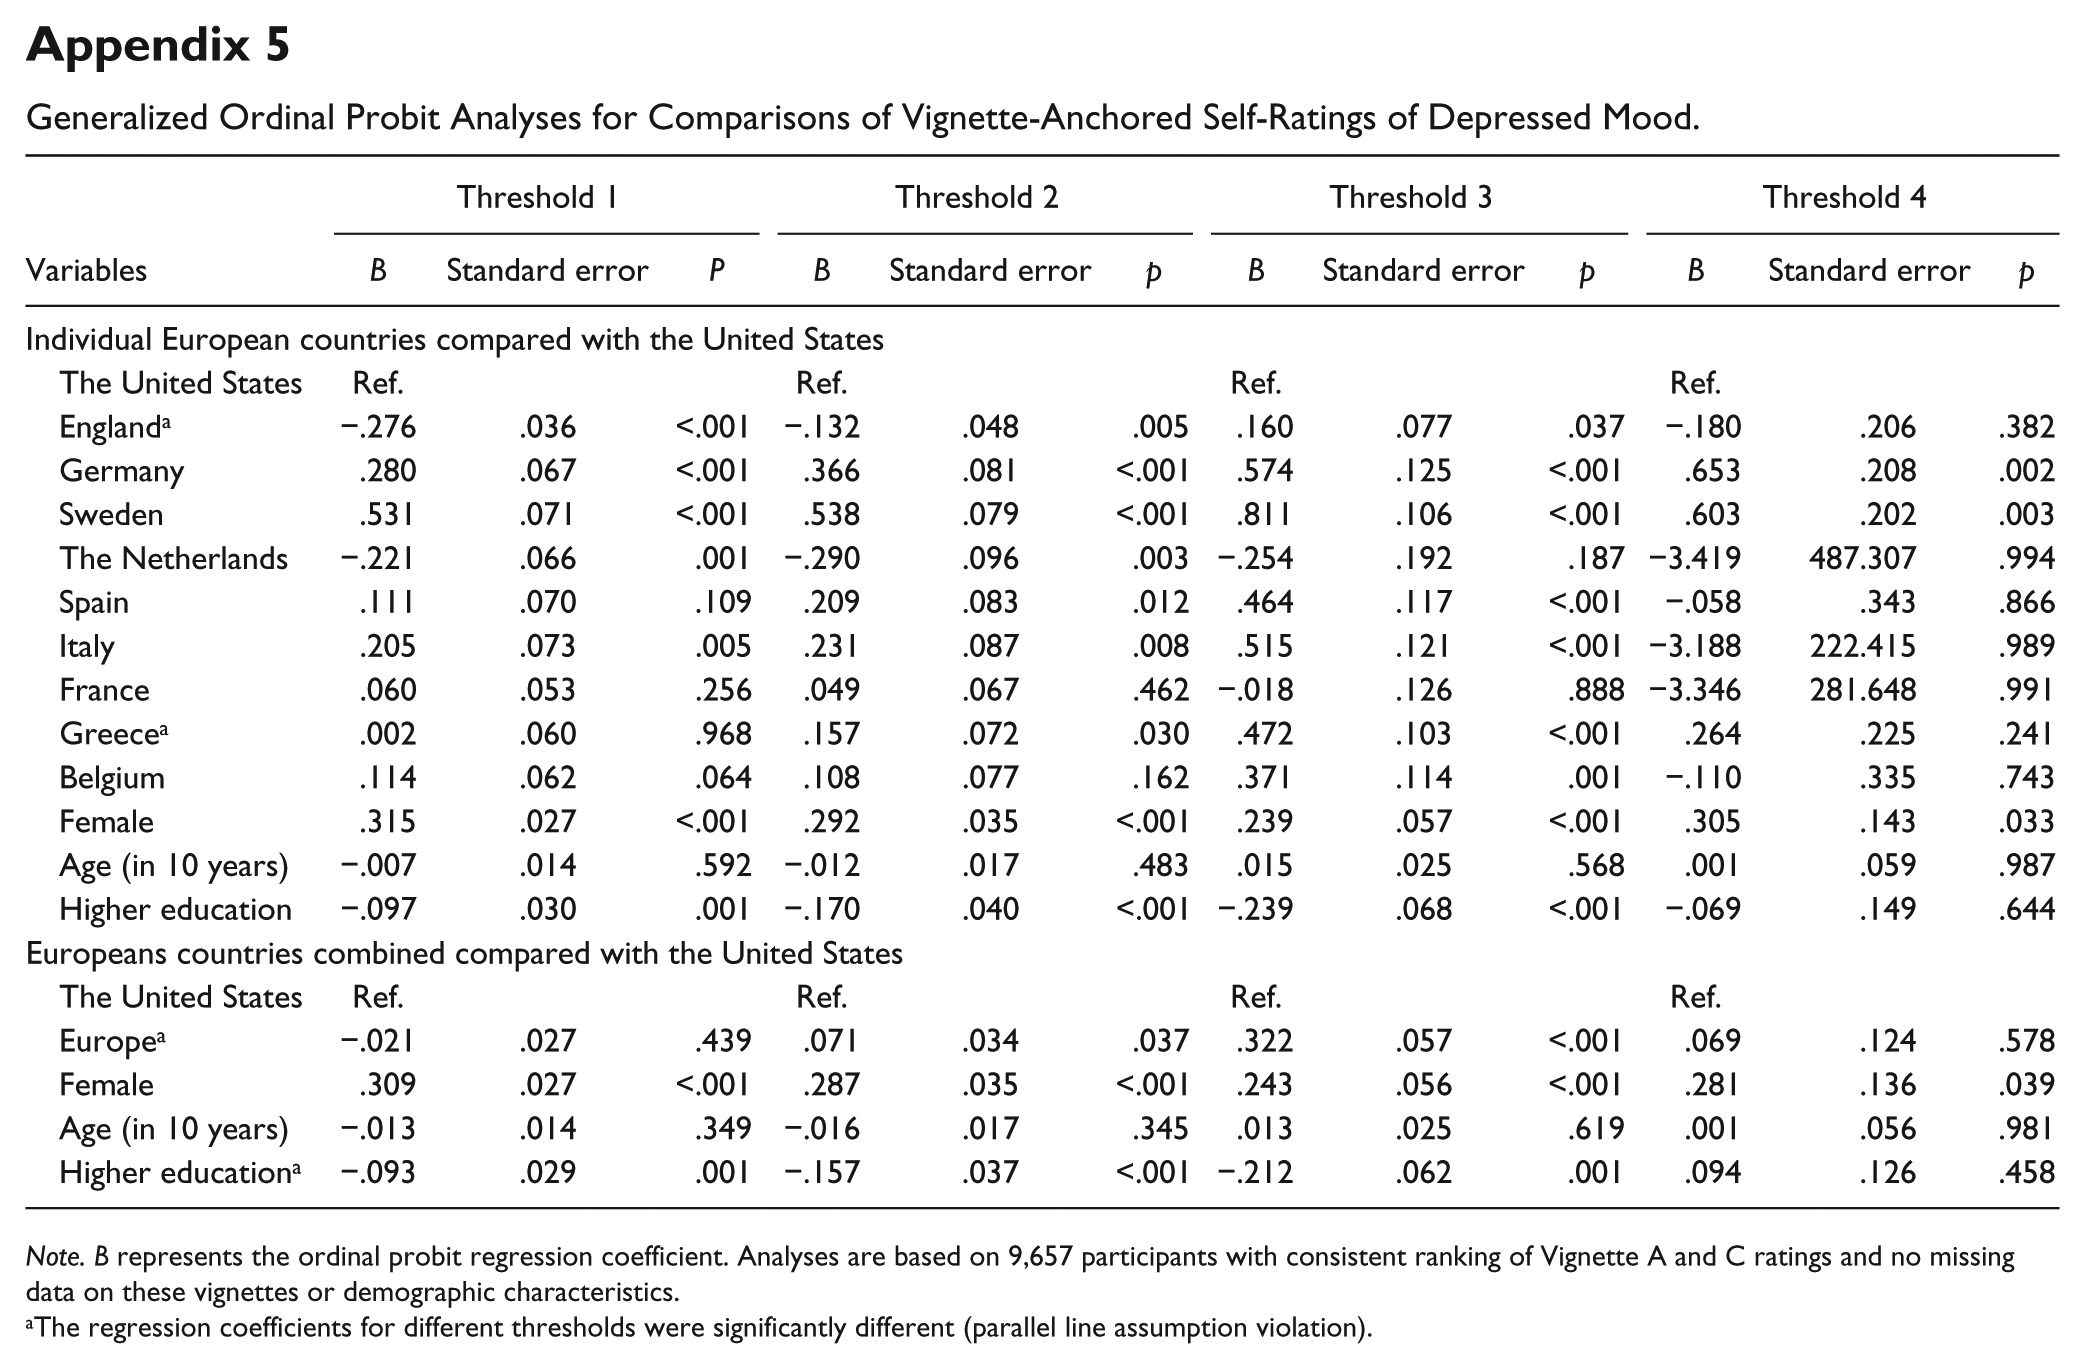
The regression coefficients for the European countries individually and combined compared with those for the United States did not meet the parallel line assumption of the standard ordinal probit model in the model not adjusted by anchoring vignettes (Appendix 4). Similarly, in the model for self-ratings adjusted by anchoring vignettes, the coefficient for the European countries combined violated the parallel line assumption (Appendix 5). These results justify the use of HOPIT models, which are not based on the parallel line assumption.
The HOPIT analyses were mainly consistent with the vignette-adjusted analyses presented in Table 2 with the exception that in the HOPIT model, participants from France and Greece also had a higher self-rating of depressed mood compared with the Americans (Table 2). The comparison of participants from the European countries combined with the Americans produced a statistically significant result in the HOPIT model (B = .075, standard error = .028, p = .007), indicating a higher level of depressed mood among Europeans (Table 2).
Of the socio-demographic variables included in all three models for self-ratings, female sex remained significantly associated with a higher level of depressed mood. In addition, higher education remained associated with a lower level of depressed mood in all three models.
Discussion
The use of anchoring vignettes provides a promising tool for examining reporting heterogeneity and adjusting self-ratings of psychiatric symptoms in cross-national comparisons (Guindon & Boyle, 2012; Kok et al., 2012). In one application of this methodology, investigators compared reporting heterogeneity in depressive symptoms among Vietnamese and French participants of the World Health Survey (Guindon & Boyle, 2012). The French participants in that study rated themselves as more depressed than the Vietnamese. The authors also identified some differences between the countries with regard to ratings of vignettes. However, adjusting for reporting heterogeneity did not eliminate the differences in self-rated depressed mood across the two countries (Guindon & Boyle, 2012). Similarly, in another study based on the SHARE data, adjustment of self-ratings by anchoring vignettes did not significantly affect cross-country comparisons of depressed mood (Kok et al., 2012).
Similar to these past studies, the present study identified between-country variations in both self- and vignette-ratings of depressed mood. However, in contrast to past research, adjustment by anchoring vignettes in the present study changed the results of the comparison of self-rated depressed mood among Americans and Europeans. This finding suggests that at least some of the variations in self-reported depressed mood among American and European middle-aged and older adults may be due to reporting heterogeneity.
Despite its promise and theoretical appeal, the use of vignette anchors rests on strong assumptions, including the assumption that all individuals interpret the vignettes in the same way. Attaining such consistent interpretation is difficult even in the same country and using vignettes in the same language. Interpretations may become further discordant when vignettes are in different languages.
The use of vignettes for adjusting psychiatric symptoms is further limited by the lack of objective measures against which the validity of vignette-adjusted and unadjusted self-ratings can be compared (Datta Gupta et al., 2010). Furthermore, there is some evidence that differences in vignettes’ content may influence the adjustment of self-ratings (Voňková & Hullegie, 2011). Unfortunately, too few vignettes were available in this study to test sensitivity of results to the use of anchoring vignettes with different contents. Another major limitation of the study was the limited number of European countries included. The findings may not generalize to countries that were not included and the U.S.–Europe comparison may produce different results if all European countries are included. It is also noteworthy that although the differences in self-rated depressed mood across European and American participants were statistically significant, they were modest in magnitude. Epidemiologic studies of psychiatric disorders, including major depressive disorder, have found larger differences between American and European adults of all ages (Bromet et al., 2011; Demyttenaere et al., 2004). Whether adjustment for anchoring vignettes would have a larger impact on the between-country differences across the age range needs to be assessed in future research. Finally, the sample sizes from individual countries differed significantly and were not proportional to the populations of the countries represented. These differences, however, would mainly affect the statistical tests and not the regression coefficients or effect sizes.
In the context of these limitations, this study provides novel findings regarding differences in self-ratings of depressed mood among middle-aged and older adults in the U.S. and European countries. Middle-aged and older Americans tend to report somewhat higher levels of depressed mood, especially mild depressed mood compared with most Europeans. However, when adjusted for reporting heterogeneity by using anchoring vignettes, there is either no difference among Americans and Europeans as a group (in non-parametric analysis) or the Americans appear to have lower levels of depressed mood (in HOPIT analysis).
The change in the between-country comparison results before and after adjustment for anchoring vignettes is due to differences between Americans and Europeans in their ratings of anchoring vignettes. Americans tend to rate the cases depicted in the vignettes as suffering from a higher level of depressed mood than the Europeans do.
Past research provides little guidance as to the reasons for these differences in vignette ratings. It is possible that differences in cultural expectations or mental health literacy (Jorm et al., 2005; Lauber, Nordt, Falcato, & Rössler, 2003) have influenced these ratings. Exposure to advertisements for pharmaceuticals directed at consumers and educational campaigns depicting depression as “a disease like any other” may have influenced Americans’ perception of depressed mood as indicative of a “disease” and hence amplified its pathological nature (Blumner & Marcus, 2009; Mojtabai & Olfson, 2006; Pescosolido et al., 2010). The analyses also revealed significant variations among European countries both in self-reported depressive symptoms as well as vignette ratings. Past research has found significant variations in attitudes toward mental illness and mental health help seeking among European countries (Evans-Lacko, Brohan, Mojtabai, & Thornicroft, 2012; Mojtabai, 2009; Schomerus et al., 2014), which in turn may reflect variations in mental health literacy. European countries also vary considerably with regard to the formal mental health care system and help seeking from formal and informal providers (Mojtabai, 2009). Whether variations in attitudes toward mental illness, mental health help seeking, and mental health literacy could influence heterogeneity in self-report needs to be examined in future research. Future research also needs to explore the extent to which variations in other self-reported psychological complaints, including anxiety symptoms and self-reported impairment in functioning associated with mental health problems are influenced by reporting heterogeneity.
Footnotes
Appendix
Generalized Ordinal Probit Analyses for Comparisons of Vignette-Anchored Self-Ratings of Depressed Mood.
| Variables | Threshold 1 |
Threshold 2 |
Threshold 3 |
Threshold 4 |
||||||||
|---|---|---|---|---|---|---|---|---|---|---|---|---|
| B | Standard error | P | B | Standard error | p | B | Standard error | p | B | Standard error | p | |
| Individual European countries compared with the United States | ||||||||||||
| The United States | Ref. | Ref. | Ref. | Ref. | ||||||||
| England a | −.276 | .036 | <.001 | −.132 | .048 | .005 | .160 | .077 | .037 | −.180 | .206 | .382 |
| Germany | .280 | .067 | <.001 | .366 | .081 | <.001 | .574 | .125 | <.001 | .653 | .208 | .002 |
| Sweden | .531 | .071 | <.001 | .538 | .079 | <.001 | .811 | .106 | <.001 | .603 | .202 | .003 |
| The Netherlands | −.221 | .066 | .001 | −.290 | .096 | .003 | −.254 | .192 | .187 | −3.419 | 487.307 | .994 |
| Spain | .111 | .070 | .109 | .209 | .083 | .012 | .464 | .117 | <.001 | −.058 | .343 | .866 |
| Italy | .205 | .073 | .005 | .231 | .087 | .008 | .515 | .121 | <.001 | −3.188 | 222.415 | .989 |
| France | .060 | .053 | .256 | .049 | .067 | .462 | −.018 | .126 | .888 | −3.346 | 281.648 | .991 |
| Greece a | .002 | .060 | .968 | .157 | .072 | .030 | .472 | .103 | <.001 | .264 | .225 | .241 |
| Belgium | .114 | .062 | .064 | .108 | .077 | .162 | .371 | .114 | .001 | −.110 | .335 | .743 |
| Female | .315 | .027 | <.001 | .292 | .035 | <.001 | .239 | .057 | <.001 | .305 | .143 | .033 |
| Age (in 10 years) | −.007 | .014 | .592 | −.012 | .017 | .483 | .015 | .025 | .568 | .001 | .059 | .987 |
| Higher education | −.097 | .030 | .001 | −.170 | .040 | <.001 | −.239 | .068 | <.001 | −.069 | .149 | .644 |
| Europeans countries combined compared with the United States | ||||||||||||
| The United States | Ref. | Ref. | Ref. | Ref. | ||||||||
| Europe a | −.021 | .027 | .439 | .071 | .034 | .037 | .322 | .057 | <.001 | .069 | .124 | .578 |
| Female | .309 | .027 | <.001 | .287 | .035 | <.001 | .243 | .056 | <.001 | .281 | .136 | .039 |
| Age (in 10 years) | −.013 | .014 | .349 | −.016 | .017 | .345 | .013 | .025 | .619 | .001 | .056 | .981 |
| Higher education a | −.093 | .029 | .001 | −.157 | .037 | <.001 | −.212 | .062 | .001 | .094 | .126 | .458 |
Note. B represents the ordinal probit regression coefficient. Analyses are based on 9,657 participants with consistent ranking of Vignette A and C ratings and no missing data on these vignettes or demographic characteristics.
The regression coefficients for different thresholds were significantly different (parallel line assumption violation).
Declaration of Conflicting Interests
The author declared no potential conflicts of interest with respect to the research, authorship, and/or publication of this article.
Funding
The author disclosed receipt of the following financial support for the research, authorship, and/or publication of this article: This work was not supported by any funding agency. Dr. Mojtabai has received research funding from Bristol Myers-Squibb and Lundbeck pharmaceuticals for work unrelated to this study.