
Abstract
Introduction
China is rapidly experiencing the global health and societal challenges of population aging. The population is aging at a rate 2 to 4 times faster than that experienced in earlier decades by Western countries such as the United States, Sweden, and France. By 2050, a projected 454 million Chinese will be aged 60 years old or above (Department for Economic and Social Affairs [DESA], 2013). Furthermore, the one-child policy introduced in the 1970s will accelerate increases of the elderly dependency ratio to a projected range of 35% to 44% in 2050. These population changes together with changes in the health profiles will place pressure on family and communities for care responsibilities with consequences for the already overburdened health care system (Wang & Chen, 2014).
Over the past two decades, population aging has combined with a significant health transition from communicable, maternal, and neonatal health challenges toward more non-communicable diseases and chronic disabilities. In developing as well as developed countries, years lived with disability (YLDs) have comprised a larger proportion of disability-adjusted life years (DALYs) than have years of life lost (YLLs) due to premature mortality (Friedrich, 2013; Murray et al., 2013; Yang et al., 2013). In China, by 2030, the elderly population is projected to account for 65.6% of the country’s total disease burden (Chatterji et al., 2008). China has announced its health reform plan in 2009 to improve health coverage, health delivery, public health, and drug supply (Ho & Gostin, 2009). The dynamic relationship between changes in life expectancy, functional health, and morbidity in its aging population will be a major influence on the coping capacities of the country’s health and social care systems (Spijker & MacInnes, 2013).
Health expectancy measures provide useful indicators of population health in a context of changing total life expectancy (Sanders, 1964; Sullivan, 1971). Measures of perceived health, prevalence of diseases, functioning levels, and disabilities are useful in benchmarking different aspects of health status and assessing change in older populations (J.-M. Robine, Romieu, & Cambois, 1999). Using a more restrictive definition of health (i.e., free from sequel of diseases and injuries), with information of age-specific mortality rates, prevalence of 1,160 sequelae of disease and injury, as well as disability weights estimated for each unique health state that mapped from these 1,160 sequelae, the Global Burden of Disease (GBD) 2010 study reported health expectancies in 187 countries. China had a health expectancy at birth of 65.5 years in men and 70.4 years in women, compared with global figures of 59.0 years in men and 63.2 years in women (Salomon et al., 2013), ranking 10th among the G20 countries (Yang et al., 2013). Similar indicators such as chronic disease-free health expectancy (CDFLE) and disability-free life expectancy (DFLE) are increasingly used in many countries (Bajekal, 2005; Brønnum-Hansen, 2005; Crimmins & Saito, 2001; Mathers, Sadana, Salomon, Murray, & Lopez, 2000; Wilkins & Adams, 1983).
Related developments in gerontology include the concepts of healthy and active aging as outlined in the World Health Organization’s (WHO; 2002) Active Aging: A Policy Framework. Active aging was defined as “the process of optimizing opportunities for health, participation, and security to enhance quality of life as people age.” (p. 12) This conceptualization emphasizes the importance of health for quality of life outcomes as well as the influence of social determinants of health. Positive health indices include life expectancy in states of Good Perceived Health Life Expectancy (GPHLE) and Active Life Expectancy (ALE), which have been examined as potentially improvable determinants of well-being and functioning (Brønnum-Hansen, 2005; Doblhammer & Kytir, 2001). Research on “aging well” and related concepts such as successful aging emphasizes the importance of health for psychological well-being and independence, which are highly valued by older people themselves, and the potential for health promotion to achieve these outcomes (Kendig, Browning, Thomas, & Wells, 2014).
Healthy and Active Aging initiatives are underway in Canada, the United Kingdom, the United States, and Australia (Kendig & Browning, 2010; Llewellyn, Balandin, Dew, & McConnell, 2004; Marshall & Altpeter, 2005; Mayhew, 2005; Ney, 2005; Walker & Maltby, 2012). Seminal national and regional health strategies—represented by Healthy People 2020 in the United States, Healthy Japan 21 in Japan, and Europe 2020 initiated by the European Commission—all referred to healthy and active aging as priority outcomes to be achieved (Sakurai, 2003; U.S. Department of Health Human Services, Office of Disease Prevention Health Promotion, 2012; Walker & Aspalter, 2014; Walker & Maltby, 2012). Walker and Aspalter (2014) have reviewed active aging strategies in a range of Asian countries including China (Lou, 2014).
Comparable advances have been made by the World Bank which recognizes health as a critical factor in economic development (Spence & Lewis, 2009). Better health has also been shown to be critical for productive participation at older ages in both the paid workforce and in voluntary activities in developed countries (Doyle, McKee, Rechel, & Grundy, 2009; Loh & Kendig, 2013). At present in China, the official retirement age is 60 years for men and 55 years for women. Due to rapid population aging, China’s pension fund will come under tremendous fiscal pressure in the coming years, and government is therefore considering gradual increases in the official retirement age. According to the Ministry of Human Resources and Social Security, policy changes might be phased in over 5 years, although the exact age and time table are still pending (Koh, 2015).
Age-specific understandings of the durations of health expectancies are particularly valuable for prioritizing resources in public health strategies, estimating remaining work capacity and labor force participation and, with longitudinal follow up, assessing impacts and monitoring progress toward national health objectives (Jagger et al., 2009; Pamuk, Wagener, & Molla, 2004; Robine & Ritchie, 1991; Stiefel, Perla, & Zell, 2010). However, the existing evidence base consists overwhelmingly of research conducted in Western developed countries which potentially have different patterns and determinants of health from those in rapidly developing countries in Asia. In this context, the present study aims to understand the current health status of older adults in China in terms of expectations for functional health capacities to inform policy development and implementation aimed at increasing years of functional health capacities and improving healthy and active aging.
Method
Data Sources
We used data from the 2011 baseline wave of the China Health and Retirement Longitudinal Study (CHARLS; Zhao, Hu, Smith, Strauss, & Yang, 2012). CHARLS is the first nationally representative survey of people aged 45 years or above with information on perceived good health, chronic diseases, activities of daily living (ADL) limitations, and disabilities. The sample was collected on a multi-stage probability-proportional-to-size (PPS) technique, with county-level units stratified by region and then by urban districts or rural counties and per capita gross domestic product (GDP). A total of 17,708 participants were included (response rate = 80.5%). To facilitate comparisons of health expectancies to other countries (Jagger et al., 2009; Jagger et al., 2011; Salomon et al., 2013), we included only older adults aged 50 years or above (in eight 5-year age groups).
Age-specific mortality rates and standard life tables of the corresponding years were obtained from the WHO. We also compared ALE in 2011 using CHARLS data with ALE data in 2000 using the 2000 China Health and Nutrition Survey (CHNS; Popkin, Du, Zhai, & Zhang, 2010). These two surveys were similar in terms of ADL survey question wordings and random sampling methods. Data from both surveys were used with available WHO life tables. CHNS 2000 has a sample of 15,648 individuals from nine provinces in China. Data on ADL functioning were available only for participants aged 55 years or above (2,376 individuals). In view of the relatively smaller sample sizes in CHNS 2000, we did not disaggregate participants aged above 75 years in the ALE comparative analyses with CHARLS.
Data Analyses
We calculated health expectancies by age and by sex using Sullivan’s method (Sullivan, 1971). GPHLE was calculated using prevalence of self-rated health status as good or above. CHARLS adopted two 5-point scales for self-reported general health, which were randomly assigned to participants to examine any effects of central tendency bias: Respondents either rate their health from excellent to very good, good, fair, and poor (Scale A) or from very good to good, fair, poor, and very poor (Scale B). In our analysis, we considered self-rated health status of good or above in either scale as the cutoff for good self-perceived health. CDFLE was calculated based on self-reported diagnosis of any of the following chronic illnesses: hypertension, dyslipidemia, diabetes, cancer, chronic lung disease, liver disease, heart disease, stroke, kidney disease, digestive disease, psychiatric condition, memory-related disease, arthritis or rheumatism, and asthma. ALE was defined as ADL limitation-free life expectancy in terms of any reported difficulty with bathing/showering, eating, or dressing; these domains were available comparably in both CHARLS and CNHS (Chien et al., 2014; Wallace & Herzog, 1995). Severe impairment-free life expectancy (SIFLE) was defined as the absence of any severe physical disability, brain damage/mental retardation, vision problem (blind or half blind), hearing problem (deaf or half deaf), or speech impediment (dumb or severe stammer). Individual weights with household and individual non-response adjustment were created by the CHARLS team.
Results
The CHARLS sample for the analyses consists of 13,739 people aged 50 years or above (6,809 men and 6,930 women). The mean age was 62.5 (SD = 8.9) years. The CHNS sample consisted of 2,376 people aged 55 years or above with ADL functioning information (1,121 men and 1,255 women). According to their household registration (Hukou) status, rural residents amounted to 77.1% of the CHARLS sample and 61.4% of the CHNS sample.
Health Status and Health Expectancy in 2011
Table 1 shows the weight-adjusted prevalence rates from CHARLS of self-reported good health, chronic disease, ADL limitation, and severe impairment in 2011 in older adults aged 50 years or above disaggregated by sex and by age. Only 26.8% of older men and 21.9% of older women considered themselves as having good health. A majority of the older men and women reported at least one chronic illness (68.5% and 71.5%, respectively), whereas only 13.0% of older men and 14.5% of older women reported any ADL limitation, and 19.8% and 18.7% any severe impairment.
Age-Specific Health Status in Adults Aged 50 Years or Older in China in 2011.
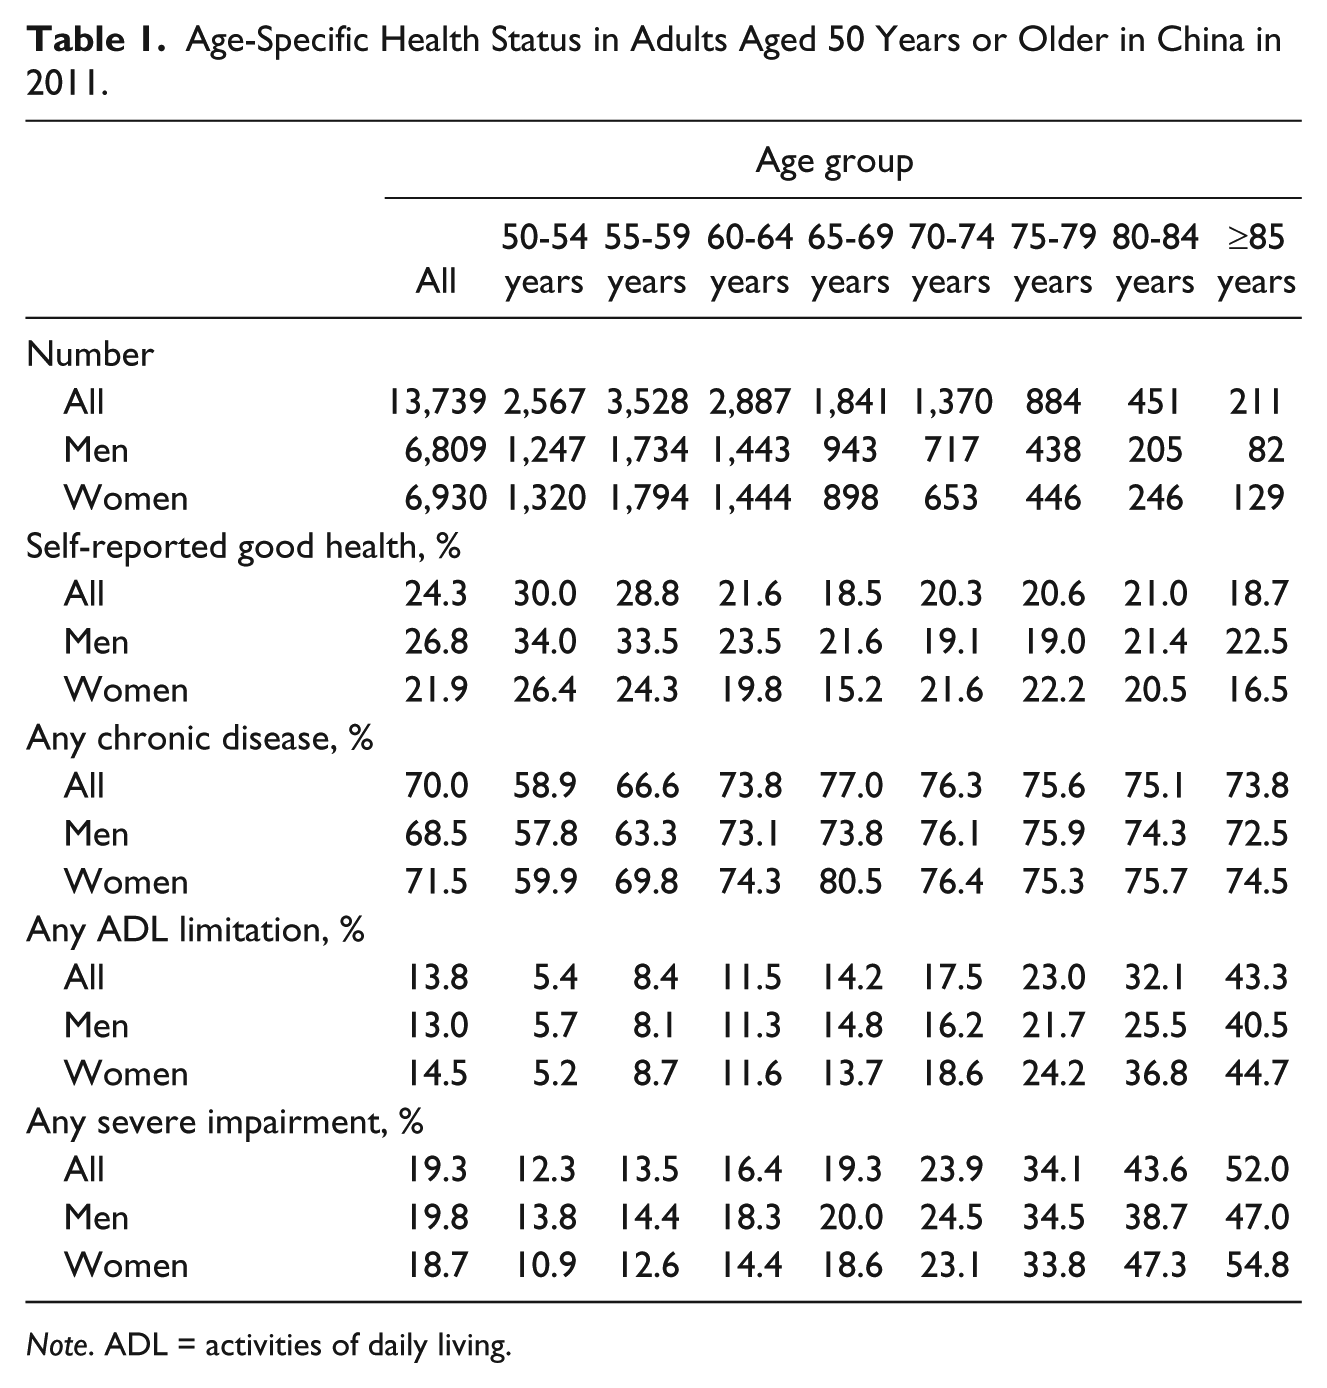
Note. ADL = activities of daily living.
Figure 1 shows the age- and sex-specific GPHLE, CDFLE, ALE, and SIFLE in years with 95% confidence intervals and their proportions to total life expectancy in 2011. We report here the health expectancies calculated using weight-adjusted prevalence rates.

Age-Specific Health Expectancies in Adults Aged 50 Years or Older in China in 2011.
In the youngest group (at age 50 years), GPHLE was 6.7 years for women and 7.0 years for men, contributing to 21.2% and 25.7% of their total life expectancy, respectively. They had a CDFLE of 8.6 and 8.4 years, or 27.3% and 30.6% only. ALE was relatively high at 26.0 and 23.6 years, or 82.7% and 85.9%; similarly, SIFLE was 24.2 and 21.4 years, corresponding to 76.8% and 78.0%, respectively, of total life expectancy in women and men at age 50 years (Table 2).
Age-Specific Health Expectancies in Adults Aged 50 Years or Older in China in 2011.
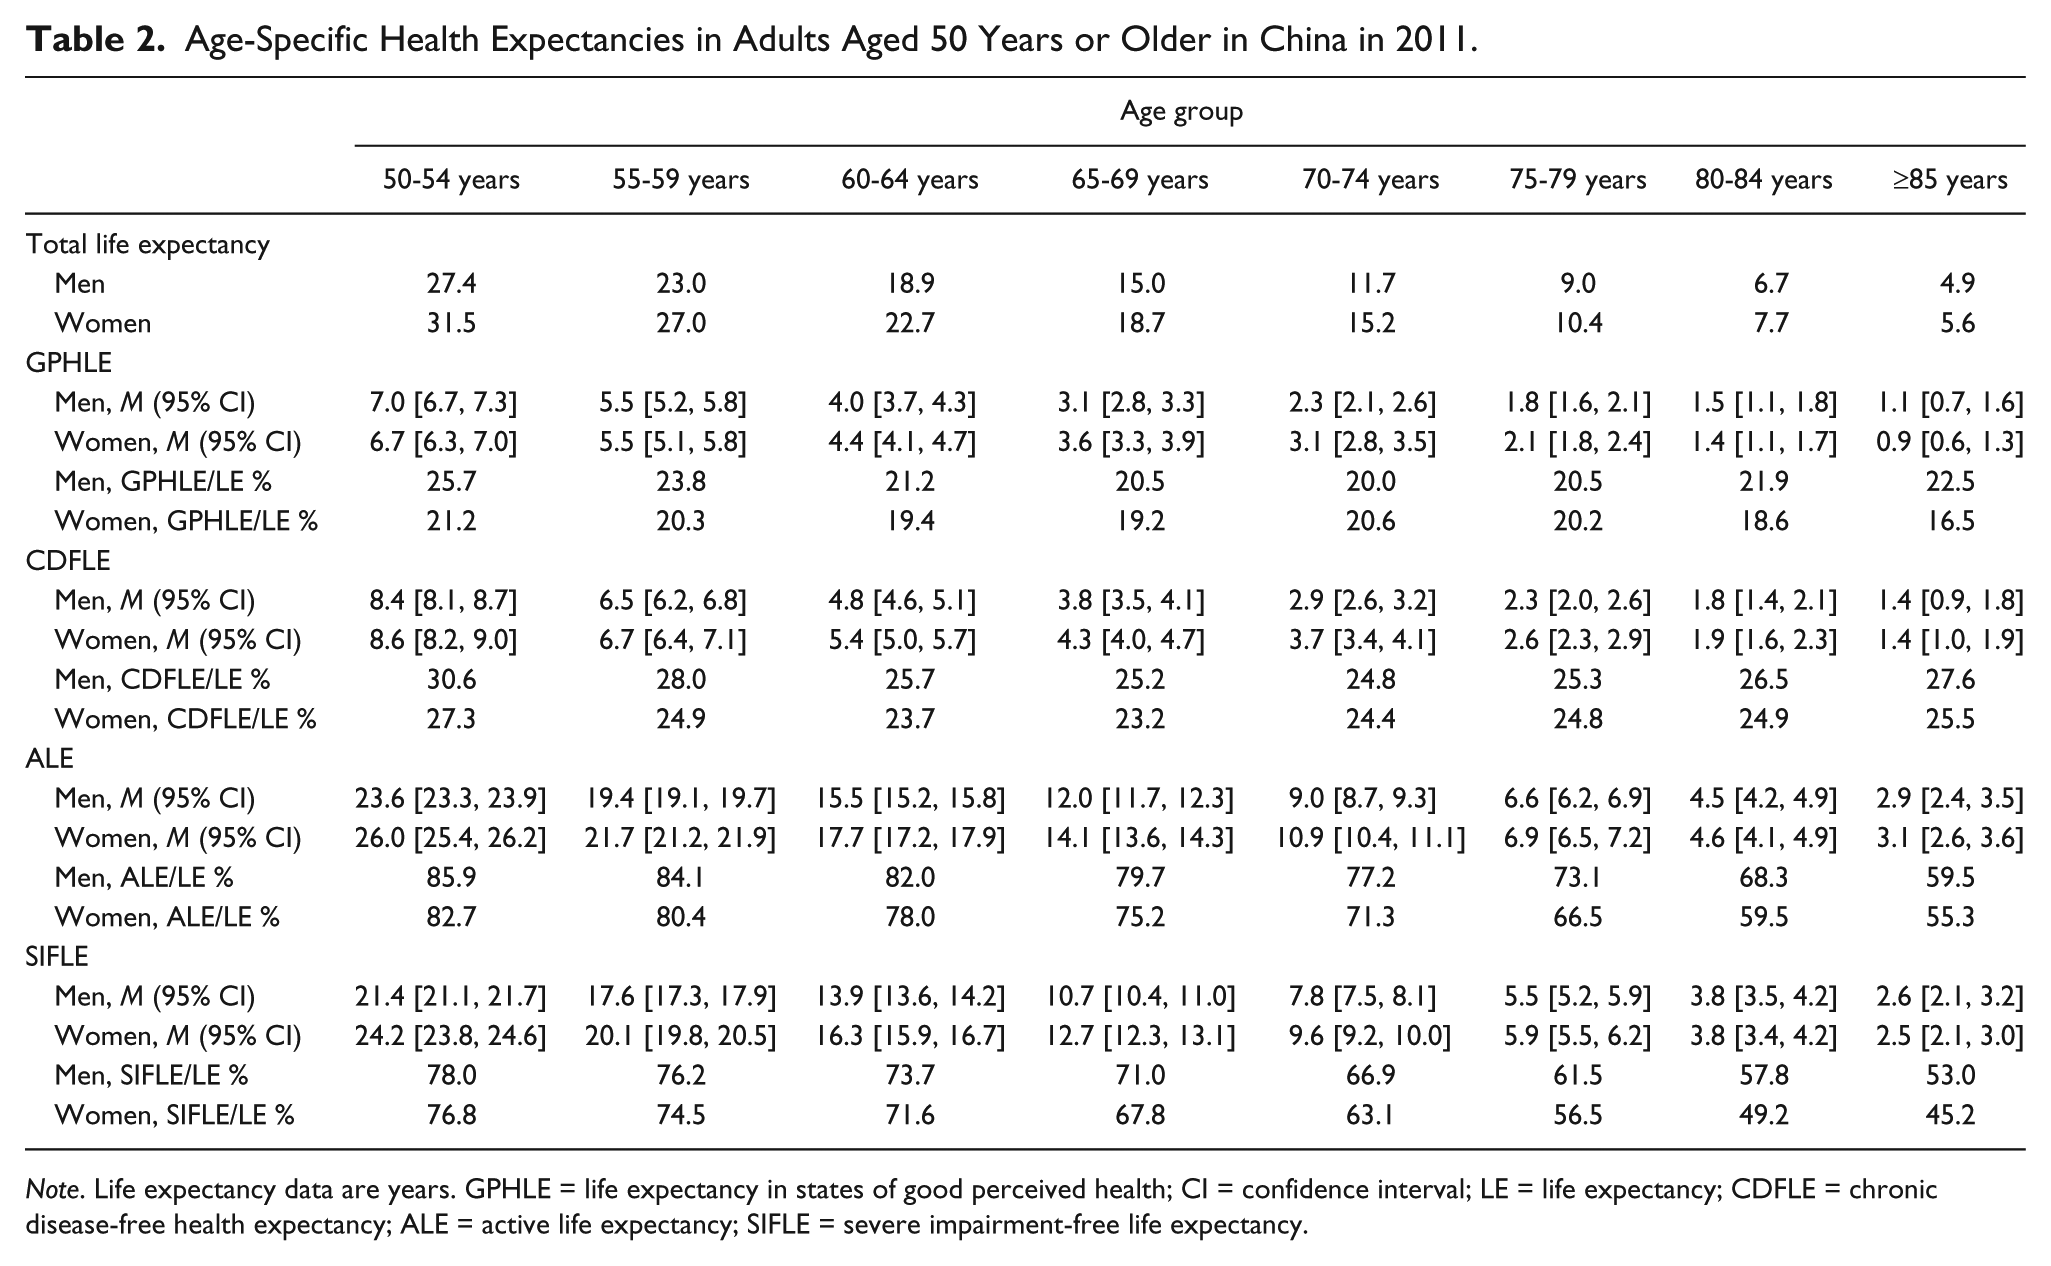
Note. Life expectancy data are years. GPHLE = life expectancy in states of good perceived health; CI = confidence interval; LE = life expectancy; CDFLE = chronic disease-free health expectancy; ALE = active life expectancy; SIFLE = severe impairment-free life expectancy.
Comparing men with women, both had similar GPHLE and CDFLE. However, in general, men were spending a larger proportion of their remaining years without any chronic illness, ADL limitation, or severe impairment compared with women. Before age 75 years, women had higher ALE and SIFLE; however, in terms of proportion to total life expectancy, men had relatively larger proportions of active and severe impairment-free years across all older age groups.
ALE in 2000 and 2011
Figure 2 shows the ALE and its proportion to total life expectancy in 2000 and 2011 in older adults aged 55 years or above. In older adults at age 55 years, total life expectancies increased 3.2 years from 23.8 to 27.0 years in women and 1.9 years from 21.1 to 23.0 years in men. The ALE increased 2.4 years from 19.7 to 22.1 years in women and only half a year from 19.1 to 19.6 years in men, while the proportion of ALE to total life expectancy decreased from 82.8% to 81.6% in women and from 90.9% to 85.0% in men. ALE had significantly increased in men aged above 70 years and in women across all age groups. The proportion of ALE to total life expectancy decreased significantly in men in the age 55, 60, and 65 years groups (t = −9.2, −6.8, and −4.6, all p < .001), while it increased significantly in women in the age 70 and 75 years groups (t = 3.6 and 4.4, all p < .001).
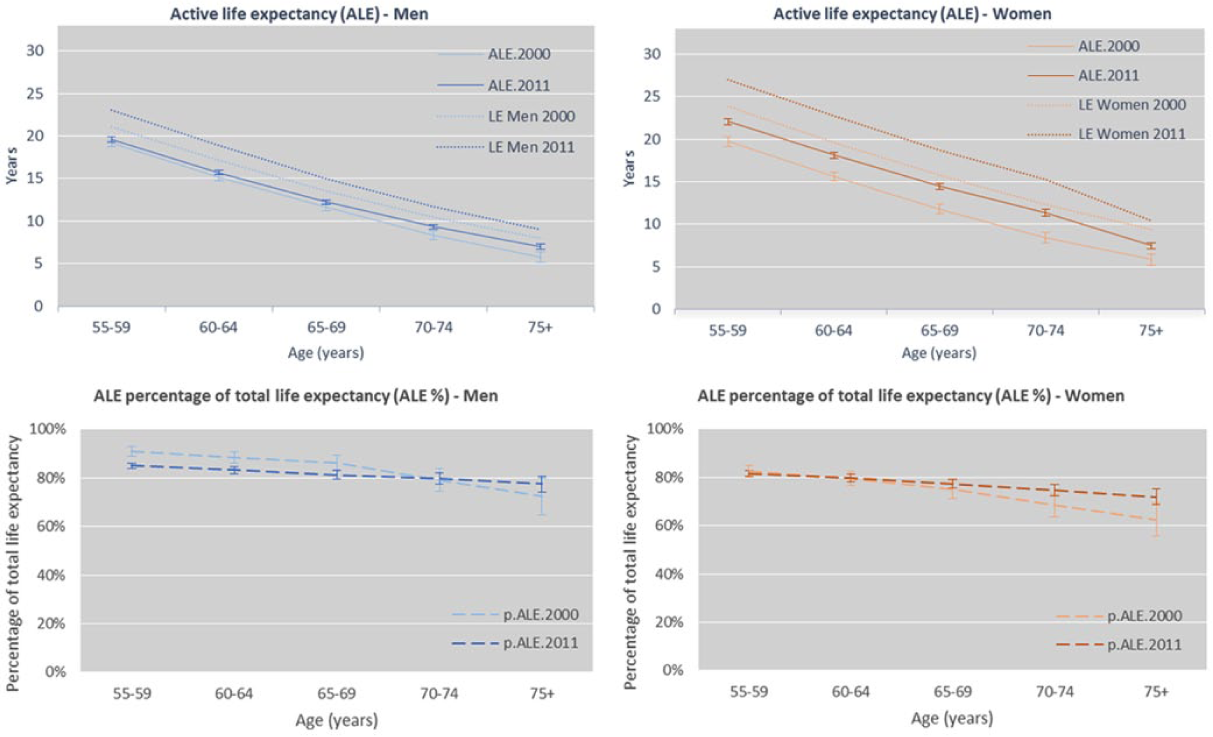
Age-specific Active Life Expectancy in Adults Aged 55 Years or Older in China in 2000 and 2011.
Discussion
From a disability-free perspective, the findings from the GBD 2010 suggested that China is enjoying good health expectancy, comparable with many developed countries, with a healthy-life expectancy of 22.4 years in men and 26.2 years in women at age 50 years, compared with the corresponding global figures of 21.0 and 24.2 years. Notably, China had the lowest age standardized YLDs among the G20, and a health expectancy at birth only 0.4 years behind the United States (Salomon et al., 2013). As we move toward a functional well-being concept of health expectancy, however, the situation as revealed in this study is less optimistic. In 2011, the world’s largest aging population was spending a substantial proportion of remaining life years in suboptimal perceived health and chronic diseases. Only one fifth of older adults in China perceived themselves as having good health. This translates into less than 10 years, or one third of their remaining lifetime, lived in a state of subjective good health from age 50 years. Chronic diseases set in at a relatively early age in the young–olds. This information complements findings of China’s rapid health transition to non-communicable chronic conditions and that older populations will increasingly account for the total disease burden (Chatterji et al., 2008; Yang et al., 2013).
The older population in China was nevertheless largely independent in basic daily activity and free from severely disabling impairments. The majority had no major ADL limitation or severe impairments at age 50 years, and approximately half of the survivors at age 85 years were living without any such limitation/impairments. In 2011, the young–old group in China had an ALE expectation to spend more than 20 years, or more than 80% of their remaining lifetimes, being able to manage their basic daily living activities. A similar pattern was noted in terms of severe impairments as per the disability-free measures.
The difference between the meaning of active in ALE and active and healthy aging should be noted. In ALE, “active” means performing basic ADL (e.g., bathing/showering, eating, and dressing) without difficulties—a very low level of functioning—as contrasted with the higher level functioning measures by disability.
Furthermore, with active and healthy aging, “active” refers to a broader concept of continuing participation in social, economic, cultural, spiritual, and civic affairs, not just the ability to be physically active or to participate in the labor force (WHO, 2002). While the ALE findings are important for addressing care needs, the disability findings on impairments are central to active and productive aging; specifically, they have actuarial implications for pension systems, retirement age, and productive participation of older people.
The change in functional capacities of the older Chinese should be assessed in the context of increasing life expectancy. Over the past decade, the expected years without ADL limitation have increased, especially for women at all older age groups and for men aged 70 years or above. Nonetheless, the expectations of years with limitations has increased by greater amounts, thus decreasing overall the age-specific capacities particularly for men aged 55 to 59, 60 to 64, and 65 to 69 years. This probably reflects a slow increase in ALE relative to that in LE, except for the cohort aged 70 years and above, whose LE appeared lower than the other age groups. One possible explanation for the lower proportion of ALE to LE in younger–old men in 2011 could be a cohort effect reflecting the malnutrition and famine-related diseases experienced during the Great Famine 1959-1961, particularly for those who were in early childhood at the time (Chen & Zhou, 2007). In general, men had higher proportions of HLE/LE than women, although both the absolute total of LE and HLE were higher among women. This gender difference is consistent with findings from previous studies (Crimmins & Saito, 2001; Liu et al., 2009).
It should be noted that our analyses had several limitations. First, CHARLS is based on a community sample, and hence did not include older persons in poor health living in an institution. However, given the low institutionalization rate of approximately 1.5% at the time (Chu & Chi, 2008), the community sample should nonetheless represent the vast majority of the older population.
Second, change in ALE over the past decade was analyzed using ADL data from CHARLS and CHNS. While the two surveys have similar methodology including wordings for questions on ADL and sampling procedures, CHNS covered only nine provinces, although these provinces do reflect a range of economic and demographic circumstances. The observed change in ALE between 2000 and 2011 should therefore be interpreted with caution. Future waves of CHARLS will allow more definitive analyses of change over time identifying period and cohort effects as well as aging effects.
Third, we used life tables from WHO to calculate age- and sex-specific health expectancies that could not be disaggregated in terms of other potentially significant influences such as district and socio-economic development that could have implications for health status. Later waves of CHARLS should enable further stratification to calculate health expectancies variations in terms of areas, education level, and other socio-economic factors.
Fourth, there is the complexity of measurement. Our SIFLE measure used severe impairments (physical disability; brain damage/mental retardation; severe vision, hearing, or speech problems) while DFLEs found in other studies used different definitions of disability. For example, Mathers et al. (2000) estimated Disability-Adjusted Life Expectancy (DALE) for 191 countries using severity-weighted disability prevalence developed for the nonfatal component of disease and injury burden. Liu et al. (2009) used disability as diagnosed by clinicians in China, which measures the abnormality body function and structure (which is “impairment” essentially), including visual, hearing and speech, physical, intellectual, and mental disabilities. The prevalence of self-reported disability in CHARLS is slightly higher than the diagnosed disability used by Liu et al. (2009).
Disability is defined in a number of ways depending on the type and purpose of the data collection (e.g., population surveys and eligibility assessment for disability-related support services or payments) with potentially varying implication on policy and resources planning. The WHO International Classification of Functioning, Disability and Health (ICF; WHO, 2010) defines functioning and disability as multidimensional concepts, relating to the body functions and structures of people; the activities people do and the life areas in which they participate; and the factors in their environment which affect these experiences. The definition of disability in CHARLS therefore corresponds to the first component of WHO ICF. We used the term severe impairment to avoid confusion with the definition of “disability.” Last, the use of respondent reports of physician diagnosis of chronic illnesses may have resulted in underestimations. Particularly for older people living in rural areas, access to health professionals is limited and awareness of diagnosis is low (Chatterji et al., 2008). The use of self-reported general health, however, risks central tendency bias. Our sensitivity analysis suggested that a different arrangement of scale items has a considerable impact on response style, that is, Scale A produced significantly higher GPHLEs than Scale B (see supplementary table for details). Although all between-scale differences in the resultant GPHLE were within 1 year, further work is needed in understanding the effect of response style (e.g., whether older Chinese tend to have milder view of their health with increasing age) before we can apply our GPHLE findings, for example, as an indicator commonly correlated with objective health and mortality (Idler & Benyamini, 1997).
This study had several strengths. Healthy and active aging are concepts that take into account being active, feeling well, having a positive outlook, maintaining independence, as well as an absence of disease or functional limitations (Kendig et al., 2014). The measures of health expectancies used in this study are in line with components of healthy and active aging, such as perceived health (in line with feeling well), activity limitations (with maintaining independence), chronic diseases, and disabling impairments (with an absence of disease or functional limitations). With these multiple health expectancy measures, more discerning knowledge can be developed for understanding healthy and active aging in China, providing a comprehensive evidence base for progressing health and social care policy for this aging population.
The current study is one of a few investigations in China that have data allowing calculation of age-specific health expectancies in the older population (Popkin et al., 2010; Yi, Danan, & Land, 2004). Most previous studies limited their scope either in provincial-level data (Yu et al., 1998), specific factors or conditions (Wen & Gu, 2012), or the oldest-olds (Yi et al., 2004). As a nationally representative sample, more than 80% of participants in CHARLS were from rural China; health outcomes for these older persons is not readily captured in existing health data systems, for example, disease surveillance systems and registries.
The core strength of CHARLS is that it is a longitudinal study designed with an explicit objective to model on established aging cohorts such as the Health and Retirement Study (HRS) in the United States (Juster & Suzman, 1995), the English Longitudinal Survey of Aging (ELSA; Netuveli, Wiggins, Hildon, Montgomery, & Blane, 2006), and the Survey of Health And Retirement Economics (SHARE) in Europe (Börsch-Supan et al., 2008). This provides unique opportunities for comparing aging in China over time and with other countries. By collecting information on functioning and health status as well as illnesses, these aging cohorts were designed to move our understanding of health in the older population from a disease and disability model toward a functional well-being model.
Conclusion
China is known to be getting old before getting rich. Whether its health care, social care, and economic systems are sustainable will depend greatly on the health status of the older population. Since the national health system reform began in 2009, China is making progress in universal coverage of basic health care (Ho & Gostin, 2009). Information on health expectancy indicators should be considered in formulating sustainable public health plans targeting its elderly population. Countries facing rapid population aging such as Japan are rationalizing their aging health care and insurance policies and investing in health promoting policies to prepare for this population health challenge (Takasaki, Kawachi, & Brunner, 2012).
In addition to indicating the scale and dimensions of the health challenges of population aging in China, our initial findings suggested particular subpopulations for targeting health actions and investments. A notable example is the relatively younger older men for whom ALE is not increasing as fast as total life expectancy in contrast with older women. This finding has implications for maintaining independence and productivity, and alerts policymakers to the potential for public health and social policy reform geared toward preventive health and health promotion. Future waves of CHARLS will provide more definitive information monitoring China’s progress on compression of morbidity, promotion of healthy aging, and possible explanations for health and capacity changes as people grow older. The research reported here can be further developed to explain determinants and consequences of changing health capacities.
Footnotes
Declaration of Conflicting Interests
The authors declared no potential conflicts of interest with respect to the research, authorship, and/or publication of this article.
Funding
The authors received no financial support for the research, authorship, and/or publication of this article.