




Abstract
Introduction
The male–female health survival paradox refers to the phenomenon of females living longer than males but spending more years with disability or ill health (Case & Paxson, 2005). Its proposed explanations include gender differences in biological risks, socio-behavioral risks, illness behavior, health reporting behavior, physicians’ diagnostic patterns, and health care access, treatment, and use (Balard, Beluche, Romieu, Willcox, & Robine, 2011; Case & Paxson, 2005; Preston, 1976; Verbrugge, 1985; Waldron, 1985).
Estimating the gender gap in health expectancy is an optimal approach for documenting the paradox. Health expectancy refers to “the entire class of indicators expressed in terms of life expectancy in a given state of health” (Mathers, Robine, & Wilkins, 1994). Calculating health expectancy allows decomposition of total remaining years of life at any particular age into those lived in a state of good health (~healthy life expectancy) and those lived in one or more states of ill health (~unhealthy life expectancy). The presence of the male–female health survival paradox is conclusively established at any particular age when (a) life expectancy is higher for females versus males, (b) absolute healthy life expectancy (in years) is lower for females versus males, (c) absolute unhealthy life expectancy (in years) is higher for females versus males, and (d) relative unhealthy life expectancy (proportion of unhealthy life expectancy to life expectancy) is higher for females versus males. A recent review, analyzing inequalities in health expectancy in older populations, says that all 95 included studies support the male–female health survival paradox (Pongiglione, De Stavola, & Ploubidis, 2015). However, it also points out that only two of the studies (Cai & Lubitz, 2007; Tareque, Begum, & Saito, 2013) observe the presence of all four criteria defining the paradox, with the rest finding no evidence of criterion (b). Thus, presence of the male–female health survival paradox has only been partially, but not completely, established in studies utilizing health expectancy; there is overwhelming support for females, versus males, having higher life expectancy, and higher absolute and relative unhealthy life expectancy, but little support for them having lower absolute healthy life expectancy. In fact, most studies suggest the contrary, with females having higher absolute healthy life expectancy.
While several indicators have been used for calculating health expectancy, the most widely used is the absence or presence of activity limitations, in terms of limitations in activities of daily living (ADLs) and/or instrumental activities of daily living (IADLs; Pongiglione et al., 2015). ADLs are self-care activities, such as eating, dressing, and bathing. IADLs are more complex activities, requiring a higher level of personal autonomy and capacity to make decisions as well as a greater interaction with the environment (World Health Organization [WHO], 2001), allowing one to live independently and function socially. These include (but are not limited to) preparing meals, taking care of financial matters, doing housework, and taking public transport. When using ADLs and/or IADLs, the terms active life expectancy (ALE) and inactive life expectancy (IALE) are commonly used to denote healthy and unhealthy life expectancy, respectively (Saito, Robine, & Crimmins, 2014). While often only ADLs are considered, there is increasing use of additionally considering IADLs (Pongiglione et al., 2015). As a person is likely to lose the ability to perform complex activities before self-care activities, consideration of IADLs is likely to be more sensitive in detecting earlier, less severe loss of function.
Reporting of the male–female health survival paradox based on activity limitations, when IADL limitations are included for defining inactivity, merits greater scrutiny. This is because self-reporting of limitations in some of the usually considered IADLs is influenced by gender roles, which may in turn affect the presence and magnitude of the gender gap in IALE and ALE, and the paradox. While activities such as using the phone and managing money are reported to be gender neutral, those such as cooking and housekeeping are female oriented (Dawson, Hendershot, & Fulton, 1987). Lawton, recognizing this, suggested excluding activities of cooking and housekeeping when assessing males (Lawton, 1971). However, doing so would result in a lower prevalence of inactivity in males by design as it fails to assess if males would need help or be unable to do these activities if needed. Thus, it is suggested that all IADLs be asked for both males and females, simultaneously ascertain whether difficulty in/non-performance of specific IADLs results from health-related reasons or not, and demarcate only health-related difficulty in non-performance of the activity as a “limitation.” However, this demarcation will again result in males reporting a lower prevalence of inactivity as they will be more likely than females to report non-performance of some female-oriented activities due to non-health-related reasons (Allen, Mor, Raveis, & Houts, 1993). Therefore, when IADL limitations are considered for defining inactivity, it is quite likely that there is a variation in the gender gap in IALE and ALE just based on the way limitations in IADLs are determined. It is thus of interest to see if the current literature provides empirical evidence to support this conjecture.
Similar to the review mentioned above (Pongiglione et al., 2015), the extant literature on IALE and ALE, using ADLs and/or IADLs to define inactivity, provides only partial evidence for the male–female health survival paradox. While life expectancy and absolute and relative IALE are mostly higher for females, absolute ALE is also higher for females relative to males (Table 1; Andrade, Guevara, Lebrão, de Oliveira Duarte, & Santos, 2011; Branch et al., 1991; Camargos, Machado, & Do Nascimento Rodrigues, 2007; Cambois, Clavel, Romieu, & Robine, 2008; Chan, Zimmer, & Saito, 2011; Cheung & Yip, 2010; Crimmins, Hayward, & Saito, 1996; Guralnik, Land, Blazer, Fillenbaum, & Branch, 1993; Hashimoto et al., 2010; Ishizaki, Kai, Kobayashi, & Imanaka, 2002; Konno, Katsumata, Arai, & Tamashiro, 2004; Minicuci & Noale, 2005; Minicuci et al., 2011; Qlalweh, Duraidi, & Brønnum-Hansen, 2012; Reyes-Beaman et al., 2005; Rose, Hennis, & Hambleton, 2008; Solé-Auró, Beltrán-Sánchez, & Crimmins, 2015; Tsuji et al., 1995; Yong, Saito, & Chan, 2011; Zimmer, 2005). Furthermore, magnitude of the gender gap (female minus male) in absolute and relative IALE and absolute ALE varies across studies, even at the same age. This variation can be the result of differences across studies in the type of activities considered for defining inactivity, namely, ADLs only or ADLs and IADLs, or in specific activities considered within ADLs and IADLs, or in the criteria used to define limitation in specific activities. However, the variation can also emanate from dissimilarity across studies in calendar time, cohort, and geographical setting. Thus, to determine the exclusive contribution of differences in the type of activities considered for defining inactivity to the variation in the magnitude of the gender gap in absolute and relative IALE and absolute ALE, one needs to look at studies that define inactivity in different ways within the same study. However, only few studies listed in Table 1, those by Hashimoto et al. (2010) and Crimmins et al. (1996), do so.
Gender Gap in Life Expectancy Estimates Using Different Indicators to Measure an Inactive Health State.
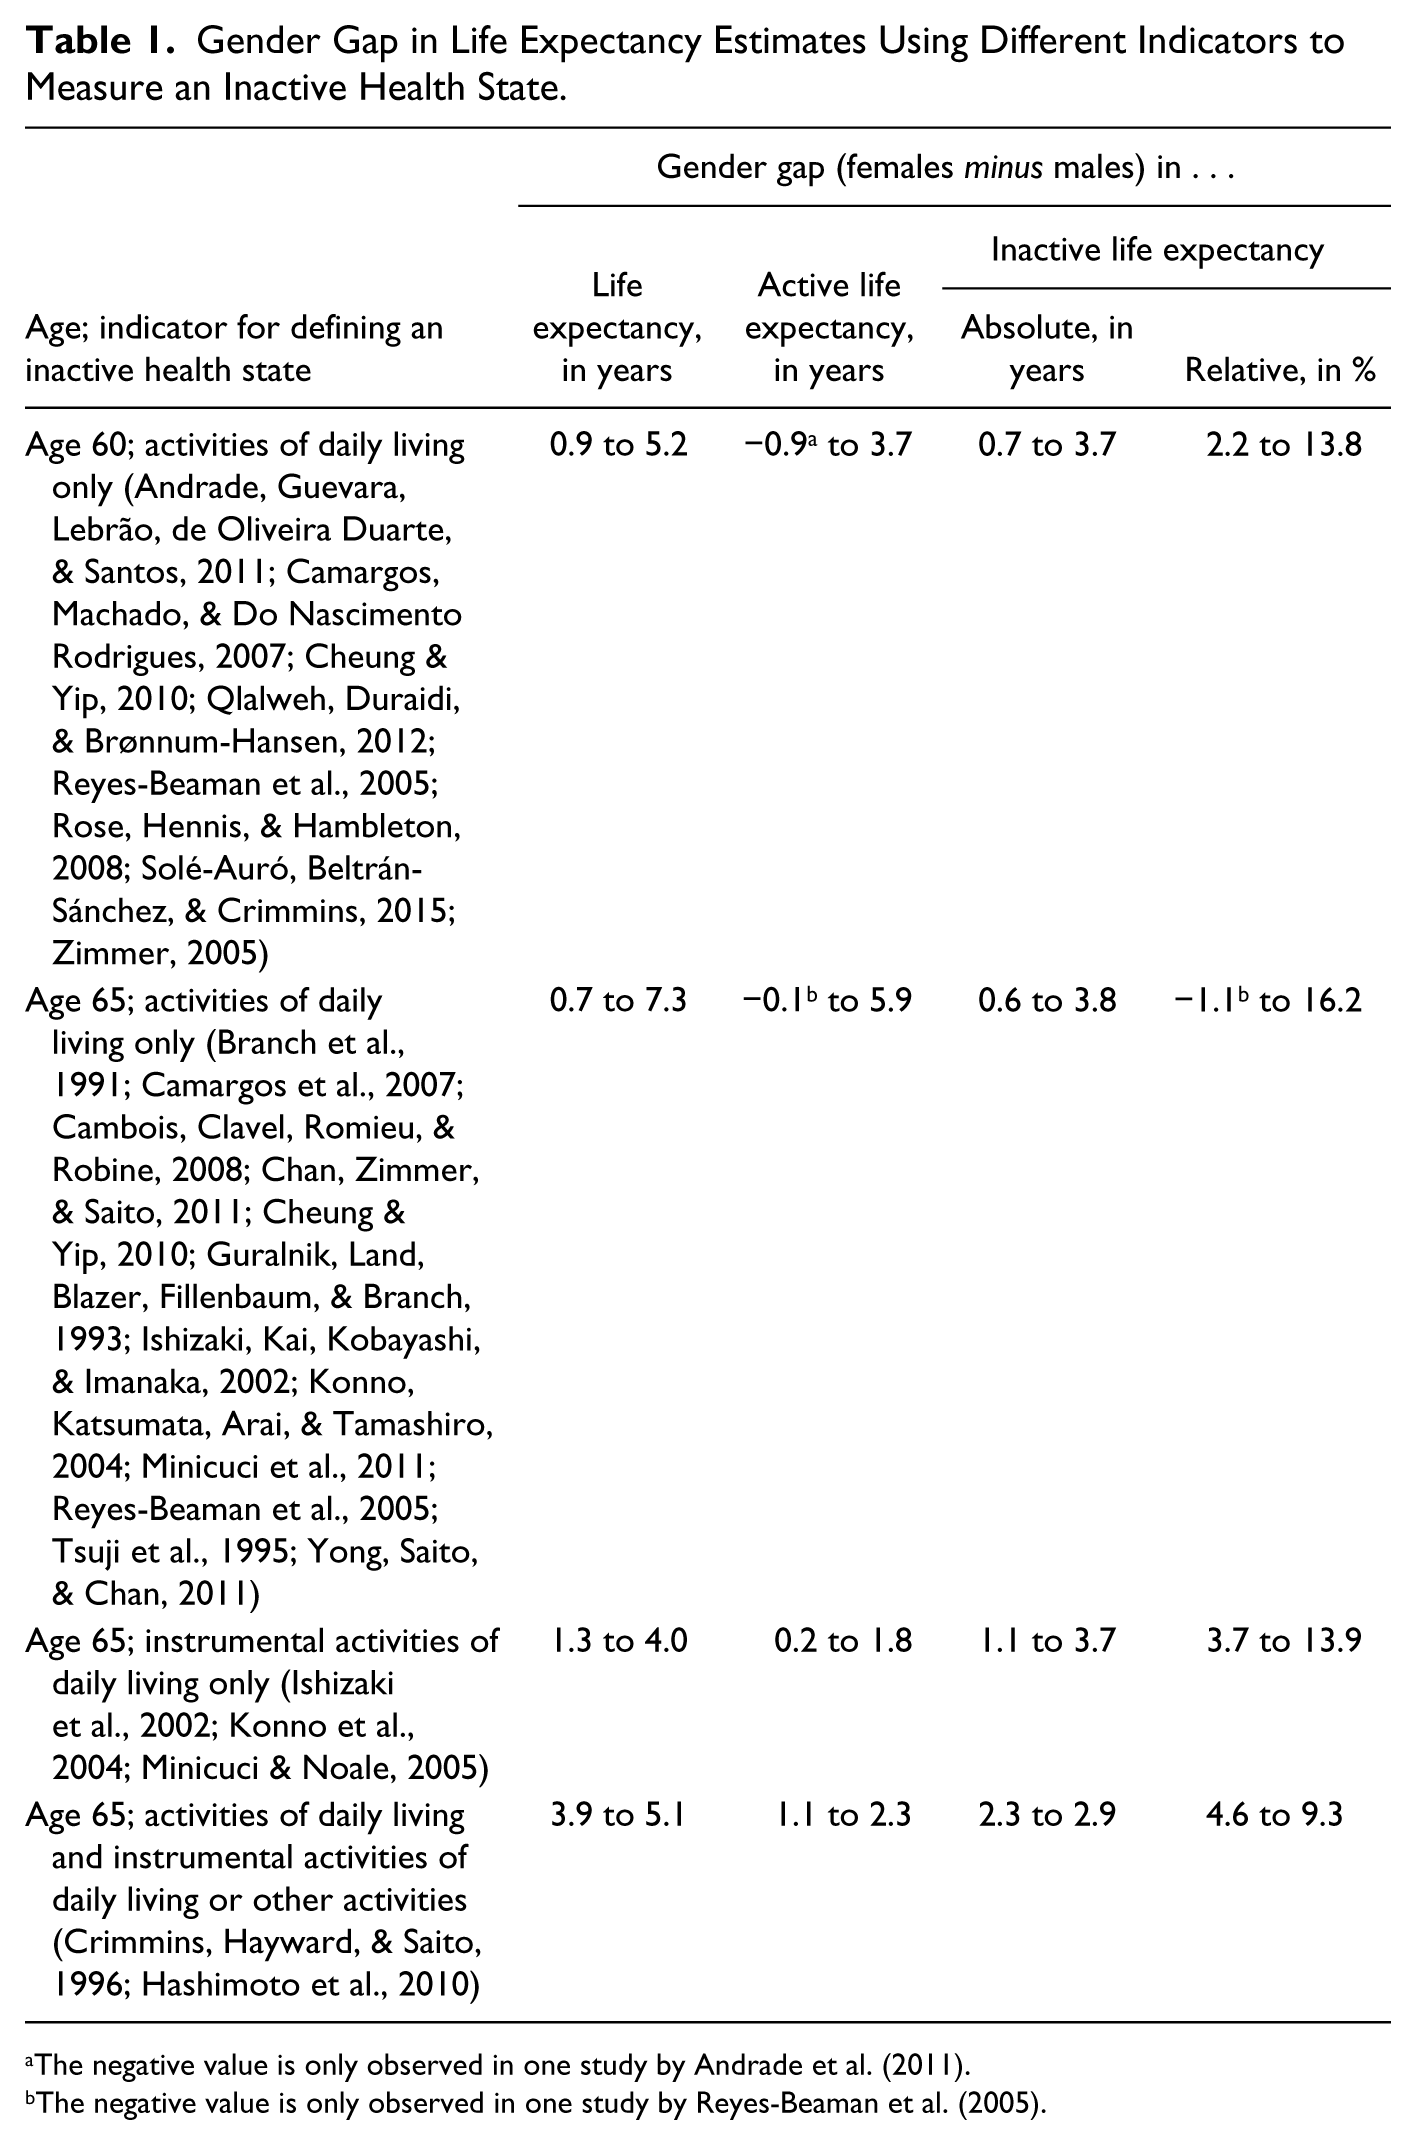
The negative value is only observed in one study by Andrade et al. (2011).
The negative value is only observed in one study by Reyes-Beaman et al. (2005).
Hashimoto et al. (2010) define an inactive state both broadly (“health-related limitation in any activity [including ADLs])”) and narrowly (“only health-related ADL limitation”). They observe that, at age 65, defining an inactive state broadly, than narrowly, results in expansion of the gender gap (female minus male) in absolute IALE (difference in gender gap between definitions: 0.8, 0.5, 0.8, and 0.6 years in 1995, 1998, 2001, and 2004) and contraction of the gender gap in absolute ALE (difference in gender gap between definitions: −0.8, −0.6, −0.7, and −0.6 years in 1995, 1998, 2001, and 2004), while the change in the gender gap in relative IALE is equivocal (difference in gender gap between definitions: 1.1, −0.5, 0.2, and −0.6 percentage points in 1995, 1998, 2001, and 2004). Crimmins et al. (1996) report similar findings. They find that defining an inactive state as “health-related inability to perform ADLs or inability, irrespective of reason, to perform IADLs” than as “health-related inability to perform ADLs” results in an increase in the gender gap in absolute IALE (difference between definitions: 0.4, 0.3, and 0.2 years at age 70, 80, and 90) and a decrease in the gender gap in absolute ALE (difference between definitions: −0.4, −0.3, and −0.2 years at age 70, 80, and 90), while the change in the gender gap in relative IALE is ambiguous (difference between definitions: 1.4, 0.2, and −2.5 percentage points at age 70, 80, and 90). Thus, these two studies, suggesting that the gender gap in absolute IALE expands and in absolute ALE contracts when inactivity includes activities beyond ADLs, are informative. However, they have their limitations as they do not specifically and comprehensively address the impact of including IADLs in the definition of inactivity on the gender gap. Hashimoto et al. (2010) do not restrict activities over and above ADLs to only IADLs, and do not consider a scenario where non-health-related difficulty or non-performance of activities is considered a limitation. While Crimmins et al. (1996) do restrict activities beyond ADLs to only IADLs, they do not consider a scenario where only health-related difficulty or non-performance of IADLs is considered a limitation. Furthermore, the results for change in the gender gap in relative IALE when inactivity includes activities beyond ADLs within the two studies are not conclusive.
The current study thus aims to contribute to the literature on the male–female health survival paradox by defining inactivity, within the same dataset, in three ways or scenarios. Each scenario differs either in the type of activities considered or in the criteria used to define limitation in specific IADLs. And, we compare the magnitude of the gender gap in life expectancy, absolute and relative IALE, and absolute ALE, all criteria for the male–female health survival paradox, across the scenarios. Scenario 1 defines inactivity as “health-related difficulty in ADLs.” Scenario 2 defines inactivity as “health-related difficulty in ADLs or IADLs.” And, Scenario 3 defines inactivity as “health-related difficulty in ADLs or IADLs or non-health-related non-performance of IADLs.” Based on the review mentioned above (Pongiglione et al., 2015) and previous studies (see Table 1) using ADLs and/or IADLs for calculating ALE and IALE, we hypothesize life expectancy, absolute and relative IALE, and absolute ALE, all at age 60, to be higher for females versus males in all three scenarios (Hypothesis 1). In other words, we hypothesize partial support (with the criterion of lower absolute ALE for females vs. males not met) for the male–female health survival paradox in all three scenarios. While Scenario 2 also considers IADLs, those not performing IADLs for non-health reasons are considered not having IADL limitations. As outlined earlier, this scenario, by design, will result in males having a lower prevalence of inactivity than females, as males are more likely to report that they do not perform some of the female-oriented activities due to non-health-related reasons (Allen et al., 1993). Thus, we hypothesize the gender gap (females minus males) in absolute and relative IALE at age 60 to expand and in absolute ALE at age 60 to contract in Scenario 2 versus Scenario 1 (Hypothesis 2). In Scenario 3, difficulty in or non-performance of IADLs due to any reason, health-related or not, is considered as a limitation. This will likely reduce the gender difference, which favored males, in prevalence of inactivity resulting from the restricted (to health-related reasons) definition of IADL limitations in Scenario 2. Thus, we hypothesize the gender gap in absolute and relative IALE at age 60 to contract and in absolute ALE at age 60 to expand in Scenario 3 compared with Scenario 2 (Hypothesis 3).
Materials and Methods
Data Source
Data from the first two waves of the Panel on Health and Ageing of Singaporean Elderly (PHASE), a national longitudinal health survey of community-dwelling older (aged 60 years and above at Wave 1) Singaporeans, were used. At Wave 1, conducted in 2009, 4,990 older adults or their proxy respondents were interviewed face to face after informed consent (details available in Malhotra, Chan, Malhotra, and Østbye, 2010). At Wave 2, in 2011-2012, a total of 3,103 older adults or their proxy respondents were re-interviewed.
Analysis Sample
Of the 4,990 Wave 1 participants, 16 with missing information on education were excluded. Furthermore, a total of 1,597 individuals (comprising 1,137 who were alive but refused participation in Wave 2, 459 who were uncontactable in Wave 2, and 1 who was interviewed but had missing information on ADLs in Wave 2) were excluded, given the lack of data on their health state at Wave 2. Thus, the analysis was limited to 3,377 individuals who were either alive and had information on their health state through the Wave 2 interview (n = 3,096) or reported as dead by their family at Wave 2 (n = 281). There was no significant difference by age, gender, ethnicity, education, and health state at Wave 1 between those included and excluded from the analysis.
Measures
At each wave, participants reported on the difficulty in performing each of six ADLs (take a bath/shower; dress up; eat; stand up from and sit down on a bed/chair; walk in the house; use the sitting toilet) and seven IADLs (prepare own meals; leave home to purchase necessary items or medication; take care of financial matters; use the telephone; dusting, clean-up, and other light housework; take public transport to leave home; take medication) alone, without assistance of a person or assistive device, due to their health or physical state. Response options for each activity were “Difficult” and “Not difficult.” IADLs had an additional response option: “Do not perform activity due to a non-health/physical reason.”
As mentioned above, three scenarios for defining inactivity were developed. Scenario 1 considered “health-related difficulty in ADLs” as inactivity; those responding “Difficult” for any of the ADLs were considered in an inactive health state and those responding “Not difficult” for all ADLs in an active health state. In Scenario 2, inactivity was defined as “health-related difficulty in ADLs or IADLs”; those responding “Difficult” for any of the ADLs or IADLs were considered in an inactive health state and those responding “Not difficult” for all ADLs and “Not difficult” or “Do not perform activity due to a non-health/physical reason” for all IADLs in an active health state. Finally, Scenario 3 considered “health-related difficulty in ADLs or IADLs or non-health-related non-performance of IADLs” as inactivity; those responding “Difficult” for any of the ADLs or “Difficult” or “Do not perform activity due to a non-health/physical reason” for any of the IADLs were considered in an inactive health state, and those responding “Not difficult” for all ADLs and IADLs in an active health state.
In Wave 2, participants could be in an absorbing health state, death. Calculation of IALE requires information on date of death, which was obtained through data linkage with the National Registry of Births and Deaths databases. Information (national identification number, name, date of birth, and gender) self-reported by respondent/proxy in Wave 1 was used for data linkage. For the majority (86.5%) of the 281 participants who were dead when contacted at Wave 2, date of death was available in the deaths databases and used. For those (2.8%) not listed in the deaths databases, next-of-kin reported date of death was utilized. For the rest (10.7%), not listed in the deaths databases or whose date of death was unavailable, it was assigned as the midpoint between Wave 1 interview and Wave 2 contact dates. Inability to locate some in the deaths databases likely resulted from missing/misspelt values on variables used for data linkage, as these were based on self-report.
Statistical Analysis
The analytical model consisted of two living health states (active and inactive) and one absorbing health state (death). There were six possible health transitions: staying in the same health state (active to active and inactive to inactive), worsening health (active to inactive), improving health (inactive to active), and mortality (active to dead and inactive to dead). For each scenario, the Interpolated Markov Chain (IMaCh) software program was used in constructing population-based multistate life tables for assessing ALE and IALE (Brouard & Lièvre, 2002; Lièvre, Brouard, & Heathcote, 2003). First, IMaCh estimated parameters of covariates (gender and age) for transition probabilities between health states in the two waves based on a multinomial logistic regression model and maximum-likelihood method. Then, based on the age-specific transition probabilities computed from the estimated parameters, multistate life tables were constructed to obtain ALE and IALE estimates for males and females. All analyses were weighted by Wave 1 survey weights. The longitudinal survey and matching with the deaths databases were approved by the National University of Singapore Institutional Review Board.
Results
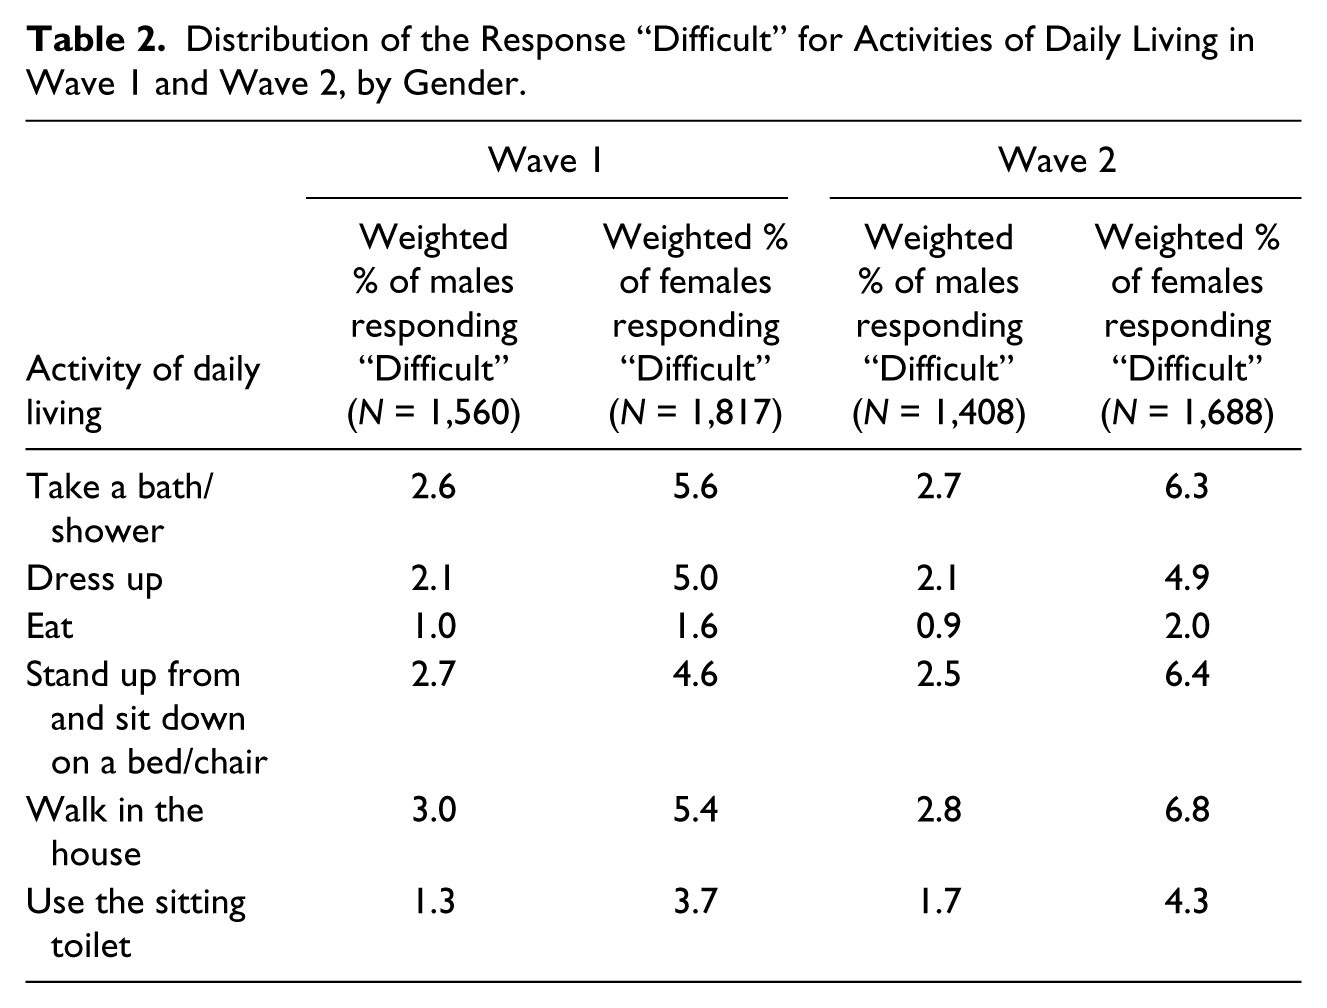
The distribution of the responses to each ADL and IADL item in Waves 1 and 2, by gender, is presented in Tables 2 and 3.
Distribution of the Response “Difficult” for Activities of Daily Living in Wave 1 and Wave 2, by Gender.
Distribution of Responses to Instrumental Activities of Daily Living in Wave 1 and Wave 2, by Gender.
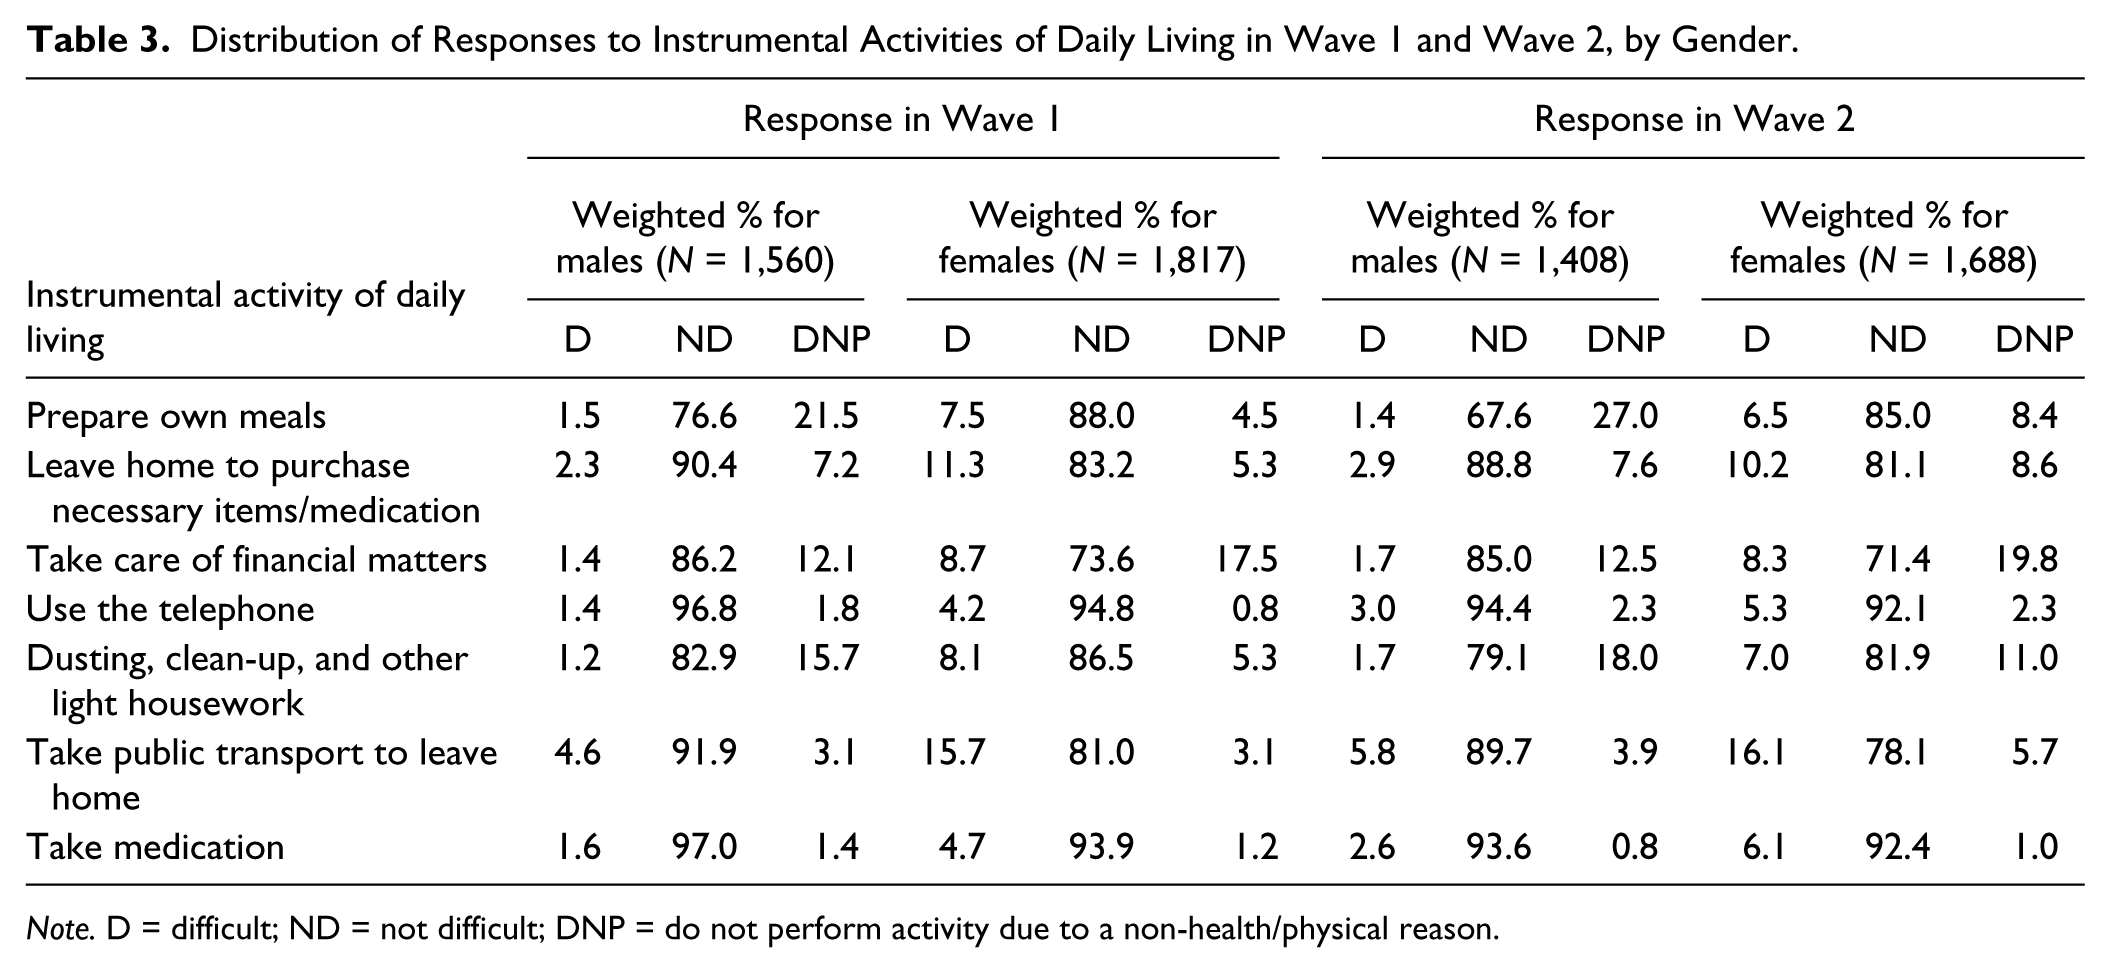
Note. D = difficult; ND = not difficult; DNP = do not perform activity due to a non-health/physical reason.
The number and proportion of males and females transitioning across or remaining in the same health states from Wave 1 to Wave 2, for each scenario, are presented in Table 4. While the proportion inactive at Wave 1 was higher for females versus males for Scenarios 1 (7.6% vs. 4.5%) and 2 (18.5% vs. 7.2%), the gender difference in this proportion was negligible in Scenario 3 (30.9% vs. 31.0%). The proportion experiencing worsening health (active to inactive) over time was higher among females versus males for Scenarios 1 (5.4% vs. 2.0%) and 2 (12.5% vs. 5.2%); however, it was higher among males versus females (29.0% vs. 23.6%) for Scenario 3. The proportion experiencing improving health (inactive to active) over time was higher among males versus females for Scenarios 1 (29.7% vs. 21.8%) and 3 (43.8% vs. 32.4%), but it was similar for females (24.3%) and males (24.0%) for Scenario 2. In all scenarios, the proportion dead at Wave 2 was higher among males versus females both among those active and those inactive at Wave 1.
Health State Transitions From Wave 1 to Wave 2, by Gender, in Each of the Three Scenarios.
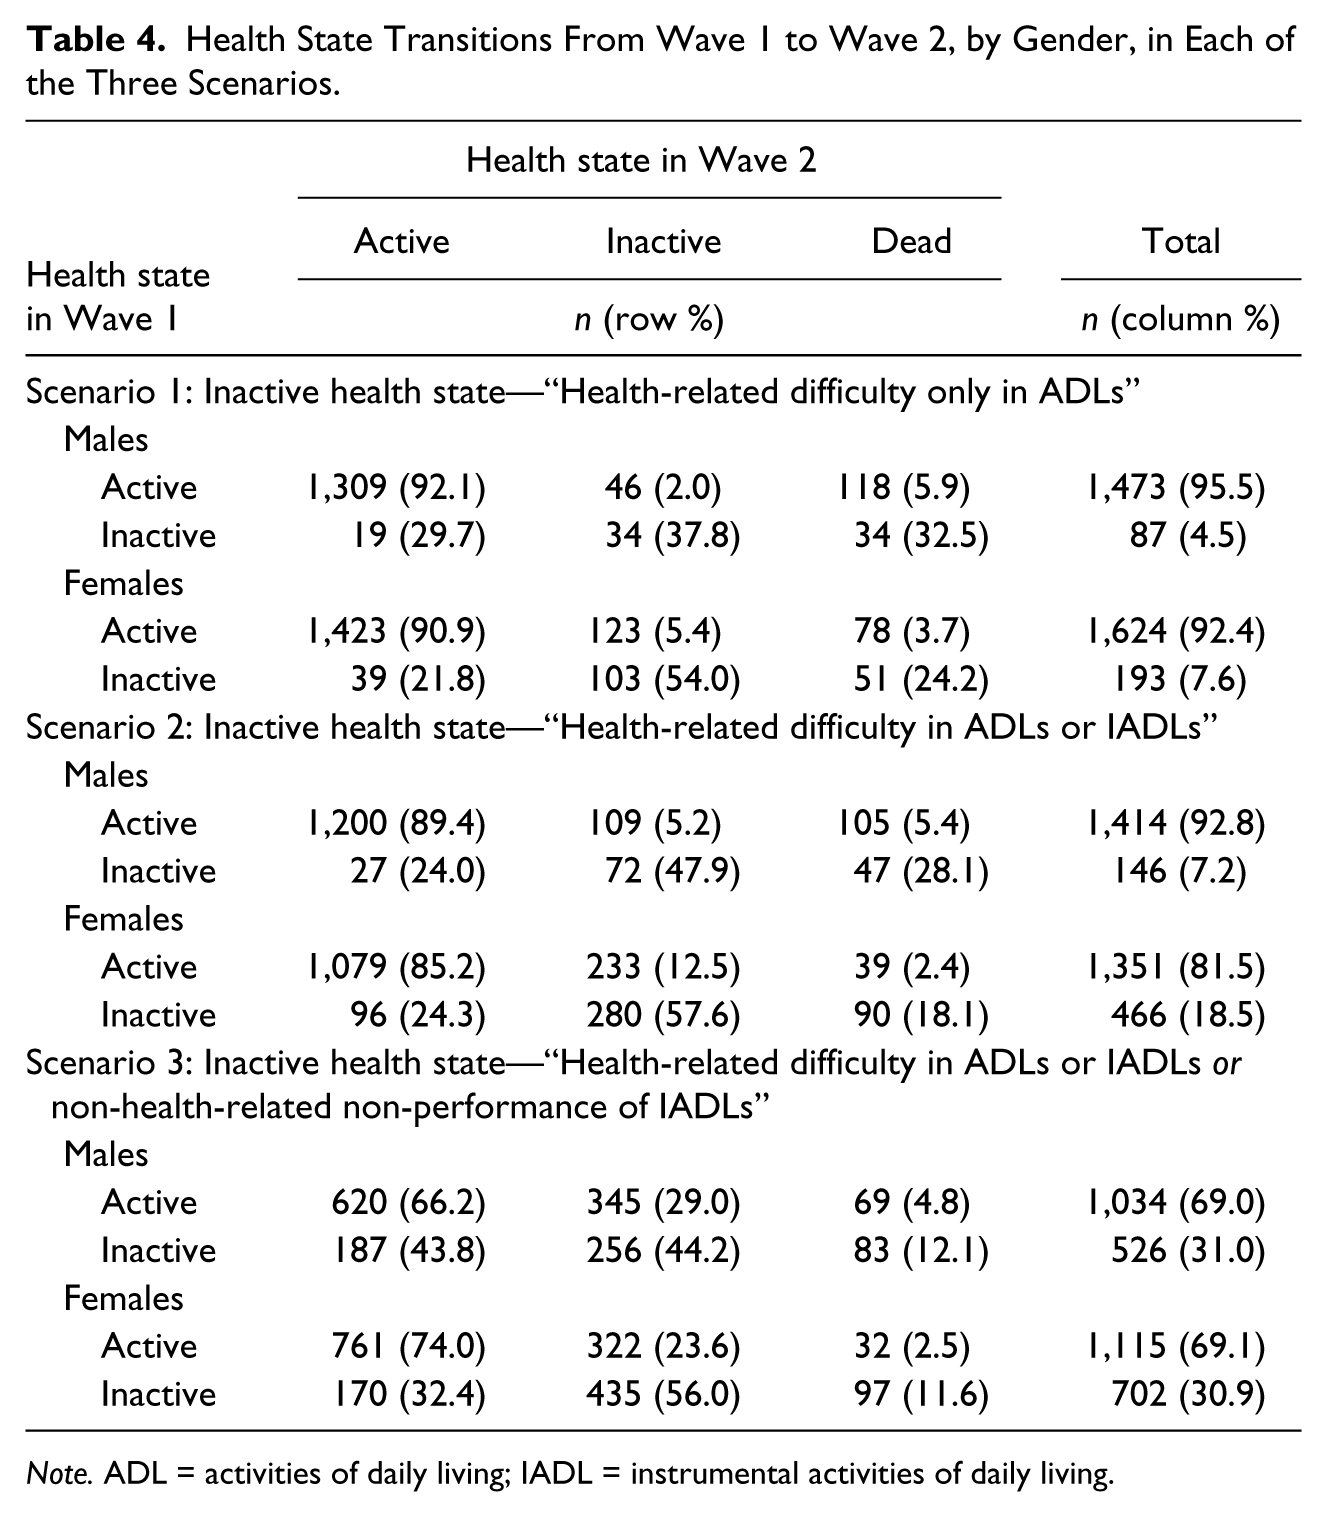
Note. ADL = activities of daily living; IADL = instrumental activities of daily living.
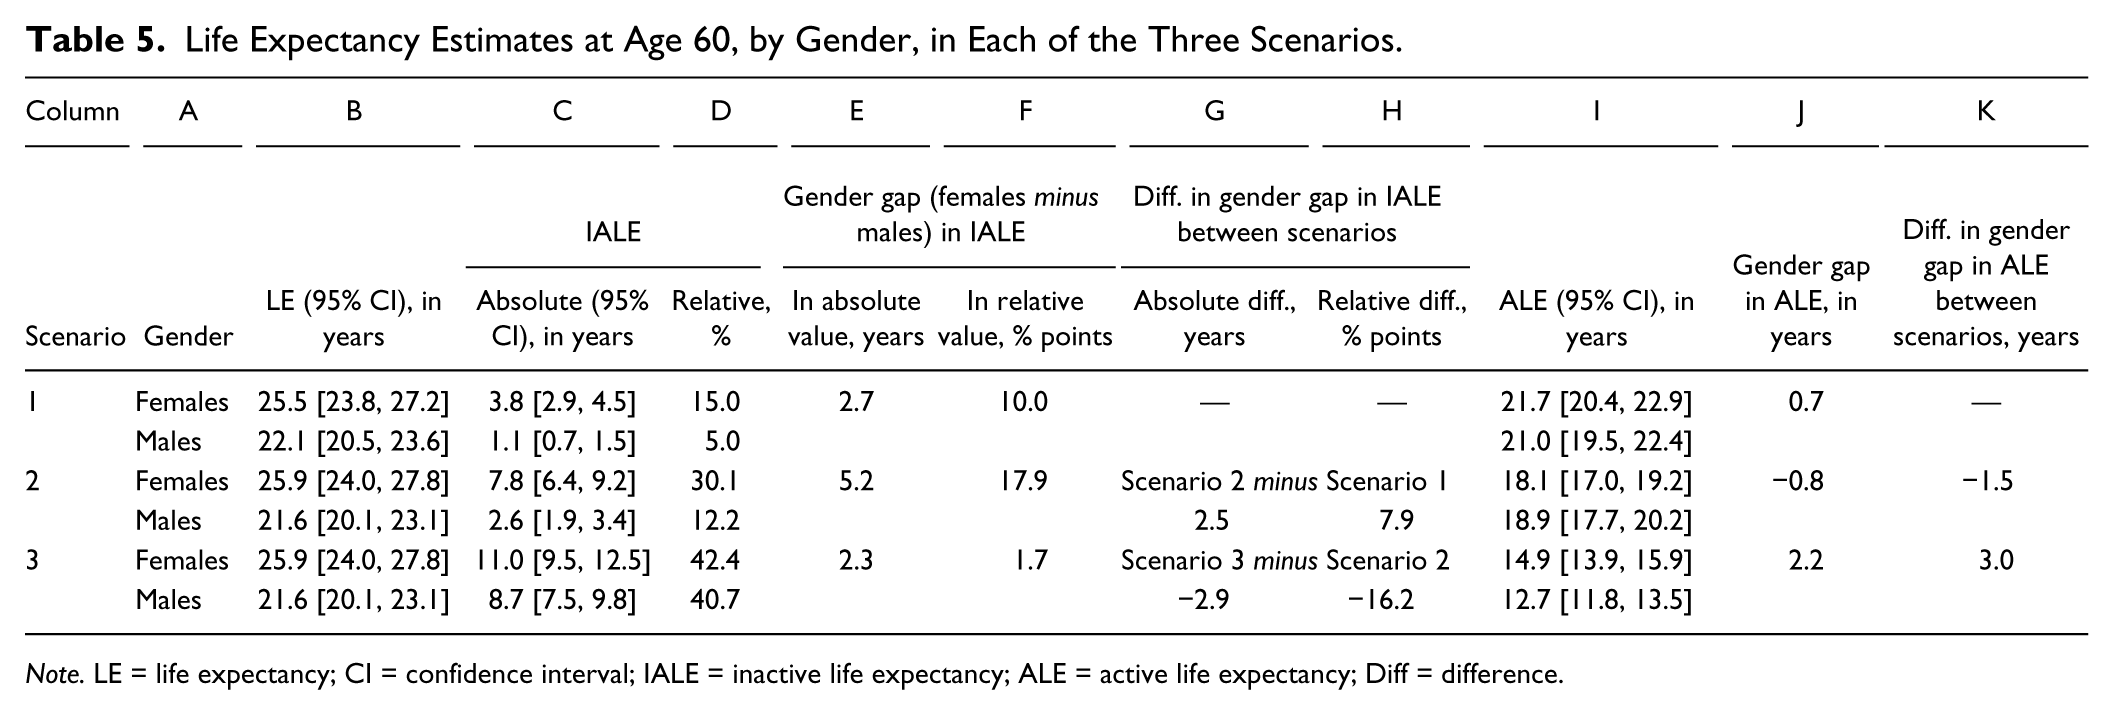
Various gender-specific life expectancy estimates for each scenario are presented in Table 5. Scenarios 1 and 3 were in line with Hypothesis 1; they provided partial support for the male–female health survival paradox, with criterion of lower absolute ALE for females not met. However, Scenario 2, in which point estimates of life expectancy (Column B) and absolute and relative IALE (Columns C and D) were higher and those of absolute ALE (Column I) were lower among females versus males provided conclusive support for the male–female health survival paradox, refuting Hypothesis 1. It may be noted that the gender gap in absolute IALE (Column F) was statistically significant only for Scenarios 1 and 2, and that in absolute ALE (Column J) was statistically significant only for Scenario 3, indicated by non-overlapping confidence intervals.
Life Expectancy Estimates at Age 60, by Gender, in Each of the Three Scenarios.
Note. LE = life expectancy; CI = confidence interval; IALE = inactive life expectancy; ALE = active life expectancy; Diff = difference.
Comparison, across the scenarios, of the magnitude of gender gap in IALE (Columns G and H) and ALE (Column K) supported our a priori hypotheses. The gender gap in absolute and relative IALE expanded by 2.5 years and 7.9 percentage points, respectively and in absolute ALE contracted by 1.5 years in Scenario 2 compared with Scenario 1 (Hypothesis 2). And, the gender gap in absolute and relative IALE decreased by 2.9 years and 16.2 percentage points, respectively, and in absolute ALE, it increased by 3.0 years in Scenario 3 compared with Scenario 2 (Hypothesis 3). It was interesting to note that Scenario 3 had the lowest magnitude of gender gap (with a female disadvantage) in absolute and relative IALE and the highest magnitude of gender gap (with a female advantage) in absolute ALE.
Discussion
The current study is, to our knowledge, the first to comprehensively assess the impact of including IADL limitations over and above ADL limitations in defining inactivity on the magnitude of the gender gap in absolute and relative IALE and relative ALE, all criterion used for establishing the male–female health survival paradox. This is a significant issue to address as the policy and research importance placed on addressing the gender gap in health expectancy and/or the paradox may very well vary by the observed magnitude of the gender gap.
We conclusively observed the male–female health survival paradox only when health-related difficulty in both ADLs and IADLs (Scenario 2) was considered as inactivity. When inactivity was defined more narrowly (health-related difficulty in ADLs; Scenario 1) or broadly (health-related difficulty in ADLs or IADLs or non-health-related non-performance of IADLs; Scenario 3), only partial support for the paradox, in line with our a priori Hypothesis 1 and the extant literature (see Table 1), was observed. Furthermore, across the scenarios the magnitude of the various criteria used to determine the paradox varied; the difference across scenarios in the magnitude of gender gap was as much as 3 years for absolute IALE and absolute ALE, and 16 percentage points for relative IALE; the variation confirming our a priori Hypotheses 2 and 3.
It was not surprising that both for females and for males, the proportion inactive at Wave 1 and values of absolute and relative IALE increased, and those of absolute ALE decreased when health-related difficulty in both ADLs and IADLs (Scenario 2) were considered for defining inactivity than health-related difficulty in only ADLs (Scenario 1). IADLs are more complex than ADLs, requiring higher level of personal autonomy; thus, a person is likely to lose ability to perform complex activities due to health reasons before losing ability to perform self-care activities (WHO, 2001). What was more interesting was that when moving from Scenario 1 to Scenario 2, the increase in the proportion inactive at Wave 1 (increase for females vs. males: 10.9 vs. 2.7 percentage points), absolute IALE (increase for females vs. males: 4.0 years vs. 1.5 years), and relative IALE (increase for females vs. males: 15.1 vs. 7.2 percentage points) and the decrease in absolute ALE (decrease for females vs. males: 3.6 years vs. 2.1 years) were larger for females versus males. This resulted in the magnitude of gender gap (females minus males) in absolute and relative IALE to be higher by 2.5 years and 7.9 percentage points, and in absolute ALE to be lower by 1.5 years in Scenario 2 versus 1, supporting our a priori Hypothesis 2. We opine that the restriction, to health-related reasons, for defining limitations in IADLs in Scenario 2 is a key contributor to the amplification of the magnitude of the various components of the male–female health survival paradox, to the extent of conclusive support for the paradox. By doing so, females are put at an artificial disadvantage as they, relative to males, are more likely to engage in and subsequently report health-related difficulties in IADLs, many of which are female oriented. And, correspondingly, males, compared with females, are more likely to choose “Do not perform activity due to a non-health/physical reason” for most IADLs, as evident in Table 3.
Given lower absolute ALE and much higher absolute and relative IALE among females in Scenario 2, it is quite likely that when using the scenario’s definition for inactivity, the policy response to address the male–female health survival paradox will focus much more on females. However, one should be mindful of neglecting males in such a situation. This is because role-related inactivity is not accounted for when only health-related reasons are used for defining IADL limitations. Older males, than females, are more likely to have role-related inactivity, depending on their spouse or family members for IADLs due to non-health-related reasons. For example, Allen et al. (1993) opine that inexperience in performing IADLs such as shopping or cooking poses a substantial problem for males who lose their wives’ support through illness, death, or divorce. Another study, relating widowhood with disability, observes widowed, versus married, males to develop more IADL and mobility limitations (van Den Brink et al., 2004).
Scenario 3, with its inclusive definition of inactivity, addresses the exclusion of role-related inactivity in IADLs in Scenario 2. And, by considering both health-related difficulty and non-health-related non-performance of IADLs, it accounts for potential underreporting of health-related difficulty in IADLs. It has been suggested that some individuals who are physically incapable of performing IADLs alone may deny that the difficulty in performing the activities is health related (Allen et al., 1993). Furthermore, it is reported that for the same level of actual physical performance, males overreport their functional ability than females (Merrill, Seeman, Kasl, & Berkman, 1997; Rahman & Liu, 2000). The most inclusive definition in Scenario 3 results in the proportion inactive at Wave 1, absolute and relative IALE to be higher and absolute ALE to be lower for both females and males than in Scenario 2. Moreover, as this definition accounts for role-related inactivity as well as possible overreporting of functional ability, both of which are higher among males, increase from Scenario 2 to 3 in proportion inactive at Wave 1, absolute IALE and relative IALE is higher among males (increase of 23.8 percentage points, 6.1 years and 28.5 percentage points) than females (increase of 12.4 percentage points, 3.2 years and 12.3 percentage points). Correspondingly, decrease in absolute ALE is also higher among males (decrease of 6.2 years) than females (decrease of 3.2 years). These changes, larger for males, result in a reduction of the gender gap in absolute and relative IALE by 2.9 years and 16.2 percentage points, respectively, and a widening of the gender gap in absolute ALE in Scenario 3 versus 2, in line with our a priori Hypothesis 3.
The results thus highlight the sensitivity of the gender gap in IALE and ALE to the definition of inactivity. The most inclusive definition results in the least magnitude of the female disadvantage in IALE and the highest magnitude of female advantage in ALE. However, at the same time, it results in the highest prevalence of inactivity among males and females. Thus, policymakers should be aware that there is a trade-off between inclusivity of the definition of inactivity, the prevalence of inactivity, and the magnitude of the gender gap in IALE and ALE.
The current analysis has its limitations. While the baseline sample of the longitudinal survey utilized was large, due to limited number of transitions observed across health states by the first follow-up, conducted after a 2-year interval, we were able to construct multistate life tables based only on gender. We could not partition males and females into subcategories, such as those by ethnicity or education, to assess the gender gap within subgroups of males and females. About a third of the participants were lost to follow-up by Wave 2, which again limited the number of observed health transitions. However, those who were lost to follow-up and those who responded to Wave 2 were similar on key demographic and health features. Furthermore, our estimates for life expectancy at age 60 for both genders (males: 21.6-22.1 years across scenarios; females: 25.5-25.9 years across scenarios) were comparable with those provided in the official life tables for the Singapore resident population (males: 21.8, 22.1, and 22.2 years in 2009, 2010, and 2011, respectively; females: 25.5, 25.8, and 26.0 years in 2009, 2010, and 2011, respectively; Department of Statistics Singapore, 2013). Finally, limitations in ADLs and IADLs were based on self-report and not on observed status. However, given logistical challenges associated with recording their observed status, self-reporting of limitations in ADLs and IADLs is commonly used in large population-based surveys.
Health expectancy is becoming a standard summary measure of population health. Among other purposes, health expectancy has been used to highlight the presence of health inequalities (Robine, Jagger, & Egidi, 2000). And, recognition of and reduction in health gaps across population groups, defined by various criteria, including gender, is increasingly becoming a priority in many countries (Ministry of Health, 2002; Sen & Östlin, 2007; WHO, 2015). For example, again in Europe, in 2009, the Council of the European union adopted conclusions on “Equal opportunities for women and men: active and dignified ageing,” arguing that healthy and dignified aging must involve a gender dimension, taking into account the specific needs of both males and females (Corsi & Lodovici, 2010). Thus, gender gap in health expectancy is and will be an area of research and policy focus, especially for regions and countries with large aging populations. The current study, showcasing the sensitivity of the prevalence of inactivity and the gender gap in IALE and ALE to the measures and criterion used to define inactivity, thus serves to inform researchers and policymakers to be mindful of and delve deeper into the way inactivity is defined before prescribing recommendations for addressing these issues in their populations.
Footnotes
Authors’ Note
An earlier version of the article was presented at the “International Workshop on Health Expectancy: Harmonizing Summary Measures of Population Health” held in Tokyo, Japan in October 2014.
Declaration of Conflicting Interests
The authors declared no potential conflicts of interest with respect to the research, authorship, and/or publication of this article.
Funding
The authors disclosed receipt of the following financial support for the research, authorship, and/or publication of this article: This research is supported by the Ministry of Social and Family Development, Singapore. This research is also supported by the Singapore Ministry of Health’s National Medical Research Council under its Singapore Translational Research Investigator Award as part of the project “Establishing a Practical and Theoretical Foundation for Comprehensive and Integrated Community, Policy and Academic Efforts to Improve Dementia Care in Singapore” (NMRC-STAR-0005-2009).