



Abstract
Introduction
Falls are experienced commonly by community-dwelling older adults and represent a significant public health burden. Approximately 30% to 40% of individuals over the age of 65 years fall every year (Ambrose, Paul, & Hausdorff, 2013; Kannus, Sievanen, Palvanen, Jarvinen, & Parkkari, 2005; Lord, Sherrington, Menz, & Close, 2007), and this prevalence level reaches as high as 50% in those aged 85 years and older (Akyol, 2007). Most falls do not cause death, but 5% to 10% result in serious injuries such as head trauma, major lacerations, or fractures (Rubenstein & Josephson, 2002). Long-term effects include depression, social isolation, and disability (Tricco et al., 2013), and individually and collectively can impact the quality of life of older people (Rubenstein & Josephson, 2002).
About half of falls occurs outside home environments in locations such as streets, parks, or shops (Lord et al., 2007). Most result from a complex interaction between individual risk factors and contextual determinants. From an epidemiological perspective, the etiology of falls can be therefore conceptualized based on theory depicted in the eco-social model (Bronfenbrenner, 1979; Krieger, 2001), in which risk factors such as gait and balance problems operate at the individual level, and factors such as living environments and education operate at wider contextual levels.
With respect to individual risk factors, existing reviews and meta-analyses (Deandrea et al., 2010; National Institute for Health and Care Excellence, 2004) identified strong associations for fall injuries associated with past history of falls, gait and balance problems, vertigo, Parkinson’s disease, muscle weakness, and medication use. Musculoskeletal disorders such as osteoarthritis and osteoporosis (Lee, Kong, & Park, 2012), mobility disability (Shin, Kang, Hwang, & Jung, 2009; Yamashita, Noe, & Bailer, 2012), dementia (van Schoor, Smit, Pluijm, Jonker, & Lips, 2002), chronic pain (Stubbs et al., 2014), and visual field loss (Coleman et al., 2007) were other identified risk factors.
With respect to contextual risk factors, unsafe environmental circumstances in homes have been shown to be strong determinants of falls (Kannus et al., 2005; Lord et al., 2007). In homes, falls are experienced mainly by frail seniors, whereas falls in neighborhoods occur in people healthy enough to be able to be mobile and active (Bergland, Jarnlo, & Laake, 2003; Kelsey et al., 2010). Theoretically, social and built environmental features of neighborhoods are potential risk factors for the occurrence of falls in populations of older people (Lawton, 1998); however, conclusions from the few existing studies of the impact of neighborhood-level factors such as uneven sidewalks (Gallagher & Scott, 1997; Tinetti, Doucette, & Claus, 1995), social deprivation (Court-Brown, Aitken, Ralston, & McQueen, 2011; Syddall, Evandrou, Dennison, Cooper, & Sayer, 2012), the proportion of welfare recipients (Icks et al., 2009), and level of area wealth (J. West et al., 2004) on the occurrence of falls are inconsistent.
Social capital, generally conceptualized as the presence of strong social bonds with trust, informal social networks, and civic participation as its main aspects, is an additional potential risk factor for the occurrence of falls (Kawachi, Subramanian, & Kim, 2008). The specific impact of social capital on the occurrence of injuries has been studied in international studies (Huisman & Oldehinkel, 2009; Kripper & Sapag, 2009) as well as in Canadian workers (Vafaei & Kristman, 2013) and adolescents (Elgar, Trites, & Boyce, 2010; Vafaei, Pickett, & Alvarado, 2015) with conflicting results. But to the best of our knowledge, the specific effect of neighborhood-level social capital on the occurrence of falls in older adults has not been studied in a Canadian or international context. The mechanism by which social capital might affect the occurrence of falls also remains unclear. On one hand, higher levels of social capital encourage outdoor social interactions and make older adults more exposed to potential ill impacts of unfavorable neighborhood environments. On the other hand, older adults with higher social capital are mentally and physically healthier and maybe less prone to falling (Cagney & Wen, 2008).
There are methodological considerations surrounding examination of the effects of neighborhood-level factors on the occurrence of falls. Multilevel analyses are efficient statistical techniques that account for nested data structures and permit simultaneous analysis of the effect of both individual-level and neighborhood-level variables (Snijders & Bosker, 2012). An important step before performing such analyses is the quantification of between-cluster (neighborhood) variations (Larsen & Merlo, 2005; Merlo et al., 2006). If these variations are small, the outcome occurs mainly due to individual differences of people living within neighborhoods (Snijders & Bosker, 2012), a situation in which the performance of multilevel analyses is not justified. The traditional indicator of between-cluster variations is intraclass correlation coefficient (ICC), defined as the ratio of the between-cluster variance to the total variance. A large ICC suggests that clusters are important in the occurrence of the outcome and they should be taken into account in etiological analyses. Two other measures are available with more interpretable information for discrete outcomes (Larsen & Merlo, 2005; Merlo et al., 2006). The median odds ratio (MOR) quantifies between-clusters variations by comparing any randomly chosen two persons from two different clusters with larger MOR indicative of higher variability between clusters. The interval odds ratio (IOR) incorporates both the random effect and the strength of association between the cluster-level variable and the health outcome. A narrow IOR means that the fixed effect of the cluster-level variable is important in explaining variability in the occurrence of the outcome (Larsen & Merlo, 2005).
The main purpose of our study was to examine relationships between neighborhood-level social capital and the occurrence of falls in Canadian older adults. The specific objectives were to (a) estimate the independent influence of social capital and to identify the main risk factors for outdoor falls, (b) quantify variations in the occurrence of falls due to between-neighborhood differences, and (c) test for the possible cross-level interaction effects of socioeconomic status (SES) and gender on the relationships between neighborhood social capital and falls.
Method
Data Sources
We obtained data from the baseline questionnaire of the IMIAS (International Mobility in Aging Study) project. IMIAS is a longitudinal study of 1,995 community-dwelling men and women aged between 65 and 74 years from four countries: Canada, Brazil, Colombia, and Albania.
Baseline data were collected in 2012 with two follow-up interviews conducted in 2014 and 2016. Two Canadian cities (Kingston, Ontario; Saint-Hyacinthe, Quebec) were the Canadian research sites of IMIAS. Following the ethics requirements of Queen’s University and the University of Montreal, we recruited the potential participants indirectly by sending invitation letters to them via their family doctors. Approximately 30% of those invited to participate contacted the field coordinator and set up an in-home interview time, and of those 95% were enrolled. The final sample consisted of 799 participants (398 in Kingston; 401 in Saint-Hyacinthe) (Zunzunegui et al., 2015). At the beginning of the interview, the general cognitive levels of participants were assessed by the orientation scale of the Leganes Cognitive Test (De Yebenes et al., 2003) that includes eight questions about orientation to time and place as well as personal information. Participants with four or more errors in this scale were excluded. Only two people in Saint-Hyacinthe were excluded.
Definition of Neighborhoods
In this study, the aggregate units of analysis, neighborhoods, were defined by the administrative boundaries established by the city of Kingston and Ville de Saint-Hyacinthe. There are 45 neighborhoods in Kingston (https://www.cityofkingston.ca/) and nine neighborhoods in Saint-Hyacinthe (http://www.ville.st-hyacinthe.qc.ca/). Participants were assigned to neighborhoods according to their residential postal codes using geocoding and geographic information system (GIS) technologies (ArcGIS v.9.3 software; Environmental Systems Research Institute, Redlands, California).
Measures
The main exposure
As per precedents (Elgar et al., 2010; Takagi, Ikeda, & Kawachi, 2012; Vafaei et al., 2015), we followed a social cohesion-based perspective in the measurement of social capital. This widely adopted approach defines social capital as the quality of interpersonal relationships and levels of trust within members of a community (Berkman, Kawachi, & Glymour, 2014). Participants were asked about the potential availability of social resources in their residential neighborhoods and provided a rating for three statements using Likert-type responses, with four options: 1 = often; 2 = sometimes; 3 = never; and 4 = I do not know, which is treated as “missing” in data analyses. Statements focused on whether (a) participants could ask their neighbors for a favor, (b) neighbors watch out for each other, and (c) participants talk outside with others in the yard or on the street. The psychometric properties of these three items were good with high loadings (0.62 to 0.78; Eigenvalue = 1.59) on a single factor and an acceptable internal consistency (Cronbach’s α = .76) (Vafaei, Pickett, Zunzunegui, & Alvarado, 2016). We constructed a summary measure for social capital defined as the sum scores of each item. This composite scale was the measure of “individual” social capital. Following the standard methodology of aggregating survey responses to the group level (Harpham, 2008; Kawachi & Berkman, 2014) for constructing neighborhood levels of social capital, averages of individual scores were aggregated using “neighborhood” as the aggregate level.
The outcome
Occurrence of falls was assessed based on answers to a self-reported question: “Have you fallen during the past 12 months (yes or no)?” Subsequent questions asked about the locations of falls as well as the activities that led to their occurrence. Because the focus of this study was on the specific effects of neighborhood factors on the occurrence of falls in the neighborhoods, those who fell at homes or during sport activities were excluded.
Covariates
We conceptualized the relationship of interest based on risk factors for falls identified in past literature and possible associations with the exposure of neighborhood social capital (Figure 1). Covariates for inclusion in multivariate models were selected based on this conceptual model.
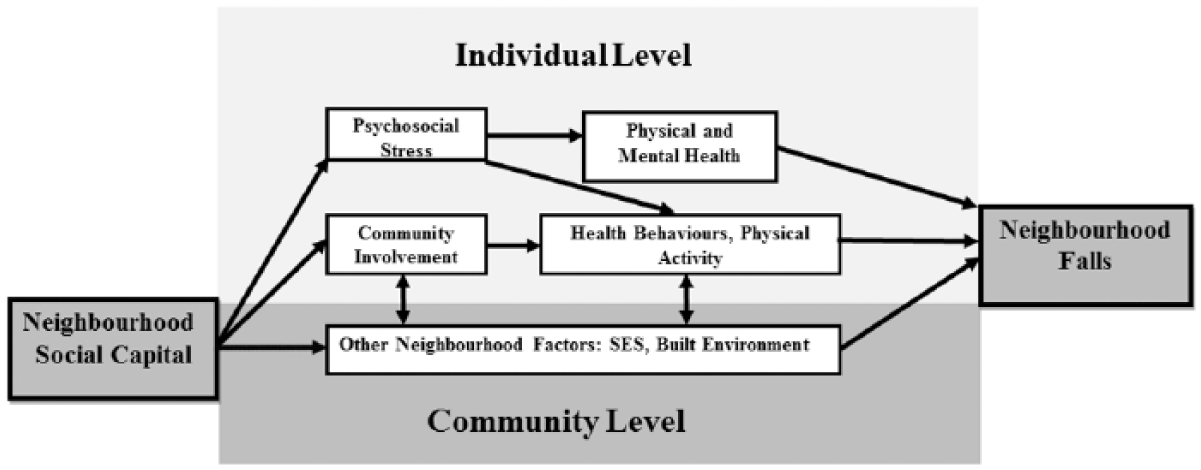
A conceptual map depicting the relationships between community social capital and neighborhood falls.
Neighborhood-level variables
SES
Based on previous Canadian studies (Pampalon & Raymond, 2000; Vafaei, Pickett, & Alvarado, 2014), the neighborhood-level of the three indicators of education, employment, and average income were obtained from 2006 Canadian census data (Statistics Canada, 2006) and an additive composite measure was constructed. The psychometric properties of this composite scale were good with high loadings (0.71 to 0.76) onto a single factor and a Cronbach’s α of .77 (Vafaei et al., 2016).
Built environment
Neighborhood-level indicators of street connectivity (intersection density, average block length, and connected node ratio) and green space were used to develop an aggregate score for neighborhood built environment (Mecredy, Janssen, & Pickett, 2012; Vafaei, Pickett, & Alvarado, 2014), all measured via GIS technology (ArcGIS v.9.3 software; ESRI, Redlands, California). This measure showed good psychometric properties (high loadings from 0.56 to 0.96 on a single factor; Eigenvalue = 2.49; Cronbach’s α of .80). The full definitions and detailed measurement of built environment indicators are described in a companion paper (Vafaei et al., 2016).
Individual-level variables
Sociodemographic factors including age, sex, years of education, individual income, and living arrangements (alone, with spouse, with spouse and others) were selected as covariates. We also studied other established risk factors for falls including health behaviors (O’Loughlin, Robitaille, Boivin, & Suissa, 1993), physical functioning (Deandrea et al., 2010), and psychological and medical factors (Health Quality Ontario, 2008).
Health behaviors
Physical activity was assessed by a series of questions asking about the time spent walking in a regular week, adapted from a validated instrument originally designed to assess mobility (Guerra et al., 2014). We dichotomized this physical activity variable into walking 30 min per day or more versus walking less than 30 min per day as per established precedents (Li et al., 2015).
We measured alcohol consumption by a self-reported question “How often do you usually drink alcohol?” Participants were classified as “never” when they never drank alcohol, “rare/moderate” when drinking frequency was equal or less than twice a week, and as “frequent” when they drank more than twice per week (Doulougou et al., 2016).
Physical functioning
Muscle strength was assessed by grip strength using a hand-held dynamometer (Jamar®). We followed the measurement protocol recommended by “The American Society of Hand Therapists”: In a sitting position with shoulders adducted and neutrally rotated, elbow flexed at 90, forearm in a neutral position, and the wrist between 0 and 30 of dorsiflexion, participants were instructed to grip the handle as hard as possible using their dominant hand. Three trials were performed, and the highest value in kilograms was used in the analyses. This test shows an excellent reliability (ICC > .90; Schrama, Stenneberg, Lucas, & van Trijffel, 2014).
The Short Physical Performance Battery (SPPB) was used for objective assessment of mobility (Guralnik et al., 2000). The SPPB includes timed tests for balance, walking, and the ability to rise from a chair. For balance, participants were asked to maintain their feet in side-by-side, semi-tandem, and tandem positions for 10 s each. A 4-m walk at usual speed was timed to assess gait and finally to evaluate the ability to rise from a chair; participants were asked to stand up and sit down 5 times as quickly as possible. We defined a final SPPB score as the sum of three tests with a range between 0 and 12 (0-4 scores for each test), with higher scores reflecting a better physical performance (Guralnik et al., 2000). SPPB scores were categorized into two groups of less than eight indicative of poor physical performance of lower extremities and equal or more than eight indicative of normal function (Freire, Guerra, Alvarado, Guralnik, & Zunzunegui, 2012).
Psychological factors
We used the Montreal Cognitive Assessment (MoCA) scale (Appels & Scherder, 2010) to evaluate the cognition status of participants. The MoCA includes the following cognitive domains: memory (immediate and delayed recall of five nouns), visuospatial abilities (clock drawing and copying a three-dimensional cube), executive functioning (alternation task, phonemic fluency, and verbal abstraction), attention (target detection, serial subtraction, and digit span forward and backward), language (confrontation naming, repetition of sentences), and orientation (time and place). The maximum score is 30, with a suggested cutoff value of 26 as indicative of cognitive impairment (Appels & Scherder, 2010).
Depression was assessed by the Center for Epidemiological Studies Depression Scale (CES-D; Radloff, 1977). This scale is comprised of 20 items related to depressive symptoms such as mood, somatic symptoms, interactions with others, and psychomotor functions and has been validated in Dutch (Beekman et al., 1997), Brazilian (Batistoni, Neri, & Cupertino, 2007), and Spanish (Ruiz-Grosso et al., 2012) groups of older adults. The frequency of each symptom in the week prior to interview are scored (0 = never or rarely, 1 = sometimes, 2 = often, and 3 = most of the time/always) and when summed provide a final score ranging between 0 and 60 points. We utilized the established cutoff point of 16 as being suggestive of depression (Radloff, 1977).
Fear of falling is a psychological outcome of falling (Jorstad, Hauer, Becker, & Lamb, 2005) as well as a risk factor for future falls (Scheffer, Schuurmans, van Dijk, van der Hooft, & de Rooij, 2008). We used the validated instrument of the Falls Efficacy Scale International (FES-I) to measure participants’ fear of falling. FES-I is validated in older adults (Delbaere et al., 2010) and has excellent internal and test–retest reliability (Cronbach’s α = .96, ICC = .96; Yardley et al., 2005). The instrument includes 16 items each with four categories from 1 = not at all concerned to 4 = very concerned with scores larger than 27 indicative of high concerns for falling (Delbaere et al., 2010).
Medical factors
Participants were asked whether a doctor or nurse had ever diagnosed them with any of these eight chronic conditions: hypertension, heart diseases, diabetes, cancer, lung diseases, stroke, arthritis, or osteoporosis. We defined multimorbidity as having two or more of these chronic conditions (Garin et al., 2016). Body mass index (BMI) was obtained by dividing the participants’ weight (kg) by the square height (m2). Using a stadiometer, height was measured without shoes, and weight was measured with a calibrated electronic scale after removing outer clothes and footwear. We divided the participants into three groups: BMI < 25 (underweight or normal weight), 25 to 29 (overweight), and BMI ≥ 30 (obese) (World Health Organization, 2000). Visual acuity was measured at 2 m using the Tumbling E chart (Taylor, 1978). Participants were allowed to use their glasses, and visual impairment was defined as presenting binocular acuity worse than 20/60 (S. K. West et al., 1997).
Analysis
Descriptive
Distributions of all variables across different social capital groups were estimated and compared using analysis of variance and χ2 tests. Crude relationships between the outcome and all other variables were examined by estimation of prevalence rate ratios (PRR) for the occurrence of falls through the construction of multilevel bivariate regression models with binomial distributions with log links, with specification of neighborhoods as random effects (Wang, Xie, Fisher, & Press, 2011).
Etiological analyses
Due to convergence challenges, we were not able to directly estimate PRR in multivariate models, and thus estimated adjusted ORs in our model via the GLIMMIX procedure in SAS (Version 9.2, Carry, North Carolina) with a logit link. Multilevel multivariate statistical analyses were performed in three steps. First, we fit an “empty” (random intercept only) model in which the occurrence of falls was modeled solely as a function of neighborhoods. The second model included only neighborhood-level variables as fixed effects. To adequately explain the variations in the occurrence of falls via the most parsimonious model, we followed the “purposeful selection of covariates” methodologies outlined by Hosmer, Lemeshow, and Sturdivant (2013). At the first step, we defined potentially important covariates as those with p values smaller than .25 in bivariate analyses with the outcome and included them all in a multivariate model. Then, we removed least significant (largest p value) variables one by one until all remaining variables were significant at the level of .05 and obtained an initial main effects model. To account for variables with true confounding effects, we added variables not selected in Step 1 and also those deleted in Step 2 one by one to this model. The variables whose inclusion resulted in more than 10% change in the odds ratio (OR) describing relations between neighborhood social capital and falls were included in the final main effect model (Kleinbaum & Klein, 2010; Rothman, Greenland, & Lash, 2008).
Then, to account for each variable’s influence on the random effects of neighborhoods, we also included variables which produced more than a 10% change in the measure of variance at the neighborhood-level (Twisk, 2006). This process resulted in several different models to choose from. To determine the best fit model, two standard ad hoc measures of goodness of fit, the Akaike information criterion and Bayesian information criterion, were calculated (Burnham & Anderson, 2013). The final model was chosen after consideration of all criteria. We concluded our analyses by examining possible cross-level interactions between neighborhood-level variables of SES, gender, and social capital.
Variations in the occurrence of falls due to between-neighborhood differences were quantified by calculating ICC, MOR, and an 80% IOR (Larsen & Merlo, 2005; Merlo et al., 2006) which contains the middle 80% of the all possible ORs comparing any set of two persons from two different neighborhoods with different neighborhood-level variables.
Results
From 799 older adults who agreed to participate, 13 were excluded because of lack of neighborhood data needed for multilevel analysis, and then 114 more were excluded because they either did not answer the fall question (n = 5) or fell at home (n = 87) or during sport activities (n = 22). This left a final sample size of 672.
The mean age of participants was 68.8 (SD = 2.7) years, and about 60% reported living in neighborhoods with medium and high levels of social capital. Almost two-thirds (73%) had at least a high school diploma, and 40% reported an income higher than CND40,000 annually (Table 1).
Characteristics of the Samples of Older Adults Living in Kingston (ON) and Saint-Hyacinthe (QC) by Levels of Neighborhood Social Capital.
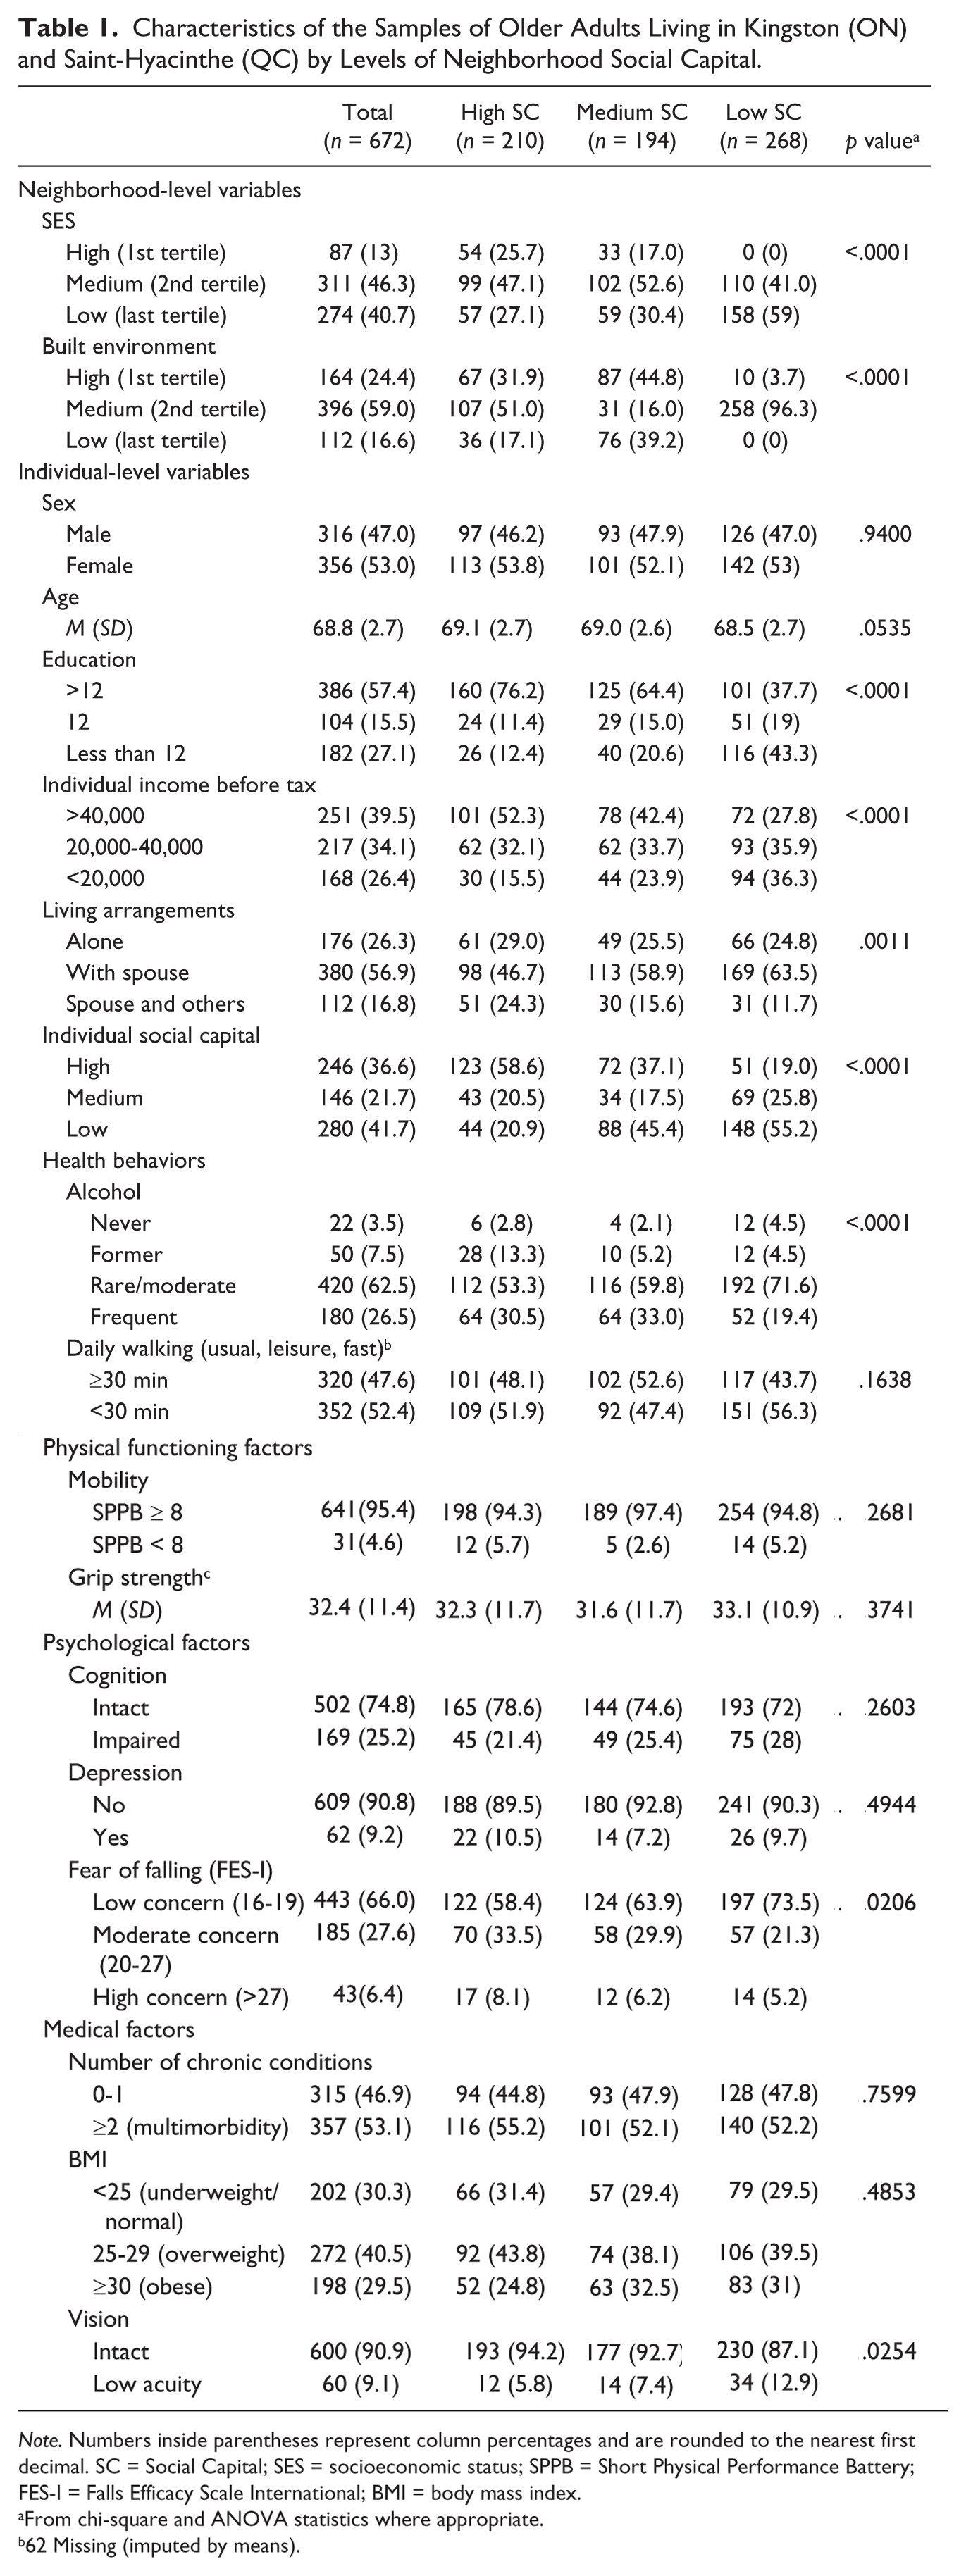
Note. Numbers inside parentheses represent column percentages and are rounded to the nearest first decimal. SC = Social Capital; SES = socioeconomic status; SPPB = Short Physical Performance Battery; FES-I = Falls Efficacy Scale International; BMI = body mass index.
From chi-square and ANOVA statistics where appropriate.
62 Missing (imputed by means).
7 Missing (imputed by means).
Seventeen percent of men (confidence interval [CI] = [13%, 21%]) and 22% (CI = [18%, 26%]) of women reported a neighborhood fall in the year preceding the interview. According to bivariate multilevel models, living in a high social capital neighborhood increases the risk of falls more than 2 times compared with living in low social capital areas (PRR = 2.36, 95% CI = [1.52, 3.67]). Levels of neighborhood SES and built environment were not associated with the occurrence of falls. Individual levels of education, grip strength, and concerns for fear of falling were also significantly related to the occurrence of neighborhood falls in bivariate analyses (Table 2).
Bivariate Relationships Between all Variables and The Occurrence of Neighborhood Falls in The Samples of Older Adults Living in Kingston (ON) and Saint-Hyacinthe (QC).

Note. Numbers inside parentheses represent row percentages and are rounded to the nearest first decimal. CI = confidence interval; SES = socioeconomic status; SPPB = Short Physical Performance Battery; FES-I = Falls Efficacy Scale International; BMI = body mass index.
62 Missing (imputed by means).
7 Missing (imputed by means).
The three standard measures used to estimate between-neighborhood variations suggested that the random effects of neighborhoods should be taken into account. The estimated ICC of 7% in the random intercept only model suggested that the performance of multilevel analyses was justified. This was supported by a relatively high MOR of 1.60, which indicates moving from a low risk neighborhood to a high risk one increased the odds of falls by 60%. After adjustment for other neighborhood level variables the ICC reduced to 2% (MOR = 1.26) indicating that most of variations attributable to neighborhood can be explained by the selected specific neighborhood-level variables. Further adjustment for individual level variables reduced the ICC to 0.5% and the estimated MOR was as low as 1.08. The narrow 80% IOR of 1.11 to 2.67 also showed the importance of neighborhood social capital in understanding the odds of falls in an individual (Table 3).
Results of Multilevel Models Describing ORs for The Occurrence of Falls in The Samples of Older Adults Living in Kingston (ON) and Saint-Hyacinthe (QC).
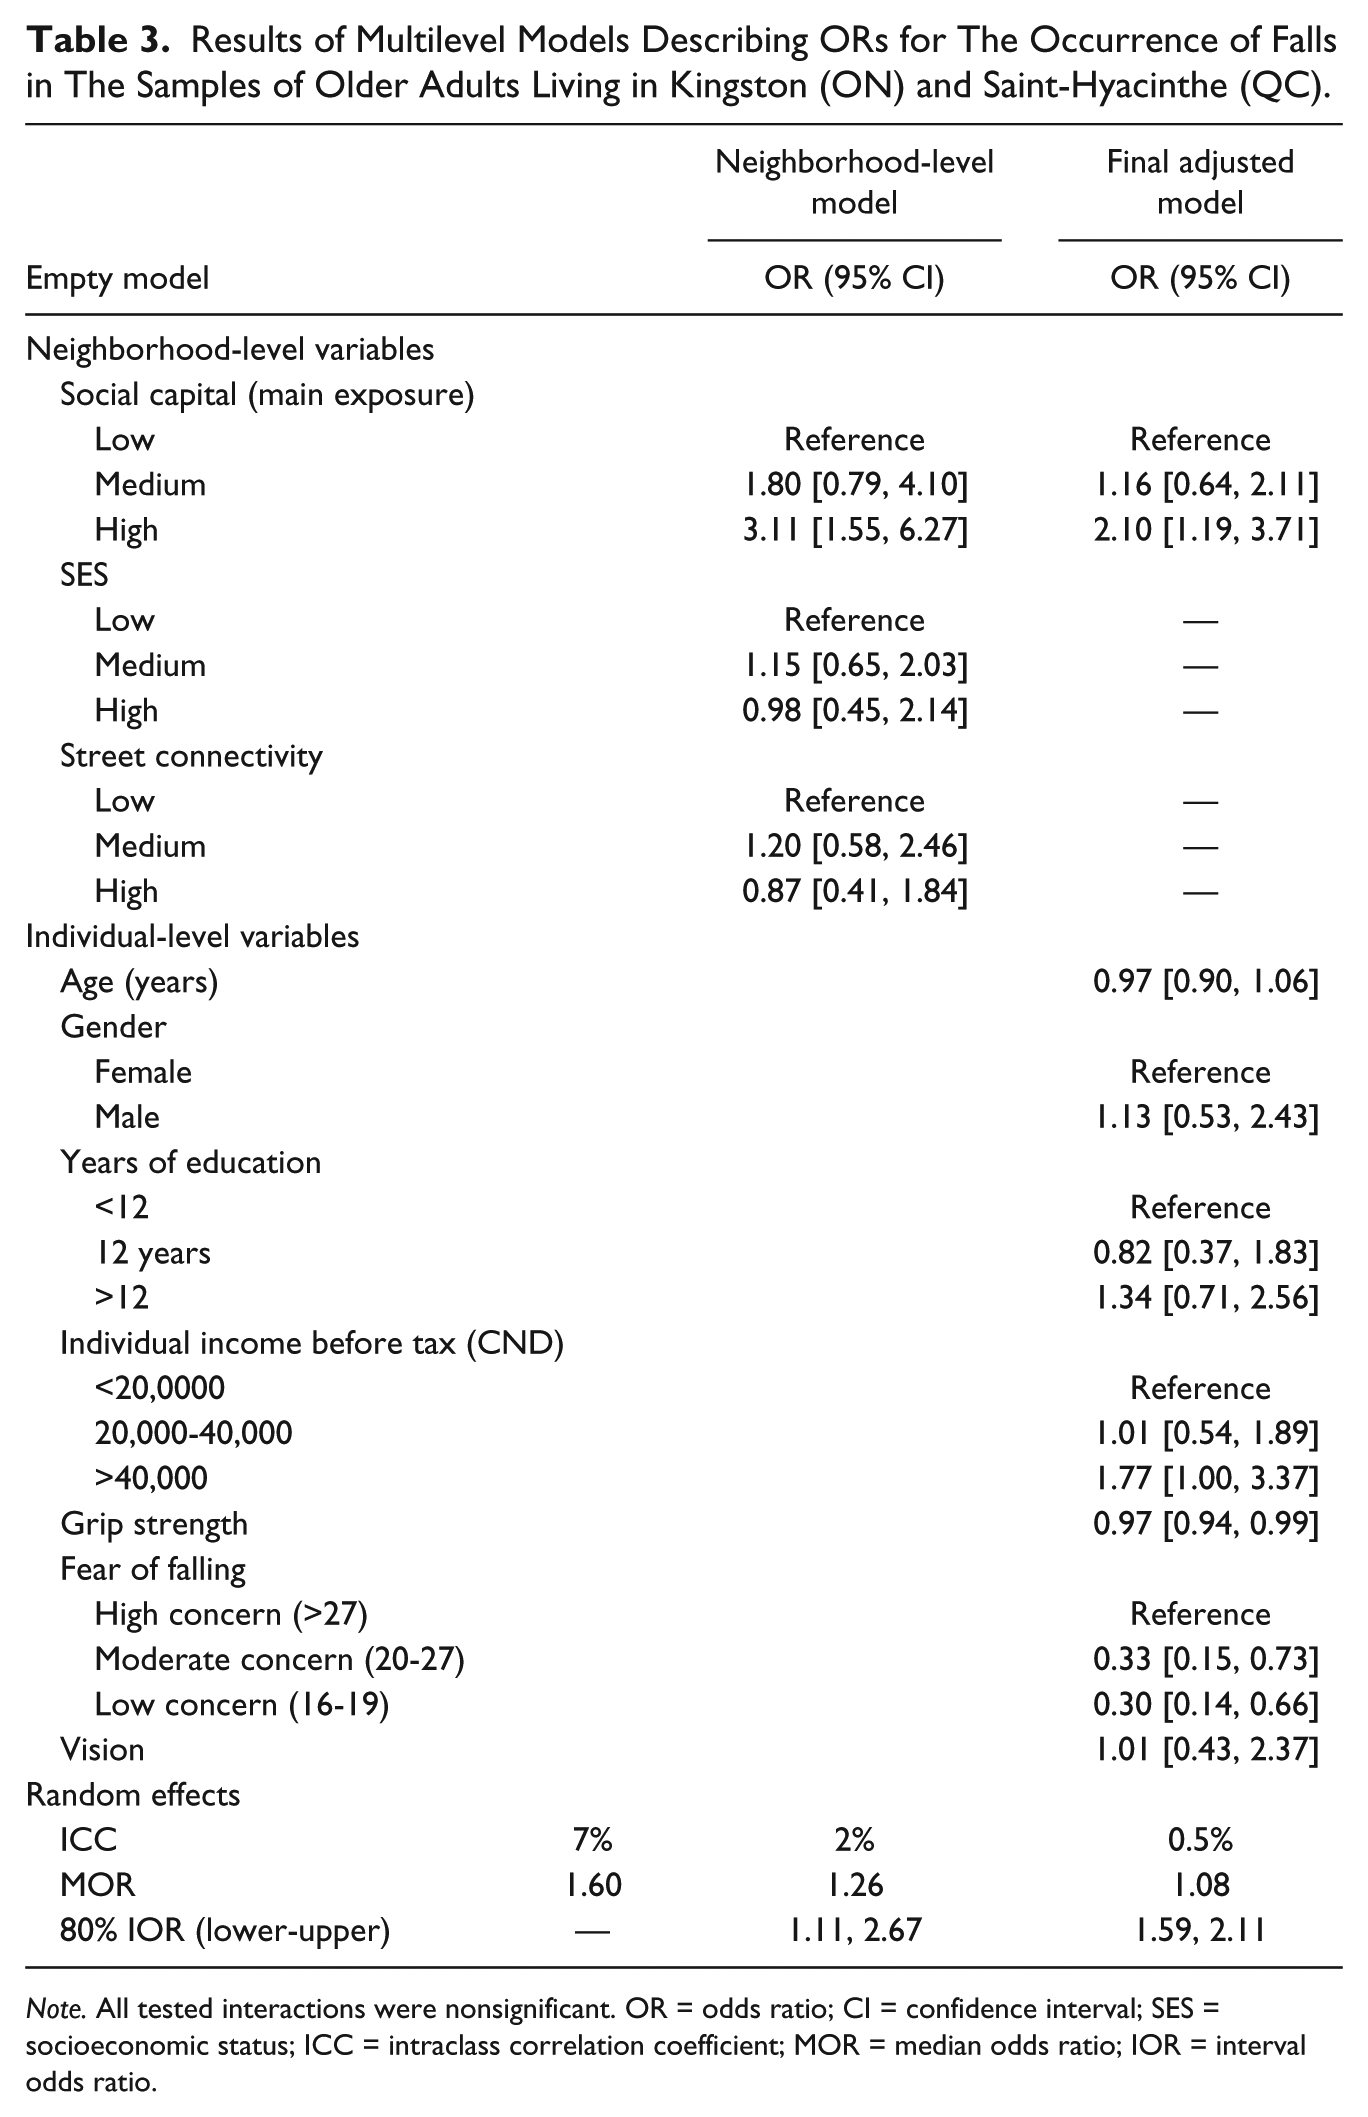
Note. All tested interactions were nonsignificant. OR = odds ratio; CI = confidence interval; SES = socioeconomic status; ICC = intraclass correlation coefficient; MOR = median odds ratio; IOR = interval odds ratio.
Following our predefined criteria of model building, the final adjusted model was chosen based on parsimony, better fit, and the most complete explanation of the neighborhood effects. According to this model, compared with those living in low social capital neighborhoods, residents of high social capital neighborhoods had twice the relative odds of reporting a fall (OR = 2.10, 95% CI = [1.19, 3.71]). Fall odds were not significantly different between medium and low social capital neighborhoods (OR = 1.16, 95% CI = [0.64, 2.11]). Stronger grip and lower fear of falling also remained protective factors for the occurrence of falls (Table 3). Each kilogram increase in grip strength was associated with a decrease in the odds of falls by 3% (OR = 0.97, 95% CI = [0.94, 0.99]) and having a low psychological concern for falls (fear of falling scores between16 and 19) was associated with a strong and significant decrease in odds of falls (OR 0.30, 95% CI = [0.14, 0.66]).
Male gender, more than 12 years of education, and higher levels income were associated with higher probability of falls (Table 2) but in the final adjusted model, only income remained a significant contributor to the occurrence of falls. Income higher than CND40,000 was marginally significantly related to higher odds of falls (OR = 1.77, 95% CI = [1.00, 3.37]).
Tests for interaction between neighborhood social capital and the three other neighborhood factors, as well as gender and individual income were not statistically significant (data not shown).
Discussion
This study of determinants of neighborhood falls in Canadian older adults had several important findings. First, we showed that “neighborhoods” as contextual environments are potential risk factors for outdoor falls. The ICC in the empty model suggests that 7% of the total variance in the occurrence of falls is attributable to between-neighborhood differences. However, this effect declines to 2% after taking into account neighborhood level variables and to 0.5% in the final adjusted model. This suggests that the mechanisms by which the neighborhood effects occur are mainly through these measures. A comparable decrease from 1.60 to 1.26 and 1.08 was also observed for the more interpretable measure of MOR. These dramatic changes suggest that (a) the three included neighborhood factors are the main factors that produce between-neighborhood differences; therefore, the initial observed strong “neighborhood” effect was in fact because of neighborhood-level factors not the neighborhoods themselves; (b) some between-neighborhood differences are compositional (the difference that individuals make to the neighborhood) and not attributable to neighborhoods per se.
Second, although it has been reported that older adults with higher levels of social capital also enjoy better physical health (Cagney & Wen, 2008), we showed that as social capital increased, the odds of neighborhood falls also increased. This effect remained statistically significant even after random effects of neighborhoods and fixed effects of other variables were accounted for in our multilevel models. The seemingly counterintuitive finding has several explanations. In neighborhoods with low social capital, due to lower levels of interpersonal relationships, older adults are more likely to stay at home, whereas those who enjoy higher levels of social interactions go out of their home more and move around their neighborhood and fall more. This can be referred as to a “positive injury,” an injury that occurs in an otherwise life-giving healthy activity. Our population included relatively healthier and younger older adults (65-75 years old). There is anecdotal evidence in the early senior years (age: 60-69 years) that falling happens unexpectedly more compared with older ages (O’Loughlin et al., 1993).
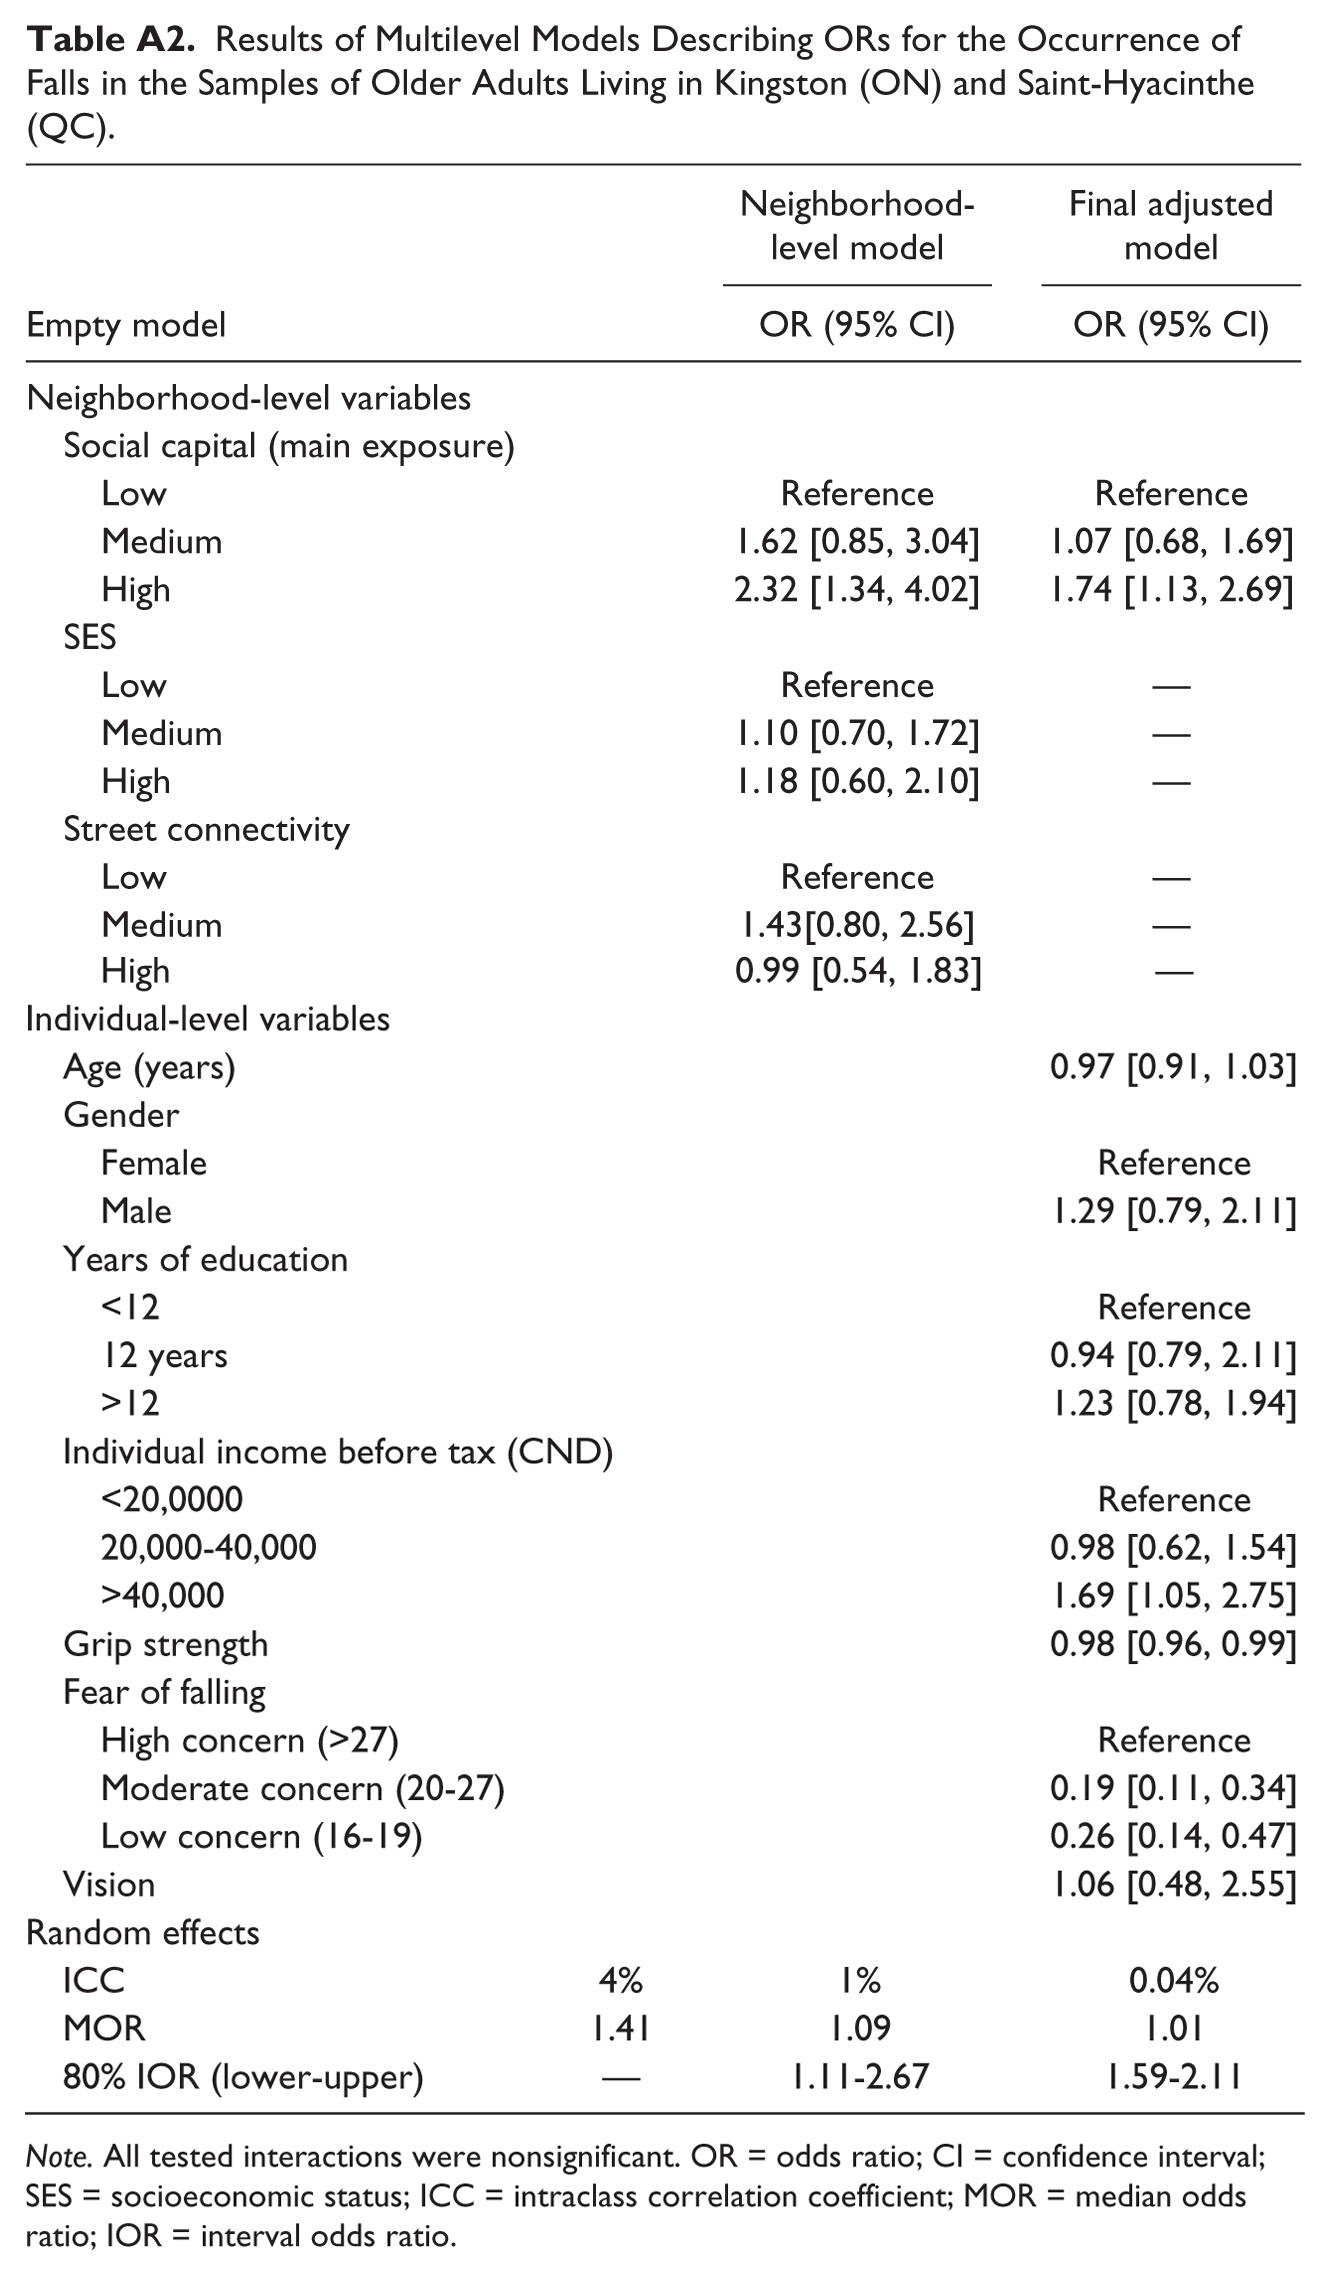
Third, our results were consistent with precedents that recognized lower muscle strength (Lord et al., 2007; Xue, Walston, Fried, & Beamer, 2011) and high fear of falling (Scheffer et al., 2008) as risk factors for falls; however, in contrast to other older adult studies (Coleman et al., 2007; Shin et al., 2009; van Schoor et al., 2002; Yamashita et al., 2012), poor physical performance, cognition function, and vision impairment were not related to the occurrence of falls in this population. This may be attributable to the fact that our population included mostly healthy individuals with a low prevalence of these disorders, resulting in a decrease in the power of regression models for the detection of potential relationships. Also, our fall outcomes included those occurring outside of homes and perhaps these risk factors are more important for falls occurring indoors and among more frail older adults. Other studies showed that risk factor profile of indoor falls was very different from outdoor falls (Bergland et al., 2003; Kelsey et al., 2010). Indoor falls were associated with indicators of poor health, whereas outdoor falls were associated with a more active lifestyle and better health. However, our omission of the (potentially) frailest individuals from our model may have biased our findings, thus we performed a sensitivity analysis and included indoor falls in our definition. Results generally remained consistent with our final models. As expected, because of the inclusion of outcomes that would not be directly associated with neighborhood features (indoor falls), the effect of social capital decreased from 2.10 to 1.74. Also, the independent effect of “neighborhood” was reduced, as shown by smaller values of ICC and MOR (Appendix Tables A1 and A2). Finally, we could not identify any effect from neighborhood built environment and SES factors on the occurrence of falls. This may be a true finding; however, we are cautious in making this conclusion. In our previous study, we showed the existence of structural confounding in the study population, which limits the reliability of causal inferences (Vafaei et al., 2016).
Our study was strong in terms of our use of advanced social epidemiological methodologies. We followed established model building strategies (Hosmer et al., 2013) to construct the most parsimonious multilevel models with the best fit, we followed the most recent analytical methodologies to quantify between-neighborhood variations to justify use of multilevel analyses (Larsen & Merlo, 2005), and we identified true confounders using standard epidemiological approaches (Rothman et al., 2008). Our focus on the study of neighborhood falls is quite rare in the literature, and we used the well-documented eco-social model (Bronfenbrenner, 1979; Krieger, 2001) to conceptualize the relationship of interest. We also recognize the limitations of our study. Our participants were not a representative sample of the Canadian older population, and the results of prevalence estimates are therefore not generalizable to that population. However, given that we measured variables accurately and there were sufficient observed heterogeneities in exposure levels, the effect estimates are likely reliable. Also, because the sample included older adults with higher levels of education, although unlikely as inferred from previous analyses (Vafaei et al., 2016), selection bias remains a potential concern. We started our analysis with a relatively large ICC of 7%, suggesting strong between-neighborhood variations. However, in the final adjusted model, the ICC decreased to a very low value of 0.5%. There is no established cutoff point for what is a meaningful “between-cluster” indication of variation explained. Other limitations of the study relate to data constraints. We used a self-reported measure for falls. The cognition level of the participants was relatively high; however, it has been shown that 3-month reporting has potential for inaccuracy in fall-related studies (Hannan et al., 2010). A lack of available data for some important neurological risk factors for falls such as Parkinson disease, multiple sclerosis, and vertigo as well as additional features of the built environment such as stops for public transportation and benches also limits the validity of our results. Finally, we recognize that due to cross-sectional data, reverse causality is a possibility in this study. Perhaps older adults who are healthier and more physically active, therefore, fall more because of their better health (positive injuries) and simultaneously establish stronger social networks and perceive their neighborhoods to have higher levels of social capital. Other possibilities are that the occurrence of falls may help in the build-up of social capital. Observation of public falls in older adults may prompt the community to provide assistance, and, therefore, improve the social cohesion of the neighborhood.
Conclusion
The burden of falls in older adult populations is large and almost half of falls occur outside of homes. This study sheds some light on the complex etiology of neighborhood falls by demonstrating simultaneous significant effects of contextual and individual factors. Social capital remained a significant risk factor for the occurrence of neighborhood falls after adjustment for such factors.
The complex relationship between social environment and one aspect of older adults’ health found in this study may suggest that neighborhood-level social interventions are not likely to achieve successful results without simultaneous consideration of individual differences in sociodemographic and other risk factors. Future research should repeat the same analysis in other settings and regions. Also, by using longitudinal data and adopting mediation analysis techniques, the mechanisms by which social capital can cause neighborhood falls should be assessed. One plausible mechanism is through the effects of higher levels of social engagement in high social capital areas.
Footnotes
Appendix
Results of Multilevel Models Describing ORs for the Occurrence of Falls in the Samples of Older Adults Living in Kingston (ON) and Saint-Hyacinthe (QC).
| Empty model | Neighborhood-level model |
Final adjusted model |
|
|---|---|---|---|
| OR (95% CI) | OR (95% CI) | ||
| Neighborhood-level variables | |||
| Social capital (main exposure) | |||
| Low | Reference | Reference | |
| Medium | 1.62 [0.85, 3.04] | 1.07 [0.68, 1.69] | |
| High | 2.32 [1.34, 4.02] | 1.74 [1.13, 2.69] | |
| SES | |||
| Low | Reference | — | |
| Medium | 1.10 [0.70, 1.72] | — | |
| High | 1.18 [0.60, 2.10] | — | |
| Street connectivity | |||
| Low | Reference | — | |
| Medium | 1.43[0.80, 2.56] | — | |
| High | 0.99 [0.54, 1.83] | — | |
| Individual-level variables | |||
| Age (years) | 0.97 [0.91, 1.03] | ||
| Gender | |||
| Female | Reference | ||
| Male | 1.29 [0.79, 2.11] | ||
| Years of education | |||
| <12 | Reference | ||
| 12 years | 0.94 [0.79, 2.11] | ||
| >12 | 1.23 [0.78, 1.94] | ||
| Individual income before tax (CND) | |||
| <20,0000 | Reference | ||
| 20,000-40,000 | 0.98 [0.62, 1.54] | ||
| >40,000 | 1.69 [1.05, 2.75] | ||
| Grip strength | 0.98 [0.96, 0.99] | ||
| Fear of falling | |||
| High concern (>27) | Reference | ||
| Moderate concern (20-27) | 0.19 [0.11, 0.34] | ||
| Low concern (16-19) | 0.26 [0.14, 0.47] | ||
| Vision | 1.06 [0.48, 2.55] | ||
| Random effects | |||
| ICC | 4% | 1% | 0.04% |
| MOR | 1.41 | 1.09 | 1.01 |
| 80% IOR (lower-upper) | — | 1.11-2.67 | 1.59-2.11 |
Note. All tested interactions were nonsignificant. OR = odds ratio; CI = confidence interval; SES = socioeconomic status; ICC = intraclass correlation coefficient; MOR = median odds ratio; IOR = interval odds ratio.
Declaration of Conflicting Interests
The authors declared no potential conflicts of interest with respect to the research, authorship, and/or publication of this article.
Funding
The authors disclosed receipt of the following financial support for the research, authorship, and/or publication of this article: The project study was funded by the International Mobility in Aging Study (IMIAS): Canadian Institutes of Health Research (CIHR), Institute of Aging, New Emerging Team; gender differences in immobility; reference numbe: AAM 108751.