
Abstract
Introduction
Both cardiovascular disease (CVD; Kuller, Arnold, et al., 2006) and depression (Ariyo et al., 2000; Barefoot & Schroll, 1996) are known predictors of all-cause mortality, but little is known about the relationship among these factors in relation to outcomes. These predictors are associated but may have a bidirectional relationship. Sheline et al. (2006) reported an association between CVD-related events and depression onset, whereas Ariyo et al. (2000) found that depression led to the onset of CVD-related events. The vascular depression hypothesis, which proposes that CVD may lead to, exacerbate, or maintain depression in older adults, may help elucidate the association between CVD and depression (Alexopoulous et al., 1997).
One study that examined the associations among CVD, depression, and all-cause mortality was conducted by Almeida, Alfonso, Flicker, Hankey, and Norman (2012). Using data from the Health in Men Study, Almeida et al. (2012) examined whether depression may have modified the effect of CVD on all-cause mortality and concluded that depression and CVD independently increased risk of all-cause mortality. This study did not examine whether depression had a mediating role in the association between CVD and all-cause mortality.
The objective of this study is to determine the mediating role of late-life depression in the association between subclinical CVD and all-cause mortality. By examining preclinical markers of the vascular pathway prior to the development of clinical CVD, we may find that subclinical CVD leads to elevated risk of late-life depression. We hypothesize that subclinical CVD may predispose to late-life depression, which in turn leads to the onset of all-cause mortality. To examine this question, we will use a weighted approach to causal mediation for common outcomes using time-to-event data spanning up to 24 years in the Cardiovascular Health Study (CHS).
Method
Study Sample
The study was conducted using the CHS, a community-based study of 5,888 men and women aged 65 years and older at baseline. Baseline was 1989-90 for the original cohort (n = 5,201), and 1992-93 for the additional minority cohort (n = 687). Study design, eligibility criteria, and recruitment characteristics are available elsewhere (Fried et al., 1991). Briefly, participants underwent interview and clinical assessments annually from baseline through 1998-1999 and telephone follow-up visits occur to present. Hospital discharge summaries and The International Classification of Diseases, 9th Revision (ICD-9) codes for all hospitalizations were collected during the follow-up period (Fried et al., 1991). All participants provided consent for the CHS. Institutional review boards at each institution involved in the CHS approved study procedures. Data can be accessed by becoming a CHS collaborator using policies and procedures in place for use of data and specimens (https://chs-nhlbi.org/).
For the current analysis, we excluded those with history of CVD-related events at study initiation (n = 1,517), those who died up to 5 years after study initiation (n = 456), and those with missing late-life depressive symptoms 2 to 3 years after study initiation (n = 442) to maintain temporal ordering for the causal mediation analysis (see the “Schedule of Events” section), resulting in a sample size of 3,473 participants.
Subclinical CVD
Subclinical CVD was defined as the presence of any of the following at baseline in the absence of an adjudicated history of clinically manifested CVD: ankle-arm index less than or equal to 0.9, internal and common carotid wall thickness greater than 80th percentile, carotid stenosis greater than 25%, or Rose questionnaire identifying either claudication positive or angina positive without clinical history of angina or claudication (Chaves et al., 2004; Kuller, Arnold, et al., 2006; Kuller, Shemanski, Psaty, et al., 1995). The development of the composite index of subclinical CVD is described in more detail elsewhere (Kuller, Arnold, et al., 2006; Kuller, Shemanski, Psaty, et al., 1995).
Late-Life Depression
Late-life depression was defined as having two consecutive scores ≥8 on the 10-item modified Center for Epidemiologic Studies–Depression Scale (mCES-D; Carnethon et al., 2007) 2 to 3 years after baseline. Two consecutive mCES-Ds were used, because a depressive episode can last for at least 2 years (American Psychiatric Association, 2000). The mCES-D is a short self-reported measure of depressive symptoms experienced during the previous week (Andresen, Malmgren, Carter, & Patrick, 1994). The mCES-D has excellent properties for depression screening in older adults, and it is comparable with the 20-item CES-D (Irwin, Artin, & Oxman, 1999). Compared with the original 20-item CES-D, the reliability of the mCES-D (Cronbach’s α statistic, .80) is slightly lower (Cronbach’s α statistic, .86), and there is a .88 correlation between the 10-item CES-D and 20-item CES-D (Kohout, Berkman, Evans, & Cornoni-Huntley, 1993). Questions cover topics of mood (five items), irritability (one item), calories (energy; two items), concentration (one item), and sleep (one item). Items are coded on a scale from 0 (rarely or none of the time) to 3 (most or all of the time), for a maximum of 30 points. Higher scores indicate greater depressive symptoms. Diagnosis of clinical depression was unavailable.
All-Cause Mortality
These analyses use mortality data through 2015. There was 98% complete ascertainment of death status. Deaths were obtained through passive ascertainment of obituaries, medical records, death certificates, and the Centers for Medicare and Medicaid Services health care utilization database for hospitalizations, and through active ascertainment of contacting households to follow up on vital status (Schulz et al., 2000). Cause of death was adjudicated by a committee of physicians (Newman et al., 2009).
Adjustment Covariates
Additional baseline covariates included age, race, male sex, poverty status, marital status, education level, Apolipoprotein E (ApoE) ε4 status, smoking status, body mass index (BMI), and depressive symptoms. Race was defined as White or non-White. Poverty status was an income cutoff below US$11,770 from Federal Poverty Level Guidelines (Dickon, 2015). Marital status was coded as married or unmarried. Education level was defined as high school graduate or not. ApoE ε4 status was categorized as the presence of at least one allele. Genotyping was performing using the method of Hickson and Vernier only for consenting participants (Kuller, Shemanski, Manolio, et al., 1998). Smoking status was characterized as current smoking status or not. BMI, a continuous measure, was defined as weight divided by height squared. Baseline depressive symptoms were defined as mCES-D scores. Depressive symptoms were included as adjustment covariates, as to compare individuals with similar levels of baseline depressive symptoms. All models were adjusted by these baseline covariates.
Schedule of Events
Figure 1 shows the hypothesized direct and indirect pathways connecting baseline subclinical CVD to all-cause mortality via late-life depression. Subclinical CVD was measured at baseline. Late-life depression, the mediator, was measured 2 to 3 years after baseline. The outcome, all-cause mortality, was ascertained between 5 years from baseline and up to 24 years from baseline.

Hypothesized pathway linking subclinical cardiovascular disease, late-life depression, and all-cause mortality.
Statistical Analysis
We characterized the sample at the first visit using means and percentages, and we evaluated differences between those with presence and absence of baseline subclinical CVD, using t tests for continuous variables and chi-square tests for categorical variables.
We estimated Kaplan–Meier survival curves to compare cumulative proportions of all-cause mortality between those with and without baseline subclinical CVD (Kaplan & Meier, 1958). The difference in the cumulative proportions of all-cause mortality between the presence and absence of baseline subclinical CVD was tested using a log-rank test (Bland & Altman, 2004). Time from the first study visit (baseline) was the time-scale used in the analysis. Participants contributed time from baseline until death, loss to follow-up, or administrative censoring in 2015.
Causal Mediation Analyses
To decompose the total effect between baseline subclinical CVD and all-cause mortality into direct and indirect effects, we used the counterfactual approach for causal mediation, as proposed by Lange and Hansen (2011) and VanderWeele (2011).
To apply the counterfactual framework, we obtained unbiased estimates for direct and indirect effects from weighted Cox proportional hazards models with a duplicated dataset with two replications of the exposure (Rochon, du Bois, & Lange, 2014). Proportionality hazards assumption was met in this analysis. The observed variables are exposure A, mediator M, outcome Y, and baseline covariates C. In the first replication, the exposure A* is set to the observed value of baseline subclinical CVD. In the second replication, A* is set to the opposite (or “counterfactual”) value of baseline subclinical CVD. Weights are determined by Wc = P(M|A*, C) / P(M|A, C), with proportions being derived from multivariable logistic regression model of late-life depression, M, on baseline subclinical CVD (A and A*) and baseline covariates, C (Rochon et al., 2014). Standard errors and 95% confidence intervals (CIs) were determined by 5,000 bootstrap simulations (Lange & Hansen, 2011). The analysis with weighted Cox Proportional Hazards models was performed in R version 3.1.2 (R: A language environment for statistical computing, 2013). All other analyses were done in Stata 13.0 (StataCorp, 2013).
As a secondary analysis, we examined whether late-life depression partially mediated the association of any baseline CVD (either history of CVD-related events or subclinical CVD) with all-cause mortality. Those with history of CVD-related events at baseline were included in this analysis.
Sensitivity Analysis
To examine whether confounding had an effect on both the exposure–mediator relationship and exposure–outcome relationship, we used propensity score weights, as the exposed and unexposed groups were unequally distributed (Ridgeway, McCaffrey, Morral, Burgette, & Griffin, 2014). Propensity scores were based on estimates from a multivariable logistic regression of exposure status using baseline demographic characteristics, (i.e., age, sex, race, poverty status, marital status, education level), ApoE ε4 status, and baseline depressive symptoms. We further adjusted by baseline covariates to account for small differences (Ho, Imai, King, & Stuart, 2007).
We performed other sensitivity analyses. We evaluated possible bias due to nonlinear relationships and interactions among exposure, baseline covariates, and mediator as well as allowance of misspecification of the mediator at 5%, 10%, and 15%. Last, we evaluated the indirect effect of late-life depression on the association between subclinical CVD and CVD-related death.
Results
Characteristics of the Study Sample
Table 1 shows baseline characteristics of the study sample stratified by presence (n = 1,453) and absence (n = 2,020) of baseline subclinical CVD. Those with baseline subclinical CVD were more likely to be older (p < .001), Caucasian (p = .03), male (p < .001), and impoverished (p < .001), current smokers (p < .001). Also, they had lower high-density lipoprotein (HDL) cholesterol (p < .001), higher total cholesterol (p = .03), higher systolic blood pressure (p < .001), diabetes (p < .001), and treated hypertension (p < .001) (Table 1). As compared with those without baseline subclinical CVD, those with baseline subclinical CVD were less likely to be high school graduates (p < .001) and married (p = .02). Those with and without baseline subclinical CVD were similar in terms of ethnicity (p = .86), baseline depressive symptoms (p = .15), ApoE ε4 status (p = .21), antidepressant medications (p = .97), and BMI (p = .06) (Table 1).
Characteristics of Participants From the Cardiovascular Health Study (N = 3,473).
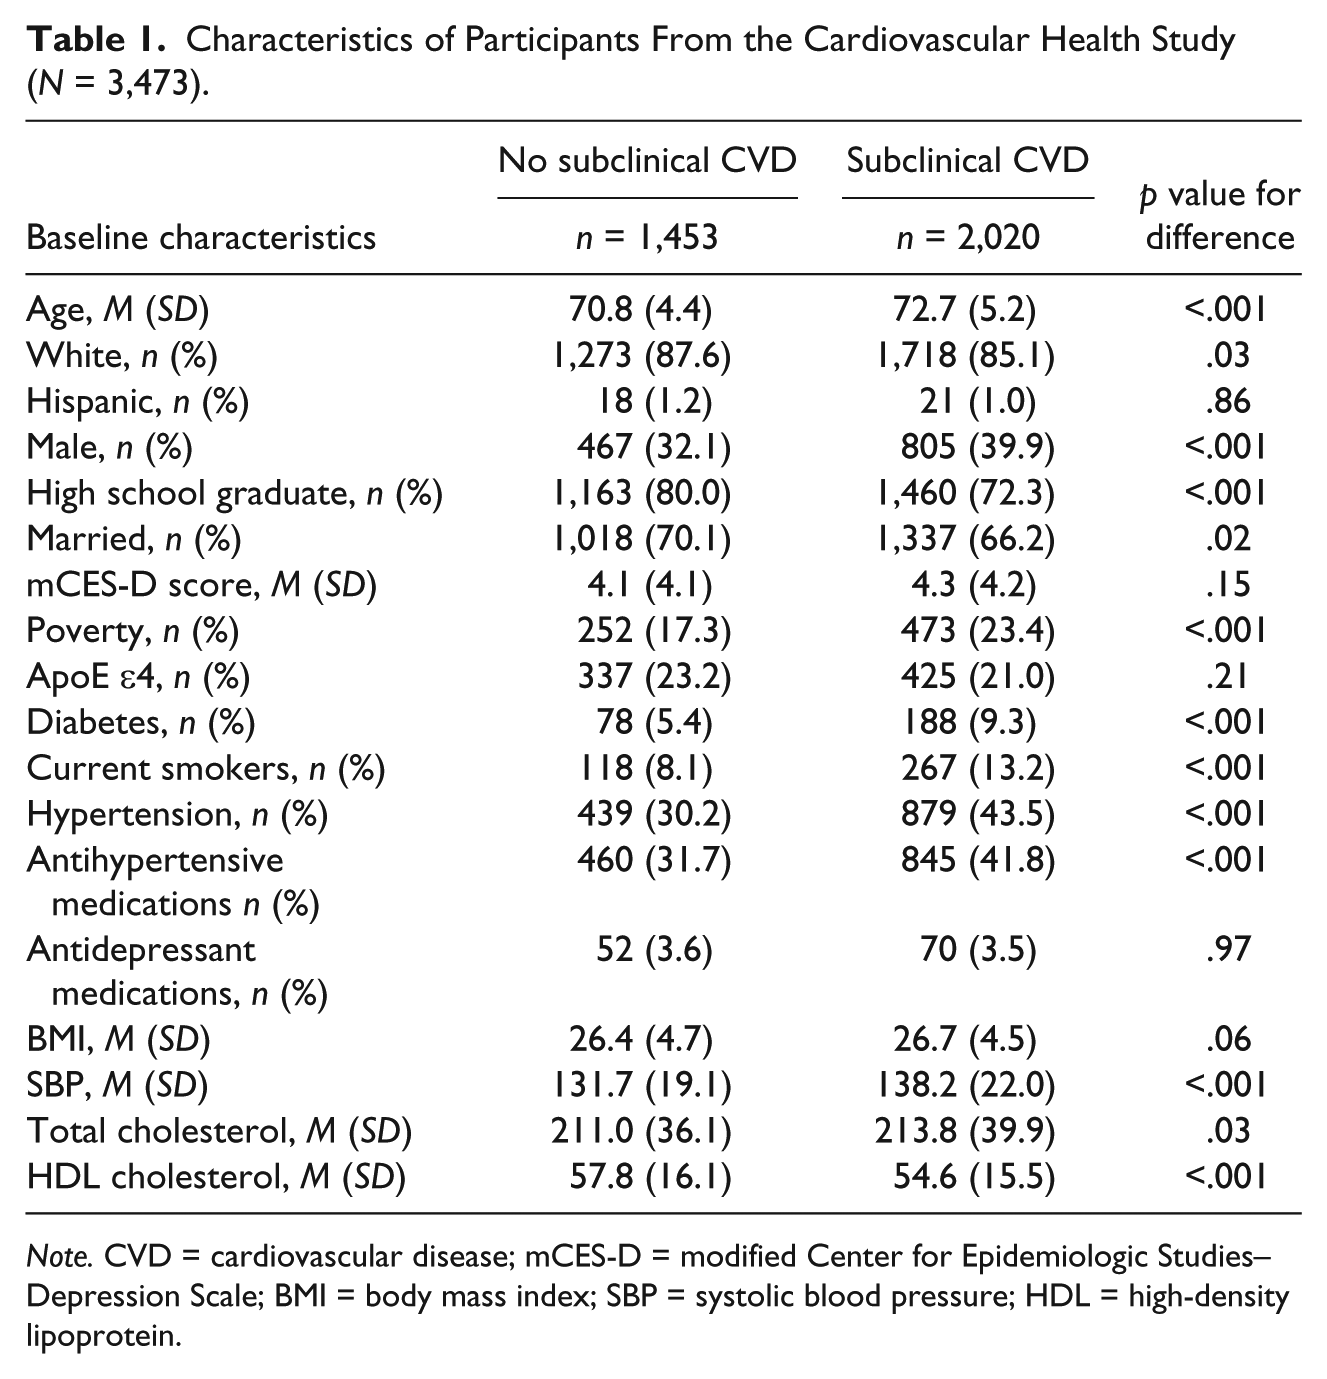
Note. CVD = cardiovascular disease; mCES-D = modified Center for Epidemiologic Studies–Depression Scale; BMI = body mass index; SBP = systolic blood pressure; HDL = high-density lipoprotein.
Figure 2 shows Kaplan–Meier survival curves comparing the risk of all-cause mortality between those with and without baseline subclinical CVD. The cumulative proportion of all-cause mortality is higher among those with baseline subclinical CVD than those without baseline subclinical CVD (p < .001). Participants contributed 55,157.06 person-years with a mean of 15.2 years (median of 15.9 years) between baseline and all-cause mortality, loss to follow-up, and end of follow-up in 2015.

Kaplan–Meier plot of the association of baseline subclinical cardiovascular disease with all-cause mortality.
Indirect Effect of Late-Life Depression on the Association of Subclinical CVD With All-Cause Mortality
The total effect of subclinical CVD on all-cause mortality and its decomposition into natural indirect and direct effects are shown in Table 2. The total hazard ratio (HR) for the association between subclinical CVD and all-cause mortality was 1.51 (95% CI = [1.42, 1.94]; Table 2). The total HR was decomposed into a direct HR of subclinical CVD of 1.41 (95% CI = [1.37, 1.58]) and indirect HR for late-life depression of 1.07 (95% CI = [1.01, 1.23]; Table 2). Late-life depression accounts for 16.26% (95% CI = [15.03%, 17.49%]) for the total effect of subclinical CVD on all-cause mortality.
Causal Mediation Analysis Using Survival Data: Total, Direct, and Indirect Effects From Weighted Continuous-Time Cox Proportional Hazard Models of the Association Between Cardiovascular Disease and All-Cause Mortality via Late-Life Depression.
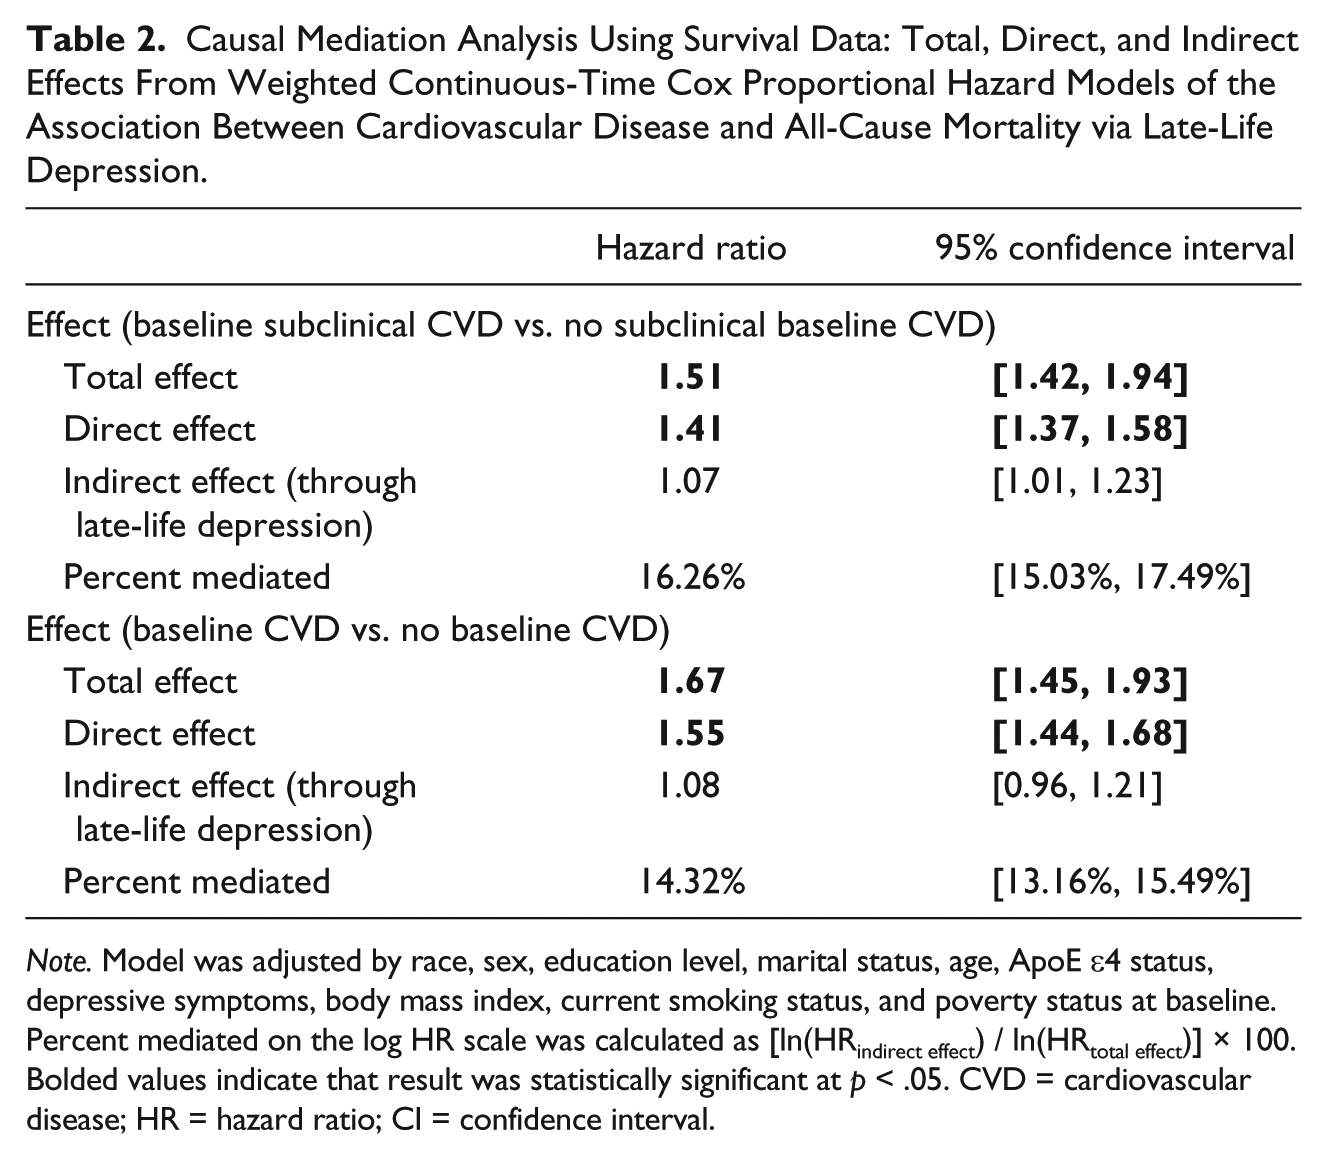
Note. Model was adjusted by race, sex, education level, marital status, age, ApoE ε4 status, depressive symptoms, body mass index, current smoking status, and poverty status at baseline. Percent mediated on the log HR scale was calculated as [ln(HRindirect effect) / ln(HRtotal effect)] × 100. Bolded values indicate that result was statistically significant at p < .05. CVD = cardiovascular disease; HR = hazard ratio; CI = confidence interval.
When we examined whether late-life depression partially mediated the association between any baseline CVD and all-cause mortality, we found similar results to the main findings (Table 2), suggesting that late-life depression do not partially mediate the association of a vascular pathway with all-cause mortality.
Sensitivity Analysis
To assess several assumptions of the counterfactual approach for causal mediation, we used weights of propensity scores. When we conducted the same analysis weighted by propensity scores and further adjusted the analysis by baseline covariates, we found that those with baseline subclinical CVD had 1.37 (95% CI = [1.26, 1.49]) times the risk of all-cause mortality than those without baseline subclinical CVD (Supplemental Table 1). When the total effect was decomposed into the direct and indirect effects, the direct effect (HR = 1.37, 95% CI = [1.26, 1.49]) explained 100% of the total effect between subclinical CVD and all-cause mortality. There was no indirect effect of late-life depression (HR = 1.00, 95% CI = [1.00, 1.00]; Supplemental Table 1).
We also examined possible bias due to nonlinear relationships and interactions between exposure, baseline variables, and mediator. There was an interaction between subclinical CVD and high school education. When the interaction was added to the model, the main findings did not change. Main findings did not change when we introduced 5%, 10%, and 15% misclassification at random to late-life depression (Supplemental Table 2). Last, inferences did not change when we assessed the indirect effect of late-life depression on the association between subclinical CVD and CVD-related mortality. We did not detect an indirect effect (Supplemental Table 3).
Discussion
Those with subclinical CVD were at an elevated risk of all-cause mortality, compared with those without subclinical CVD. Most of the total effect was explained by the direct effect of subclinical CVD on all-cause mortality and CVD-related mortality. Late-life depression explained 16.3% of the total effect of subclinical CVD on risk of all-cause mortality. When sensitivity analysis was conducted to further adjust for any potential confounding by propensity score weighting, late-life depression did not account for any of the total effect of subclinical CVD on all-cause mortality. These findings suggest that subclinical CVD is a risk factor of all-cause mortality and late-life depression might not be on the pathway between subclinical CVD and all-cause mortality.
Although we used a causal mediation approach to evaluate the associations among CVD, late-life depressive symptoms, and all-cause mortality, we arrived at a similar conclusion as Almeida et al. (2012) who examined depression as an effect modifier in the association between CVD and all-cause mortality. They reported that depression and CVD were independently associated with all-cause mortality and that depression did not modify the association between CVD and all-cause mortality. Other studies have found that depression and subclinical CVD are independently associated with all-cause mortality, although these studies did not examine mediation of depression on the association between subclinical CVD and all-cause mortality (Ariyo et al., 2000; Kuller, Arnold, et al., 2006; Schulz et al., 2000). When we examined the indirect effect of late-life depressive symptoms on the association between subclinical CVD and CVD-related mortality, late-life depressive symptoms did not mediate this association. We also evaluated the effect of late-life depressive symptoms on the association of any CVD with all-cause mortality and did not find an indirect effect.
One potential explanation for these results could be that the prevalence of depression remains stable until it declines between ages 60 and 69 (Kessler et al., 2003) while the prevalence of CVD-related events, such as coronary heart disease, stroke, and atherosclerosis, increases exponentially with greater age (Bakhai, 2004). If vascular disease were related to late-onset depression, one would expect the prevalence of depression to increase exponentially with greater age as well, but this trend is not observed (de Leeuw et al., 2001; Newson et al., 2010).
There are several strengths of this study. First, this study consisted of a large sample of community-dwelling older adults with repeated measures on depressive symptoms and all-cause mortality over a period of up to 24 years. Second, all-cause mortality is an outcome with over 98% ascertainment through the end of the study period we used, so we were able to measure the outcome without any missingness. Third, all causes of death were adjudicated by a committee of physicians. Fourth, investigators from the CHS developed an index of subclinical CVD based on objective measures (Kuller, Arnold, et al., 2006). Fifth, we used a causal mediation approach with time-to-event data to examine the relationship among CVD, late-life depression, and all-cause mortality.
Despite the strengths of the study, there were several limitations. One limitation is the lack of clinical diagnosis of depression in CHS. However, the mCES-D may measure depressive symptoms in older adults who would not meet diagnostic criteria for depressive disorder. About 13% of the sample had late-life depressive symptoms 2 to 3 years after baseline, which is similar to the prevalence of depressive symptoms among community-dwelling older adults reported by Blazer (2003). Moreover, the assumption that there was no confounding of the mediator–outcome relationship by exposure could not be tested in observational studies (Lange & Hansen, 2011). For example, subclinical CVD could lead to a CVD-related event, such as stroke. Stroke is associated with late-life depressive symptoms and death. We combined subclinical CVD and histories of CVD-related events as any baseline CVD, and we evaluated whether late-life depression partially mediated the association between any baseline CVD and all-cause mortality. The results were similar to the main study findings.
To address concerns about confounding in the exposure–mediator and exposure–outcome associations, we adjusted the analysis by baseline covariates that were related to exposure, mediator, and outcome. We introduced 2-year lags to examine relative ordering of baseline subclinical CVD, late-life depression measured 2 to 3 years after baseline, and all-cause mortality ascertained from at least 5 years after baseline. We conducted a sensitivity analysis with propensity scores based on baseline covariates to determine whether inferences remained.
Although baseline subclinical CVD had a positive effect on all-cause mortality, late-life depression marginally mediated the association between subclinical CVD and all-cause mortality. After weighting by propensity scores, there was no indirect effect. Late-life depressive symptoms and subclinical CVD both lead to all-cause mortality. The vascular pathway may be strongly correlated with all-cause mortality in older adults, such that depression does not affect the association between subclinical CVD and all-cause mortality. CVD is the leading cause of death in the United States, so this could be plausible.
There are several future directions that may elucidate whether late-life depression indirectly affects the association between subclinical CVD and all-cause mortality. The first would be to examine the indirect effect of each domain of the mCES-D on the association between subclinical CVD and all-cause mortality. As depression is a multidimensional construct, a particular domain of the mCES-D may inform whether specific domains of depression, that is, positive affect, depressed affect, somatic complaints, and interpersonal conflicts, may affect the association between subclinical CVD and all-cause mortality. A previous study found an association between depressed affect and coronary artery calcification (Stewart et al., 2012), so a domain-specific approach seems plausible. Another direction would be to examine vascular processes in midlife instead of late life. Late-life depression may mediate the association of midlife vascular disease with all-cause mortality.
Footnotes
Acknowledgements
The authors thank Ryan L. Andrews for his expertise in causal mediation modeling and the participants of the Cardiovascular Health Study.
Declaration of Conflicting Interests
The authors declared no potential conflicts of interest with respect to the research, authorship, and/or publication of this article.
Funding
The authors disclosed receipt of the following financial support for the research, authorship, and/or publication of this article: N.M.A. was supported by fellowship from the Epidemiology and Biostatistics of Aging Training Grant (5T32AG000247). This research was supported by contracts HHSN268201200036C, HHSN268200800007C, N01HC55222, N01HC85079, N01HC85080, N01HC85081, N01HC85082, N01HC85083, N01HC85086, and grants U01HL080295 and U01HL130114 from the National Heart, Lung, and Blood Institute (NHLBI), with additional contribution from the National Institute of Neurological Disorders and Stroke (NINDS). Additional support was provided by R01AG023629 from the National Institute on Aging (NIA). A full list of principal Cardiovascular Health Study (CHS) investigators and institutions can be found at ![]() . The sponsor did not play any direct role in the design, methods, subject recruitment, data collections, analysis, and preparation of the article.
. The sponsor did not play any direct role in the design, methods, subject recruitment, data collections, analysis, and preparation of the article.
Supplementary material is available for this article online.
References
Supplementary Material
Please find the following supplemental material available below.
For Open Access articles published under a Creative Commons License, all supplemental material carries the same license as the article it is associated with.
For non-Open Access articles published, all supplemental material carries a non-exclusive license, and permission requests for re-use of supplemental material or any part of supplemental material shall be sent directly to the copyright owner as specified in the copyright notice associated with the article.