
Abstract
Keywords
Introduction
Over the last decades, we have witnessed a dramatic increase in life expectancy resulting in a rapid growth in the number of older people worldwide (Cohen, 2003). By 2050, it is estimated that people above the age of 60 years will account for more than 21% of the global population, posing great challenges to societies and health care systems (Kinsella & Phillips, 2005). Although, biological, physical, and functional changes constitute normal parts of the aging process, there are cases in which these changes accumulate to such a degree that they may lead to increased levels of vulnerability and to deterioration in quality of life. This condition is described by the concept of frailty, which is characterized by the inability to preserve homeostasis in response to even minor stressors (Fried et al., 2001). Although investigators worldwide agree on the detrimental effects of frailty (falls, disability, cognitive impairment, need for complex medical care and mortality) and try to identify factors that could prevent it (Morley et al., 2013; Yannakoulia, Ntanasi, Anastasiou, & Scarmeas, 2017), no consensus regarding its definition has been reached.
The concept of frailty first appeared in 1968 (O’Brien et al., 1968) and its first quantitative assessment in 1988 (Winograd, Gerety, Brown, & Kolodny, 1988), but the most significant progress in the operationalization of frailty was made in 2001 by Fried et al. (2001). Since then many instruments and questionnaires have been developed to assess frailty and two main approaches have prevailed: (a) the biological or phenotypic approach, which focuses on the physical aspects of frailty and (b) the multidomain approach, as part of a broader perspective, which includes a combination of physical measures, syndromes, diseases, and psychosocial factors (de Vries et al., 2011).
The estimated prevalence of frailty may vary depending on the definition used in population-based studies (Collard, Schoevers, & Oude Voshaar, 2012). For instance, studies using the phenotypic approach appear to converge to a frailty syndrome prevalence of about 4% (Avila-Funes et al., 2008; Collard et al., 2012; Fried et al., 2001) to 17% of the elderly population (Santos-Eggimann, Cuénoud, Spagnoli, & Junod, 2009). However, the frailty measures that follow the multidomain approach report higher prevalence rates, ranging from 22% (Song, Mitnitski, & Rockwood, 2010) to even 46% (Gobbens, van Assen, Luijkx, Wijnen-Sponselee, & Schols, 2010).
The main limitation of the existing literature refers to the fact that the rates reported are obtained from studies that apply the various frailty definitions to different populations. In other words, it is customary that most studies use a single frailty definition and only few studies report rates from many definitions in a single population (Cigolle, Ofstedal, Tian, & Blaum, 2009; Malmstrom, Miller, & Morley, 2014; Roppolo, Mulasso, Gobbens, Mosso, & Rabaglietti, 2015). This is important in the face of the fact that frailty is a term used to characterize distinct conditions: a clinical phenotype (as proposed by the biological approach), a measure of the accumulative burden of diseases and symptoms (as suggested by Rockwood et al), or a combination of physical decline, mental impairment, and social isolation (as proposed by other multidomain approaches; Sloane & Cesari, 2018). In addition, the method data are the collected contributes to the distinctive perspectives of frailty. Frailty definitions that are based on objective measures of participants’ performance may capture different information compared with definitions that use self-report questions. The different frailty operationalization necessitates the comparison of frailty prevalence.
Moreover, data regarding prevalence of frailty syndrome in Greece are lacking: only one study has reported frailty prevalence for Greek community–dwelling older people (Santos-Eggimann et al., 2009) but it used a different operationalization of the Fried criteria. In that study, frailty assessment was based on standardized computer-assisted face-to-face personal interviews conducted by trained interviewers (rather than by specialized health professionals).
The aim of the present analysis is to estimate the prevalence of frailty using five different assessment instruments in the same population of Greek community–dwelling older people. In addition, the large amount of data gathered in the current study allows us to explore different risk factors of frailty and examine their specific association with each definition.
Method
Participants
Participants were drawn from the Hellenic Longitudinal Investigation of Aging and Diet (HELIAD), which is described in detail elsewhere (Dardiotis, Kosmidis, Yannakoulia, Hadjigeorgiou, & Scarmeas, 2014; Mourtzi et al., 2018). Briefly, HELIAD is a population-based, multidisciplinary-collaborative study designed to estimate the prevalence and incidence of mild cognitive impairment, Alzheimer’s disease, and other types of dementia in the Greek population. Τhe study also ascertains several demographic, medical, social, environmental, clinical, nutritional, and neuropsychological determinants and lifestyle activities. This large amount of data gathered allows us to explore and deepen our understanding of other geriatric syndromes, such as frailty. Participants were at least 65 years old and were selected through random sampling from the records of two Greek municipalities; Larissa and Marousi, and they all gave their informed consent prior to the study participation. From eligible participants (excluding those who had incomplete data, who had relocated, could not actively be recruited, died or were not contacted yet from the initial sample), 56.4% agreed to participate. Those who agreed to participate were slightly younger, compared with those who refused to participate (70.2±19.6 vs. 74.3±15.5 years, respectively, p < .001). All procedures were approved by the institutional ethics review board of the University of Thessaly and the National and Kapodistrian University of Athens.
Procedures
In the 2-hr face-to-face interviews, participants provided information regarding (previous and current) medical problems, neurological conditions, neuropsychiatric symptoms, hospitalizations, surgeries, injuries, and current medications. Information about the medical history of the participants’ first-degree relatives was also gathered. In addition, an extensive structured physical examination, evaluating neurological signs and symptoms, was conducted for each participant. Structured questionnaires were used to gather information about participants’ functioning; social, mental, and physical activities; sleep and dietary habits. Information regarding sociodemographic and anthropometric variables was also collected. All participants went through a comprehensive neuropsychological assessment of all major cognitive domains (Anastasiou et al., 2017; Dardiotis et al., 2014; Kosmidis et al., 2018). Interviews and assessments were conducted by qualified health professionals: that is, neurologists, neuropsychologists, and dietitians, who were adequately trained on the study’s questionnaires and procedures.
Frailty Assessment
The operationalization of the Fried Definition, the Frailty Index (FI), and the Tilburg Frailty Indicator (TFI) has been described elsewhere (Ntanasi et al., 2017); more specifically in the following sections:
The Fried definition
This definition belongs to the phenotypic approach and includes the five criteria proposed by Fried and colleagues (2001) in the Cardiovascular Health Study. Participants who met three or more criteria were considered frail, those with one or two criteria present as prefrail, and those who met none of the above criteria as nonfrail; (a) Slow walking speed was defined as the lowest 20% of our study population for the 4 m-walking speed test (adjusted for sex and height); (b) shrinking/weight loss was defined as body mass index (BMI) < 18.5 kg/m2; (c) poor endurance/exhaustion was evaluated as a negative response to the question taken from the Geriatric Depression Scale “Do you feel full of energy?”(Yesavage, 1988); (d) low physical activity was estimated based on a validated questionnaire, the Athens Physical Activity Questionnaire (APAQ), which calculates participants’ daily energy expenditure for physical activities (Kavouras et al., 2016). The lowest 20% for each sex was assumed to be indicative of frailty; (e) weakness was defined as grip strength in the lowest 20% adjusted for sex and BMI. Grip strength of the dominant hand was measured with an electronic dynamometer (Model MG-4800, the United Kingdom) and the mean strength of three trials was used in the current analysis.
The FRAIL Scale
The FRAIL Scale was developed more recently (Abellan van Kan, Rolland, Morley, & Vellas, 2008; Morley, Malmstrom, & Miller, 2012) and includes five criteria: fatigue, resistance, ambulation, illness, and loss of weight. In our study, two of this definition’s criteria (fatigue and loss of weight) were slightly modified. Fatigue was evaluated as a negative response to the question taken from the Geriatric Depression Scale “Do you feel full of energy?” (Yesavage, 1988). Resistance and ambulation was measured by asking participants if they had any difficulty walking up 10 steps alone without resting and without aids, and if they had any difficulty walking several 100 m without aids, respectively. For the criterion of illness, the presence of five or more illnesses out of a list of 11 health problems (hypertension, diabetes, cancer, chronic lung disease, heart attack, congestive heart failure, angina, asthma, arthritis, stroke, and kidney disease) was indicative of frailty. Loss of weight was defined as BMI < 18.5 kg/m2. Participants who met three to the five criteria were considered frail, those with one to two criteria present were considered prefrail, and those who met no criteria were nonfrail older adults. This definition combines criteria proposed by Fried with the criterion of comorbidities included in the multidomain approach but, except from the BMI criterion, it uses subjective measures of frailty.
The FI
The assessment of the multidomain approach that is most commonly used is the one proposed by Rockwood and Mitnitski (2007, 2011). This approach is based on the calculation of an FI, defined as the ratio of deficits present in a person to the total number of deficits considered in a medical evaluation. For the construction of FI we followed the standard procedure described by Searle, Mitnitski, Gahbauer, Gill, and Rockwood (2008). In the current study 61 variables regarding diseases, syndromes, functioning in activities of daily living, cognitive decline, mood disorders, and performance on physical activities were included for the assessment of frailty (Supplementary Table). According to this index, a score of 0.25 is the cut-off point for frailty, with higher scores indicating the presence of more “deficits,” and, thus, a greater degree of frailty (Rockwood, Andrew, & Mitnitski, 2007).
The TFI
In addition, we used a slightly modified Tilburg indicator for the assessment of frailty (Gobbens et al., 2010). This instrument is based on an integrative view of human functioning by assessing physical, social, and psychological components. The physical domain is evaluated by self-reported questions about physical health, weight loss, walking, balance, hearing, vision, hand strength, and fatigue. The psychological domain contains questions about the presence of memory problems, mood disorders, anxiety or nervousness and the ability to cope with problems. The social domain is assessed by living alone, missing people, and receiving adequate support. However, we lacked data regarding subjective decreased hand strength and ability to cope with problems, so two criteria, (a) “Do you experience problems in your daily life due to a lack of strength in your hands?” and (b) “Are you able to cope with problems well?” were excluded from our definition. Participants who met five or more criteria were considered frail, as originally proposed by the authors who developed the TFI (Gobbens et al., 2010).
The Groningen Frailty Index (GFI)
Similar to the FI and the TFI, the GFI includes criteria of multiple frailty domains; physical, cognitive, social, and psychological (Steverink, Slaets, Schuurmans, & Van Lis, 2001). It consists of 15 self-report items. Its total score ranges from 0 to 15 and a total score of 4 or higher is indicative of frailty (Peters, Boter, Buskens, & Slaets, 2012). Individuals were asked about their functioning in instrumental and daily living activities (shopping, walking outside the home, getting dressed, and visiting the restroom), vision and hearing impairment, loss of weight, number of medications (the use of four or more medications was considered indicative of frailty), presence of memory impairment or memory complaints, feelings of depression or anxiety, feelings of emptiness and loneliness and physical fitness.
Statistical Analyses
All statistical analyses were performed using SPSS 23 (SPSS, Chicago, Illinois). We calculated the frequency of frailty for the whole sample, and separately after categorization in age groups (groups by 5-year increments). Differences among groups (frail, prefrail, and nonfrail) were tested through analysis of variance for continuous variables (years of education and number of comorbidities) and Pearson’s χ2 for categorical variables (gender, age group, socioeconomic status, occurrence of dementia, and occurrence of depression). Cohen’s k was calculated to determine the agreement between the frailty definitions.
Furthermore, we explored the role of various established risk factors of frailty using logistic regression analyses, in both unadjusted and adjusted models. In all analyses, the frailty status (as measured by each definition) was entered as the outcome, but the variables used as predictors differed depending on the definition of frailty used: only the variables that did not contribute to each frailty definition were used as predictors. Specifically, when frailty was measured using the Fried definition, gender, age, education, number of comorbidities, occurrence of depression and dementia, and socioeconomic and marital status were considered as predictors. As far as the FRAIL Scale is concerned, the number of comorbidities was not used as a predictor in the analyses, as it was included as a frailty criterion in the specific tool. For the same reason, the presence of comorbidities, such as depression and dementia, were not included in the analyses with the FI. Similarly, the occurrence of dementia and depression was not included in the analyses using the TFI and the GFI definitions. Frailty status was categorized into frail and nonfrail for all definitions: thus for Fried definition and FRAIL Scale (that discriminate between frail, prefrail, and nonfrail participants), we decided to include prefrail participants in the nonfrail category.
Participants were categorized into five age groups (years): 65 to 69, 70 to 74, 75 to 79, 80 to 84, and ⩾85. Regarding level of education, participants were categorized into those who had completed 6 or fewer years of education (primary education) and those who had completed 7 or more years of formal education (i.e., had completed at least 1 year of secondary education). Antidepressant medication, diagnosis of depression, and score on the 15-item version of the Geriatric Depression Scale (GDS; Fountoulakis et al., 1999; Yesavage, 1988) were recorded to assess depressive symptoms/mood disorders. Participants who were diagnosed with depression and/or were under antidepressant treatment and/or scored higher than 6 on the GDS were considered to have a mood disorder. The diagnosis of dementia was based on Diagnostic and Statistical Manual of Mental Disorders (4th ed., text rev.; DSM-IV-TR; American Psychiatric Association, 2000) criteria. Socioeconomic status was defined arbitrarily based on information on the subjects’ ownership or rental of their home, the area and number of rooms of their residence, ownership of cars or cottages, as well as feasibility, length, and destination of summer vacations, and was divided into lower and higher. Marital status was divided into married and not married.
Results
The total sample consisted of 1,867 people aged ⩾ 65 years (1,095 women). Their age ranged from 65 years to 99 years, with a mean age of 73.5±5.4 years. The number of participants identified as frail differed depending on the definition used. The lowest prevalence rate was detected when frailty was measured with the FRAIL Scale (1.5%, n = 28) and the highest was observed when participants were assessed with the GFI (30.2%, n = 564). Operationalization of frailty with Fried definition, FI, and TFI revealed a prevalence rate of 4.1% (n = 76), 19.7% (n = 368), and 24.5% (n = 458), respectively.
More than half of participants (58.1%) were categorized as frail or nonfrail/prefrail identically in all scales. This agreement was mainly due to the high number of participants identified as nonfrail, as only 14 participants (0.7%) were categorized as frail by all five instruments. The highest level of agreement was found between two of the multidomain definitions, TFI and GFI (Cohen’s Kappa = 0.52), as 80.2% of the participants assigned to the same category. The lowest agreement was between the Fried definition and FI scale (Cohen’s Kappa = 0.16), with 45% of participants assigned to the same categories. A Venn diagram displaying the extent of overlap of participants identified only as frail according to all frailty definitions is depicted in Figure 1.
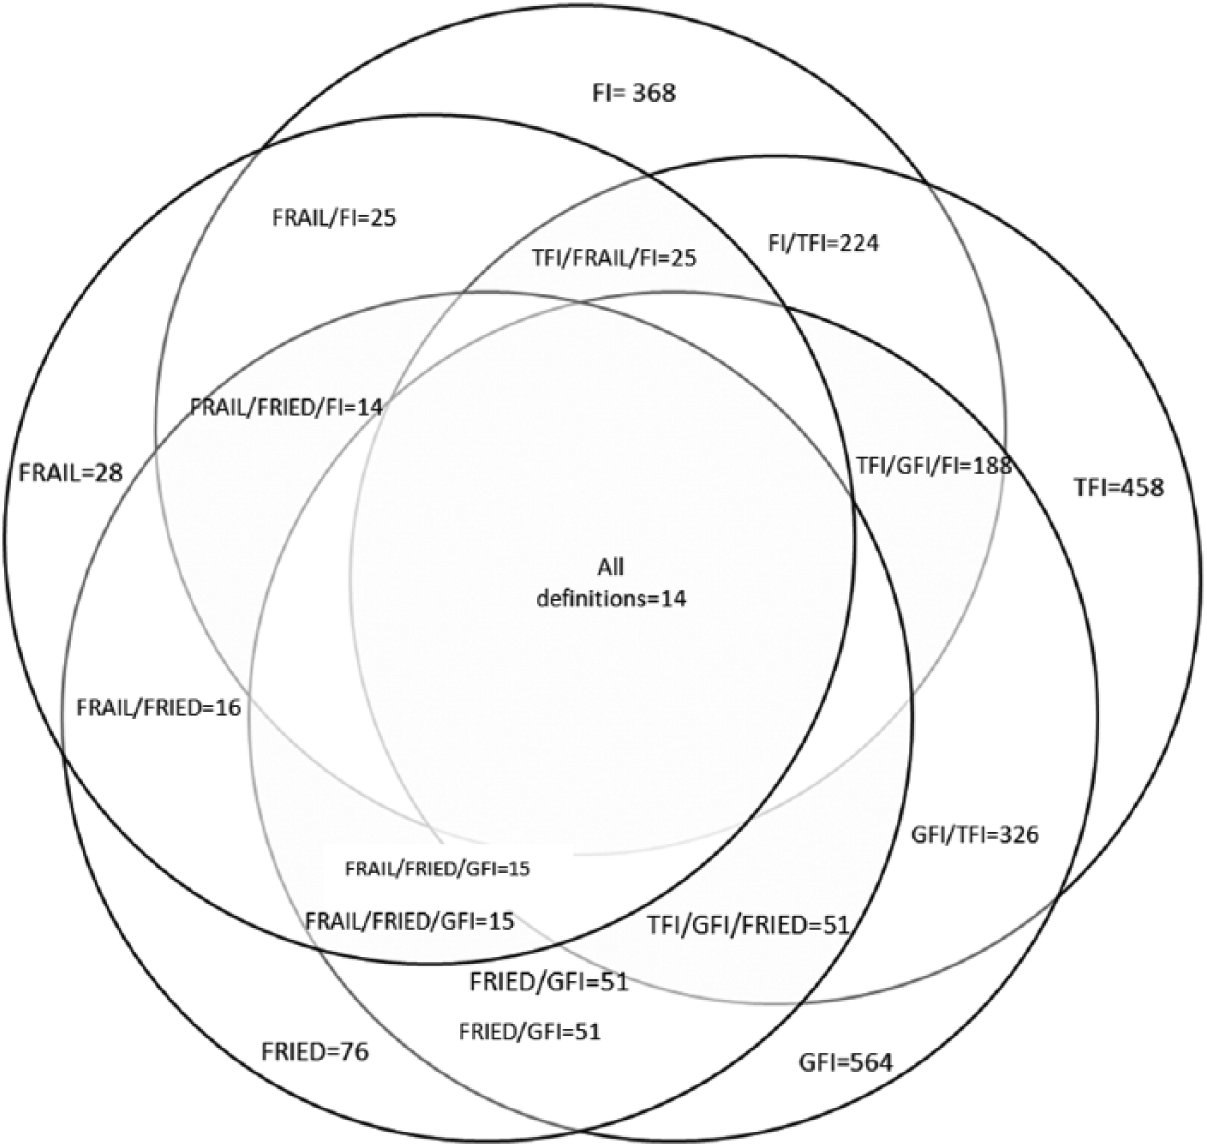
Venn diagram displaying extent of overlap of participants identified as frail according to Fried definition, FRAIL Scale, FI, TFI, and GFI.
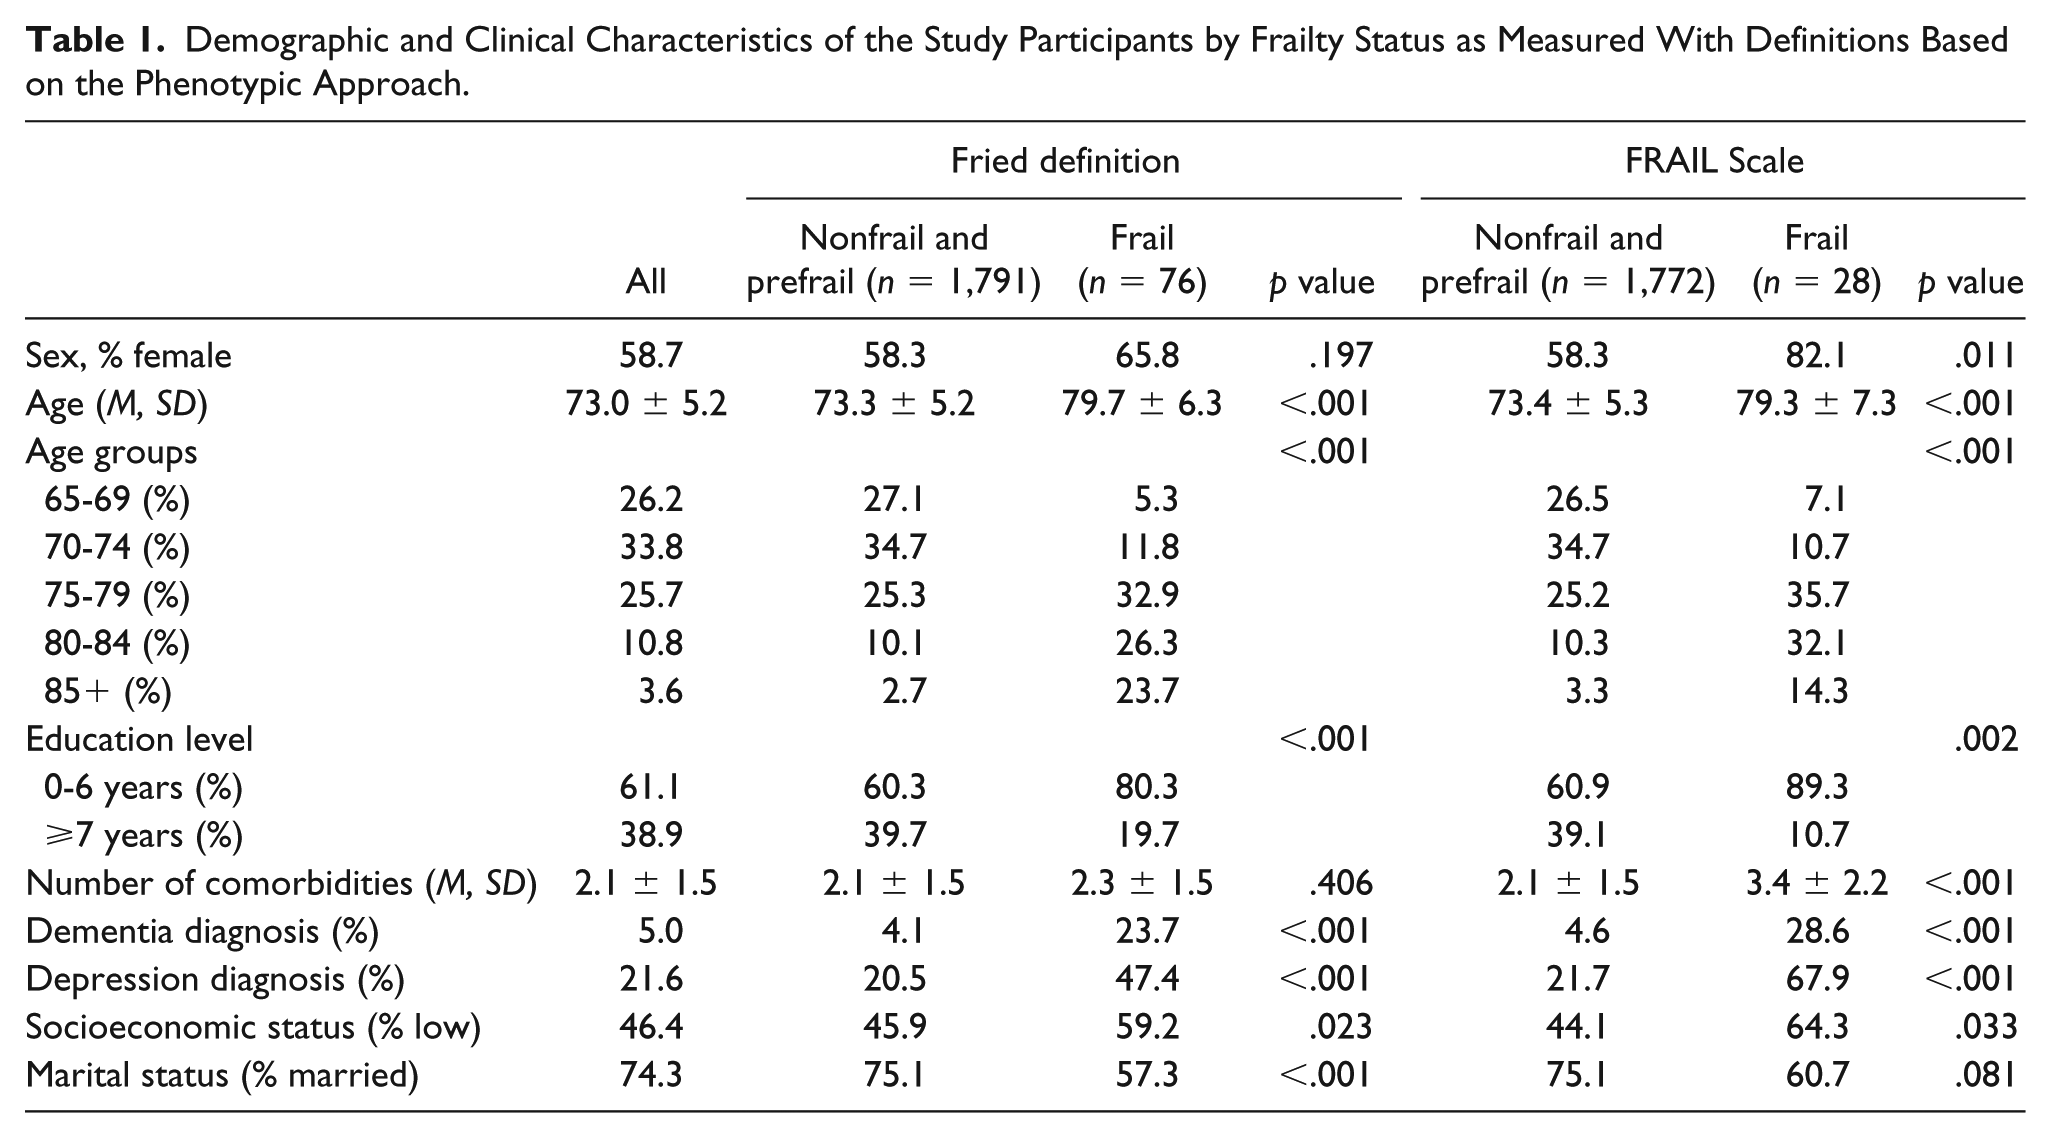
Irrespectively of the definition used, frail participants were older, less educated, more likely female, depressed or demented, of low socioeconomic status, and not married (Tables 1-2). Figure 2 depicts the frailty prevalence rates using different definitions across age groups. Specifically, we observed a statistically significant increase in frailty probability across advancing age groups as adjusted models showed that compared with people aged 65 years to 69 years, those aged 75 years to 79 years or above had significantly higher odds of frailty (Tables 3-4). The greatest effect of age was observed with the Fried definition as, compared with the youngest age group (65-69 years), participants aged 80 years to 84 years and above 85 years had, respectively, 13 and almost 45 times higher odds of being frail.
Demographic and Clinical Characteristics of the Study Participants by Frailty Status as Measured With Definitions Based on the Phenotypic Approach.
Demographic and Clinical Characteristics of the Study Participants by Frailty Status as Measured With Definitions Based on the Multidomain Approach.
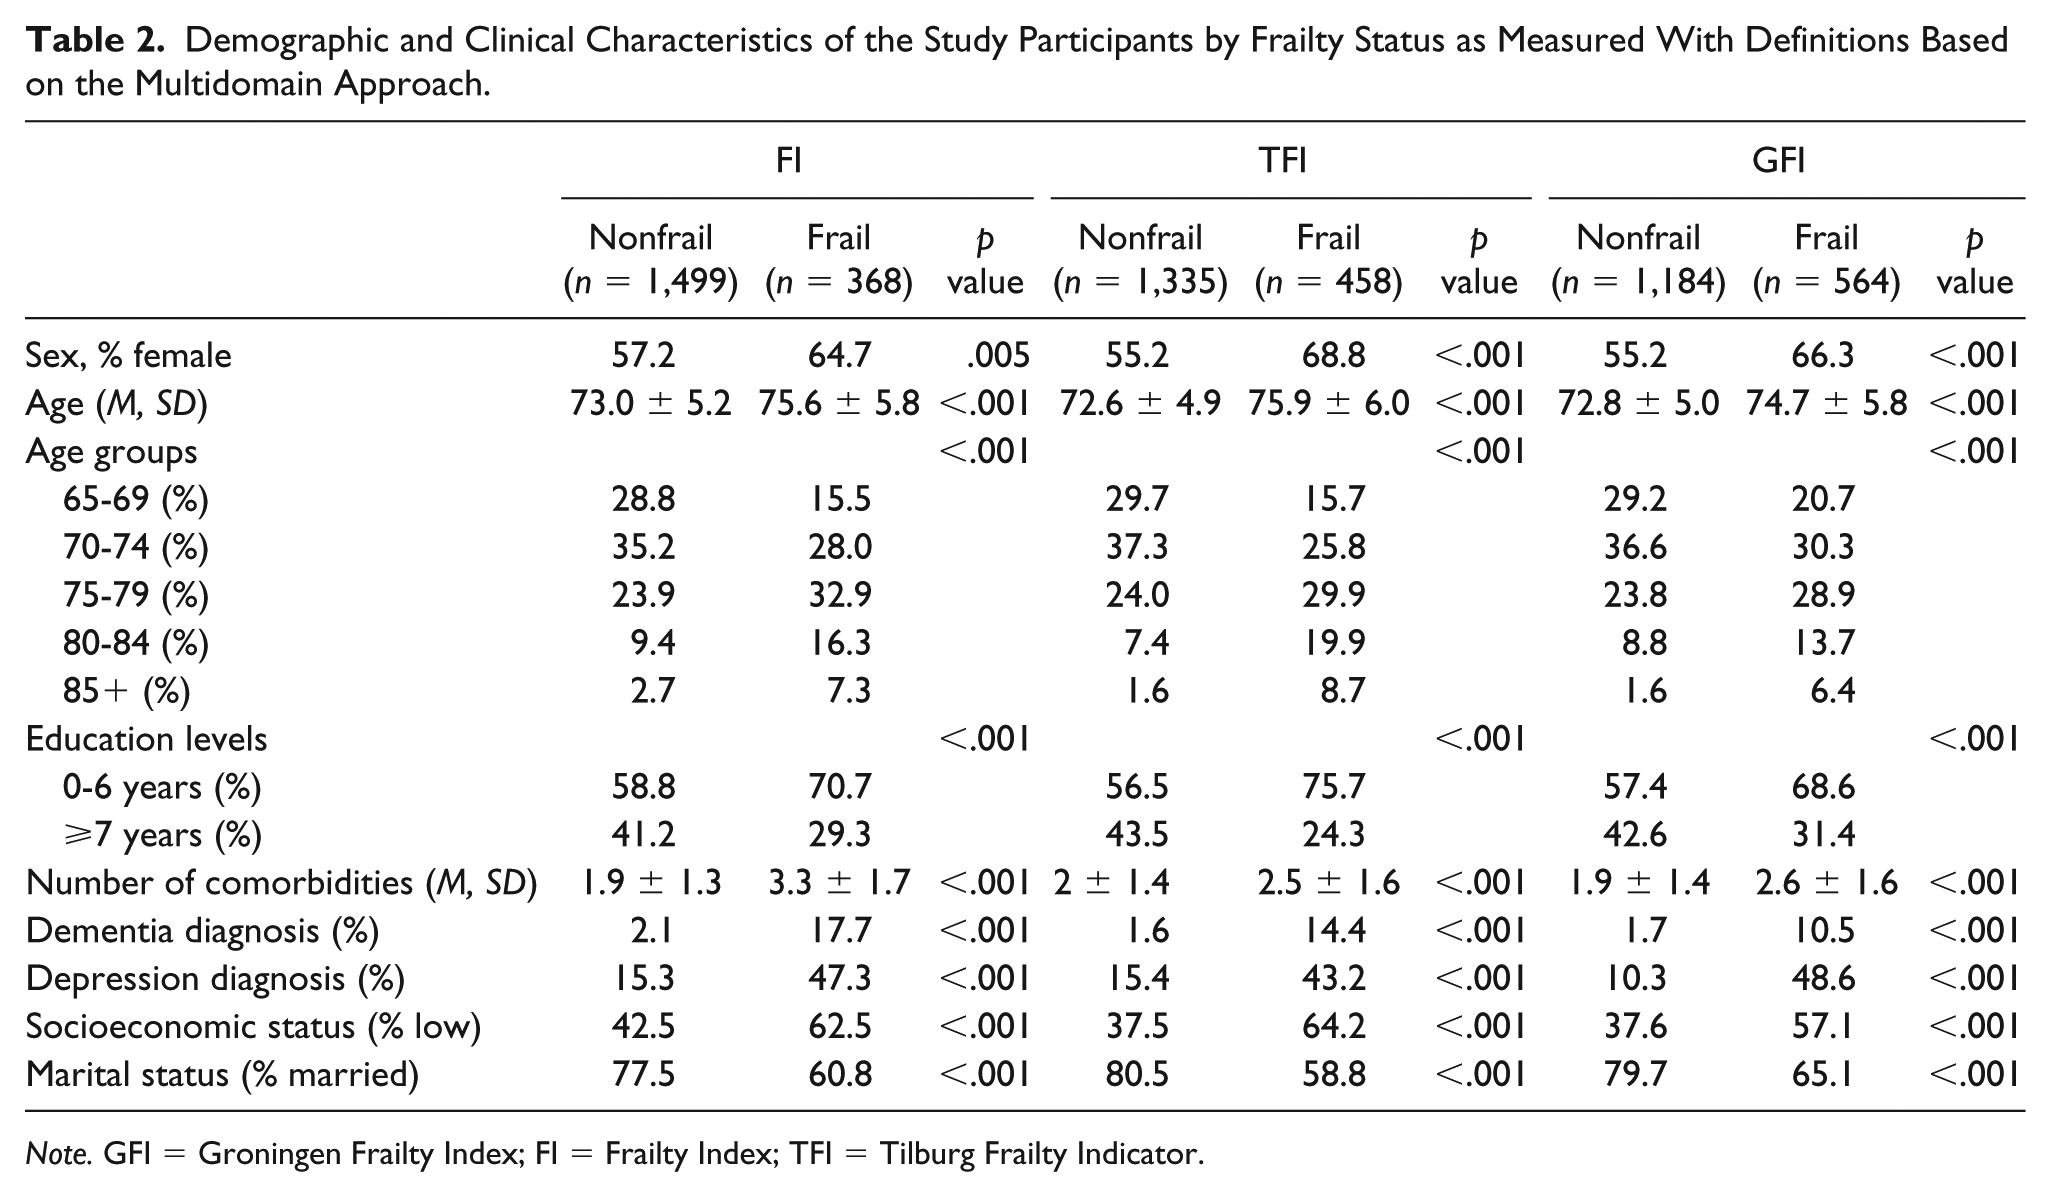
Note. GFI = Groningen Frailty Index; FI = Frailty Index; TFI = Tilburg Frailty Indicator.
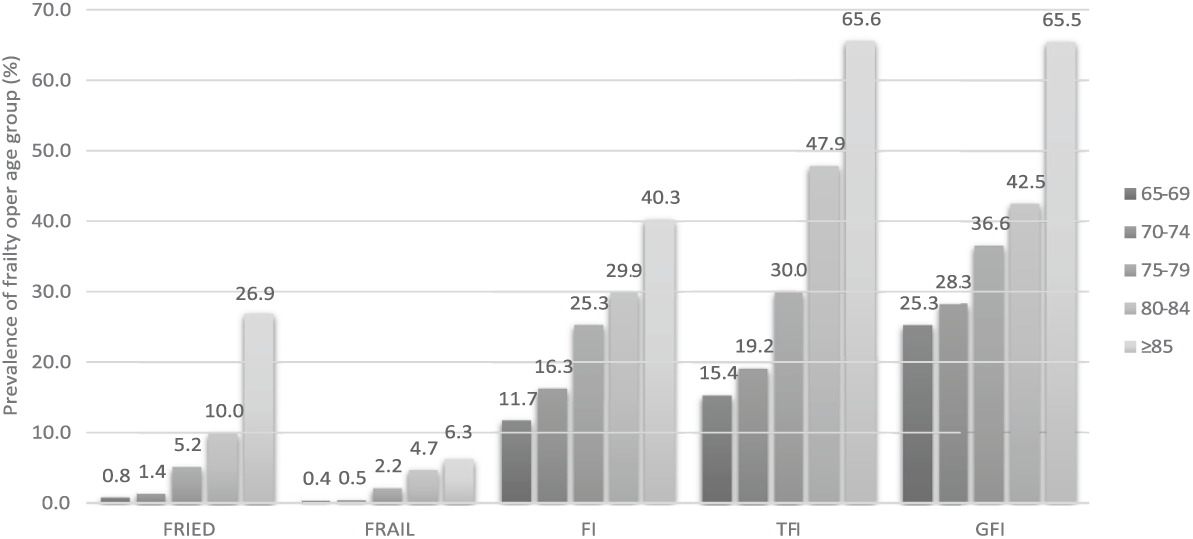
The prevalence of frailty in the population grouped by age and frailty definition.
Results of the Unadjusted Logistic Regression Analysis, Exploring the Effect of Demographic and Clinical Factors on Frailty Prevalence (Measured With the Five Instruments).
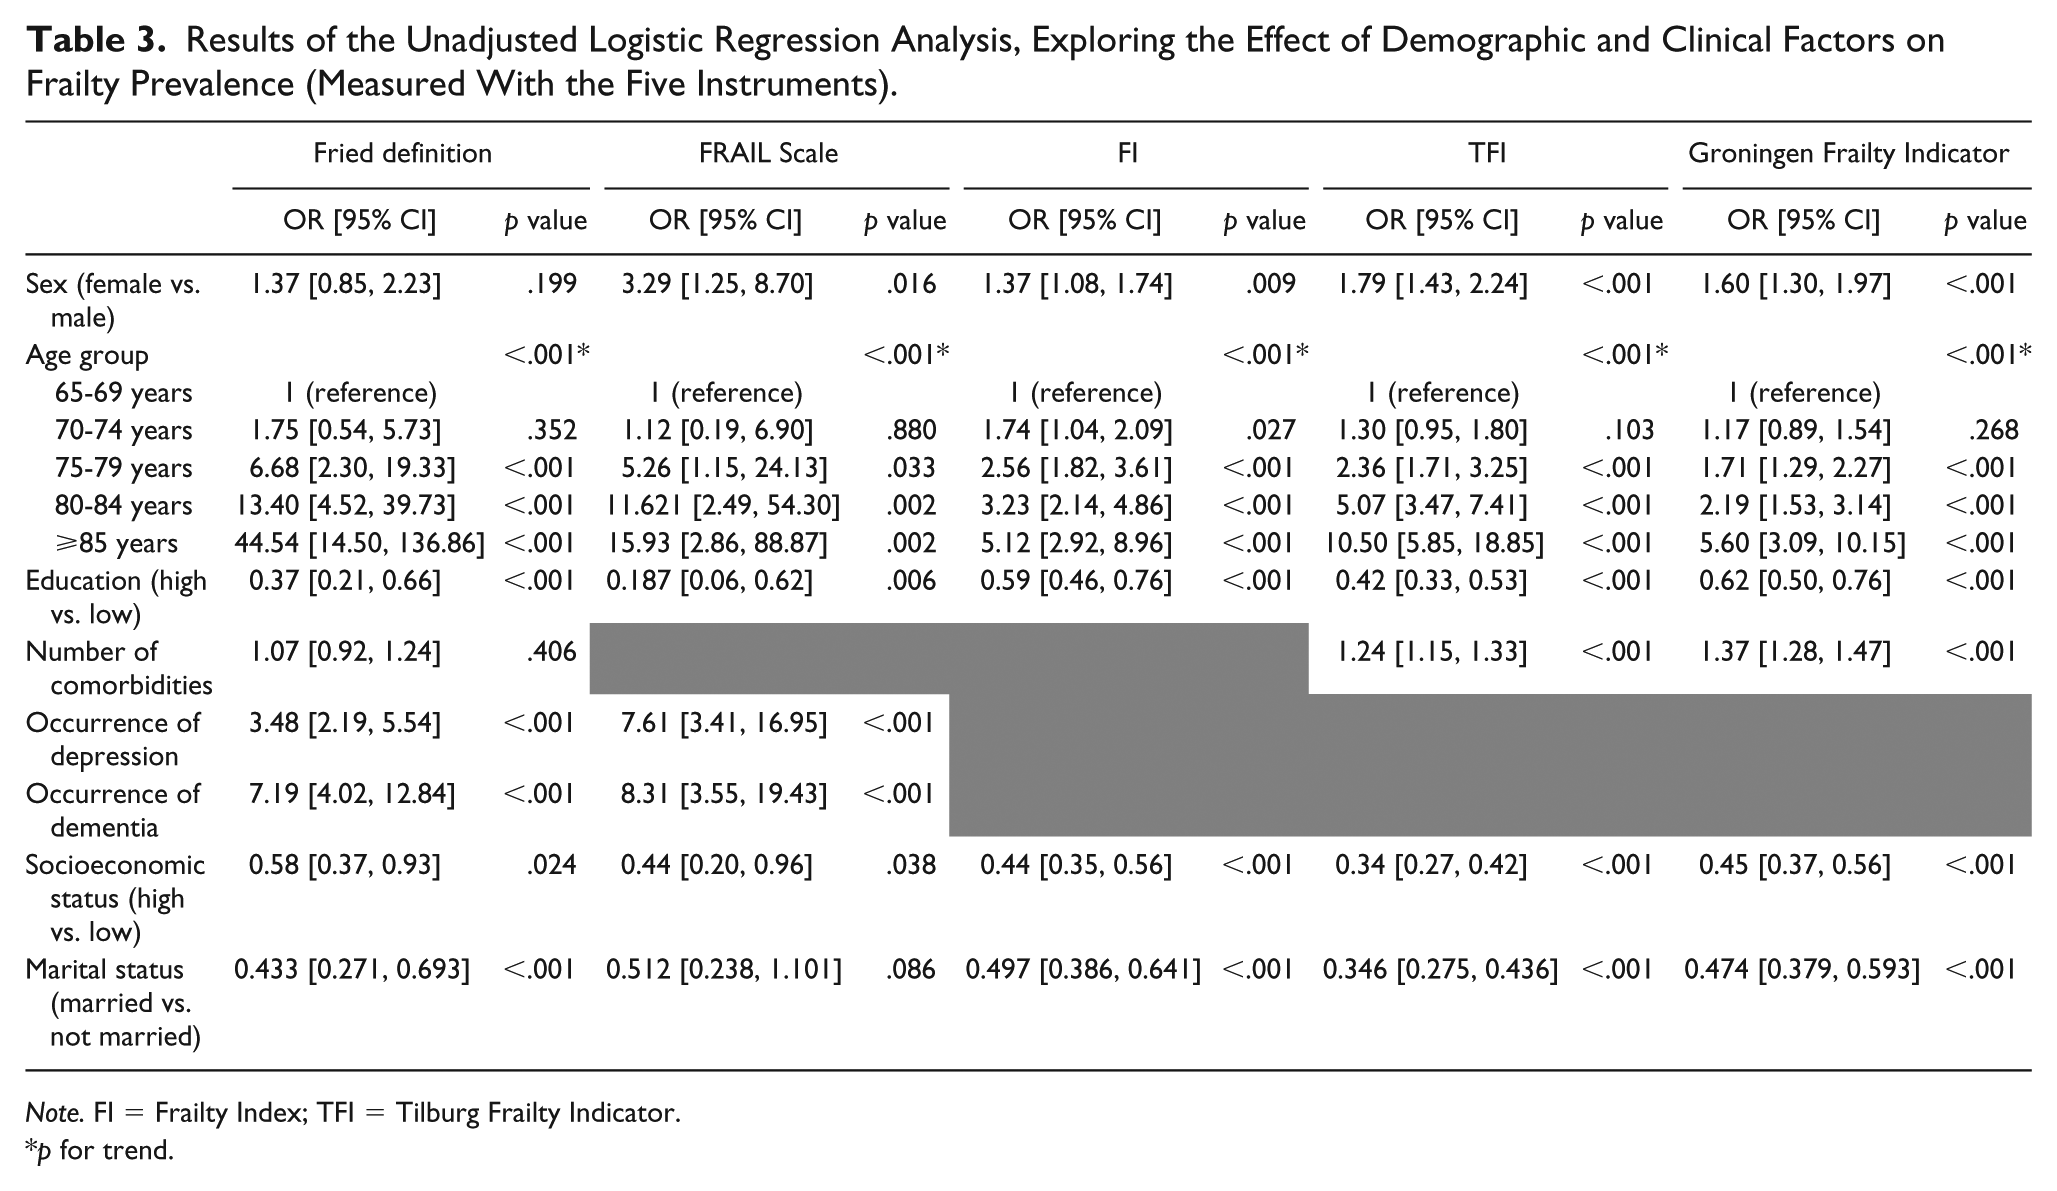
Note. FI = Frailty Index; TFI = Tilburg Frailty Indicator.
p for trend.
Results of the Adjusted Logistic Regression Analysis, Exploring the Effect of Demographic and Clinical Factors on Frailty Prevalence (Measured With the Five Instruments).
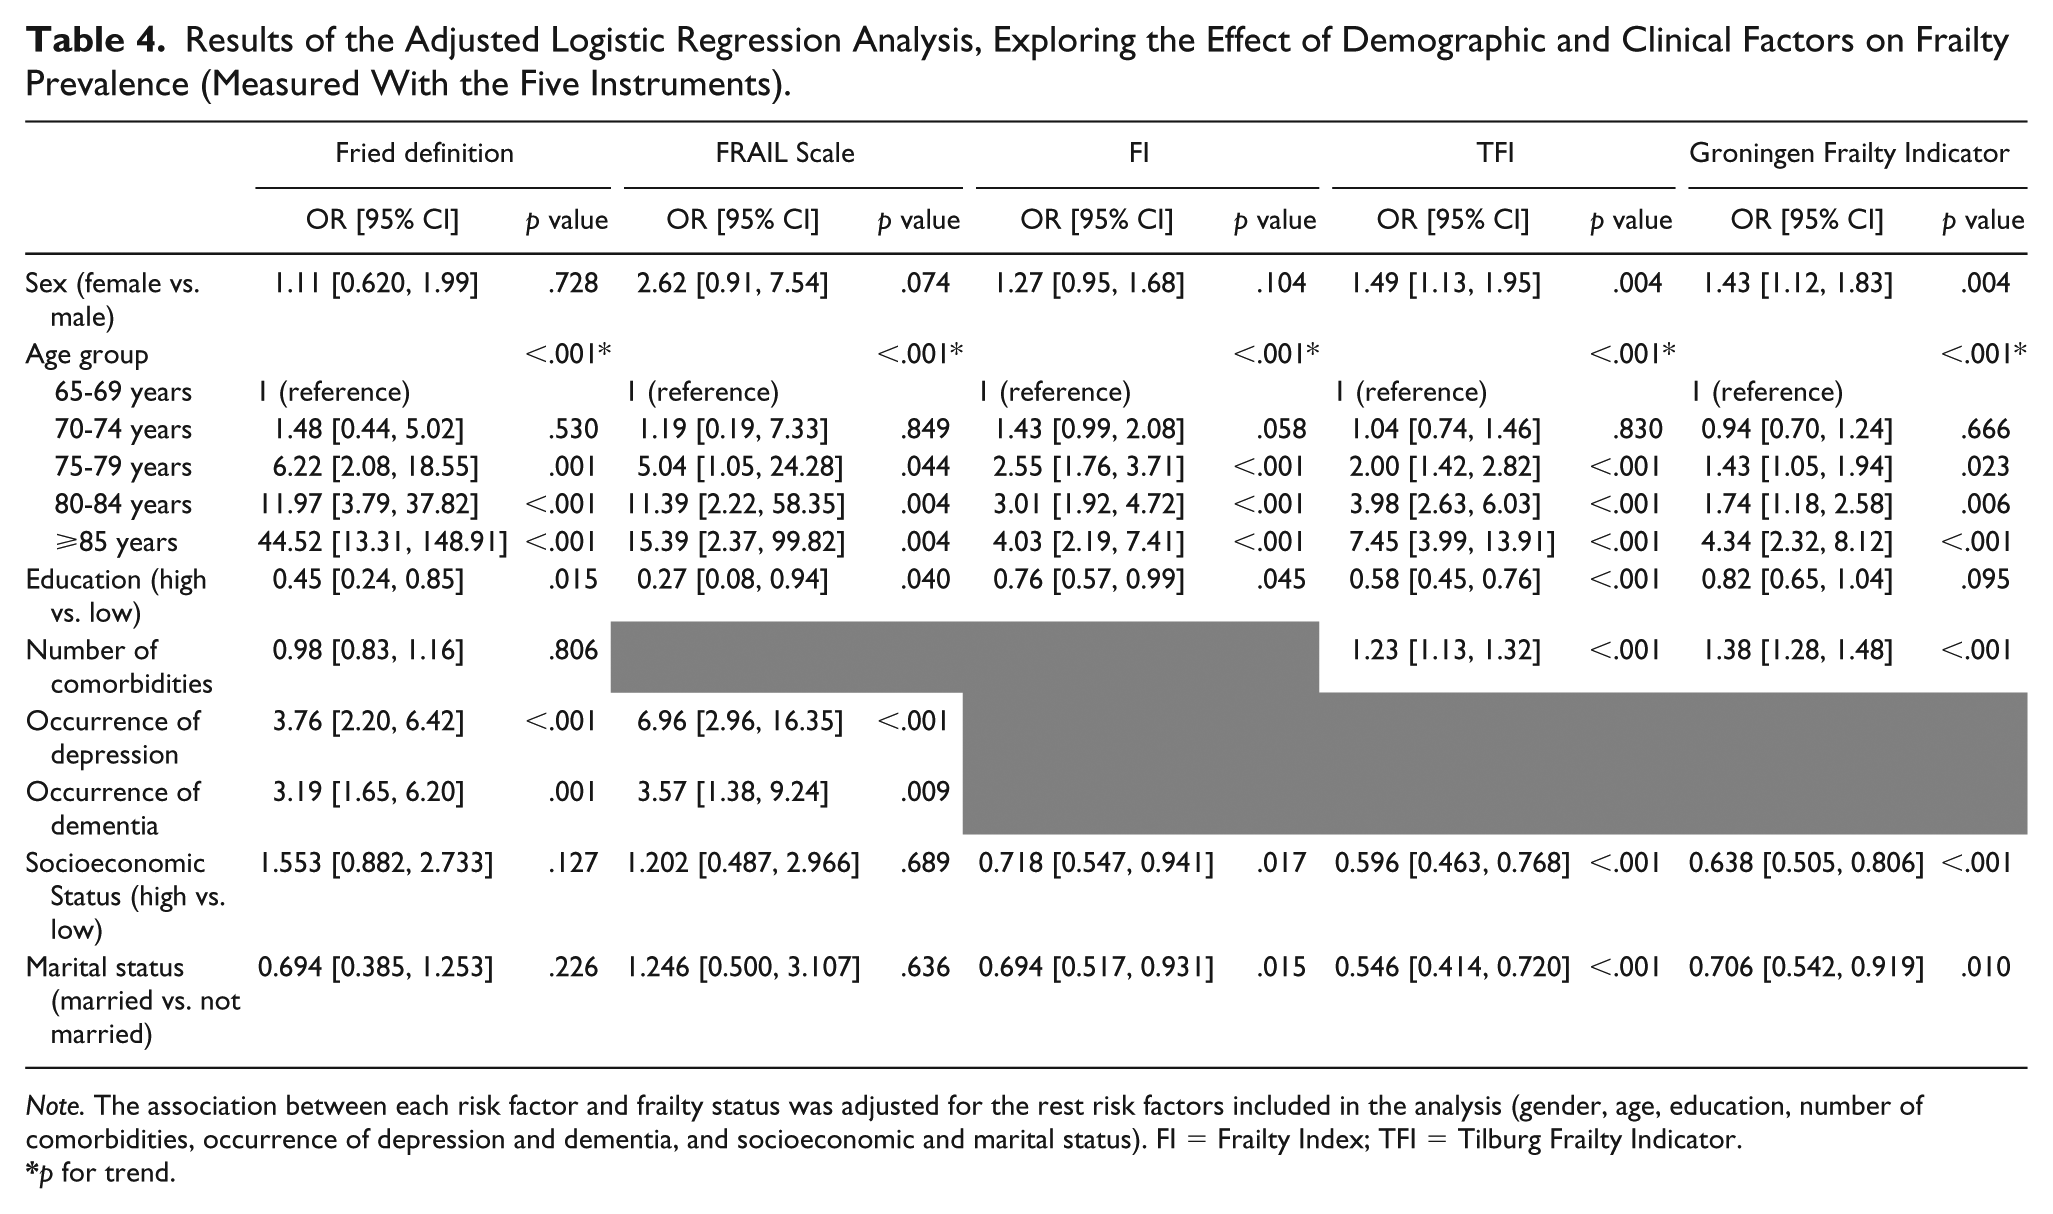
Note. The association between each risk factor and frailty status was adjusted for the rest risk factors included in the analysis (gender, age, education, number of comorbidities, occurrence of depression and dementia, and socioeconomic and marital status). FI = Frailty Index; TFI = Tilburg Frailty Indicator.
p for trend.
Education was associated with frailty status in most definitions. Compared to participants with lower education, participants with more than 7 years of formal education had 55%, 73%, 25%, and 42% lower odds of being frail, as measured with Fried Definition, FRAIL Scale, FI, and TFI, respectively. Moreover, participants with more than 7 years of education had 18% less odds of being frail as measured with the GFI, but this association was not statistically significant. A statistically significant association between sex and frailty was reported for TFI and GFI: women had 1.48 and 1.43 higher odds of being frail, respectively. Regarding the variables of number of comorbidities, socioeconomic and marital status, we observed a discrepancy between the different definitions; these variables were related to frailty syndrome only when frailty was operationalized with multidomain definitions (Table 4). As mentioned above, diagnosis of depression and dementia were considered as frailty risk factors only with Fried definition and FRAIL Scale. Dementia raised the odds of frailty by more than 3 times both for Fried definition and FRAIL Scale. Compared to participants without depression, those reporting moderate to severe depressive symptoms were 3.7 and 6.9 times more likely to be identified as frail with Fried definition and FRAIL Scale, respectively.
Discussion
In the present study, we explored the prevalence of frailty in Greece in a population-based study. Frailty prevalence (as measured with Fried definition) has been previously reported in Greece (Santos-Eggimann et al., 2009); however, as far as we are concerned, our study is the first that evaluated frailty (while also exploring its association with different risk factors) with the use of five different frailty definitions in the same population. As long as no consensus has been reached upon operationalization of frailty, it is worthwhile to examine the prevalence of frailty using different frailty models and making meaningful comparisons between them to provide a comprehensive picture of frailty burden in a given population.
It is generally acceptable that the prevalence of frailty varies tremendously (from 4.0% to 59.1%) depending on the assessment tool used to capture it (Collard et al., 2012). However, studies measuring frailty according to the phenotypic approach consistently report lower frailty prevalence than those following the multidomain definitions. This is also the case in our study, which found the smallest prevalence using the FRAIL Scale (1.5%) and the highest with the GFI (30.2%), similar results with the study of Theou, Brothers, Mitnitski, and Rockwood (2013).
Regarding previous data in Greece, there is only one study that has reported frailty prevalence for Greek community–dwelling older people (Santos-Eggimann et al., 2009). The Survey of Health, Aging and Retirement in Europe (SHARE) measured frailty according to its phenotypic approach and found that 14.7% of the Greek participants aged ⩾65 years were identified as frail. This 10-points higher prevalence of frailty in the SHARE than in HELIAD population may be explained by the different operationalization of the Fried criteria used in the former study. Objective measures of frailty were included only for the criterion of grip strength. Moreover, walking speed was measured only in people aged ⩾75 years old. These elements in combination with the fact that weakness was the only criterion measured identically as proposed by Fried, may have led to an overestimation of frail older people. The different prevalence rate reported in the SHARE study may also be explained in part by the fact that frailty assessment was not conducted by a team of health professionals: It was based on standardized computer-assisted face-to-face personal interviews conducted by trained interviewers.
To make meaningful comparisons, it is necessary to group our findings by definition of frailty used. When Fried criteria were used, our prevalence rate (4.1%) is quite similar to other population-based studies conducted in European countries (Danon-Hersch, Rodondi, Spagnoli, & Santos-Eggimann, 2012; Syddall et al., 2010). The smallest prevalence (2.6%) has been reported in a recent German study (Buttery, Busch, Gaertner, Scheidt-Nave, & Fuchs, 2015) whereas studies conducted in Italy and Spain have reported a higher frailty prevalence (ranging from 7.6% to 9.6%; Cesari et al., 2006; Garcia-Garcia et al., 2011; Jurschik et al., 2012; Solfrizzi et al., 2012).
In the current study the lowest frailty prevalence was obtained for FRAIL Scale (1.5%), lower than those reported elsewhere (Morley et al., 2012; Theou et al., 2013). Regarding the FI, the prevalence found in our study (19.7%) is in agreement with the rate found elsewhere (Song et al., 2010; Theou et al., 2013). Although the other multidomain definitions are less studied, when frailty was measured with the Tilburg FI, our findings (24.5% frailty prevalence) were in accordance with that reported by Theou et al. (2013) but differed from those reported by Metzelthin et al. (2010; 40.2% frailty prevalence; Metzelthin et al., 2010). Finally, regarding Groningen Frailty Indicator, the prevalence found in our study (30.2%) is a bit lower than elsewhere; Theou et al. (2013) found a prevalence of 43.9% and Metzelthin et al. (2010) reported a prevalence rate of 46.3%.
Overall, irrespectively of the definition used, the frailty prevalence reported in our study is similar to or lower than that reported in other population studies conducted in developed countries. Although HELIAD study includes participants aged 65 years to 99 years, the biggest portion of the study population is below 75 years (n = 1,236). This might have resulted in the lower estimates of frailty. Furthermore, considering our previous report of HELIAD study according to which high adherence to Mediterranean Diet was significantly correlated with frailty status (Ntanasi et al., 2017), we hypothesize that the lower frailty prevalence reported in the current study could be partially explained by dietary or other lifestyle behaviors that characterize the Mediterranean way of living (sleep patterns, eating in company, social support, physical activity; Yannakoulia, Kontogianni, & Scarmeas, 2015). Studies in other Mediterranean populations are needed to test and expand our hypothesis.
Regarding the factors influencing the likelihood of frailty, we opted to investigate some of the most common frailty risk factors, that is, sex, age, education, number of comorbidities, occurrence of dementia and depression, socioeconomic and marital status. The role of socioeconomic and marital status was significant only when frailty was measured according to the three multidomain definitions (FI, TFI and GFI). The greater number of people identified as frail with the multidomain definitions (compared to Fried Definition and FRAIL Scale) may contribute to the significant associations observed between socioeconomic, marital status, and frailty. However, we should note that these risk factors were associated with frailty only when the multidomain definitions were used, whereas other variables (such as age and education) were associated with frailty both with multidomain and phenotypic definitions. Thus, a difference in number of frail participants per se may not provide a possible explanation of the above observation. Particularly, for TFI and GFI this result could be attributed to the nature of their criteria, as psychosocial and environmental factors are taken into account. The association between socioeconomic status and various health outcomes (Dalstra et al., 2005) may mediate its relationship with the FI.
The hypothesis that a diagnosis of dementia and/or depressive symptoms contribute to the physical phenotype of frailty has been suggested by others (Avila-Funes et al. 2008; Searle & Rockwood, 2015; Woods et al., 2005) and is also replicated in the current study. Surprisingly, a clear association between number of comorbidities and the frailty status was only observed for the TFI and the GFI, but not for the Fried definition. Our nonsignificant findings are likely the result of the low frailty prevalence reported based on the Fried definition.
Age has been consistently associated with frailty status irrespectively of the definition used (Theou, Brothers, Peña, Mitnitski, & Rockwood, 2014). However, the fact that we applied five different measurements in the same population gave us the opportunity to observe an interesting finding. The effect that age has on frailty varied markedly among the five definitions of frailty; when frailty was measured based on the Fried definition, we noticed an increased age effect that was not found in the analyses with the other measurements. This could be explained by the nature and measurement of the Fried criteria. In this definition, three of the five frailty criteria (low BMI, grip strength, and walking speed) are based on objective measures of frailty, whereas the multidomain definitions are mainly based on self-report. Based on our findings, we suggest that the role of aging is better captured by objective measures of physical activity and functioning.
Moreover, participants with ⩾7 years of education were found to have lower odds of frailty than those in the low education group in most frailty definitions. As educational attainment is a factor closely related to socioeconomic status, we could hypothesize that the association between education and frailty status was mediated by socioeconomic status. However, the fact that education was associated with frailty both in phenotypic and multidomain approaches but socioeconomic status was associated with frailty only in multidomain definitions illustrates that education could be considered as an independent factor of frailty. Although our results should be interpreted with caution, they suggest that nonmedical factors are important in the epidemiology of frailty.
Surprisingly, the repeatedly documented higher prevalence of frailty in women (Collard et al., 2012; Hubbard & Rockwood, 2011) was observed only with the TFI and GFI definitions. The small number of individuals identified as frail with the Fried definition and the FRAIL Scale may not suffice for significant gender differences to be featured, leading to a Type II error. Furthermore, we could hypothesize that some frailty criteria are more common in women and may contribute to the relationship between frailty and gender. For example, in the current study, we found a statistically significant sex difference regarding diagnosis of depression (which is a common criterion in TFI and GFI): there were 301 women versus 103 men with depression. More studies are necessary to investigate if there exists a clear difference between men and women regarding frailty status or the criteria of the measurements used predispose for such a gender difference.
There are some limitations to the present analysis. First, in our attempt to operationalize frailty with five different scales, we modified some of the definitions used. The modified operationalization of the Fried definition’s may be cοnsidered as a shortcoming. However, we believe that even though some parameters were measured using different instruments than those originally proposed by Fried and colleagues, we remained close to the original criteria. Besides, the prevalence rate found in the present report is similar to that reported in other studies using the Fried definition (Syddall et al., 2010). This is also true for the TFI. The fact that we used 13 out of its 15 originally proposed criteria may have led to a misreport in the frailty prevalence. We did, however, use the cutoff score originally proposed in the TFI and participants who met 5 of the 13 criteria were considered frail. Using similar cutoffs and fewer criteria may have led to a stricter frailty definition, but we believe we avoided an overestimation of frail participants that would probably occur from the use of a lower cutoff. Again, comparing our results with those of other studies, we found similar prevalence rates. Moreover, as noted above, the fact that some definitions use mainly objective measures, whereas others use subjective measures of participants’ performance leads to the different perspective of frailty syndrome. In an epidemiological study, such as the HELIAD study, many data are self-reported, and thus their reliability is subject to this type of bias. Finally, regarding the factors associated with frailty status, the current study considered only cross-sectional relationships between participants’ characteristics and frailty and, thus, no cause–outcome association can be established.
On the contrary, the standardized methods used in the HELIAD study and the large amount of information collected for each participant enabled the use of five different definitions for the assessment of frailty, which is one of the major strengths of the present study. The use of both objective and subjective measures of functioning, mobility, physical and psychological condition, presence of impairments, and age-related diseases among older individuals we presume has added to the accuracy of our results. The HELIAD study was based on face-to-face interviews that were conducted by specialized neurologists, neuropsychologists, and dieticians. This may have augmented the accuracy of our measurements of all criteria used in the five frailty definitions. Moreover, the comprehensive neuropsychological battery (performed for each participant) and the team consensus regarding diagnoses assured the accurate identification of participants with cognitive decline. Furthermore, the study’s population-based design and its large sample size enable the generalization of our findings in the Greek population.
Summary
This study presents the prevalence of frailty in a population of Greek community–dwelling older adults, using both phenotypic and multidomain frailty measurements. It also explores the association between frailty definitions and different known risk factors. Further research should be directed toward prospective studies, investigating the impact of different physical, social, and psychological factors that may contribute to the development of frailty.
Supplemental Material
Supplementary_Table – Supplemental material for Prevalence and Risk Factors of Frailty in a Community-Dwelling Population: The HELIAD Study
Supplemental material, Supplementary_Table for Prevalence and Risk Factors of Frailty in a Community-Dwelling Population: The HELIAD Study by E. Ntanasi, M. Yannakoulia, N. Mourtzi, G. S. Vlachos, M. H. Kosmidis, C. A. Anastasiou, E. Dardiotis, G. Hadjigeorgiou, M. Megalou, P. Sakka and N. Scarmeas in Journal of Aging and Health
Footnotes
Declaration of Conflicting Interests
The authors declared no potential conflicts of interest with respect to the research, authorship, and/or publication of this article.
Funding
The authors disclosed receipt of the following financial support for the research, authorship, and/or publication of this article: HELIAD study was supported by the Grants IIRG-09-133014 from the Alzheimer’s Association, 189 10276/8/9/2011 from the ESPA-EU program Excellence Grant (ARISTEIA), and the ΔΥ2β/οικ.51657/14.4.2009 of the Ministry for Health and Social Solidarity (Greece). Costas A. Anastasiou has received financial support from the Greek State Scholarships Foundation (MIS:5001552).
Supplemental Material
Supplemental material is available for this article online.
References
Supplementary Material
Please find the following supplemental material available below.
For Open Access articles published under a Creative Commons License, all supplemental material carries the same license as the article it is associated with.
For non-Open Access articles published, all supplemental material carries a non-exclusive license, and permission requests for re-use of supplemental material or any part of supplemental material shall be sent directly to the copyright owner as specified in the copyright notice associated with the article.