



Abstract
Introduction
Although among older adults, age has been found to be positively associated with rates of poor health and activity limitations, disability is not an inevitable result of aging, but can be modified by social, medical, and behavioral interventions (Centers for Disease Control and Prevention, 2014; Freedman et al., 2002; Schoeni et al., 2008). As population aging occurs rapidly worldwide, there is a growing interest in the role of leisure activities in preventing or postponing the onset of disability among older adults (Iwasaki & Schneider, 2003; Strain et al., 2002; Tak et al., 2013; Zawadzki et al., 2015). Even though the protective effects of leisure activities have been well documented in both Western and non-Western settings, less known is whether leisure activities may flatten the incidence curve of disability over time and whether its presence with other covariates can ameliorate the deteriorate effect of age. Based on a 12 year longitudinal survey of Chinese older adults, this study adopts a latent growth curve analysis (LGCA) approach to investigate whether there is a double jeopardy effect of age on the incidence trajectory of disability, how physical and social leisure activities may counteract the shape of such a trajectory, and whether the double jeopardy effect of age can be alleviated when leisure activities and other factors are taken into account.
With virtually no exception, age has been found to be associated with elevated likelihood of disability, either in the form of a higher incidence rate from a hazards model or a higher odds ratio from a random effect model (Chen et al., 2015; Feng et al., 2013; Li et al., 2019). However, between-person comparison by age may reflect cohort differences instead of true dynamics of aging (Chiu & Wray, 2010). To assess the role of aging, it is essential to directly measure change over time for the same individuals, that is, intraindividual change in terms of initial level and rate of change (Alwin & Campbell, 2001).
With the availability of longitudinal measurements of the same persons, it is possible to adopt time-based modeling to test whether the association between age and incidence of disability simply evolves over time (Alwin et al., 2006) or whether the rate of change depends on the initial age of onset. For example, if we track two age cohorts of older adults over a 10 year period, one aged 65 years and one 85 years at the beginning, will the older cohort, over time, exhibit a faster growth rate of disability? In other words, is there a double jeopardy for older adults, that is, not only are they, on average, at a higher risk of disability but also on a faster track to develop it? Findings from studies that adopted the within-person approach on this subject are inconclusive. While older ages were associated with steeper slopes of disability over time among older Taiwanese (Chen et al., 2016; Liang et al., 2010), they were insignificant in affecting the slopes of physical limitations in a US sample (Thomas, 2011). Initial age was found not to be associated with the rate of increase in disability among those with spinal cord injury in a US 13 year study (Rodakowski et al., 2014). Furthermore, all the studies above are on the level of disability. Basic questions that have not been directly explored are addressed in this study: (1) does initial age matter in terms of the growth rate of the incidence of disability? Or, do older adults face a double jeopardy, in that their health deteriorates faster than their younger peers over time? (2) Will such trajectories change when between-person heterogeneities, such as engaging in leisure activities, are taken into account?
Leisure activities are freely selected, personally motivated behaviors that are rewarding and enjoyable (Zawadzki et al., 2015). Individuals engaging in these activities experience empowerment and positive attitudes, and often feel refreshed with renewed energy, which helps to cope with constraints and stressful daily challenges (Iwasaki & Schneider, 2003). Participants in leisure activities from an ecological momentary assessment study reported in real time more positive mood, less stress, and better cardiovascular functioning (Zawadzki et al., 2015).
In this study, we investigate physical and social activities separately. Regular physical activities have been recognized to benefit older adults’ health (Thompson et al., 2012). Although less intense than sports or vigorous exercises, leisure activities, such as housework and gardening, have been found beneficial to health and survival (Woodcock et al. 2011; Zawadzki et al., 2015) and could postpone the onset of disability (Strobl et al., 2014). Older adults engaging in social activities, including getting together with friends and attending social functions, receive multidimensional benefits: greater social support, more information on health behaviors and access to health care, stronger feeling of social acceptance, and increased self-esteem and sense of belonging (Berkman et al., 2000; Caldwell, 2005; Holmes & Joseph, 2011). Positive social interactions were found to be associated with lower levels of stress hormones, decreased cardiovascular activity, and boosted immune function (Seeman, 2000). Higher levels of social activity were found to be related to better health and lower decline of functioning (Avlund et al., 2004; Bath & Deeg, 2005).
While leisure activities have been found to be associated with lower risk of disability in both Western and non-Western settings, including China, many of these findings were derived from between-person comparisons, that is, those who engaged in such activities were found to have a lower probability or hazard rate of disability than those who did not (Gao et al., 2018; Kanamori et al. 2014; Matsunaga et al., 2017; Zawadzki et al., 2015). These analyses did not describe how disability develops over time within individuals and how the heterogeneity of such developmental trajectories is associated with different levels of engagement in leisure activities. Of those that adopted the LGCA approach and directly assessed the impact of leisure activities on disability or physical impairment, Thomas (2011), using data from the Americans’ Changing Lives survey, found that among adults aged 60 years and older, those who had trajectories of high and increasing social engagement experienced lower levels of physical limitations over time. Another study found that receiving tangible support from a religious congregation was associated with a slower decline in level of disability (Hayward & Krause, 2013). Research based on the Taiwan Longitudinal Study on Aging has shown that both the level of leisure activities at baseline and the rate of their change affect the growth rate of disability level (Chen et al., 2016). These findings point to a double benefit of engaging in leisure activities: not only is such an engagement associated with a lower initial level of disability but also a slower rate of growth. However, all of these studies used the level of disability as the outcome variable. The incidence of disability, however, has not been investigated often in the same fashion. As the preliminary analysis of this study shows, more than half of the older adults in the Chinese national sample did not report any disability in any time of the survey. This study investigates the trajectory of the incidence of disability over time.
In sum, this study adopts a generalized linear mixed model (Littell et al. 2006), a subtype of LGCA to analyze discrete outcomes, to explore the following research questions. First, we test the double jeopardy effect of age on the incidence trajectory of disability among Chinese older adults. Second, we test the double benefit of leisure activities in the same fashion, where physical and social activities are first modeled separately to examine whether they carry similar weight in affecting the trajectory of disability (Chen et al., 2016). Finally, we investigate whether the shape of disability trajectories by age changes when engagement in leisure activities and other covariates are taken into account.
Data and Method
This study uses data from five waves of the Chinese Longitudinal Healthy Longevity Survey (CLHLS) from 2002 to 2014, where 16,064 older adults aged 65 years or above were initially interviewed at baseline in 2002 and reinterviewed at 3 year intervals (2005, 2008, 2011, and 2014). At the end of the 12 year follow up, 10,294 or 64.1% of the initial sample had died and 4089 or 25.5% were lost to follow-up at different points of time. At each time, the death rate was between 28.2% and 36.6%, and between 4.6% and 17.9% were lost to follow-up. For those who died, a family member was interviewed and provided information about disability status of the deceased before death. The analysis is limited to those aged between 65 years and 105 years. Systematic assessments of the CLHLS indicate that the data quality is good (Gu, 2008; Zeng & Gu, 2008).
Measures
In line with the disablement process framework (Verbrugge & Jette, 1994), the dependent variable, disability status, is measured by a binary variable of whether having difficulty in performing any of the six activities of daily living (ADL), which include bathing, dressing, eating, indoor transferring, toileting, and continence. If assistance was needed in any of the six activities, a respondent was coded as disabled, otherwise, nondisabled.
Physical activities comprise four activities: housework, gardening, raising domestic animals, and other outdoor activities. Social activities are measured by two activities: playing cards or mahjong and taking part in organized activities. Each activity is scored at five levels: 0 = never, 1 = not every month but sometimes, 2 = not every week but at least once a month, 3 = not everyday but at least once a week, and 4 = almost everyday. Indexes are created by summing the scores of specific activities within each domain and range from 0 to 16 for physical activities and from 0 to 8 for social activities. In the end, these two indexes were combined to generate an overall leisure activities index (0–24).
The following four measures of health status are controlled in this study. (1) Physical performance is measured by whether the respondent could independently perform the following six activities: pick up a book from the floor from a standing position, turn around 360°, stand up from a chair, walk continuously for 1 km, lift a weight of 5 kg, and crouch and stand up three times continuously. Each item is coded 1 for yes and 0 for no, for an index of 0–6. (2) The total number of diseases that the respondent was suffering from is measured by asking respondents to say which of 22 diseases they suffered, including hypertension, diabetes, and heart disease. Only those diseases that the respondent acknowledged that had been medically diagnosed counted. (3) Cognitive function is measured by the Mini-Mental Status Examination (MMSE), which covers five aspects of cognitive functioning with originally 30 specific items: orientation, registration, attention and calculation, recall, and language. Since five items are only available in 2002, the MMSE is eventually measured by 25 items with an index ranging from 0 to 25 with higher scores suggesting better cognitive function. (4) Self-rated health is coded with five levels: 0 = very bad, 1 = bad, 2 = so so, 3 = good, and 4 = very good.
Of the sociodemographic variables, age at the baseline year of 2002 is used. Gender is coded as 0 = female and 1 = male. Because about 62% of the elderly in this sample reported 0 years of schooling, educational attainment is categorized as a binary variable: 0 = illiterate and 1 = literate. Place of residence is coded with three categories: rural, town, and city. Marital status is coded as a dummy variable: 0 = not currently married and 1 = currently married. Living arrangements are coded into three categories: living alone or with spouse only, living with others in the household, and living in a nursing home. Whether the elderly has sufficient income to cover daily expenses is measured by 0 = no or 1 = yes, as is whether the elderly receives adequate medical services when sick. There are three categories for the question of how the respondents rate their economic status in comparison with others in the local area: richer, average, and poorer. Two variables focus on the respondent’s former occupation: whether they did regular labor in the past (0 = no or 1 = yes) and whether the primary occupation before age 60 years was in the agricultural sector (0 = no or 1 = yes). Of other lifestyle covariates, two dummy variables on physical exercise are included: whether the respondent regularly exercises at the time of interview and in the past (0 = no or 1 = yes). There are two similar variables for smoking and drinking, respectively. Each is coded in the same way.
Most of the independent variables vary from wave to wave. Exceptions are initial age at baseline, sex, education, employment sector, past labor experience, and past behaviors in smoking, drinking, and exercising. While the time-invariant variables are kept constant over time, the values of those time-varying variables may change from one wave to another.
Statistical Method
In order to address the issue of causal reciprocity, where people who are physically or socially active may be in better health status to begin with (Strain et al., 2002; Wendel-Vos et al., 2004), in addition to controlling for physical and cognitive health as introduced above, we adopt a time-lag approach with the data. We use all time-varying independent variables from a given time, starting from Time 1, to predict the disability status in the following time, starting from Time 2. Thus, the entire analysis will involve four time-lag intervals, Time 1 → Time 2, Time 2 → Time 3, Time 3 → Time 4, and Time 4 → Time 5. Disability status in the first time was included in all prediction equations as a baseline covariate.
Due to this design, at the minimum, individuals need to have information on disability at Time 2, either survived to Time 2 or were reported dead and had information provided by relatives. For the following analysis, each individual record is transformed to multiple time-lag records depending on the person’s presence throughout the follow-ups. Multiple imputation is used to deal with all missing values in this analysis (Allison, 2001). In the end, there are 15,798 cases at baseline and 30,544 records in total for all four time lags.
This study adopts the LGCA to model trajectories of the incidence of disability over time. Also known as hierarchical modeling (George, 2009), this approach analyzes the outcome at two levels. Level 1 is the intraindividual model, where the outcome is modeled as a function of time, which could take on a variety of polynomial forms. Level 2 is the interindividual model, where each coefficient from level-1 equation can be modeled as a function of person-level characteristics to examine how personal traits could affect the effects of time on the final outcome (disability status in this study). In this analysis, time-varying independent variables, including time and leisure activities, are in level-1 equation. The modification of leisure activities on the effects of time is through their interaction effects (in both linear and quadratic forms). Time invariant independent variables are in level-2 equations. The linear and quadratic slopes are modeled as a function of initial age. All other time invariant covariates are in the equation modeling the intercept. (See Appendix A for more details) One advantage of this approach is that, because the maximum likelihood is involved in the estimation, all respondents’ records can be incorporated, including those who do not have complete records for all the times (Raudenbush & Bryk, 2002). To account for this possible issue of sample selection, following the common practice in the literature, we introduce two dummy variables as attrition indicators of being lost to follow-up due to either death or nonresponse (Liang et al., 2010; Warner & Brown, 2011; Yang & Lee, 2009), and weight is not used in the analysis. Since the outcome is the transition to the disabled status, which is a binary outcome (being disabled or not), a generalized linear mixed model is applied with a logit link function. Since preliminary results suggest that the quadratic form of time with a random intercept fits the data best, we will present the results following such a specification.
After presenting the descriptive statistics of the whole sample we will present results from the LGCA regressions in four steps. Model 1 will present results of the basic model with time and initial age. Disability status at baseline and the two status indicators will be controlled. Physical activities and all other covariates will be added in Model 2. Social activities will replace physical activities in Model 3. Model 4 will present the results when physical and social activities are combined. In the end, we will calculate the predicted probability of being disabled based on the regression estimates and present figures of how such a probability changes over time by age and by the engagement level in leisure activities.
Results
Descriptive Statistics of the Whole Sample (N = 30,544). a

aTotal number of observations.
bThe mean and SD (in parentheses) are provided for continuous variables.
Trajectories of the Incidence of Disability: Original Coefficients of the Generalized. Linear Mixed Models (N = 30,544). a
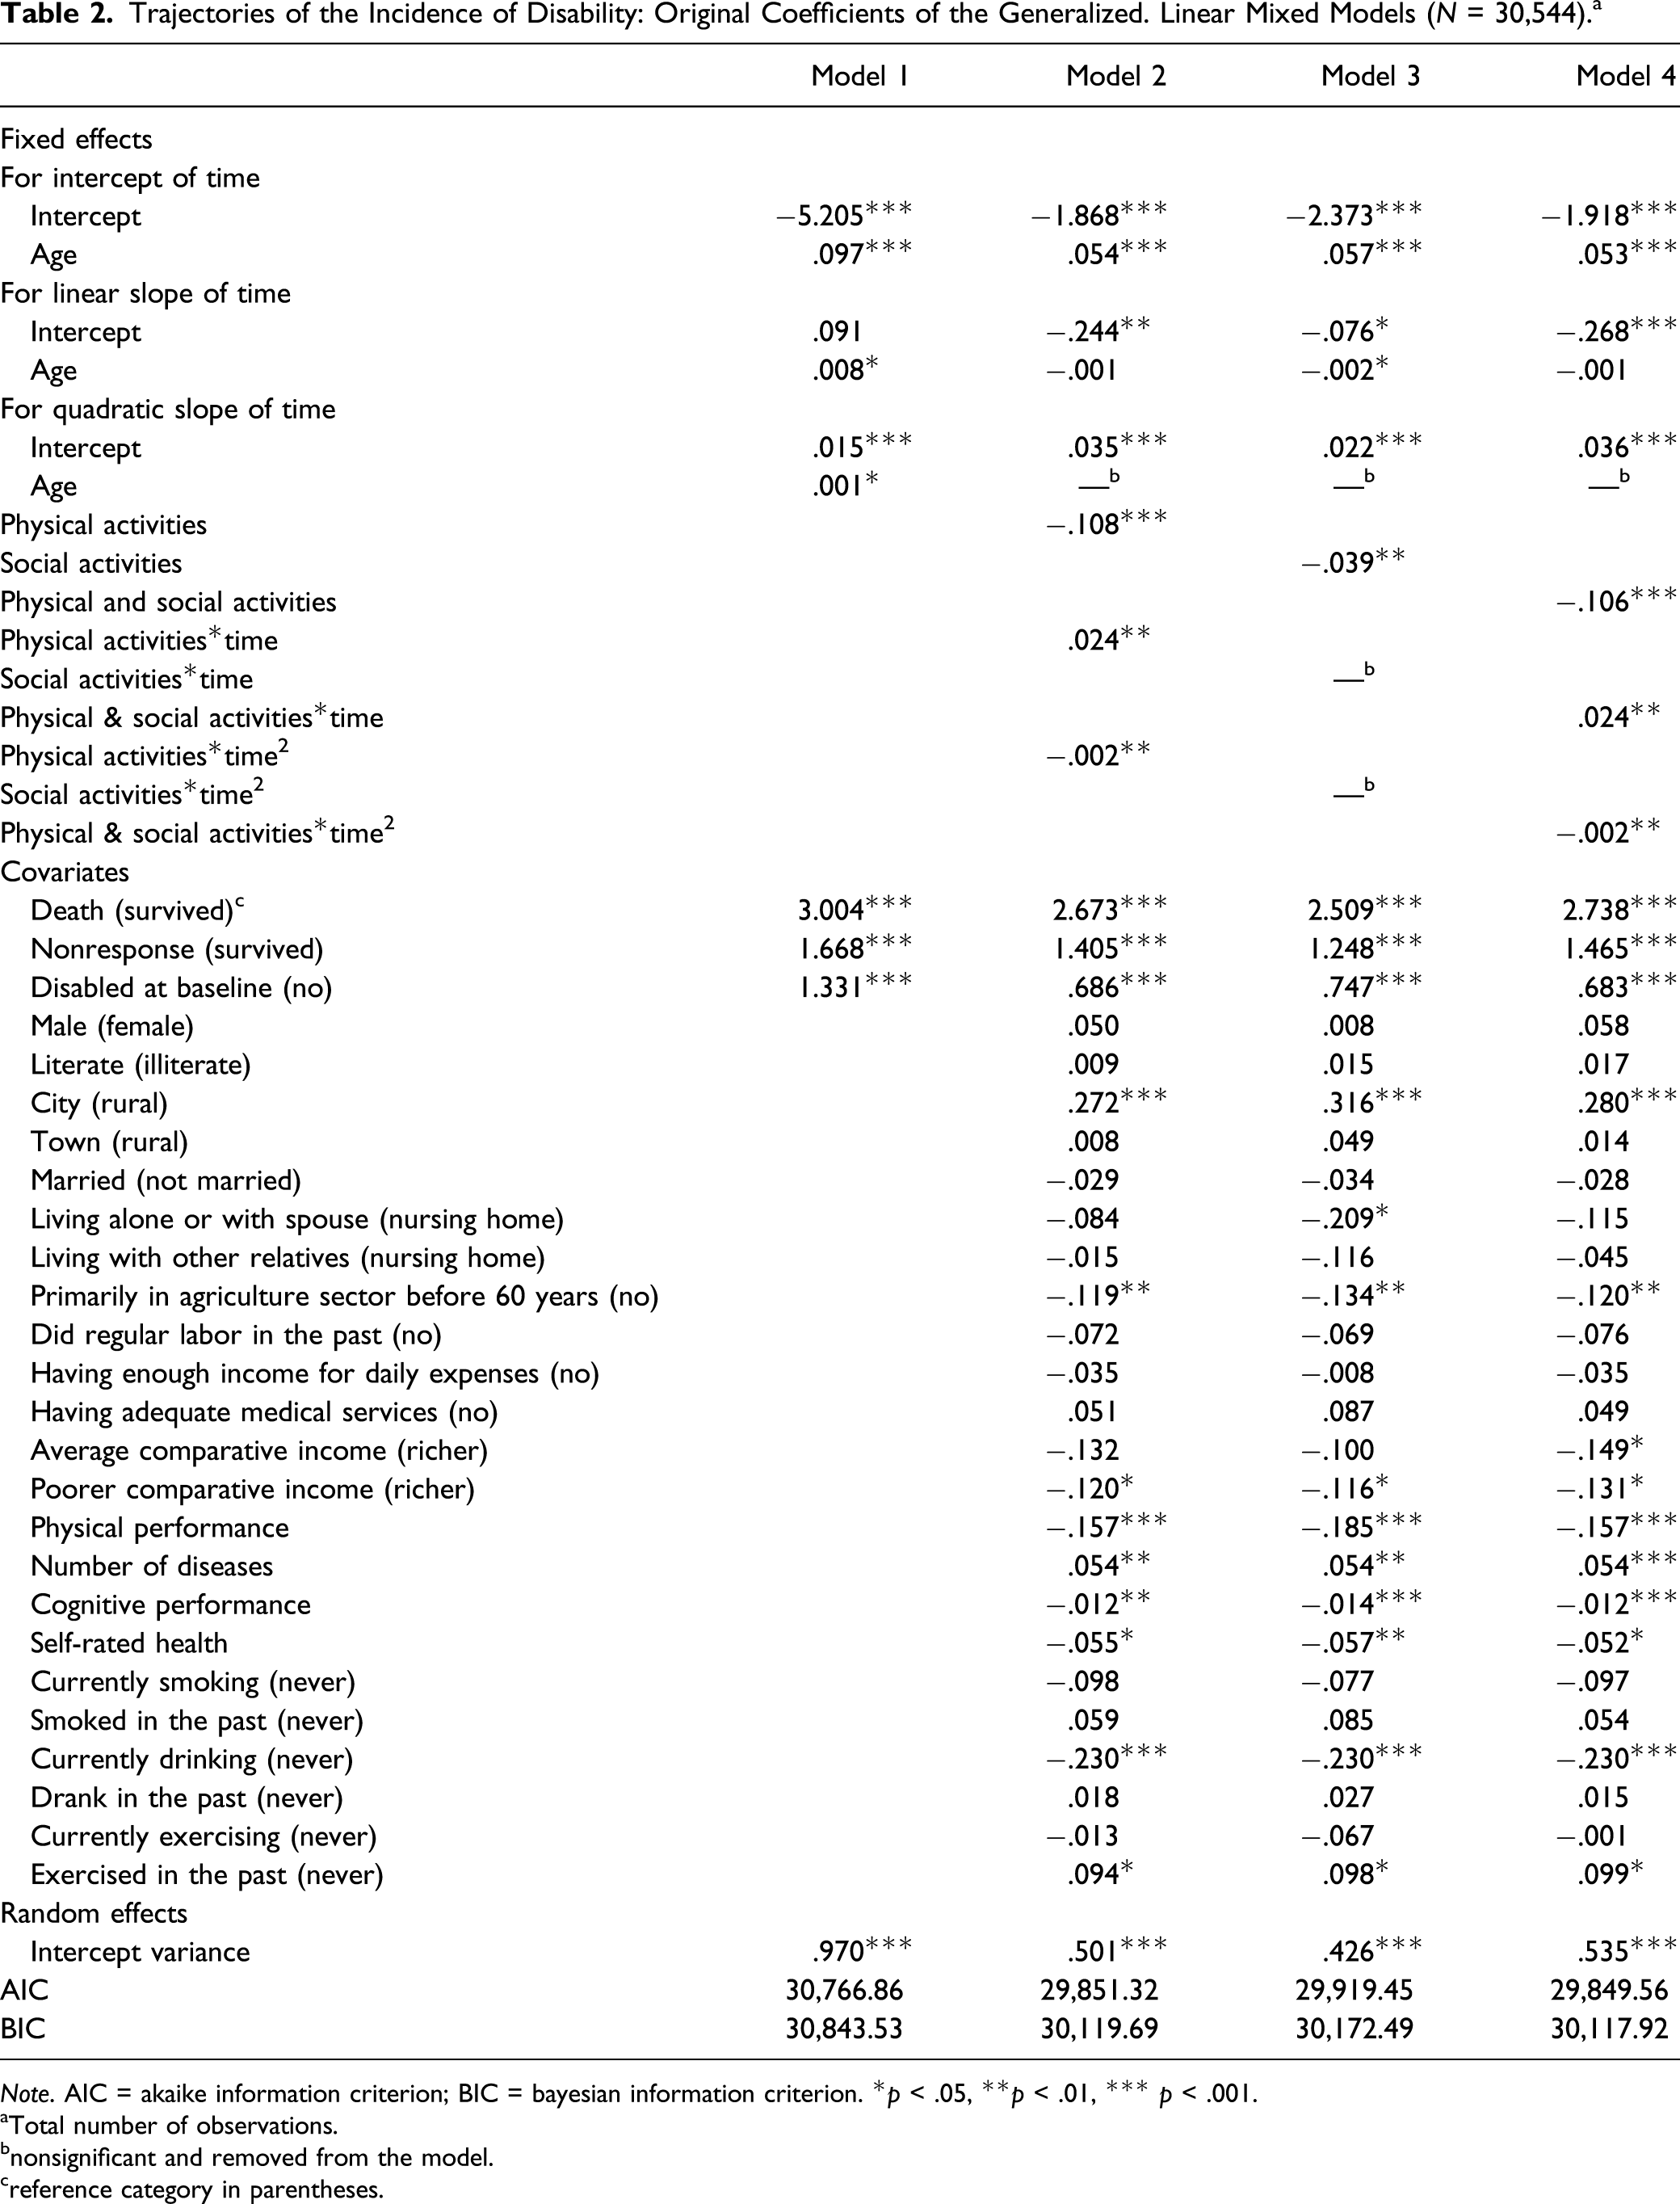
Note. AIC = akaike information criterion; BIC = bayesian information criterion. *p < .05, **p < .01, *** p < .001.
aTotal number of observations.
bnonsignificant and removed from the model.
creference category in parentheses.
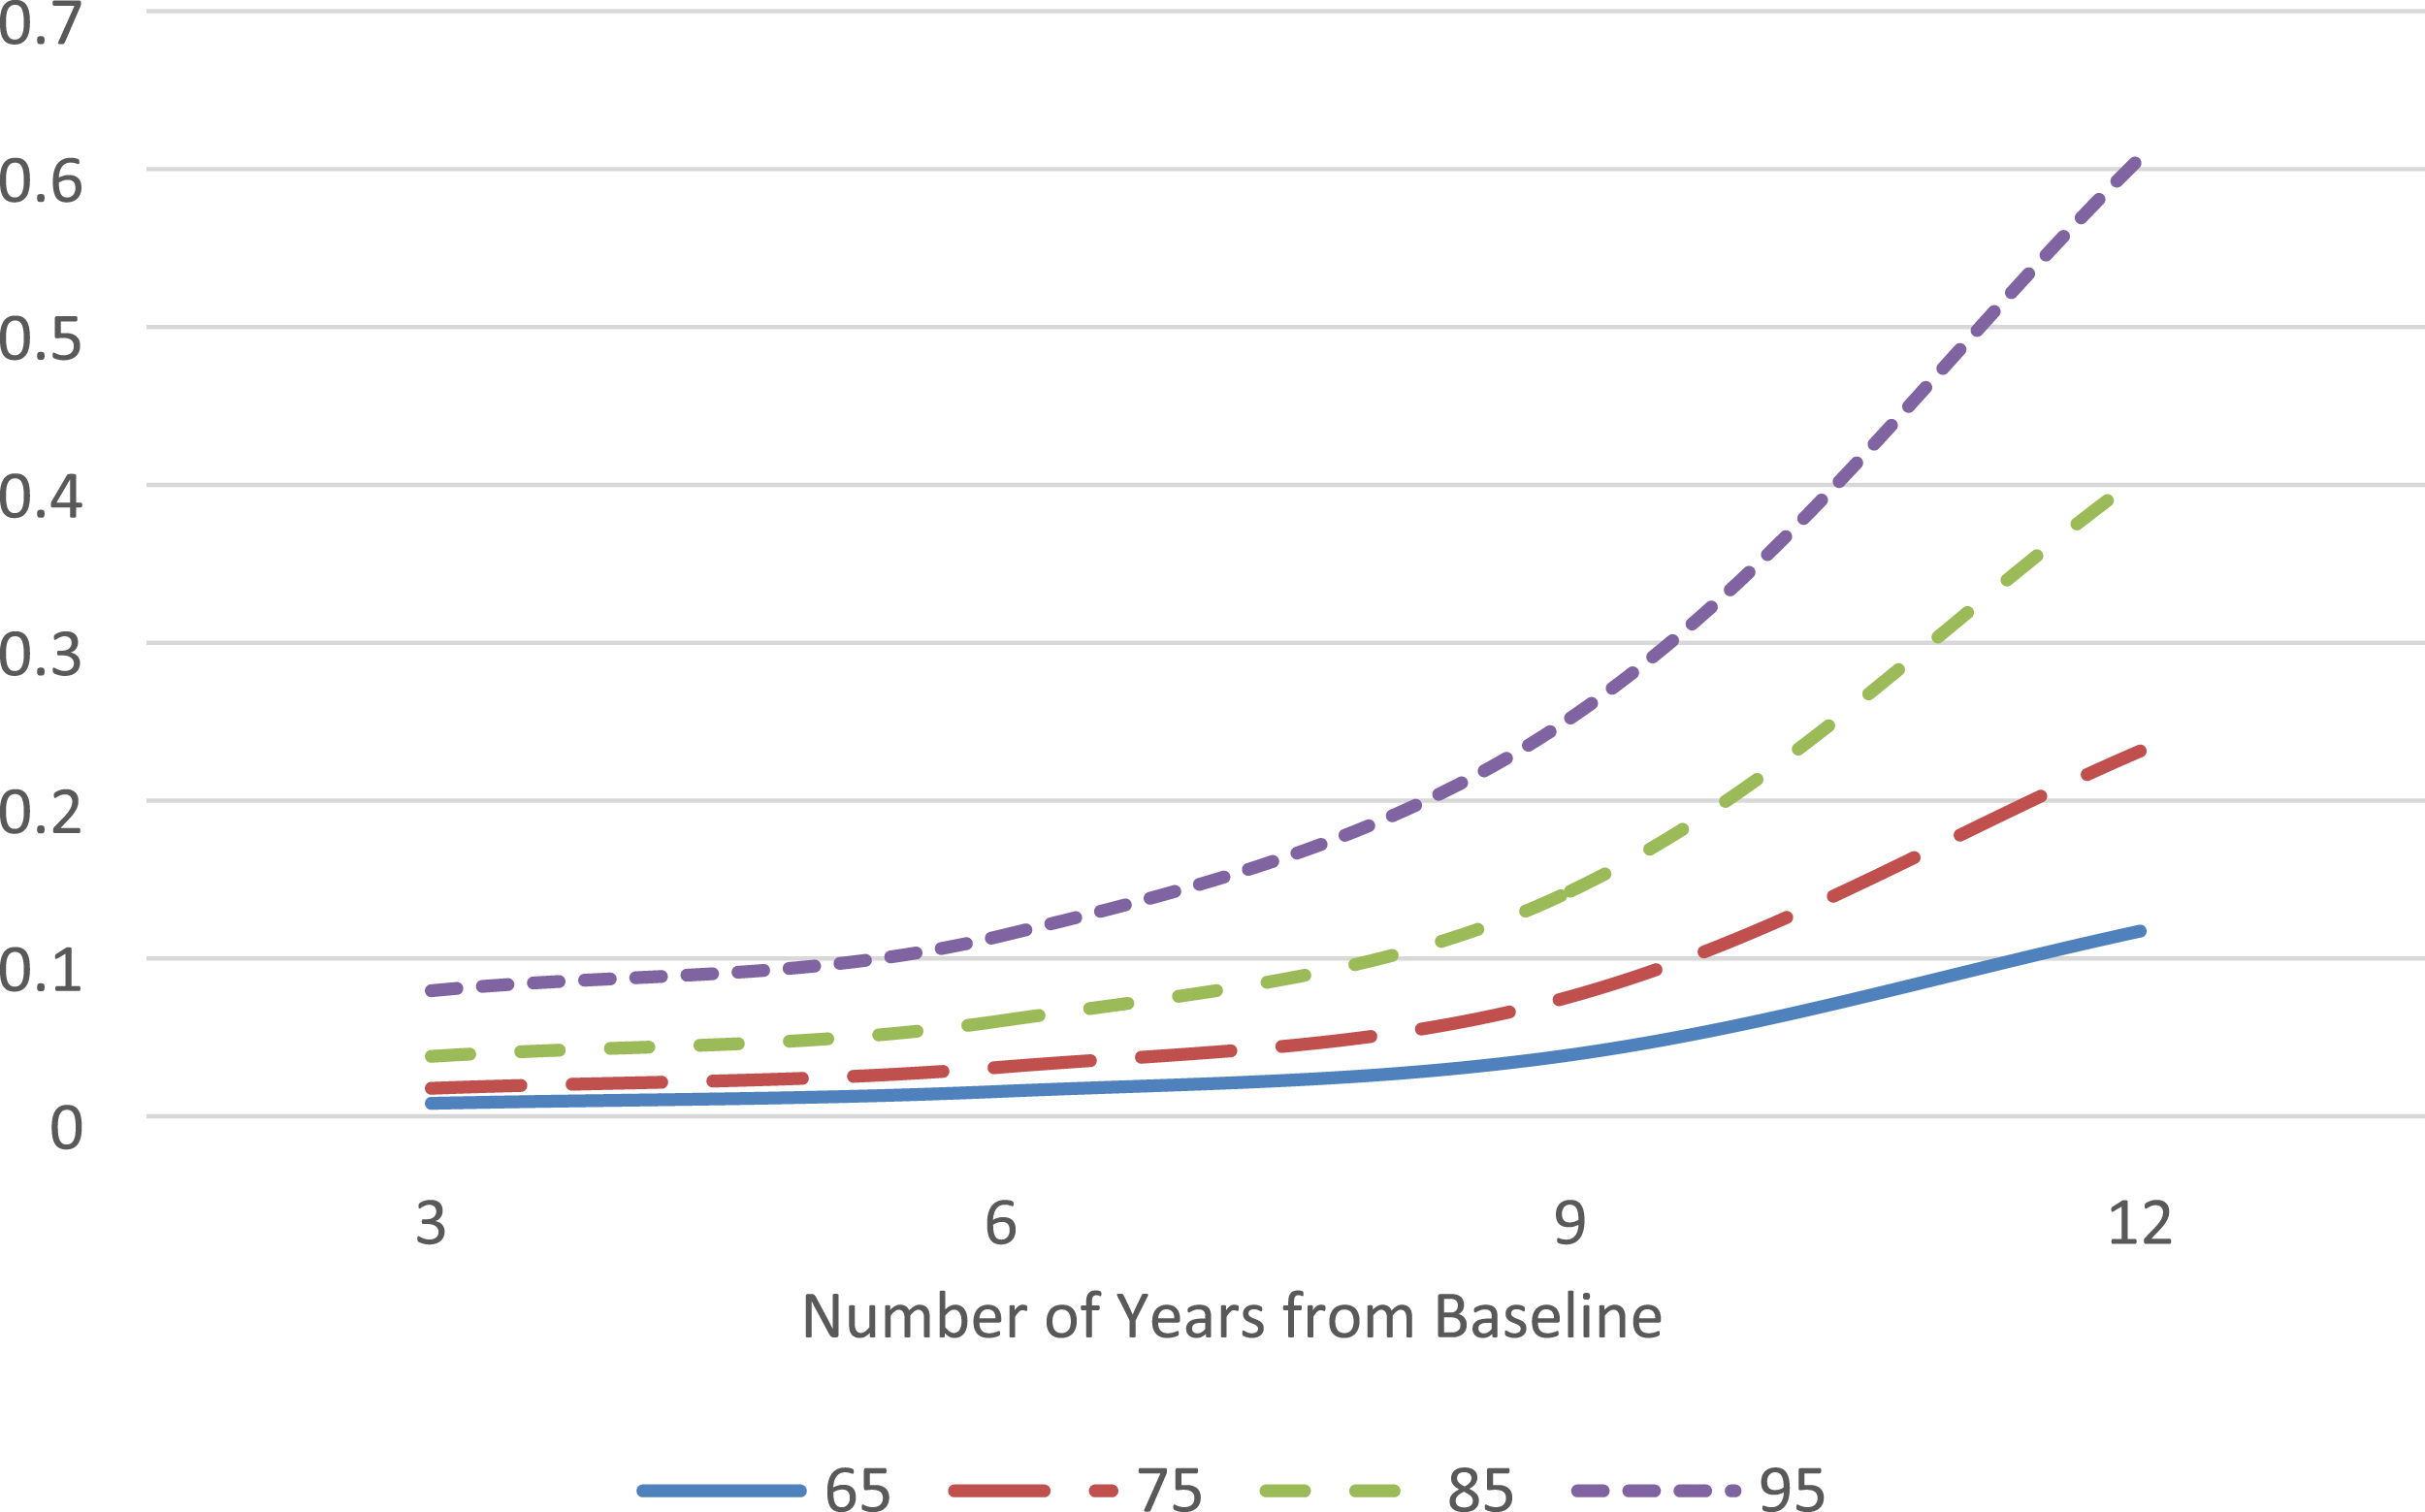
Predicted probability of being disabled over time by initial age.
Physical activities as well as other covariates are added to Model 2. The main effect of physical activities and their effect on both the linear and quadratic terms of time are highly significant (p < .001 or p < .01). Meanwhile, the age effect on the quadratic but linear slope of time is no longer significant (removed from the current model). Based on the same approach as with Figure 1, Figure 2 presents the computed probability of being disabled over time by the level of physical activities, which, for the convenience of illustration, is classified into four levels of engagement: “never,” “at least once a year,” “at least once a month,” and “at least once a week.” The chart looks similar to Figure 1 but shows an opposite pattern. The higher the frequency of engaging in physical activities, the lower the probability of being disabled over time and the lower the rate of change. While the probability for those from “never” to “at least once a week” at the third year of the interval is .085, .071, .059, and .048, respectively, with a gap of .037, it changes to .475, .403, .336, and .274 at the end of the 12 year interval, respectively, with the gap enlarged to .201. The rate of change of these four groups confirms this pattern: it grows by .043, .037, .031, and .025 per year from “never” to “at least once a week,” respectively. In sum, older adults who are more engaged in physical activities not only are at a lower probability of disability to start with but also experience it at a slower pace than those who are less engaged. Note that of the covariates, all health status variables are highly significant. Predicted probability of being disabled over time by the level of physical activity.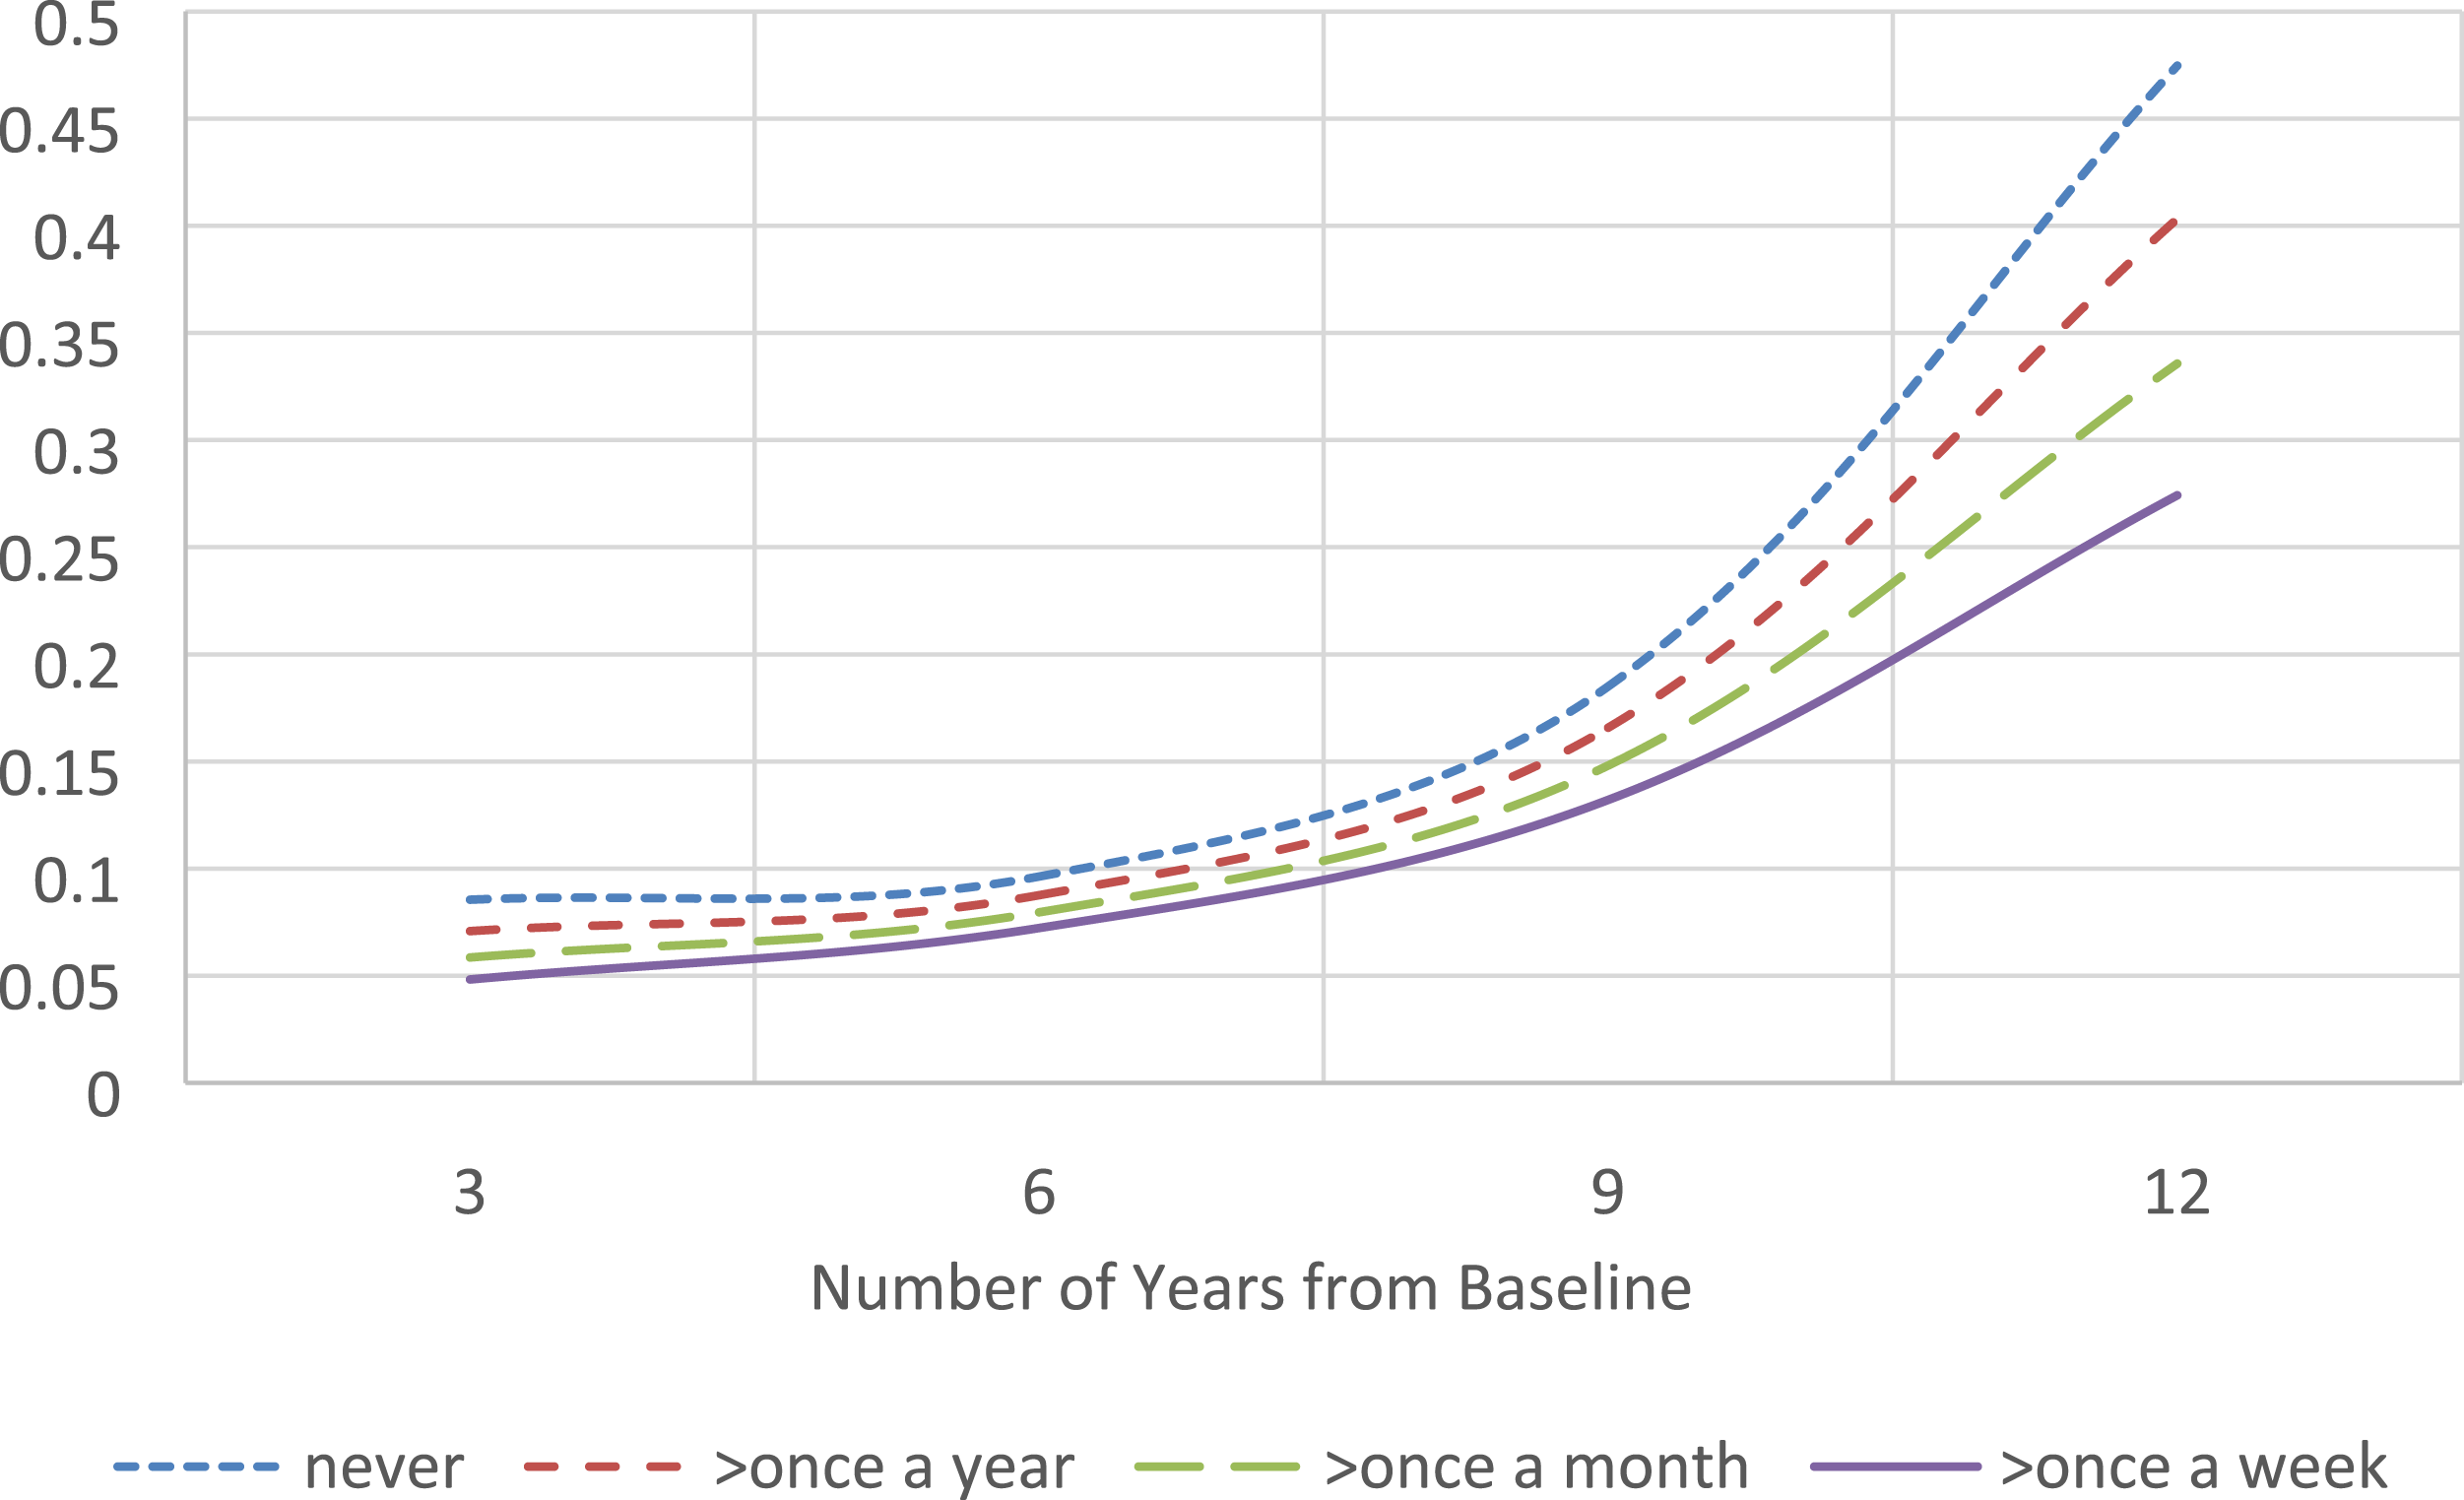
In Model 3, physical activities in Model 2 are replaced by social activities while other variables remain the same. While there is a significant main effect of social activities (p < .01), it does not significantly affect the slopes of time (therefore, not presented in the model).
Even though the effect of social activities is less substantial than that of physical activities, analysis shows that when they are combined, their joint effect is more significant than physical activities alone. Therefore, a combined index – an overall leisure activities index – is entered in Model 4. The results are similar to those of Model 2 except that the gap in the probability of being disabled was enlarged further by the level of engagement in both physical and social activities, which can be seen in Figure 3. A higher level of engagement is not only associated with a lower probability of being disabled but also with a decreasing rate of change. While the probability for those from “never” to “at least once a week” at the third year of the interval is .086, .065, .049, and .037, respectively, with a gap of .049, it changes to .483, .385, .297, and .221 at the end of the 12 year interval, respectively, with the gap enlarged to .262. The rate of change of the four groups slows down from .044 to .036, .028, and .020 per year, correspondingly. As in Model 2, the age effect on the quadratic term of time is no longer significant in Model 4. The time trajectory of developing disability by age is substantially changed. In Model 1 and Figure 1, older individuals not only have a higher probability of disability to begin with but also experience more rapid increase in such a probability. After other covariates are taken into account, the trajectories are more parallel to each other, as shown in Figure 4, with computed probabilities, which means that the rate of change within the whole time interval is quite similar between the four age groups. The rate of change is .023, .030, .036, and .042 per year for those aged 65, 75, 85 and 95 years, respectively. While the ratio of the rate of change of those aged 95 years to that of 65 years is 1.826 in Model 4, the same ratio is 4.917 from Model 1, suggesting that the age difference in the slope of the disability trajectory is drastically subdued when an array of covariates are taken into account, including engaging in leisure activities. Predicted probability of being disabled over time by the level of physical and social activities. Predicted probability of being disabled over time by initial age when controlling for leisure activities and covariates.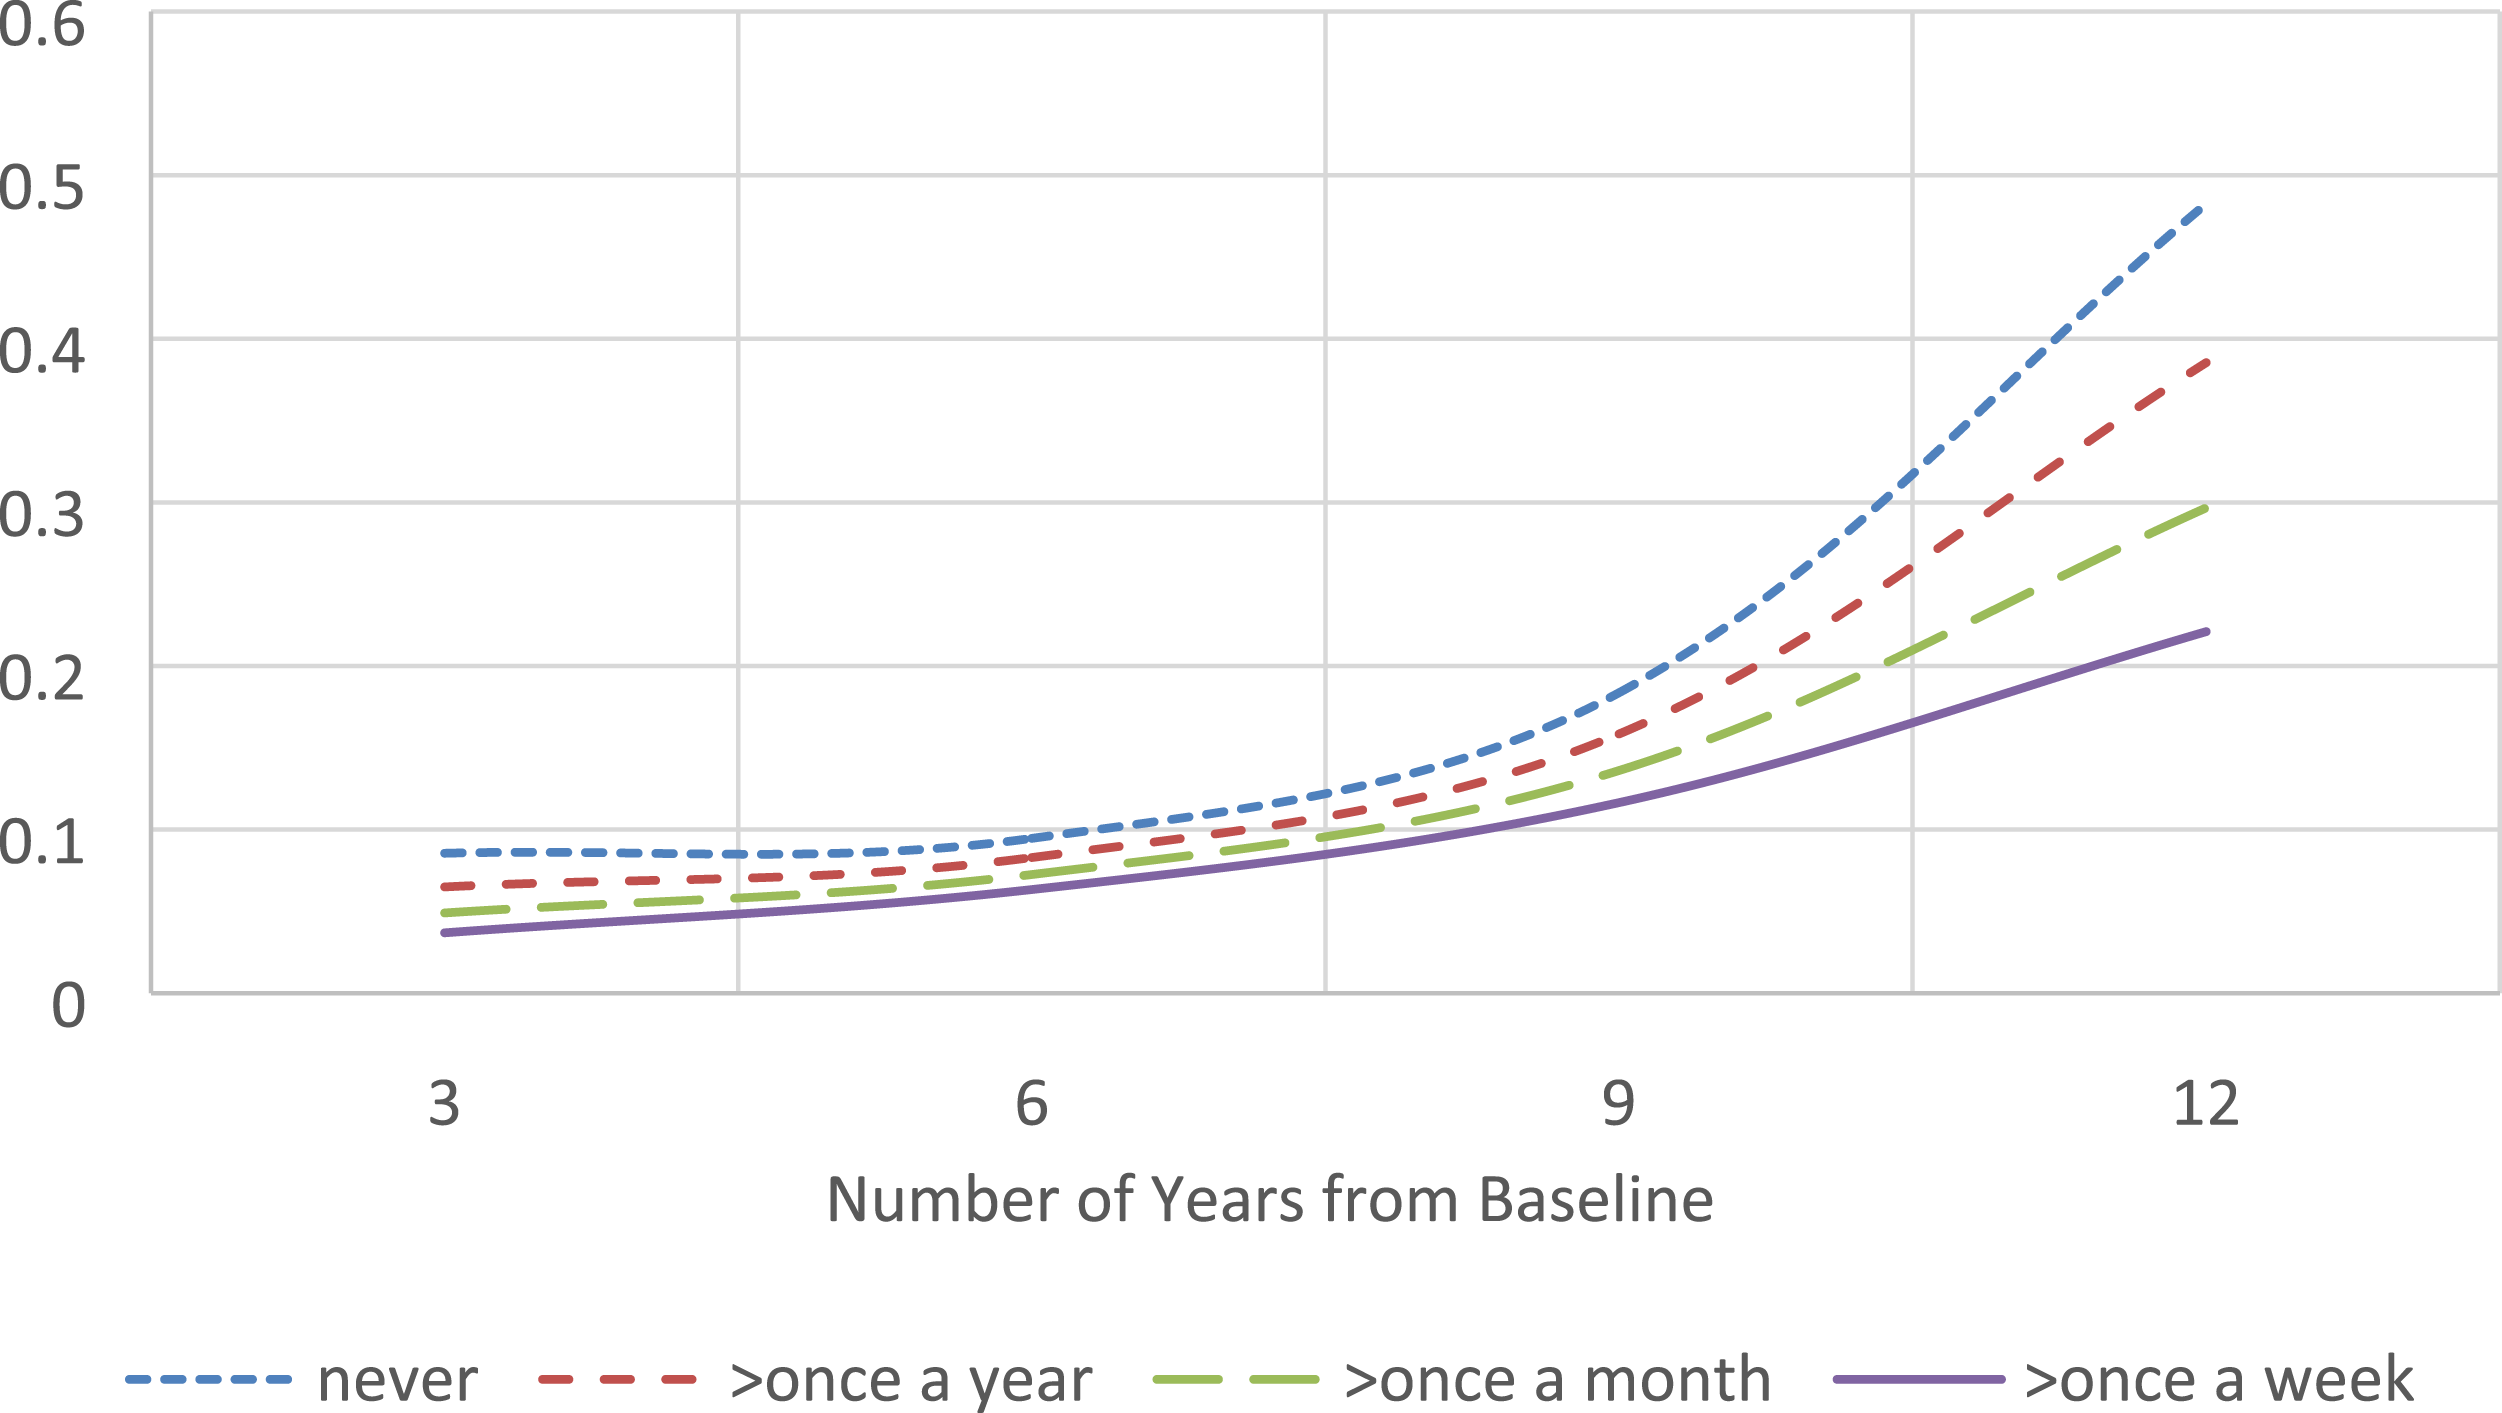

Akaike information criterion (AIC) and Bayesian information criterion (BIC) are given for each model to compare the fit of the models when they are not perfectly nested. The lower the value, the better the fit of the model for both AIC and BIC. Both criteria point to the same conclusion that Model 4, when physical and social activities are combined, achieves the best fit of all.
Discussion
While it is well established in the literature that the incidence of disability tends to increase with age among older adults, using an intraindividual trajectory model, this study further shows that there is a clear age effect on both the initial probability and its growth rate over time, suggesting a double jeopardy effect of age. In contrast, this study also found that older adults who engaged in physical and social leisure activities not only had a lower initial probability of the incidence of disability but were also on a slower track to be disabled over time. While their beneficial effect has been documented in some longitudinal studies of Chinese older adults (Gao et al., 2018; Gu et al., 2019; Ouyang et al., 2015), leisure activities were usually used as a covariate or focused on only as a main effect. To our knowledge, this is the first study that adopted a nation-wide longitudinal data source and the LGCA approach to examine intraindividual trajectory of being disabled over time among Chinese older adults. The results also show that the double benefit of leisure activities, previously found with the level of disability trajectory (Chen et al., 2016; Hayward & Krause, 2013; Thomas, 2011), applies to the incidence trajectory of disability as well.
This study further confirms the value of leisure activities in reducing the incidence of disability among older adults. As discussed earlier, leisure activities have been found to have a unique role in maintaining health and well-being. They are personally motivated and enjoyable (Zawadzki et al., 2015), rendering empowerment and positive attitudes, refreshing and reducing stress (Iwasaki & Schneider, 2003). In contrast to sports and other more vigorous exercises, leisure activities are less physically demanding and are more feasible for older adults to engage in as they experience declining energy levels and other physical constraints. Older adults tend to adjust the type of activities in response to their circumstances. An 8 year longitudinal study of adults aged 60 years and over in Canada showed that changes in leisure activities were associated with age and health characteristics (Strain et al., 2002). In their meta-analysis of longitudinal studies on the association between physical activities and disability, virtually all the studies showed benefits of engaging in moderate physical activities, including habitual walking and gardening, in delaying the incidence of disability (Tak et al., 2013). A 28 year Leisure World Cohort study found that engaging in longer hours of less physically demanding activities reduced mortality risk and there was little difference between high and moderate levels of activity (Paganini-Hill et al., 2011). Although one study of men and women aged 70–79 years concluded that vigorous exercise conferred greater benefit for physical function, for three out of four outcome measures, the difference between “lifestyle active” (such as engaging in household chores, paid work, care giving, and walking) and “exercise” (such as aerobic dance, weight lifting, jogging, and swimming) was largely insignificant once age, body mass index, prevalent disease, and other covariates were controlled for (Brach et al., 2004). Thus, leisure activities may yield as much health benefit as vigorous exercises to older adults and better fit their circumstances.
In this analysis, we first investigated the effect of physical and social activities separately to test whether they act similarly on disability (Chen et al., 2016). While engaging in physical activities was consistently associated with changes in the intercept and slopes of the intraindividual disability trajectory, the effect from social activities was more moderate: it affected the intercept only. Even though engaging in physical activities played a more important role than social activities, the latter also contributed to slowing the incidence of disability. The fact that when physical and social activities were combined, they produced more benefits than either alone confirms the value of engaging in both of them.
It is worth mentioning that in our preliminary analysis, we also investigated two intellectual activities that were asked in the survey, watching TV/listening to the radio and reading newspaper/books. They were found to be insignificant in predicting disability status. What we found was somewhat consistent with a study of American older adults, where four types of activities were compared. Low-demand leisure activities, including reading, watching TV, and listening to music, were found negatively associated with physical health, while others, including social, instrumental, and high-demand leisure activities (such as walking and gardening) were positively associated with physical health (Everard et al., 2000).
This study shows that the age trajectory can be modified by other factors, such as engaging in leisure activities. When leisure activities and other covariates are added, the trajectories become flatter and more parallel by age. It is certain that such changes cannot solely be attributed to leisure activities. Other covariates in the model contributed as well, and it is likely that some other factors absent in this analysis may also matter. The point, however, is that the disability trajectory can be modified by factors other than age itself. Results from an American longitudinal study showed that age only affected the initial level of physical limitations rather than the rate of change when engagement in social activities and other covariates were controlled for (Thomas, 2011). These findings seem to suggest that, whereas age tends to be associated with the initial risk of disability, older ages may not necessarily lead to faster rates of deterioration down the road. Double jeopardy is not inevitable. Age alone may not be an accurate proxy of functional status or the potential of older adults to cope with health constraints. This point is shared by some studies on accumulation of health deficiencies. Using the National Long-Term Care Survey, Kulminski, Ukraintsevam, et al. (2007) found that older adults who died before age of 75 years and those who died after 85 years showed similar pattern of health deficiency between 1984 and 1999, measured by a frailty index (FI), which, in addition to measures of ADL, includes physiological and psychological disorders. They also documented a weak correlation between age and FI among individuals between age 65 and 95 years. Across these age groups, there was a remarkable similarity in the distribution of FI: each group follows a gamma-like pattern, showing similar heterogeneity in health deficiency. Therefore, low health deficiency is not necessarily limited to younger ages (Kulminski, Yashin, et al., 2007).
In sum, although the risk for disability increases with advancing age, it is not an inevitable consequence of aging. The trajectory of developing disability can be somehow flattened across age groups among older adults. Opportunities exist to promote health and to postpone disability (Centers for Disease Control and Prevention, 2014). An array of factors could come into play: economic status, access to medical care, environment exposures, and heath behaviors (Schoeni et al., 2008). As demonstrated in this study, engaging in leisure activities could contribute substantially in this process.
There are strengths in this study. The analysis is based on a large longitudinal sample of older adults, which allows adopting the LGCA approach to investigate intraindividual trajectories over time as well as to compare individuals with varying characteristics. Unlike most prior studies that applied LGCA to focus on the level of disability, this study adopts a generalized linear mixed model transformation to examine the incidence of disability, expanding the understanding of the role leisure activities in the trajectory of disability. Physical and social activities are examined separately and shown to have different weights on reshaping the disability trajectory. The presence of multiple times allows better addressing the issue of mutual causality between disability and engaging in leisure activities. Not only did the analysis control for health status that is directly related to disability but it also adopted a time-lag approach and included ADL at the baseline as a covariate in the model. This analysis also sheds light on how age effect on the trajectory of disability may change before and after leisure activities and other covariates are controlled for. Nevertheless, limitations exist. Many of the measures, including difficulties in ADL and participation in leisure activities, were from self-reports, which are subject to recall biases. ADLs were measured only once every three years. This raised the issue of timing and could compromise their accuracy. The measure of leisure activities is somewhat limited. There were only four physical and two social activities in this study. Activities such as traveling, entertaining, and volunteering (Everard et al., 2000; Thomas, 2011) were not included. Furthermore, there was no measure on the exact magnitude or quality of these activities. A latent class growth analysis in one study showed that individuals with chronically positive social exchanges were likely to experience low levels of disability and individuals with negative exchanges showed patterns of increasing disability (Mavandadi et al., 2007). Therefore, caution is warranted in generalizing the results. In the end, the current analysis by no means reveals the whole picture of the dynamic relationship between disability and activity engagement. Questions about simultaneous change in both of them and how they mutually affect each other are certainly worth exploring (Chen et al., 2016).
Despite these limitations, this study shows that even though advancing age tends to be correlated with incidence of disability, age is not the only determinant. It confirms the double benefit of engaging in leisure activities in delaying the incidence of disability. The over-time trajectory of disability can be flattened by such factors as engagement in leisure activities that are enjoyable and suitable to older adults.
Footnotes
Declaration of Conflicting Interests
The author declared no potential conflicts of interest with respect to the research, authorship, and/or publication of this article.
Funding
The author received no financial support for the research, authorship, and/or publication of this article.

Appendix
In principle, time-varying independent variables enter level-1 equation, the intraindividual equation. Time-invariant variables enter level-2 equation, the interindividual model. Here are the equations at both level 1 and level 2 for the four models: