
Abstract
Introduction
According to the World Health Organization, addressing the healthcare needs of an aging global population is a significant public health priority (Wilmoth, 2013). In the United States, the population of adults aged 65 years and older in 2050 is projected to be 83.7 million which is a twofold increase from current estimates (Ortman et al., 2014). Cognitive decline and impairment among older adults is an important public health concern given the significant increases in disability (Binegar et al., 2007; Hesseberg et al., 2013), caregiver burden (Paradise et al., 2014), and healthcare costs associated with the treatment of declining cognitive function (Zhu et al., 2013).
Behavior risk factors such as drinking, smoking, and body mass index (BMI) have significant influences on the health and well-being of older adults; however, research on the relationships between behavioral risk factors and cognitive functioning has been mixed. For example, previous research has found that cigarette smoking had a negative and statistically significant effect on cognitive health among older people (Ott et al., 1998), while others have found that smoking was not associated with cognitive function (Vásquez et al., 2016). A third study found that older former smokers, compared to nonsmokers, had better performance in certain dominants of cognitive function (Ge et al., 2020). The literature on weight and cognitive health among older adults is similarly mixed. Research indicates that being underweight, overweight, or obese is associated with poor cognitive health in old age (Anstey et al., 2011; Elias et al., 2005). Despite these findings, some benefits of overweight in midlife on cognitive health (i.e., “obesity paradox”) have been identified (Atti et al., 2008; Fitzpatrick et al., 2009). Regarding alcohol consumption, some studies have found that frequent alcohol drinking was associated with cognitive decline compared to never drinkers (Ngandu et al., 2006). Other studies showed beneficial effects of moderate drinking on cognitive health in later life (Ganguli et al., 2005).
In addition to behavioral risk factors, other factors associated with cognitive function have been identified from prior research, including demographic (e.g., age, gender, education, race, marital status, and household income) (Chen & Chang, 2016; Hu et al., 2019; Peterson et al., 2019; Shin et al., 2018; Wang et al., 2018; Weuve et al., 2018; Wilson et al., 2009; Xu et al., 2020) and health-related factors such as self-rated health (Bendayan et al., 2017) and vascular risk factor and conditions (e.g., hypertension, diabetes mellitus, stroke, congestive heart failure, and heart attack) (Barnes & Bennett, 2014; Tolppanen et al., 2012; Yaffe et al., 2014).
Despite results on the associations between behavioral risk factors and cognitive health have been mixed, most prior studies have used a cross-sectional design and have examined only a single behavioral risk factor at a time. However, multiple behavioral risk factors often occur in tandem, and the clustering patterns may differ among individuals. Evidence has shown that being a smoker is associated with higher alcohol consumption while quitting smoking is associated with a reduction in alcohol consumption (Moore et al., 2005), but increases in overweight and obesity rates among adults (Pieroni & Salmasi, 2016). The clustering of behavioral risk factors can be explained by problem behavior theory (Jessor, 1991), health lifestyle theory (Cockerham, 2005), and alternative theories of risk behavior trajectories (Audrain-McGovern et al., 2003; Daw et al., 2013; Jeffery et al., 2000). The alternative theory indicates that some groups of behavioral risk factors may be chosen together in order to accomplish certain health goals. For example, people might decrease alcohol drinking and smoking in order to lose weight (Audrain-McGovern et al., 2003). Despite these study findings, there is no or very limited research examines how the trajectories of multiple behavioral risk factors cluster together.
Prior studies have demonstrated that older African Americans exhibit lower cognitive function on standardized cognitive assessment measures compared to their white counterparts (Early et al., 2013; Weuve et al., 2018; Wolinsky et al., 2011). Restricted access to socioeconomic resources, differences in quality of education, differential access to health care, and cultural bias in cognitive tests are among some of the factors that have been hypothesized to account for the poorer performance of older African Americans on tests of cognition (Crowe et al., 2008; Fillenbaum et al., 2001; Mehta et al., 2004). While these proposed explanations might provide clues as to how to attenuate racial differences, none seem to provide a complete account of the observed differences in cognitive function between older African Americans and white Americans. In addition, there are documented differences in behavioral risk factors based on race/ethnicity in older Americans. The preponderance of data shows that older and lower-income African Americans have a higher prevalence of cigarette smoking and being overweight compared to white Americans, but they smoke fewer cigarettes (Centers for Disease Control Prevention, 2017) and have lower levels of alcohol use (Zapolski et al., 2014). Therefore, additional research is warranted to examine the dynamics of change in multiple behavioral risk factors and their associations with cognitive health change over time.
In this study, we aimed to (1) identify multiple trajectories of three behavioral risk factors (smoking, alcohol drinking, and BMI) and cognitive function trajectories among older African Americans and white Americans and (2) examine the association between multiple trajectories of behavioral risk factors and cognitive function trajectories among older African Americans and white Americans.
Methods
Data Source and Study Sample
The data were derived from the Health and Retirement Study. The HRS is an ongoing longitudinal study that collects data on health, health services utilization, economics, labor and employment status, and family structure from a nationally representative sample of community-dwelling adults aged 51 years and older in the United States (Heeringa & Connor, 1995). This study analyzed nine waves (1998–2014) of the HRS data (version P) prepared by the RAND Center for the Study of Aging (Bugliari et al., 2016). HRS study respondents who met the following criteria at baseline were included in the analytic dataset: (1) self-identify as African American or white American, (2) aged 65 and older (given that HRS did not routinely measure cognitive functioning among younger respondents), (3) no reports of memory-related diseases (e.g., dementia or Alzheimer’s disease), (4) had at least one measurement of cognitive function, and (5) had at least one measurement for each of the three behavioral risk factors (i.e., smoking, alcohol drinking, and BMI) across nine data waves. Therefore, a total of N = 9427 HRS respondents were included in the study.
Measures
Cognitive Functioning
Cognitive functioning was measured by a total cognition composite score (ranged 0–35) based on tests of immediate word recall, delayed word recall, serial 7’s test, backwards count, and naming tests (date naming, object naming, and president/vice-president naming). These tests assessed short- and long-term memory, orientation to surroundings, knowledge of current events, language, and ability to perform mathematical tasks. Higher composite scores denote better cognitive function. Cognitive impairment for self-reported respondents is associated with a score of 8 or below (Crimmins et al., 2011).
Behavioral Risk Factors
Three behavioral risk factors were assessed in the study, including (1) smoking: number of cigarettes smoked per day were measured using three survey questions: “Have you ever smoked?”, “Do you smoke cigarettes now (yes/no)?”, and “About how many cigarettes or packs do you usually smoke in a day now?”; (2) alcohol drinking: number of drinking per week were measured using three survey questions: “Have you ever drunk any alcohol?”, “In the last 3 months, on average, how many days per week have you had any alcohol to drink (e.g., beer, wine, or any drink containing liquor)?”, and “In the last 3 months, on the days you drink, about how many drinks do you have (e.g., beer, wine, or any drink containing liquor)?”; and (3) BMI values: height and weight were used to calculate participants’ BMI values. According to CDC guidelines, underweight was defined as BMI <20.0, normal weight as BMI 20.0–24.9, overweight as BMI 25.0–29.9, and obesity as BMI ≥30.0 (Centers for Disease Control Prevention, 2020).
Other Covariates
Demographic factors including age (years), sex (male and female), race (African American and white Americans), education (years), marital status (married/living with a partner and otherwise), and household income (quartiles) were measured. Health factors such as self-rated health status (good or above and fair or poor) and the number of vascular risk factor burden and vascular disease burden were measured. The number of vascular risk factor burden (i.e., the number of two risk factors present: hypertension and diabetes mellitus) and vascular disease burden (the number of two conditions present: stroke and heart diseases) (Barnes et al., 2013; Barnes & Bennett, 2014) was calculated based on self-reported questions on “Has a doctor ever told you had hypertension, diabetes, stroke, or heart diseases?”. Furthermore, the respondent’s attrition (yes, no) and mortality (yes, no) status were measured.
Data Analysis
The group-based mixture modeling technique is a useful analytic approach for identifying clusters of individuals following similar patterns of behavioral change over time (Nagin, 2005; Nagin et al., 2018). In this study, the group-based mixture modeling (by SAS PROC TRAJ procedure) (Jones et al., 2001) was conducted to identify the joint trajectories of smoking, alcohol drinking and BMI and cognitive function trajectories. Based on prior empirical evidence, we assessed two to five trajectory groups with intercept-only, linear, quadratic, and cubic time functions for cognitive function (Hsu et al., 2013; Xu et al., 2015). The same steps were used to identify trajectory groups of joint changes in smoking, alcohol drinking, and BMI. In trajectory modeling, the zero-inflated Poisson distribution was specified for cigarette smoking and alcohol drinking, and the censored normal model was used for cognitive function and BMI (Jones & Nagin, 2007). The best-fitting model with the optimal number of trajectory patterns was determined based on Bayesian information criteria (BIC), the average posterior probability of group, size of the smallest group, and the parsimony principle (Jones & Nagin, 2007).
Second, once the joint trajectories of smoking, alcohol drinking and BMI and the cognitive function trajectories were identified, each respondent in the dataset was assigned to a trajectory group based on the average posterior probability of group membership in each trajectory group (Nagin, 2005; Nagin et al., 2018). The next multinomial logistic regression analysis was conducted to examine how joint trajectories of smoking, alcohol drinking, and BMI are associated with differences in cognitive function between older African Americans and white Americans after accounting for demographic factors, health status, mortality, and attrition status.
Finally, to minimize the loss of data due to items missing, multiple imputations with the fully conditional specification method (Pedersen et al., 2017; Van Buuren, 2007) were conducted with imputed datasets with covariates specified. All analyses were performed using SAS, version 9.4 (SAS Institute, Inc, Cary, NC).
Results
Sample Characteristics
Characteristics of Study Participants at Baseline (1998).
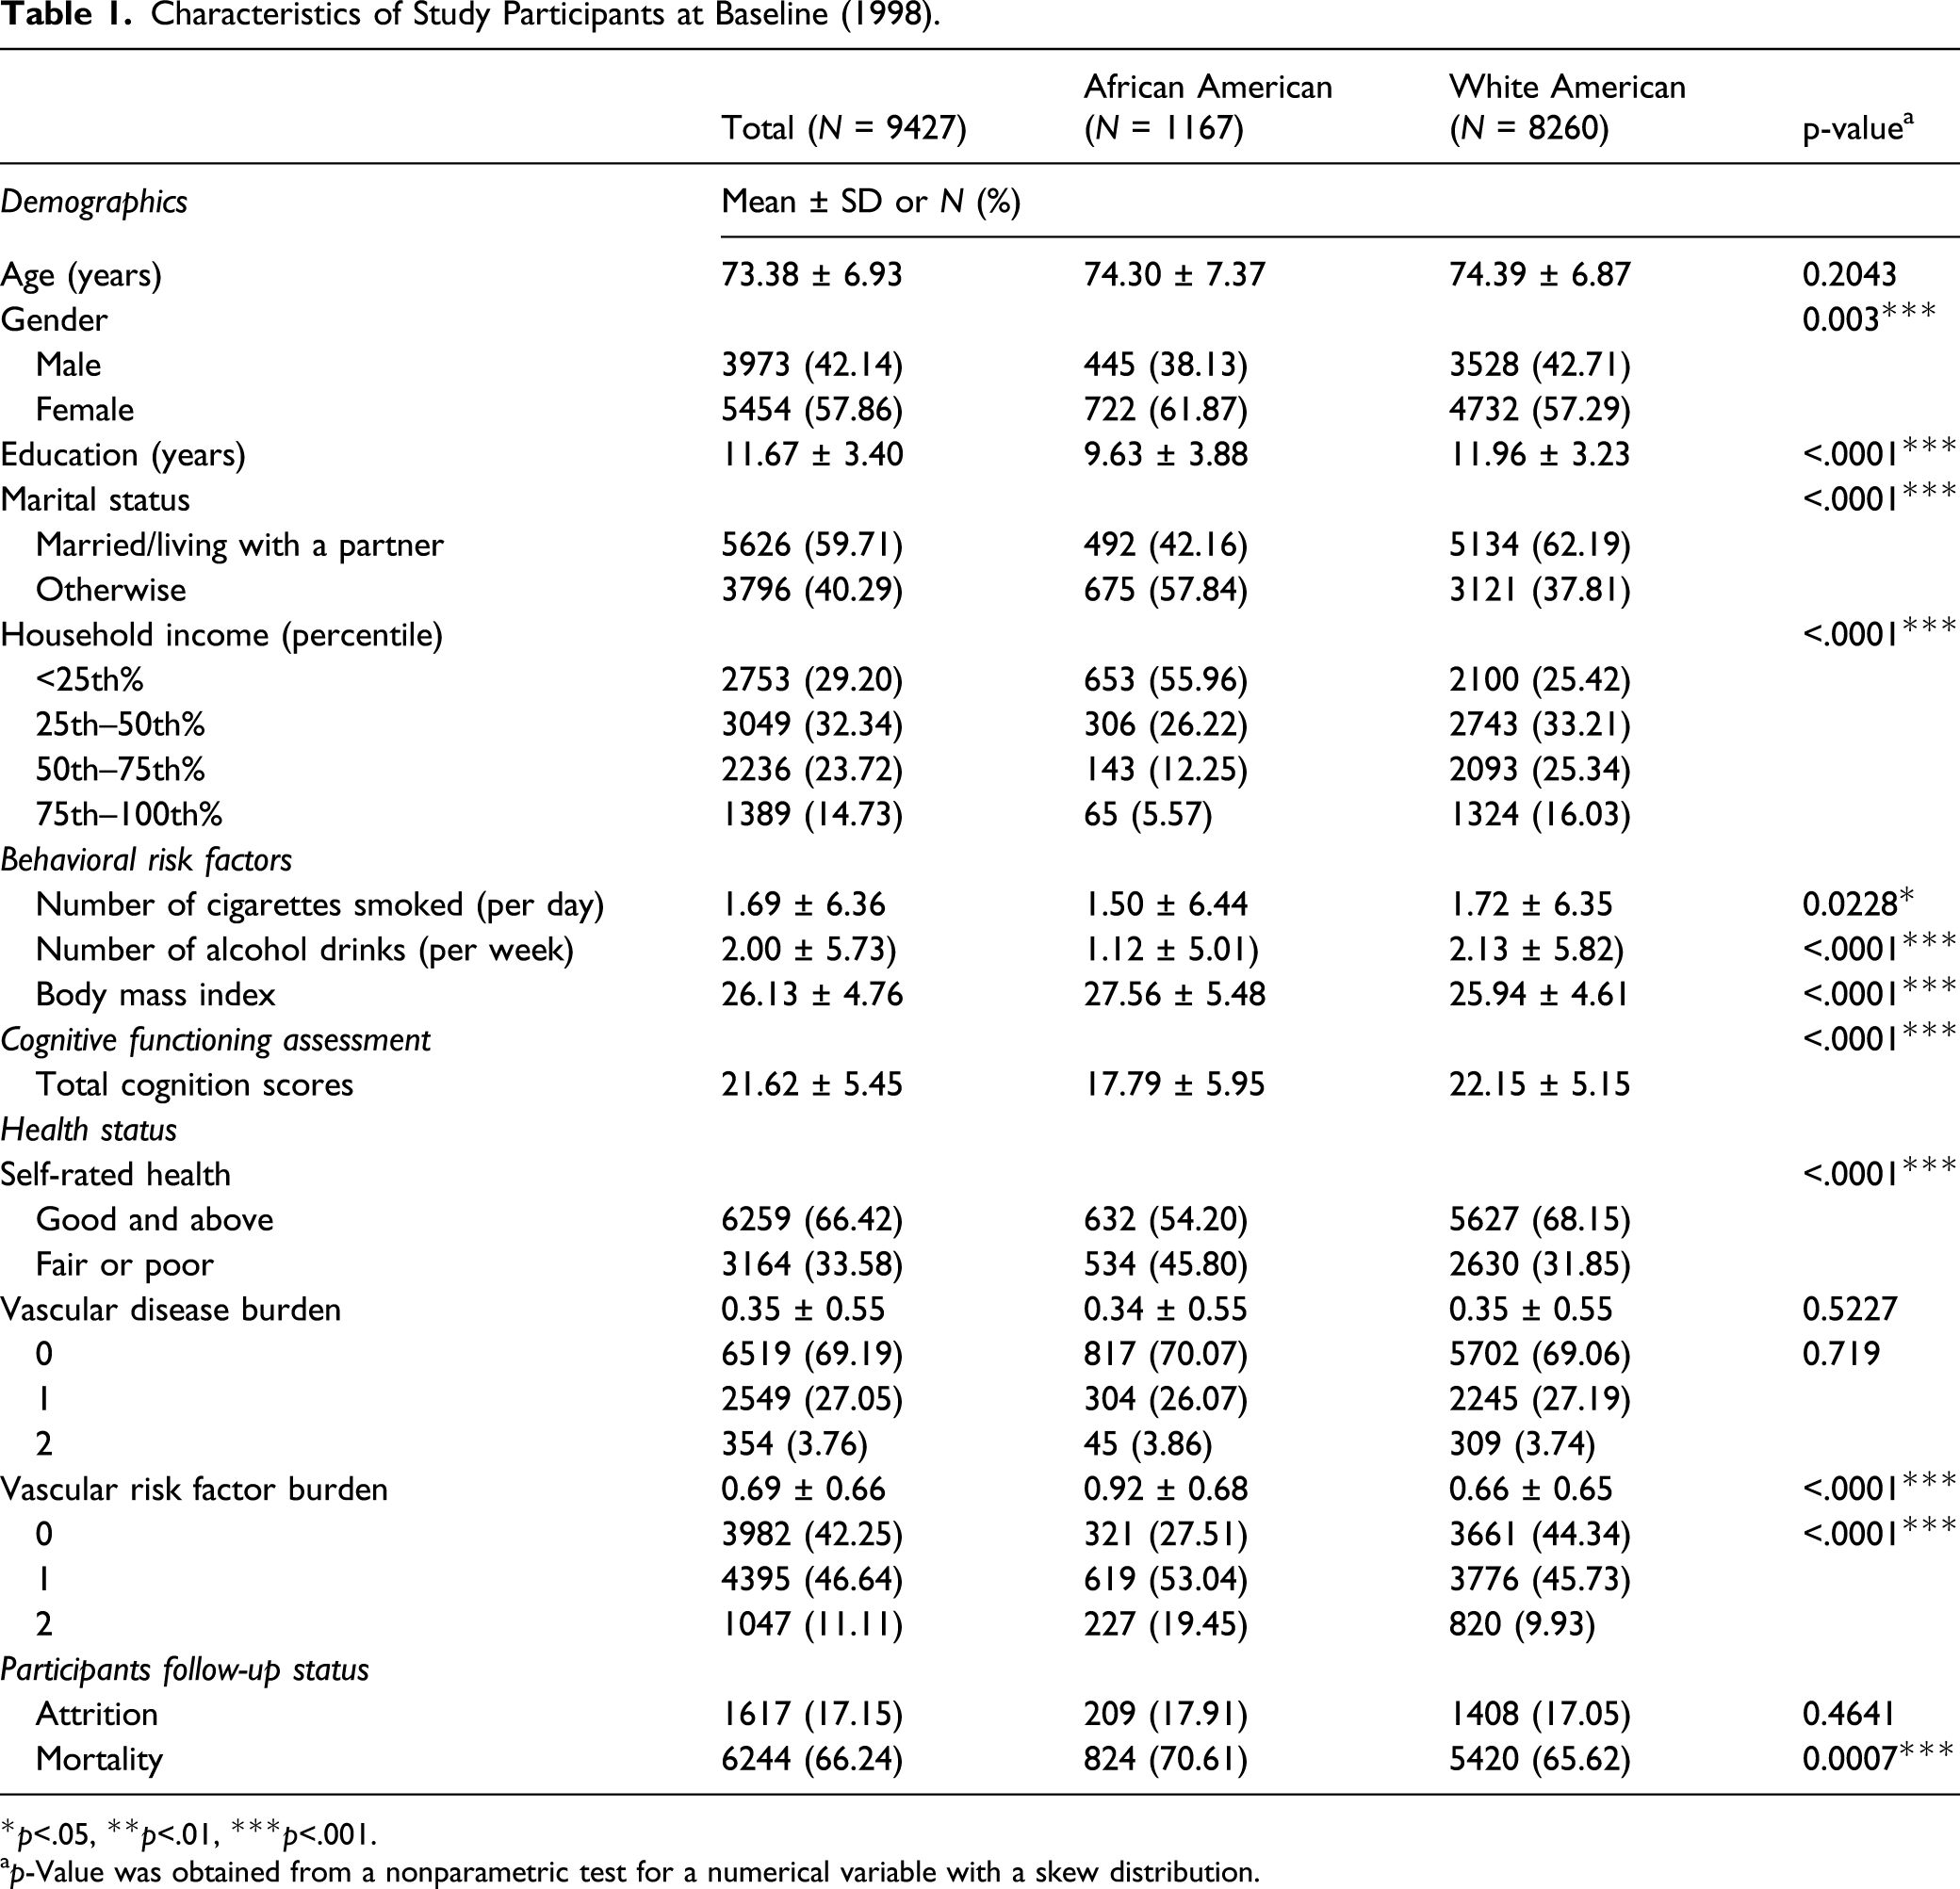
*p<.05, **p<.01, ***p<.001.
ap-Value was obtained from a nonparametric test for a numerical variable with a skew distribution.
Joint Trajectories of Behavioral Risk Factors
Estimated Trajectory Groups and Group-Specific Growth Parameters Without Adjusting for Covariates.

*p<.05,**p<.01,***p<.001.
aZero-inflated Poisson model
bzero-inflated Poisson model
ccensored normal model
dcensored normal model.
BIC: Bayesian information criterion.

Joint trajectories of behavioral risk factors.
Cognitive Function Trajectories
Regarding trajectories for cognitive function, the three-group model with a quadratic function of time was identified as the best-fitting model based on the aforementioned criteria (Jones & Nagin, 2007). The three trajectory groups were labeled as follows (Figure 2): (1) high: 38.0% of the study sample; (2) moderate: 40.8% of the study sample; and (3) low: 21.2% of the study sample. African Americans were more likely to be in the “low” cognitive function group (50.8% vs. 19.0%) than whites (data not shown). Cognitive function trajectories.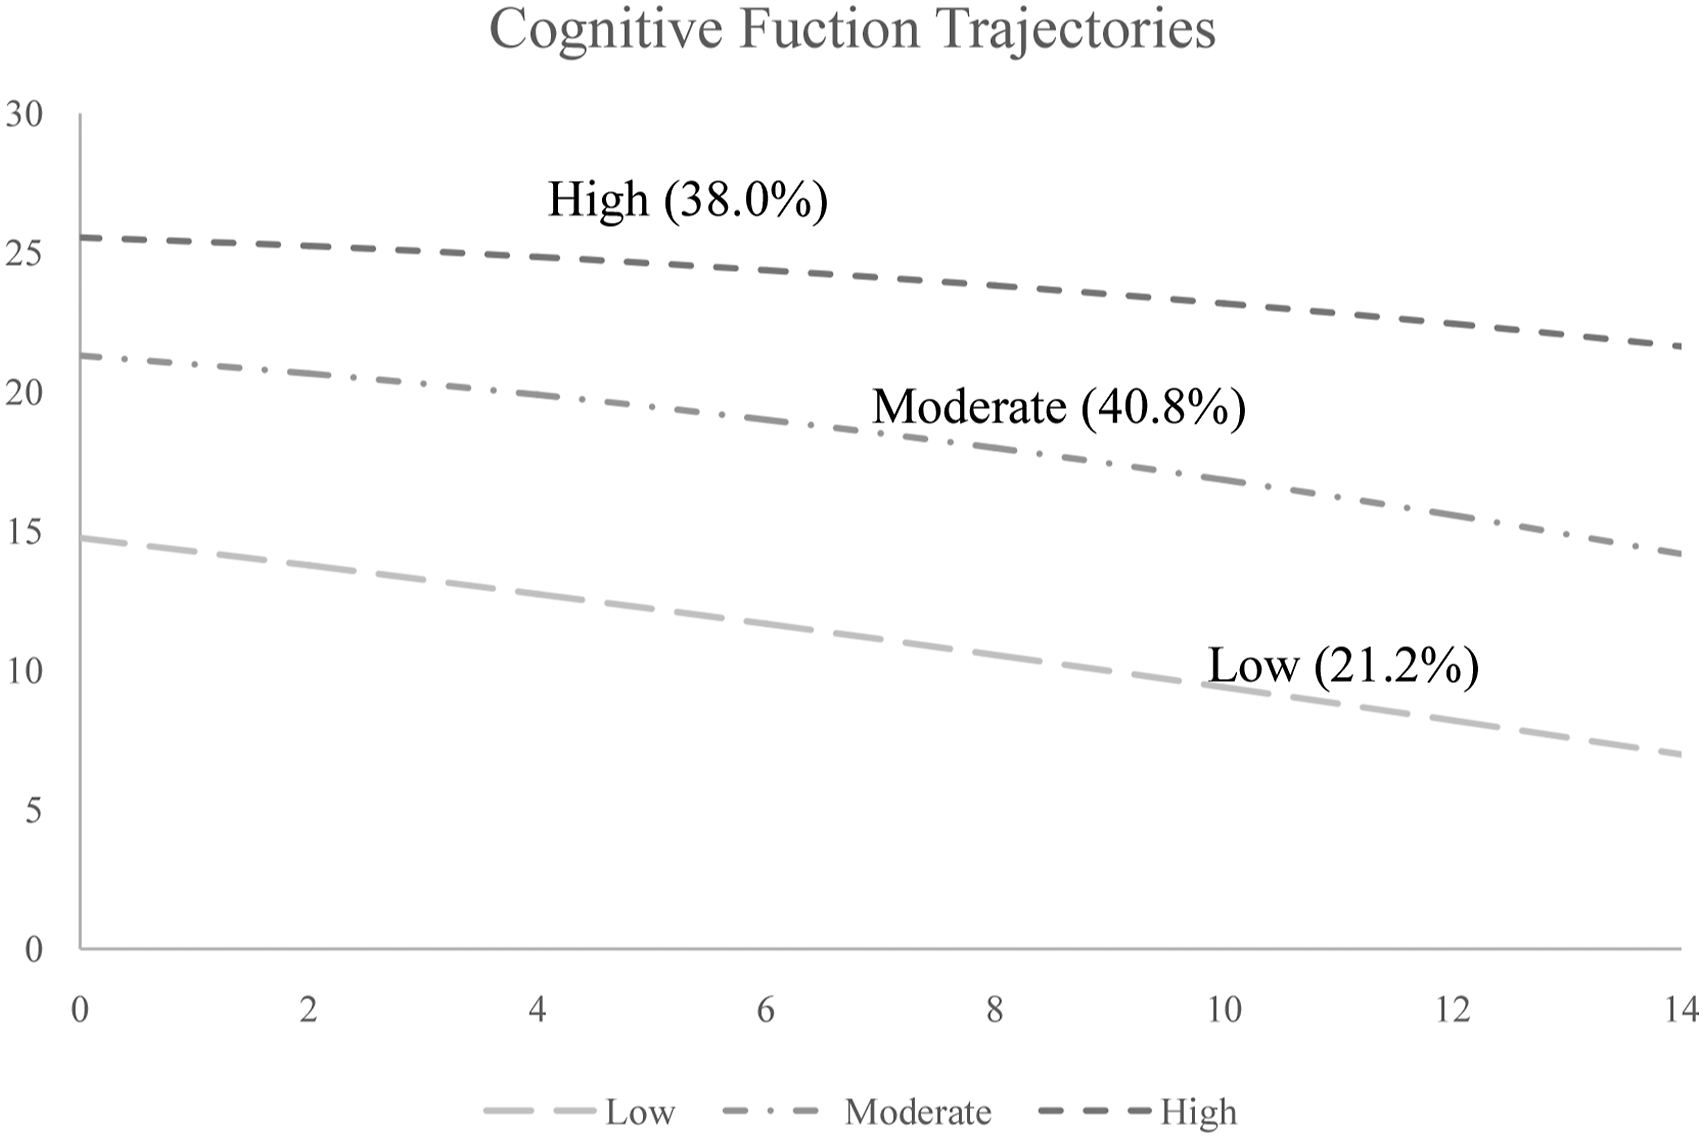
Influence of Joint Trajectories in Behavioral Risk Factors on Cognitive Function Trajectories
The Association between Joint Trajectories of Behavioral Risk Factors and Cognitive Function Trajectories.
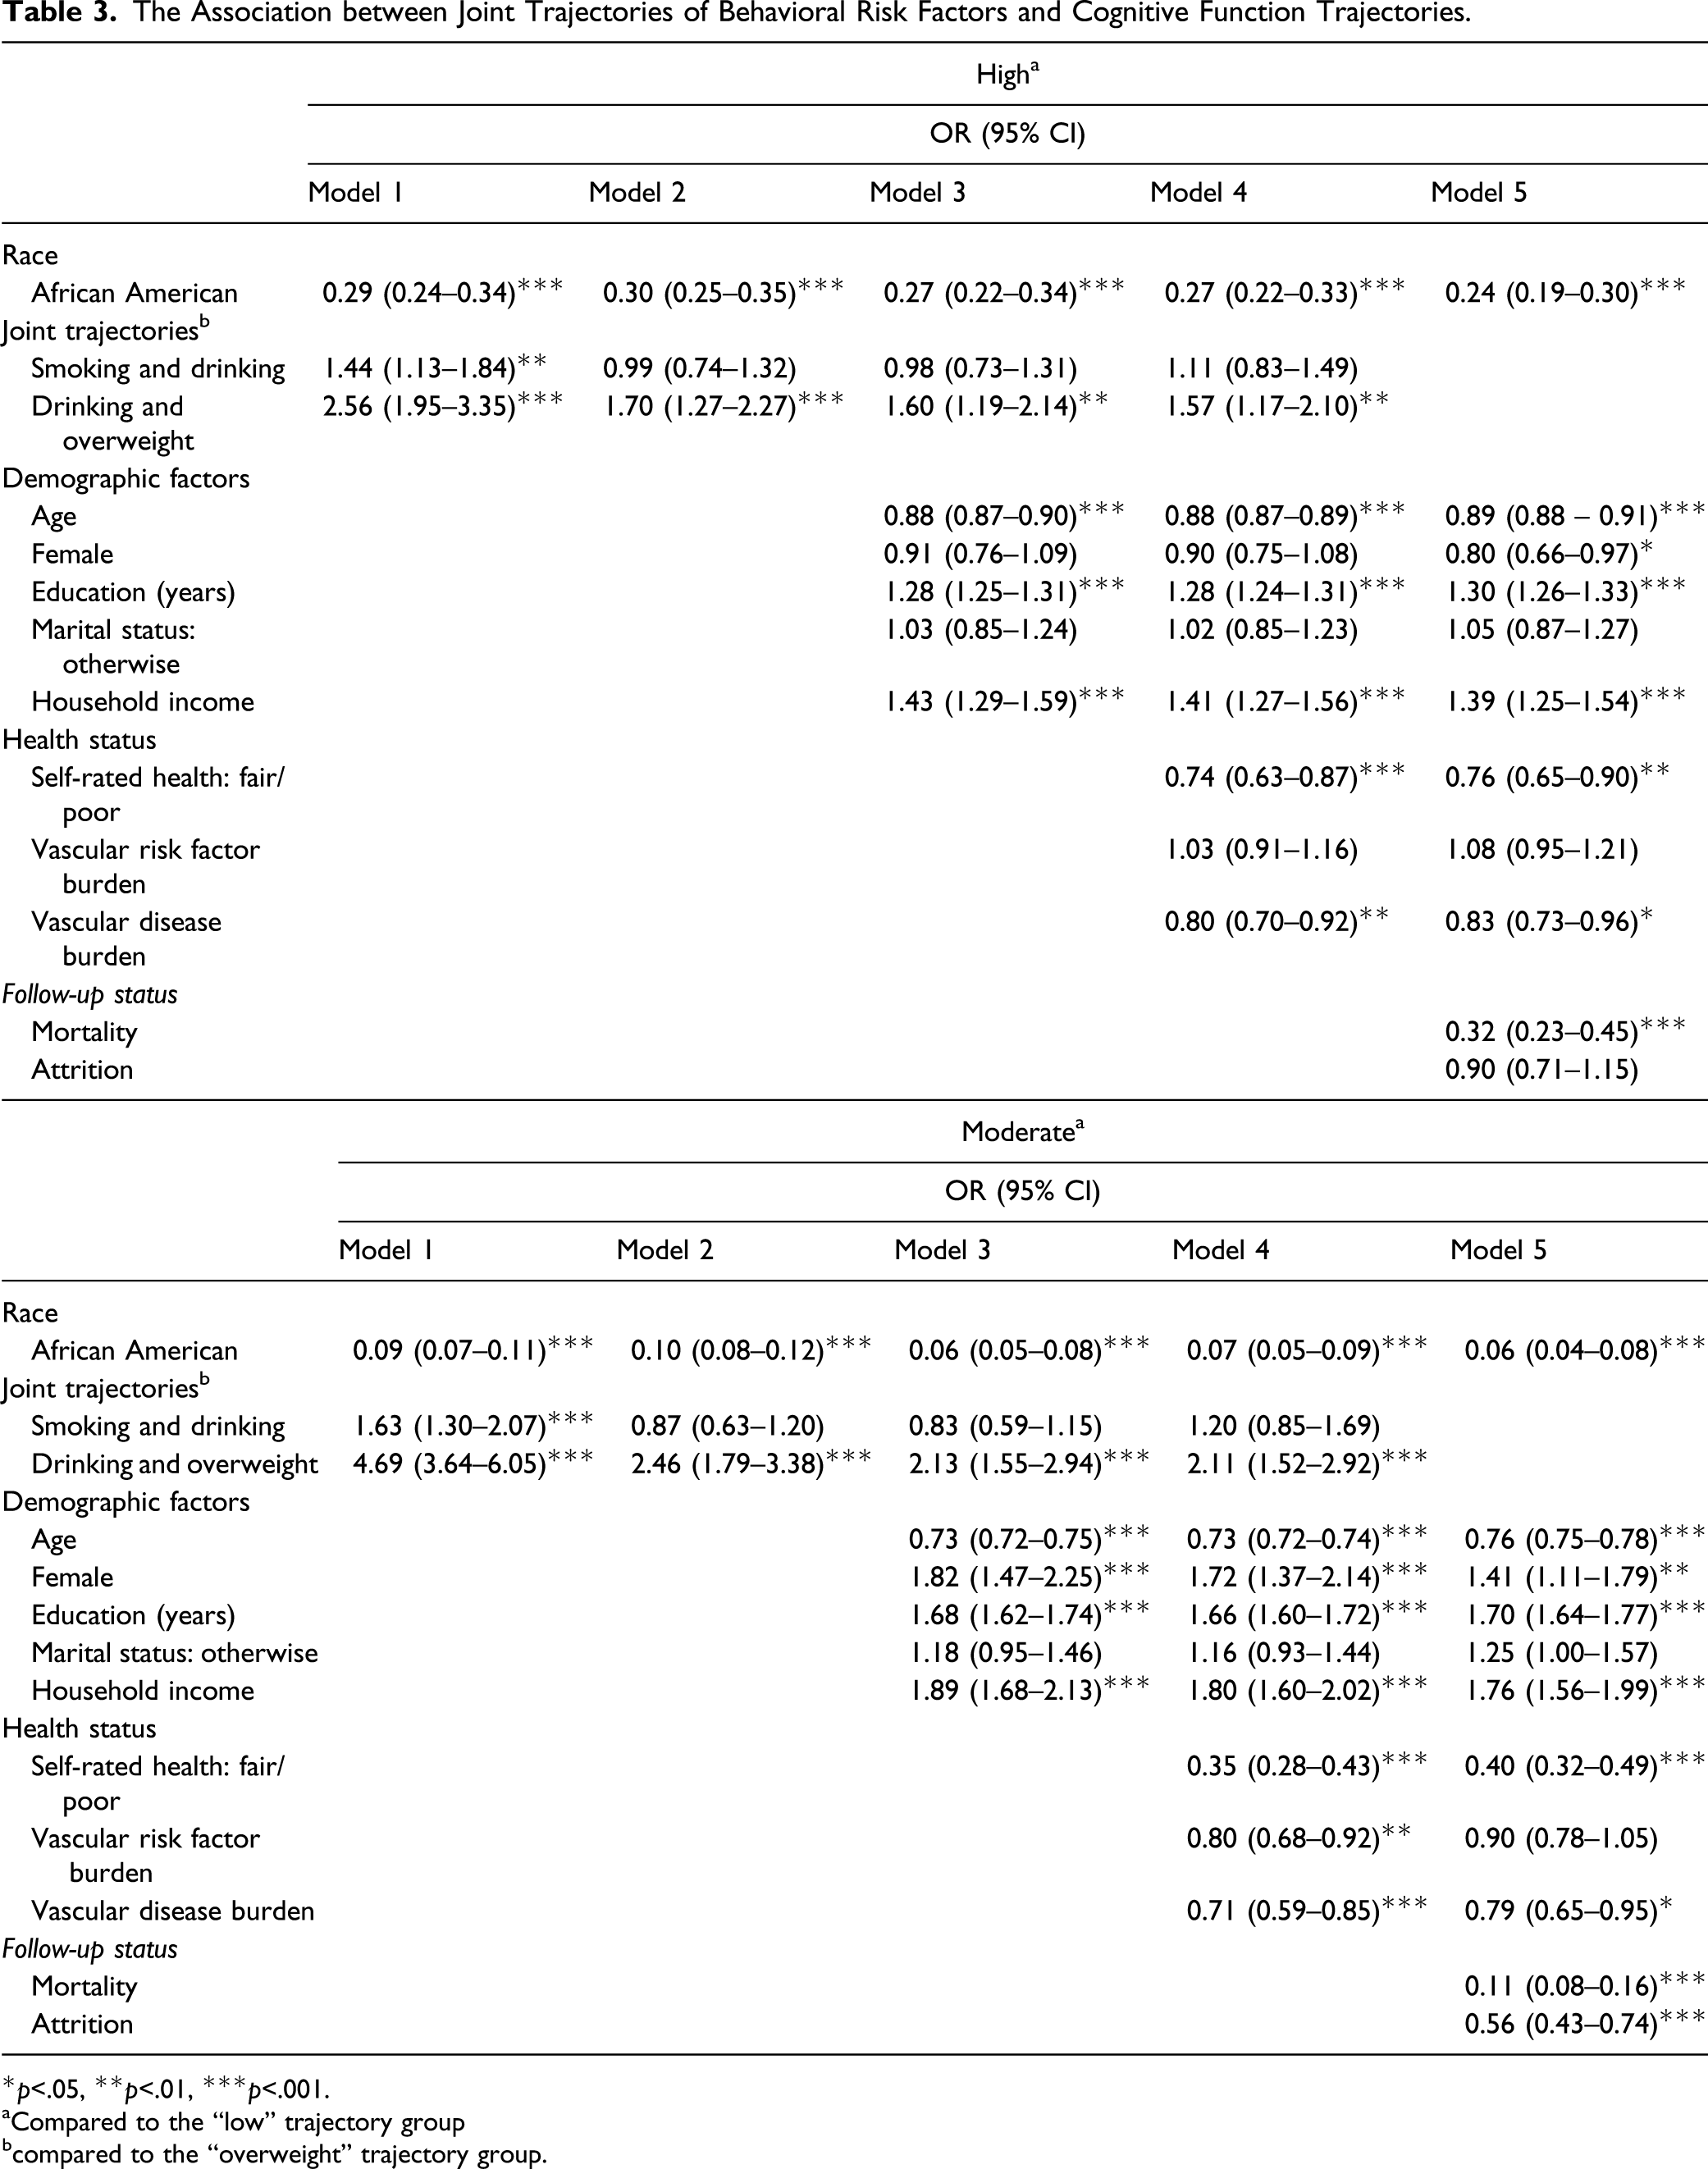
*p<.05, **p<.01, ***p<.001.
aCompared to the “low” trajectory group
bcompared to the “overweight” trajectory group.
Demographics, health status, mortality, and attrition were subsequently adjusted in Models 3–5. After adjustments, the “smoking and drinking” group was no longer associated with cognitive function trajectories. However, individuals in the “drinking and overweight” group remained more likely to be in the “high” (OR ranged from 1.57 to 1.70) or “moderate” (OR ranged from 2.11 to 2.46) cognition trajectory than those in the “overweight” group. In Models 3–5, African American race remained significantly associated with a lower likelihood of being in the “high” (OR ranged from 0.24 to 0.27) or “moderate” (OR ranged from 0.06 to 0.07) cognitive function group. In the final model (Model 5), several demographic and health-related factors, including age, education, household income, self-rated health, and vascular disease burden, were found to be associated with cognitive function trajectories.
Discussion
To the best of our knowledge, this is the first study attempted to examine the association between multiple trajectories of behavioral risk factors and cognitive function trajectories among older African Americans and white Americans. By analyzing the Health and Retirement Study data, three joint trajectories of behavioral risk factors (overweight, smoking and drinking, and drinking and overweight) were identified. Similar to prior cross-sectional study findings, smoking often co-occurred with alcohol drinking (Cohen-Mansfield & Kivity, 2011; Schneider et al., 2009), and alcohol drinking often co-occurred with being obese (Jentsch et al., 2017) among older adults. Furthermore, a longitudinal study examined the multiple trajectories of health-related behaviors (whether engaged in smoking, drinking alcohol, getting regular exercise, and having a health checkup) among Taiwanese elderly. “Smoking and drinking” was identified as one of the joint trajectory groups (Hsu et al., 2013), which is very similar to our study results. However, our study measured the changes in the number of cigarettes per day and drinks per week to depict a clearer picture of how smoking and alcohol consumption changed over time. Regarding cognitive function trajectories, three trajectory groups (low, moderate, and high) were identified. In the present study, the trajectories decreased while age increased which is consistent with prior study results (Chen & Chang, 2016; Hu et al., 2019).
Our study further showed that the joint trajectories of behavioral risk factors were associated with cognitive function trajectories. Compared to people in the “overweight” group, those in the “drinking and overweight” group had a higher likelihood of being in the moderate or high cognitive function group while adjusting for all covariates. These results showed a potential protective effect of alcohol use on cognitive function that is consistent with prior longitudinal studies which found that minimal and moderate drinking were associated with better cognitive function (Ganguli et al., 2005; Zhang et al., 2020). However, the “smoking and drinking” group was not associated with cognitive function trajectories. A prior research study found that the joint effect of smoking and drinking on cognitive function in the elderly might be influenced by an individual’s genetic susceptibility markers, apolipoprotein E (APOE) e4 alleles (Carmelli et al., 1999). APOE is a cholesterol transport plasma protein that has three different alleles (e2, e3, and e4), and it has been identified as one of the most well-established risk factors for Alzheimer’s disease, dementia, and cognitive decline. Presence of one or more APOE e4 alleles is associated with an increased risk of cognitive function impairments (Michaelson, 2014; Potter & Wisniewski, 2012). The prevalence of e4 alleles is higher among African Americans than non-Hispanic whites (Barnes & Bennett, 2014; Logue et al., 2011). Therefore, additional research is needed to investigate the relationship of genetic variation as a moderator or mediator of the association between behavioral risk factors and cognitive function among older Americans.
Consistent with prior research (Ayyagari & Frisvold, 2016; Flint & Bingham, 2019; Kato et al., 2013; Li & Hsu, 2015; Park et al., 2019), demographic factors (age, gender, education, and income) and health status (self-rated health and vascular diseases) were associated with cognitive function trajectories. Race was also a significant predictor of cognitive functioning. In this study, African Americans were less likely to be in the moderate or high cognitive function group than white Americans. Nevertheless, the aforementioned association was not changed by further adjustment for the joint trajectories of behavioral risk factors and other covariates. Therefore, the observed differences in cognitive function between older African Americans and white Americans are not explained by the joint changes in behavioral risk factors.
The differences in cognitive function between older African Americans and white Americans may be due to a multitude of other factors not measured in the current study. For example, African Americans in Chicago primarily live in a highly segregated and economically disadvantaged neighborhood. Numerous neighborhood factors have also been shown to impact cognitive functioning. One longitudinal study found that neighborhood socioeconomic status was associated with poor cognitive functioning and a greater decline in cognitive function over time among older Americans (Rosso et al., 2016). Prior research has shown African Americans living in the neighborhood with a low level of socioeconomic were associated with increased risk of smoking, excessive alcohol consumption, and obesity (Cohen et al., 2011; Karriker-Jaffe et al., 2012; Wong et al., 2018). Furthermore, neighborhood-level racial segregation is found to be associated with racial health disparities (Williams & Collins, 2016). In the United States, African Americans have the highest degree of residential segregation (Massey, 1990) and are more likely to live in poor neighborhoods (Williams & Jackson, 2005) that increase the risk of exposure to multiple behavioral risk factors that may lead to poor cognitive function. Therefore, future research should further examine the role of neighborhood characteristics on the cognitive health of older adults and to better understand the direct and indirect influences of these factors on observed racial disparities. In addition, resources and targeted interventions are needed for older adults who are aging in neighborhoods negatively impacted by structural and institutional barriers to equity and well-being.
Several study limitations should be noted in the study. First, data obtained from the HRS are based on self-report and maybe an under or overestimation of actual risk behaviors. This potential self-report bias applies to the vast majority of behavioral health research (Dowd & Todd, 2011). We are assuming that any reporting bias will occur at random and not prohibit the examination of the study question. Second, an individual’s status of smoking, drinking, and BMI prior to the baseline was not measured in the study. Therefore, before entering the study, individuals may have behavioral risk factors for a period of time that the study cannot capture that may impact the trajectory patterns. Third, our study measured cognitive function based on tests of immediate word recall, delayed word recall, serial 7’s test, backward count, and naming tests (date naming, object naming, and president/vice-president naming). Prior research has shown measurement bias in cognitive tests between older African Americans and white Americans, especially for “object naming” and “president and vice-president naming” in culturally influenced cognitive assessment tests (Jones, 2003). Fourth, given the nature of secondary data analysis, our study was not able to control all covariates that might have an impact on cognitive function. For example, social relationships (e.g., social activities, social networks, and social support) have been found to have influences on cognitive function (Kelly et al., 2017). Furthermore, due to data availability, only eight waves of HRS data (1998–2012) were analyzed to identify cognitive function trajectories. Nonetheless, the trajectory patterns and groups identified in the study were consistent with prior research. As a result, they would have little to no impact on study results. Last, given the nature of missing data in longitudinal studies, multiple imputations were conducted to minimize the loss of data due to items missing and to improve the validity of health research. In some cases, multiple imputation may give misleading results because data are not missing at random (Sterne et al., 2009). In our study, data are assumed to be missing at random given most of the missing values could be due to health issues among the older population.
Despite the aforementioned limitations, our study has several important implications for behavioral health and cognitive health promotion in the older population. Previous research has demonstrated the influence of individual behavioral risk factors on cognitive health in older adults. This study extended this prior work by identifying the joint trajectory patterns of behavioral risk factors and further examining their relationships with cognitive function trajectories over time. With a rapid increase of aging population in the United States, future behavioral (e.g., culturally targeted weight loss program) or pharmacological interventions (Bachurin et al., 2018; Hsu et al., 2017) should be developed to target vulnerable older people (e.g., racial minorities) at risk for low cognitive function due to behavioral, social, or environmental risk factors to promote their cognitive health.
Footnotes
Acknowledgment
The authors thank the Center for Clinical Translational Science at the University of Illinois at Chicago (which is supported by the National Center for Advancing Translational Sciences, National Institutes of Health, through Grant UL1TR002003) for their assistance with modeling and analyses. The content is solely the responsibility of the authors and does not necessarily represent the official views of the National Institutes of Health.
Authors’ Note
This study used the data from the Health and Retirement Study (RAND HRS Data version P, produced and distributed by the University of Michigan with funding from the National Institute on Aging (grant number: NIA U01AG009740)), Ann Arbor, MI.
Declaration of Conflicting Interests
The author(s) declared no potential conflicts of interest with respect to the research, authorship, and/or publication of this article.
Funding
The author(s) disclosed receipt of the following financial support for the research, authorship, and/or publication of this article: This work was supported by Rush-Searle Foundation Pilot Grant (grant number: 16121202-GR01).