
Abstract
Notwithstanding its importance as an internal source of financing, no analysis has examined why nonprofits choose to retain unrestricted net assets. As restricted net assets might not be used as desired by the nonprofit manager, unrestricted net assets are a more accurate definition of available internal resources than total net assets. This article tests several theories that might motivate nonprofit accumulation of unrestricted net assets. Furthermore, the empirical strategy employed allows an analysis of unrestricted net asset accumulation over time and overcomes several significant statistical estimation issues. The results suggest that nonprofits target profits and seek their accumulation over time, although targets may be set at very low levels. Furthermore, the results suggest that the low levels of profits accumulated annually are for the purpose of reducing organizational financial vulnerability. The results also suggest that many nonprofits behave as if leverage and unrestricted net assets are substitutes.
In any organization, profit refers to the excess of revenues over expenses during a fiscal period. Despite significant public investment in the nonprofit sector, no public policy exists regarding how much profit 1 a nonprofit organization (NPO) may earn in any given year or how long these accumulated profits (“net assets”) may be retained by a nonprofit. Even though these profits are themselves tax-exempt (from corporate or income taxes) and possibly acquired with tax-deductible donations, the Internal Revenue Service (IRS) has no regulations regarding these accumulations of resources within NPOs. Unlike a private firm that may distribute such profits to owners, the nonprofit “nondistribution constraint” prohibits such a distribution to officers, directors, or management, indicating that any such accumulation remain within the NPO for use by the organization (Hansmann, 1980).
Although certain analyses have examined NPO external financing (such as the determinants of donations or borrowing), the existing literature has not focused on nonprofit unrestricted net asset accumulation despite its importance as an internal source of financing. To date, no analysis has examined why NPOs choose to retain unrestricted net assets, the only class of net assets controllable by nonprofit decision makers rather than donors. This article adds to the existing literature in three ways. First, this article analyzes unrestricted net assets (segregated from restricted net assets) as a source of internal financing. As restricted net assets might not be used as desired by the nonprofit manager, unrestricted net assets are a more accurate definition of available internal resources than total net assets. Second, this article tests several theories that might motivate NPO accumulation of unrestricted net assets. To date, no study has undertaken such an analysis. Third, the empirical strategy employed allows an analysis of unrestricted net asset accumulation over time; furthermore, the strategy overcomes several significant statistical estimation issues, namely, endogeneity in regressors, omitted variable bias, and persistence in the dependent variable.
The results suggest that NPOs target profits and seek their accumulation over time, although NPOs might be setting targets at very low levels. Furthermore, the results suggest that the low levels of profits accumulated annually are for the purpose of reducing organizational financial vulnerability. Rather than simply accumulating unrestricted net assets for their own sake, these nonprofits do appear to act in manners consistent with sound business practices. The results also suggest that many NPOs behave as if leverage and unrestricted net assets are substitutes, similar to the findings in Bowman (2002).
The rest of the article proceeds as follows: the next section defines nonprofit net assets, differentiates nonprofit net assets from other organizations’ retained earnings, and further differentiates between unrestricted net assets and endowments; the third section summarizes the literature on why they are important to nonprofit organizations and states the testable hypotheses regarding nonprofit unrestricted net asset accumulation; the fourth section defines the variables used in the analysis, outlines the empirical strategy employed, and describes the data used; the fifth section discusses the results of the empirical estimation; and the sixth section outlines several policy implications of the empirical findings and concludes.
Defining Nonprofit Net Assets and Research Hypotheses
Just as with a for-profit entity, any annual excess of revenues over expenses results in a profit. These profits accumulate on an NPO’s balance sheet under “Net Assets,” which must equal Total Assets less Total Liabilities:

Therefore, net assets do not represent cash balances of the organization; rather, net assets represent a claim of ownership on assets owned by the organization. Net assets represent those assets reinvested within the NPO rather than used up.
An NPO that earns a profit in any period may direct these resources in one of three ways: (a) increase expenses so that the profit is used up in current operations, (b) invest in fixed assets which presumably are used in providing mission-oriented services, 2 or (c) retain the profits as a source of internal capital. Whereas investors evaluate for-profit entities on their profitability, donors evaluate NPOs, at least in part, on their spending (Parsons, 2003). Charity-rating agencies—such as GuideStar, the Better Business Bureau, and the Wise Giving Alliance, among others—evaluate NPOs on how much total spending is devoted to programmatic services; furthermore, evidence shows that these rating agencies influence the behavior of donors (Chen, 2009; Gordon, Knock, & Neely, 2009; Sloan, 2009). Therefore, donors and evaluators may not necessarily value the existence of profits, indicating that NPOs may have an incentive to maximize program spending or outputs in any given year (thereby reducing any potential profit) to attract donations.
Unique Features of Nonprofit Net Assets and Finance
Nonprofit net assets are differentiated from for-profit equity by the ability of donors to restrict certain assets. Generally Accepted Accounting Principles (GAAP) require nonprofit organizations to report on three classes of net assets—unrestricted, temporarily restricted, and permanently restricted net assets. These classes are based on whether a donor has imposed such a restriction on the gift (FASB, 1993). Reporting on these donor-imposed restrictions is one of the central characteristics of nonprofit financial accounting. Total net assets can be expressed as

There is no financial account termed restricted retained earnings in corporate accounting; retained earnings can be reinvested in the firm or distributed to shareholders as dividends. NPOs may have net assets that functionally appear synonymous with corporate retained earnings, but the resources may be unavailable to the nonprofit due to a donor-imposed restriction as to use or timing. Whereas “net assets” might represent a form of internal capital, “unrestricted net assets” might be a better definition as assets financed by donor-restricted resources cannot be disposed of as the nonprofit desires. A donor may require that the organization spend the money in a specific way (a temporarily restricted net asset) or may forbid spending the donation at all, thereby requiring the nonprofit to retain it (a permanently restricted net asset). Releasing restrictions requires either the involvement of the donor or the courts; in the latter case, courts may alter restrictions that are impracticable or impossible to maintain, although the intent of the donor is still maintained as closely as possible.
Another important distinction between nonprofit and for-profit finance is the difference in accounting for equity infusions. A corporation issuing stock does not report this investment as revenue on its activity statement; rather, this equity is accounted for as “paid-in capital” and is distinguished from “retained earnings.” Corporate accounting, then, differentiates between resources invested in a firm and the profits generated from operations (exchanges with customers). In contrast, a nonprofit raising capital through gifts (such as through a capital campaign) reports such infusions as revenue. Essentially, then, all nonprofit profits are treated as “retained earnings.” A nonprofit engaged in a capital campaign might generate deficits from operations that are masked by paid-in capital from donors that are one shots (and, therefore, nonrecurring). Nonprofit accounting does not distinguish between profits accumulated from service provision and those used to build the organization. 3
By 2003, NPOs had accumulated more than US$658 billion in unrestricted net assets, representing 70% of the nearly US$939 billion in total net assets; furthermore, this represented real growth in unrestricted net assets of more than 17% from 1998. Temporarily restricted net assets stood at nearly US$137 billion in 2003, an increase of nearly 34%, whereas NPOs reported nearly US$144 billion in permanently restricted net assets—a 35% increase from 1998. Hence, although unrestricted net assets have grown less slowly than restricted net assets during the time period of this study, they still represent the vast majority of retained resources in the sector. 4
Another feature unique to the nonprofit sector is the concept of an “endowment” in which assets are retained and invested for the purpose of generating additional income for the organization. One issue is that the term endowment has come to mean any such asset retained, whether it has been retained due to donor behest (indicating that it is restricted) or by the board of directors (indicating that it is unrestricted—a “quasi-endowment”). In certain situations (such as a fiscal shock), boards can alter their own policy and use the resources as they deem necessary. 5 A board does not have the power to change a donor’s intent, rendering such restricted endowments unavailable. In fact, the Uniform Prudent Management of Institutional Funds Act (UPMIFA)—which outlines specific investment authority and responsibilities of endowment management by boards—is only applicable to board-designated endowments if a donor makes a gift to that board-designated endowment (Schneider, DiMeo, & Benoit, 2005). Although unique to the sector, only a small fraction of organizations employ endowments. 6
Motivations for Accumulating Net Assets by Nonprofits
Without accumulated internal capital (net assets), an NPO would have to finance its assets for use in its operations with debt (external capital) only. To see this, we can rewrite Equation 1 as

which separates assets into those financed with debt (Total Liabilities) and those that are financed internally (Total Net Assets). 7 Debt (Total Liabilities) is difficult to obtain without some collateral (assets) that protects the lender in the case of financial bankruptcy or insolvency by the borrower. Both Hansmann (1987) and Tuckman (1993) indicate that nonprofit financing sources are more limited than private companies as NPOs are unable to issue equity shares, making net assets valuable to nonprofit managers as a source of internal financing. Also, seasonality in revenue sources might make NPOs desire net assets as a means of smoothing short-term liquidity needs. Net assets, then, are desirable not only for long-term financing, as existing theory suggests, but also for short-term financing.
Hypothesis 1: NPOs adjust unrestricted net assets over time by accumulating profits.
Based on Equation 3, net asset accumulation is dependent on capital structure, yet no consensus exists as to how NPOs behave with respect to debt (Denison, 2009). The static trade-off theory suggests that NPOs compare the costs (interest and potential bankruptcy) and benefits (lower borrowing rates and reduced agency costs) of debt and choose an optimal level of borrowing. Leverage can be used to limit free cash generated by an organization (to service the debt) as a control function (Bowman, 2002). The static trade-off theory would predict that net assets and leverage are positively related as leverage and profitability would increase together. However, the pecking order theory indicates that NPOs prefer internal financing to external financing because internal financing is less costly to the organization. Under this theory, NPOs view accumulated profits and debt as substitutes (Bowman, 2002), suggesting an inverse relationship. Bowman (2002) finds evidence to support the pecking order theory in NPOs for those organizations without endowments, and unrestricted net assets exclude endowments.
Hypothesis 2: The debt levels of NPOs are inversely related to unrestricted net assets.
Beyond capital structure, net assets may also allow nonprofit managers to subsidize current or future clients (Chang & Tuckman, 1990; Tuckman & Chang, 1992). In this understanding, net asset accumulation occurs so that an NPO can price services at less than full cost (which implies the generation of operating deficits for those services); 8 the NPO can then draw on these accumulated unrestricted net assets to cover these particular losses without jeopardizing the overall financial condition of the organization.
Hypothesis 3: NPOs increase unrestricted net assets as the need to subsidize clients increases.
Net assets may also reduce the financial vulnerability of NPOs and allow service continuity despite changes in revenues or expenses. Tuckman and Chang (1991), Greenlee and Trussel (2000), and Yan, Denison, and Butler (2009) note that revenue diversification is a risk-reducing strategy employed by NPOs; furthermore, Carroll and Stater (2009) empirically demonstrate that revenue diversification decreases financial vulnerability by decreasing revenue volatility. Tuckman and Chang (1991) demonstrate that inadequate net asset balances are an indicator of financial vulnerability in NPOs; subsequent research by Greenlee and Trussel (2000), Hager (2001), Trussel (2002), and Trussel and Greenlee (2004) support these findings. By holding net assets, NPOs may, for example, service debt, maintain programmatic output, and not scale back on services because of business cycles that affect organizational revenue sources. NPOs, then, may seek to retain net assets so that deficits may be temporarily financed using this internal capital.
Hypothesis 4: NPOs increase unrestricted net asset accumulations to decrease financial vulnerability.
Finally, net assets also provide nonprofit managers with independence from donors’ expectations (Chang & Tuckman, 1990; Tuckman & Chang, 1992). Investment income helps generate annual profits (and the accumulation of net assets), providing NPOs with independence from programmatic output (as investment income does not depend on donor or client satisfaction). Net assets, in this understanding, can generate additional revenues from investing these retained profits rather than from providing services.
Hypothesis 5: NPOs increase unrestricted net asset accumulation as investment returns increase as there are no client or donor demands on this revenue.
This article analyzes why nonprofits themselves choose to retain net assets that they do have control over (unrestricted net assets) rather than simply maximizing output. The existing literature suffers from three limitations that this research seeks to address. First, given that NPOs may not have access to all their retained net assets, the assumed link to total net assets as the definition of usable internal capital in existing theories is problematic. The motivations for seeking to accumulate profits in the exiting literature assume that the nonprofit manager can use these retained net assets for some specific purpose. The existing literature largely ignores that NPOs may be unable to use donor-restricted net assets as the organization desires, which is a unique attribute of nonprofit finance. For purposes of this article, unrestricted quasi-endowments are included as part of the organizational choice to retain unrestricted net assets as these resources are technically available for use as an internal source of capital, should NPOs and their boards wish.
Second, the existing literature has not empirically analyzed whether the theories of how and why NPOs retain net assets are valid when applied to unrestricted net assets specifically. Finally, examining how unrestricted net asset balances change over time is essential to understanding nonprofit organizational behavior. The accumulation of net assets (let alone unrestricted net assets) has not been analyzed longitudinally to determine whether NPOs do in fact target these internal capital accumulations. Furthermore, the statistical strategy employed in this panel data analysis overcomes several significant issues, resulting in consistent and unbiased estimates.
Explanatory Model of Unrestricted Net Asset Accumulation
The strategy devised to test the preceding hypotheses is described fully in this section. The variables used in the analysis are first defined, followed by the statistical specification. The discussion of testing the first hypothesis is postponed until specification of the model in the next section.
Defining the Variables
The dependent variable in this analysis is the unrestricted net assets balance of nonprofit i at the end of year t, or UNA it . To account for size differences between organizations, UNA it is transformed by taking the natural logarithm of the variable.
To test the capital structure hypothesis (Hypothesis 2), a debt ratio variable is included. The variable LEVERAGE it is defined as the ratio between ending-year balances in total liabilities and total assets, as in Bowman (2002). As small NPOs may not be willing or able to assume financial debt, this broad-based definition that includes all liabilities is selected.
To evaluate whether the need to subsidize certain clients leads to increased unrestricted net asset accumulation (Hypothesis 3), the variable SUBSIDIZE it is included. As data are not available on direct subsidies to particular clients served by particular nonprofits, a proxy is used. SUBSIDIZE it is defined as the ratio of revenues earned by providing goods and services to total program expenses. The variable captures the degree to which a nonprofit covers program expenses for mission output, with program revenue directly tied to this output; the variable essentially measures how “commercial” an NPO is. A higher ratio implies that an NPO’s programmatic output (measured using expenses) generates the revenues associated with incurring these expenses—for example, patient expenses at a hospital being offset by patient revenues earned by providing the output. A lower ratio implies the opposite, that an NPO may need to seek other revenue (such as donations, investment income, government grants, etc.) to subsidize programmatic output. 9
To test whether nonprofits try to reduce financial vulnerability by increasing unrestricted net assets (Hypothesis 4), a variable is included to measure revenue diversity, a proxy for vulnerability. CONCENTRATION it is defined using a Herfindahl index of revenue sources, as in Tuckman and Chang (1991), defined as the sum of (Revenue j / Total Revenues)2. 10 A measure approaching one would indicate extreme revenue concentration, whereas a measure approaching zero would indicate revenue diversity.
NPOs that can shed expenses when revenues decline are better able to reduce financial vulnerability (and deficits) than firms with high levels of fixed costs. Fixed costs cannot be reduced in such instances as the nonprofit is obligated for these expenses. The variable FIXED_COSTS it is defined as the ratio of fixed costs (occupancy, interest, and depreciation) to total expenses. 11 Taken with revenue concentration, these two variables are measures and indicators of NPO financial health (Greenlee & Tuckman, 2007). 12
To test the hypothesis that investment returns lead to an increase in unrestricted net assets (Hypothesis 5), a measure of the nonprofit’s return on investments (ROI it ), defined as all investment income for the year divided by the average annual balance of invested assets, is included. This hypothesis implies that the NPO has invested in certain assets that are producing additional income—such as interest, dividends, or rents—allowing the nonprofit to free itself from market output (Bowman, Keating, & Hager, 2007). As investment income for the year can be negative (such as a realized investment loss), this definition includes negative as well as positive returns. 13
An additional control variable, SIZE it , is included, which is defined as the natural logarithm of total revenues, as in Core, Guay, and Verdi (2006). Larger organizations might have a different ability to retain unrestricted net assets as compared with smaller organizations (due to, for example, economies of scale in operations).
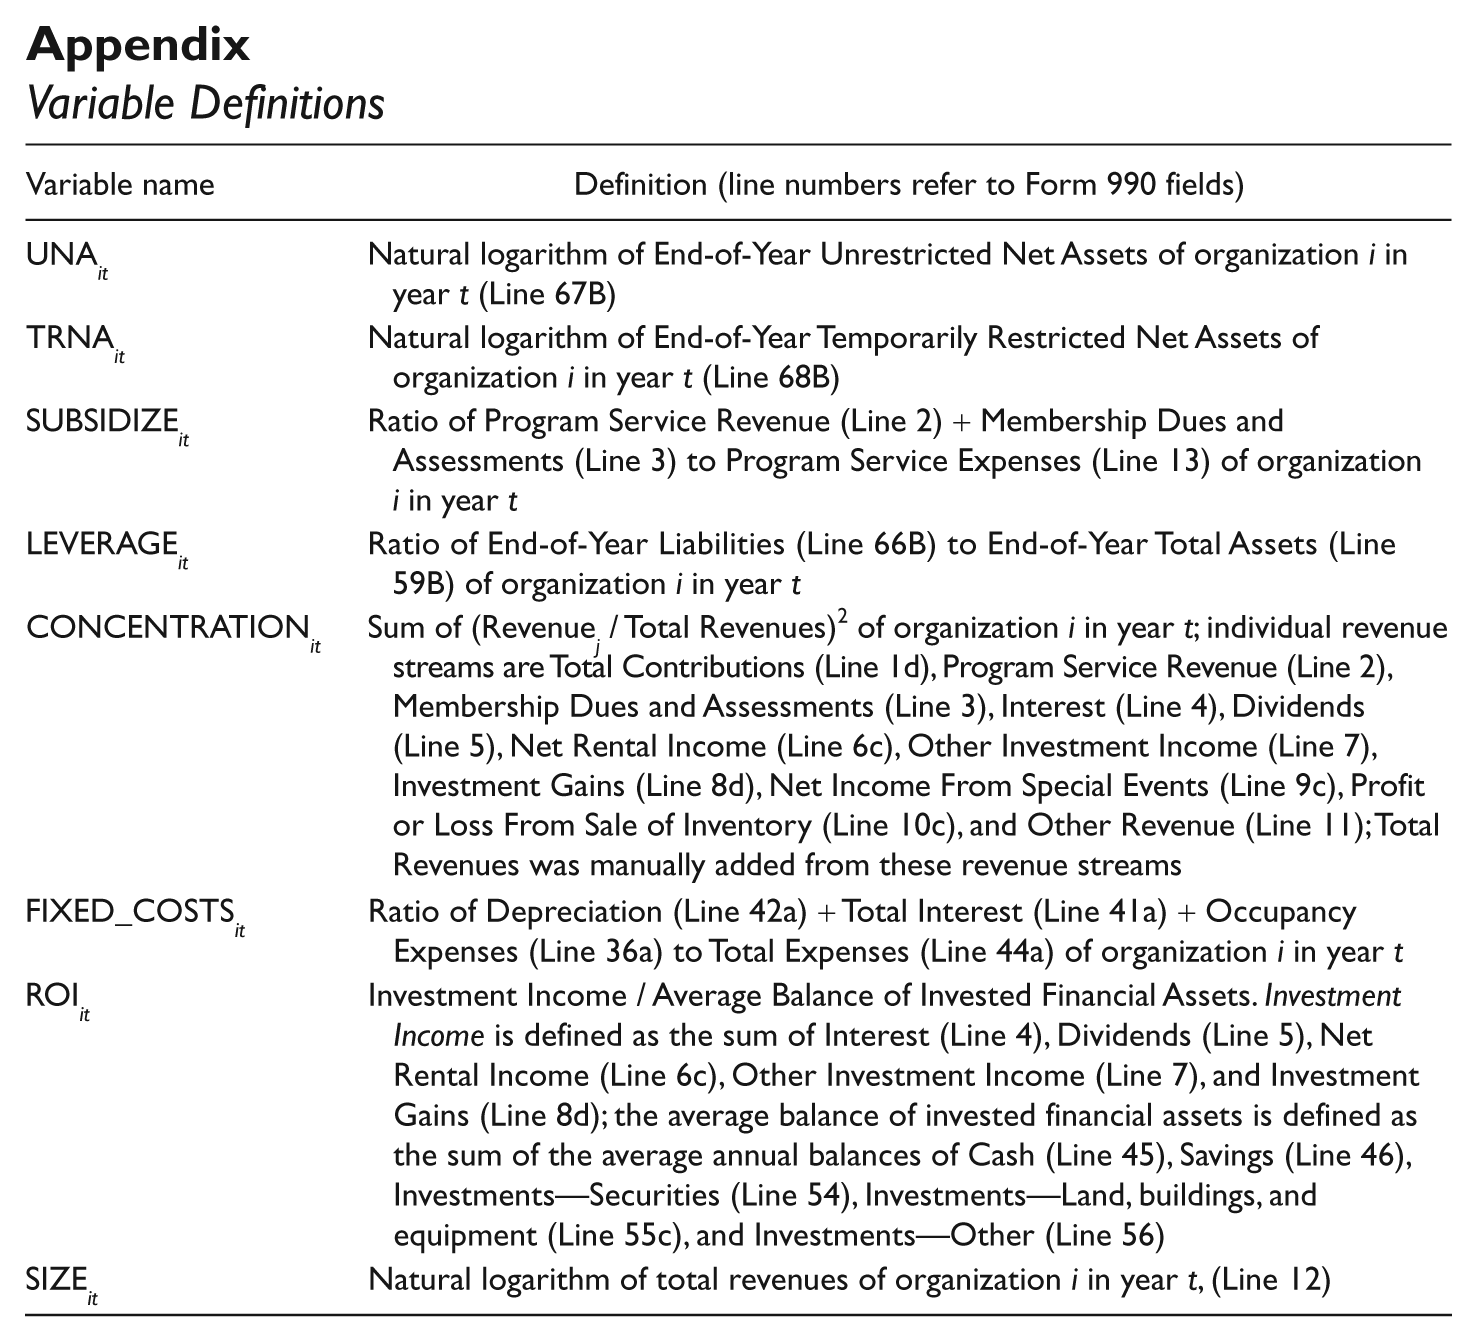
All financial variables are adjusted for inflation using the Consumer Price Index. Furthermore, all variables are winsorized at the 1% and 99% level to reduce the effect of extreme outliers. The appendix summarizes all variables used in the empirical analysis.
Specification of the Model
Based on the previous discussion, the following regression model can be expressed:
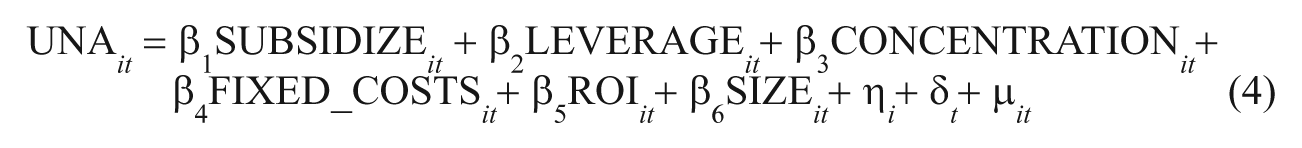
where η i are organizational fixed effects, δ t are year effects, and µ it is the error term. 14 Equation 4 does not account for the persistence in the dependent variable. This relationship is clear when expressed as

Equation 5 indicates that the current unrestricted net asset balance is equal to the prior year’s balance plus any annual unrestricted profit or deficit during the current year. Unrestricted net assets, then, are highly correlated from one period to the next by definition. Equation 4 can be expanded, then, to include a lagged dependent variable on the right-hand side of the equation to address this persistence. Although including the lagged dependent variable addresses a specification issue, Nickell (1981) demonstrates that this lagged dependent variable is correlated with the fixed effect; this correlation results in sizable estimate bias in panel data structure, that is, “small T, large N” (that is, few years but many cross-sections), as the current analysis uses.
An additional issue with the specification is that the model may have issues of endogeneity with respect to the regressors, potentially biasing the estimated results. The variables used in this regression may be determined simultaneously with the amount of unrestricted net assets retained by the NPO. All regressors except for the time effects are therefore treated as endogenous.
The general method of moments (GMM) difference estimator proposed by Arellano and Bond (1991) is used to address these specification issues (that is, potential endogeneity in the regressors as well as a correlation between the individual effect and the lagged dependent variable). This method first differences the equation, which removes the organizational effect as well as any associated omitted variable bias (Baum, 2006). To overcome the correlation between the regressors (including the lagged dependent variable) and the error term, the Arellano-Bond (1991) estimator uses lags of all endogenous variables as instrumental variables. In this case, the lags begin with the second period (t – 2) as the second lag is, by definition, not correlated with the current error term (µ it ); all additional available lags are also used. The use of lags as instruments addresses the potential endogeneity issue of the independent variables as lagged regressors are predetermined (and, therefore, exogenous). These internal instrumental variables are especially important when other potential instruments are difficult or impossible to determine, as in this case.
The coefficients on the independent variables and the lagged dependent variable are interpreted in dynamic panel modeling as the rate of adjustment of each variable. In the case of the lagged dependent variable, the coefficient captures whether NPOs adjust to a target level of unrestricted net assets over time (Hypothesis 1). The following explanation aids in interpreting the lagged dependent variable. At the beginning of any fiscal year, an NPO sets a target unrestricted net asset balance for the end of the year, denoted UNA* it + 1, and this target is based on organization characteristics (those outlined in Equation 4), or

In any particular year, an NPO may only reach a fraction of the desired accumulation (for example, an NPO might target a specific amount of unrestricted net asset accumulation but only be able to adjust a portion of it in a given year). The adjustment toward the target can be best represented with a standard partial adjustment model:

Equation 7 indicates that the unrestricted net assets accumulated during the fiscal year changes based on what an NPO’s unrestricted net asset balance currently is (UNA it ) and what the NPO desires it to be (UNA* it + 1). λ represents the rate of adjustment in the dynamic model; a λ (coefficient) equal to 1 indicates that an NPO can fully adjust a variable in a single year, whereas 0 is indicative of no adjustment at all during the year. Rearranging Equation 7 and substituting Equation 6 yields the following:

Equation 8 indicates that the coefficient on the lagged dependent variable measures the percentage of the gap closed (between target and actual) by the NPO by year-end. A positive and significant coefficient, therefore, suggests NPOs in general are targeting and growing accumulated profits (Hypothesis 1).
Finally, due to potential heteroskedasticity in panel data, robust standard errors are calculated using Roodman’s (2006) two-step Arellano-Bond estimator, with the Windmeijer finite-sample correction to adjust the reported standard errors.
Data
The data used in this article comes from the “The National Center on Charitable Statistics (NCCS)–GuideStar National Nonprofit Research Database” (hereafter called the digitized data) for fiscal years 1998 through 2003. The digitized data cover all public charities required to file the Form 990 with the IRS, 15 a standardized report that must be submitted by public charities with gross receipts in excess of US$25,000 annually. The digitized data contain financial variables on each organization, specifically all revenue, functional expenses, and balance sheet items. The digitized data are verified by the NCCS, thereby increasing the quality of the reported data.
The digitized database contains 1,388,480 observations for 338,863 organizations. Approximately 20% of the sample (283,814 observations for 75,583 organizations) filed the Form 990EZ, which does not contain data on unrestricted net assets, the dependent variable for estimation. These observations are not included in the final analysis.
The theory developed in the third section is relevant for nonprofits that are formed to provide voluntary services for various segments of society for the public’s benefit. Many nonprofits, however, are formed to provide benefits to their members primarily (that is, private goods). This includes professional associations, societies, sororities and fraternities, fund-raising organizations, political parties, religious organizations, social and country clubs, labor unions, research organizations, block associations, professional sports leagues, among others. Fischer, Wilsker, and Young (2011) hypothesize that the public or private nature of a nonprofit is intrinsically linked to how it finances itself (and, by extension, how it chooses to retain unrestricted net assets or not); furthermore, Bowman (2002), in his analysis of capital structure, excludes NPOs with excessive levels of unrelated business income as these organizations’ finances are more likely similar to for-profits than other NPOs. Therefore, NPOs that exist for the provision of private goods and services were eliminated from the sample. 16 This eliminated 398,241 observations covering 99,275 organizations.
An additional 165,327 observations for 37,172 organizations were dropped because the organizations did not report their financial information in accordance with GAAP, requiring restricted and unrestricted net assets to be segregated. Furthermore, 124,802 observations covering 43,073 organizations were eliminated because they report their financial information on the cash or some other basis of accounting and not on the accrual basis of accounting (as required by GAAP). As the measurement of net assets may be influenced by the accounting basis used by an organization, only those NPOs that measured their financial information consistent with GAAP were included. 17 The final sample for analysis is 416,296 observations covering 83,760 organizations.
The dynamic panel modeling estimation requires the use of lags and differencing. Using second lags (and beyond) as instruments eliminates organizations with insufficient and missing data for estimation. Furthermore, the use of the difference GMM estimator reduces an additional year of data. The final sample, once accounting for the statistical estimation needs, is 178,896 observations representing 58,180 organizations. The reduction in sample size is comparable with Fisman and Hubbard (2002, 2005) and Core, Guay, & Verdi, (2006).
Prior authors (such as Brooks, 2005; Fischer, Wilsker, & Young, 2011; Marudas, 2004; Tuckman & Chang, 1992, among others) have analyzed individual nonprofit subsectors due to significant differences in financial characteristics, missions, revenue diversity, and the like. Importantly, Denison (2009) finds that different activities of NPOs, measured using National Taxonomy of Exempt Entities (NTEE) codes, display different preferences and willingness to assume external financing (and, by extension, retain net assets as internal capital). Table 1 presents the summary statistics for the entire sample as well by several major nonprofit subsectors: Education (excluding Higher Education), Higher Education, Health and Mental Health, Human Services, and Arts. NPOs in other subsectors are reported under “All Others.” Colleges and universities (Higher Education) are broken out from Education as they have been the cause of much public concern about net asset accumulation: Colleges and universities faced criticisms in 2006 and 2008, when the Senate Finance Committee questioned the retention practices of higher education institutions, given steep increases in tuition costs.
Summary Statistics by Subsector, 1998-2003

Note: Table 1 reports the mean of all variables used in estimation by subsector from 1998 through 2003. The standard deviation is reported in the parentheses. PROFIT MARGIN is not included in the statistical estimation but is provided to indicate the average annual profit margin (defined as the Change in Unrestricted Net Assets / Total Revenue) during the time period for discussion purposes. The category “All Others” includes environmental, animal-related, community improvement, and capacity building.
The average size of NPOs included in the sample is US$1.2 million (the antilog of US$14.01) in total revenues, which is much smaller than the average size of other recent nonprofit analyses. The average total revenue in Fisman and Hubbard (2002) is nearly US$35 million, whereas the average total revenue in Core et al. (2006) is more than US$63 million. This reflects the digitized database’s inclusion of all Form 990 filers rather than large filers only, as in the Statistics of Income (used in both mentioned studies). To the extent that the nonprofit sector is populated with small organizations, the sample used in the current analysis may be more representative of the sector as a whole than prior studies.
Furthermore, the average balance of unrestricted net assets retained by NPOs is less than US$280,000 (the antilog of US$12.54). Whereas elected officials and public concern have focused on large accumulations of “endowments” by certain institutions (especially colleges and universities), the average NPO retains a relatively low level of unrestricted net assets.
The low average balance of unrestricted net assets is unsurprising when one considers the low average profit margins of NPOs in the final sample. As Table 1 shows, the average operating profit margin (defined as the Change in Unrestricted Net Assets / Total Revenues) is only 2.6% for the time period. Whereas All Others report the highest subsector profit margin at 5.2%, Housing and Shelter essentially broke even for 1998-2003.
Estimation Results
The results of the estimation for individual subsectors based on the strategy outlined appear in Table 2. The results include two Wald tests: one that tests the joint significance of the reported coefficients and the other being a test of the joint significance of the time dummies. To check for potential misspecification of the estimated model, the z1 and z2 statistics test for the existence of first- and second-order autocorrelation in the error term. First-order serial correlation is expected in Arellano-Bond estimations (Baum, 2006). To test for correlation between the instruments and the error term in the first-differenced equation, the Hansen J statistic is reported. 18
Estimation of Nonprofit Unrestricted Net Asset Accumulation, 1999-2003

Note: Table 2 reports the results of estimating the determinants of nonprofit unrestricted net assets with the Arellano-Bond (1991) dynamic panel data estimator. Robust standard errors are in parentheses. The Wald test statistic’s null hypothesis is that all coefficients on the determinants of unrestricted net assets are jointly equal to zero. Year is the Wald test of the significance of the year indicator variables. Degrees of freedom are reported in parentheses. z1 reports the Arellano-Bond test for AR(1) serial correlation in the error term, and z2 reports the Arellano-Bond test for AR(2) serial correlation in the error term; the null hypothesis in each test is that no serial correlation exists. Hansen is a test of the overidentifying restrictions under the null hypothesis that the 94 instruments are valid (exogenous).
Significant at the 10% level. **Significant at the 5% level. ***Significant at the 1% level.
Columns 1 through 7 report the results for nonprofit subsectors. The results indicate that second-order serial correlation is not biasing the reported errors. Furthermore, the Hansen test indicates that the lagged instruments are valid (exogenous) for the subsectors reported, except for the Human Services subsector. The results for the Human Services subsector should be interpreted with caution due to this concern. The overall results suggest that, as found by prior research, different subsectors tend to behave differently with respect to financial behavior.
The results in Table 2 indicate that NPOs in general adjust to a target-unrestricted net asset level over time (Hypothesis 1), evidenced by the positive and significant coefficient on the lagged UNA variable. This finding lends longitudinal support to Tuckman and Chang’s (1992) cross-sectional finding that NPOs seek to increase net assets (although their focus was only on total net asset accumulation). The coefficient on the lagged UNA variable shows variation across the various subsectors, indicating that nonprofits with different missions (defined by activities) are able or willing to retain unrestricted net assets differently.
The coefficient also indicates a high rate of adjustment; for example, Higher Education NPOs close nearly 90% (that is, 1 – 0.105) of the gap in unrestricted net assets annually on average, whereas other Education NPOs close nearly 77% (that is, 1 – 0.230). Given the low level of unrestricted net assets in the sector, this result might indicate that NPOs are setting low targets for themselves, perhaps to appear in need of donor or government funds, perhaps to maximize client output, or perhaps because certain grants and contracts do not allow NPOs to earn a profit in the first place. For example, Health and Mental Health NPOs report an average 1.9% profit margin and are able to adjust approximately 75% (1 – 0.247) toward their targets; this implies a target increase in unrestricted net assets of only 2.5% (0.019 / 0.753). This may be indicative of Brooks’s (2005) finding that NPOs are service maximizers (that is, NPOs seek maximal program spending), and this objective may result in increases in unrestricted net assets that are exceptionally low.
LEVERAGE is significant and negative for most NPO subsectors, providing support for the pecking order theory (Hypothesis 2) and supporting the findings of Bowman (2002). The results also suggest that some NPO subsectors—such as Human Services and Arts—do not view leverage and unrestricted net assets as perfect substitutes (as the coefficient is less than 1, indicating organizations offset unrestricted net assets at a slower rate). Education and Higher Education seem to reduce unrestricted net assets at a faster rate than leverage is acquired, which may indicate that leverage is actually the cheaper financing source for these NPOs (who may be more likely to have access to low-cost tax-exempt borrowings). All Others report a leverage coefficient consistent with leverage and unrestricted net assets being nearly perfect substitutes. 19
Leverage does not appear to have an effect on certain subsectors (Health and Housing and Shelter), contrary to both the static trade-off and pecking order theories. Perhaps, these NPOs maintain their unrestricted net assets to ensure debt covenants are payable in the future, or perhaps these NPOs are required to have a certain unrestricted net asset balance as reserve prior to lenders providing debt. These two subsectors are in fact the most leveraged of all subsectors reported. 20
The results do not lend empirical support to Hypothesis 3, that NPOs increase unrestricted net assets as subsidy need increases, ceteris paribus. One explanation for this contrary finding might be that organizations that rely on subsidies for operations do not wish to appear too wealthy. Marudas (2004), for example, finds that increased total net asset levels result in lower donations for nonprofits; perhaps, these findings can be extended to unrestricted net assets as well. Another explanation might be that donors provide such subsidies to NPOs through restricted giving, ensuring client subsidy but removing the organization’s choice in the matter. 21 A further explanation relates to the data. Prior literature (Krishnan, Yetman, & Yetman, 2006; Trussel, 2003, among others) shows that NPOs overstate program expenses. In this case, this shifting of reported expenses decreases the subsidy needed, making it harder to detect the true effect. The overall implication of this finding, however, is that nonprofits requiring comparatively higher levels of subsidies have less unrestricted net assets to draw on, should these subsidies fail to materialize.
The coefficients on CONCENTRATION and FIXED_COSTS provide mixed support for Hypothesis 4, that increases in unrestricted net assets are for the purpose of decreasing financial vulnerability. Education (excluding Higher Education), Health, and Housing NPOs do seem to retain increased levels of unrestricted net assets as revenue concentration increases. This is a smart business response, especially for Health organizations that may see delays from third-party insurance payers—the bulk of their revenue source—for various reasons (for example, a Health organization with a high degree of Medicaid patients could see Medicaid revenue temporarily cease during a State budget negotiation or crisis, as happened in California during 2007).
The coefficient on FIXED_COSTS is significant and positive for the Human Services, Arts, and Housing subsectors. The coefficient on FIXED_COSTS may indicate that Housing NPOs are very risk averse as they overretain relative to changes in fixed costs; furthermore, both vulnerability variables are positive and significant for Housing.
The Higher Education subsector, however, does not report significant financial vulnerability variables at all. A possible explanation for this result is that the Higher Education subsector covers a large proportion of their program expenses with program revenues (such as tuition, user fees, etc.) and these revenues are relatively stable and knowable in advance; therefore, revenue risk may be relatively low for this subsector in general. Furthermore, Higher Education NPOs may operate in a countercyclical industry, where a worsening macroeconomy—which leads to reductions in donor support—may be offset by increasing enrollments (and, therefore, increasing program revenues). The overall results for Hypothesis 4, then, are mixed. Most nonprofit subsectors do seem to retain unrestricted net assets to protect against financial vulnerability, with the notable exception of Higher Education and All Others.
The coefficient on ROI is not significant, indicating that NPOs do not appear to increase unrestricted net assets as investment returns increase (Hypothesis 5). The ROI results suggest that investment returns are not retained but instead are used to fund current operations. This extends the findings of Hughes and Luksetich (2004) who found that increased investment revenue among Arts NPOs lead to increased program output (expenses). Anecdotal evidence suggests that many colleges and universities had grown dependent on investment earnings prior to the stock market crash in September 2008, indicating that investment returns were being consumed rather than retained (Denmark & Segal, 2009). In fact, this behavior seems consistent across all nonprofit subsectors. 22
Finally, the control variable SIZE is significant (at least marginally) in several subsectors, indicating that as NPOs grow, unrestricted net assets increase as well.
Overall, the results are indicative of five important findings: (a) NPOs in general target unrestricted net asset accumulations and accumulate such resources over time, (b) given the high adjustment rates on the lagged unrestricted net asset variable and given the low profit margins in the entire sector, NPOs may be targeting very low unrestricted net asset accumulations, (c) most nonprofit subsectors display behavior compatible with the pecking order capital structure theory, (d) most nonprofit subsectors seemingly retain unrestricted net assets to reduce financial vulnerability, and (e) in general, NPOs increase retention of unrestricted net assets as they increase in size.
Additional Specification
Temporarily Restricted Donations and Fungibility
An additional consideration might be that NPOs receive donations with restrictions for specific purposes or uses (that is, with temporary restrictions). If the donation were restricted for a particular usage that the NPO would engage in anyway, one might argue that this donation could replace money that the NPO would have expended in that manner. In other words, the existence of the temporarily restricted donation in certain cases might be considered fungible: the NPO might spend down unrestricted net assets (either on the same specific purpose or different purpose altogether) and retain the temporarily restricted net asset until the NPO engages in that particular activity. In such a case, the choice to retain or not retain unrestricted net assets would be influenced by the existence of the temporarily restricted donation.
To test this possibility, the regression models were reestimated with an independent variable TRNA it included as an endogenous control variable. This variable is defined as the natural logarithm of the end-of-year temporarily restricted net asset balance of the organization. The remaining variables remained unchanged from the original specifications. The results of this additional specification are included in Table 3. The results indicate that an increase in temporarily restricted net assets does in fact lead to a decline in unrestricted net assets, ceteris paribus, in all nonprofit subsectors. Therefore, such fungibility does seem to operate within the nonprofit sector.
Estimation of Nonprofit Unrestricted Net Asset Accumulation, Inclusion of Temporary Restricted Net Assets as Independent Variable, 1999-2003

Note: Table 3 reports the results of estimating the determinants of nonprofit unrestricted net assets with the Arellano-Bond (1991) dynamic panel data estimator. Robust standard errors are in parentheses. The Wald test statistic’s null hypothesis is that all coefficients on the determinants of unrestricted net assets are jointly equal to zero. Year is the Wald test of the significance of the year indicator variables. Degrees of freedom are reported in parentheses. z1 reports the Arellano-Bond test for AR(1) serial correlation in the error term, and z2 reports the Arellano-Bond test for AR(2) serial correlation in the error term; the null hypothesis in each test is that no serial correlation exists. Hansen is a test of the overidentifying restrictions under the null hypothesis that the 104 instruments are valid (exogenous).
Significant at the 10% level. **Significant at the 5% level. ***Significant at the 1% level.
Policy Implications and Conclusion
Nonprofits in the United States—who are responsible in many cases for implementing public policies and delivering public services to specific populations—face no regulation regarding net asset accumulation. Public scrutiny of nonprofit net asset accumulation has primarily questioned whether nonprofits retain “too much” relative to current spending. Yet the answer to this question is inherently a subjective one, dependent on whether one believes nonprofits ought to devote more or less resources to current usage.
The analysis presented here takes a different approach. First, it recognizes that nonprofits are limited by donor choice in what resources it may or may not retain. The idea that nonprofits retain “too much” ignores that the choice may not be at the behest of the nonprofit. Second, it reviews the motivations for nonprofit unrestricted net asset accumulation. These motivations have been articulated in prior research, yet no formal empirical test of these motivations has been undertaken. Finally, the statistical methodology employed permits a determination of whether such accumulations are targeted over time. Furthermore, the estimation strategy used in this analysis overcomes serious statistical issues, such as endogenous regressors, serial correlation of the error term, and potential omitted variable bias.
Attempts to urge nonprofits to use their net assets for current spending, as recent Congressional actions suggest, should take into account the realities of the sector, the motivations for holding net assets, and the findings presented here. Retaining unrestricted net assets as a means to reduce vulnerability (as the results suggest for some NPOs) is sound business practice that ought not be discouraged necessarily; hoarding net assets—the focus of recent Congressional action—should be the focus. Yet the results here suggest that such hoarding may not be a sectorwide issue, despite popular perceptions to the contrary. Recent public scrutiny of wealthy universities can distract from this reality that the bulk of the sector does not have large endowments, does not maintain excessive levels of unrestricted net assets, and appears to be moderately hedging primarily against financial vulnerability. The recent economic recession has revealed that many NPOs maintain inadequate reserves, forcing organizations to cut mission output just as demand for such output increases.
Given the findings on the size variable, recent proposals to induce wealthy nonprofits to spend their net assets—such as requiring wealthy universities to spend 5% of net assets annually as foundations are required—perhaps are more appropriately focused than general spend down requirements. In other words, policies ought not to dampen unrestricted net assets sectorwide as these can aid nonprofits in continuity of service provision; rather, any policies should be progressive and tilted toward inducing larger and wealthier nonprofits to spend down their retained resources.
Further research on nonprofit unrestricted net asset accumulation and internal financing by NPOs is still warranted. For example, future research ought to examine how an NPO’s revenue portfolio influences unrestricted net asset accumulation. It is plausible that NPOs with significant public revenues (from government contracts and grants) retain unrestricted net assets differently than NPOs that rely instead on private donations or self-generated revenues. Furthermore, no research has yet explored whether unrestricted net assets accumulations might influence donor behavior; some of the statistical results suggest understanding such donor decisions is critical for understanding NPO unrestricted net asset retention. Additional research might explore the role of governance on unrestricted net asset accumulation: how board attitudes toward profits influence unrestricted net asset accumulation, how board composition affects such retention patterns, whether increased organizational financial oversight (through finance and audit committees) influence unrestricted net asset accumulations, among others. Such questions have yet to be explored in existing literature and yet seem vital to understanding and predicting nonprofit unrestricted net asset retention patterns.
Footnotes
Appendix
Variable Definitions
| Variable name | Definition (line numbers refer to Form 990 fields) |
|---|---|
| UNA it | Natural logarithm of End-of-Year Unrestricted Net Assets of organization i in year t (Line 67B) |
| TRNA it | Natural logarithm of End-of-Year Temporarily Restricted Net Assets of organization i in year t (Line 68B) |
| SUBSIDIZE it | Ratio of Program Service Revenue (Line 2) + Membership Dues and Assessments (Line 3) to Program Service Expenses (Line 13) of organization i in year t |
| LEVERAGE it | Ratio of End-of-Year Liabilities (Line 66B) to End-of-Year Total Assets (Line 59B) of organization i in year t |
| CONCENTRATION it | Sum of (Revenue j / Total Revenues)2 of organization i in year t; individual revenue streams are Total Contributions (Line 1d), Program Service Revenue (Line 2), Membership Dues and Assessments (Line 3), Interest (Line 4), Dividends (Line 5), Net Rental Income (Line 6c), Other Investment Income (Line 7), Investment Gains (Line 8d), Net Income From Special Events (Line 9c), Profit or Loss From Sale of Inventory (Line 10c), and Other Revenue (Line 11); Total Revenues was manually added from these revenue streams |
| FIXED_COSTS it | Ratio of Depreciation (Line 42a) + Total Interest (Line 41a) + Occupancy Expenses (Line 36a) to Total Expenses (Line 44a) of organization i in year t |
| ROI it | Investment Income / Average Balance of Invested Financial Assets. Investment Income is defined as the sum of Interest (Line 4), Dividends (Line 5), Net Rental Income (Line 6c), Other Investment Income (Line 7), and Investment Gains (Line 8d); the average balance of invested financial assets is defined as the sum of the average annual balances of Cash (Line 45), Savings (Line 46), Investments—Securities (Line 54), Investments—Land, buildings, and equipment (Line 55c), and Investments—Other (Line 56) |
| SIZE it | Natural logarithm of total revenues of organization i in year t, (Line 12) |
Acknowledgements
In addition to the editors, the author would like to acknowledge Leanna Stiefel, Dall Forsythe, Shanna Rose, and Amy Schwartz of New York University and Dwight Denison of the University of Kentucky for valuable guidance on early drafts of this article. Participants at the 2009 ARNOVA and Association for Budgeting and Financial Management annual conferences provided useful commentary. Finally, the author would like to thank the anonymous reviewers for insightful feedback. Any remaining errors are those of the author.
The author(s) declared no potential conflicts of interest with respect to the research, authorship, and/or publication of this article.
The author(s) received no financial support for the research, authorship, and/or publication of this article.