
Abstract
This study uses data from the microfinance industry to analyze differences in earnings quality between for-profit and nonprofit organizations. The two sets of organizations differ with respect to both governance mechanisms and managerial incentives, and little research has been conducted to investigate how such differences affect the quality of financial reporting. Overall, we find little evidence of differences in earnings quality between our two samples in the aggregate. We do, however, observe significant differences among the types of nonprofit organizations; this finding suggests that the concept of a “nonprofit level of earnings quality” is ill defined.
Introduction
The accounting literature contends that reported earnings numbers are of high quality if they are representative of a company’s or institution’s long-term earning ability (Melumad & Nissim, 2008). Thus, “earnings quality” is a measure of the trustworthiness, usefulness, and relevance of financial reporting. Earnings quality is typically investigated for exchange-listed corporations—nonprofit organizations are generally not studied. Thus, prior research has been unable to answer an important question: Are earnings numbers reported by for-profit organizations more trustworthy, useful, and relevant than earnings numbers from nonprofit organizations?
The lack of prior research may be attributed to the challenges inherent in a comparison of for-profit and nonprofit organizations. Nonprofit organizations typically have different characteristics and operate in very different industries than for-profit organizations, which substantially complicates comparative earnings quality studies. The microfinance industry offers a unique solution to this research challenge; some microfinance institutions (MFIs) are for-profit organizations, whereas others are nonprofit organizations, but they all operate in similar markets. Previous studies (Hartarska, 2005; Mersland & Strøm, 2009) suggest no difference in the overall financial performance of the two sets of MFIs. Moreover, Beisland and Mersland (2013) demonstrate that the overall earnings quality of MFIs does not differ from that of ordinary exchange-listed corporations. Thus, the microfinance industry provides an excellent case for the study of differences in earnings quality between for-profit and nonprofit organizations.
Although earnings quality research has typically been conducted on publicly listed companies (Barth, Landsman, & Lang, 2008; Dechow & Dichev, 2002; Francis, LaFond, Olsson, & Schipper, 2004) earnings quality is also of great importance for nonprofit organizations. For instance, a large stakeholder group, such as the donors, is interested in knowing whether an organization’s earnings accurately convey information about its current and future financial performance. Donors, creditors, and investors do not want to become involved with entities that are not financially sustainable: “Whether or not a nonprofit organization is susceptible to financial problems is a concern of all stakeholders of the organization, because financial problems might not allow an organization to continue to meet its objectives and provide services” (Trussel, 2002, p. 17). However, differences in managerial incentives and corporate governance structures can potentially lead to differences in the usefulness, relevance, and trustworthiness of financial reporting for nonprofit organizations compared with their for-profit counterparts.
In contrast with Beisland and Mersland (2013), who focus on the overall reporting quality in the microfinance industry, the scope of this study is far more general. We seek to study whether the for-profit objective in itself affects the quality of the accounting information and use the microfinance industry as a case study simply because of its suitability. Thus, our findings should be of interest to the entire nonprofit community and to accounting professionals. We would like to highlight two major findings of this study.
First, we find few differences in earnings quality between nonprofit and for-profit organizations. Only for earnings predictability do we document a statistically significant difference between the two types of organizations. One might hypothesize that the managers of for-profit organizations likely face greater pressure to report satisfying financial results and often have more private incentives to influence the financial reporting process (for instance, management may be compensated as a function of reported earnings, which is less common in nonprofit organizations because of their multiple objectives); these factors could cause lower earnings quality in for-profit organizations compared with nonprofit organizations. However, a larger demand for high-quality reporting and more advanced governance mechanisms may cause for-profit organizations to have higher earnings quality than nonprofit organizations. Thus, theoretically, different managerial incentives can cause earnings quality to be both higher and lower in for-profit organizations than in nonprofit organizations. Our empirical evidence suggests that the theoretical hypotheses are not mutually exclusive; instead, several forces that operate in different directions cancel each other and thus yield no or only minor differences in earnings quality, on average, between for-profit and nonprofit organizations.
Second, we document differences in the nonprofit sector that suggest that the “nonprofit level of earnings quality” is an ill-defined concept. Nonprofit organizations differ in their incorporation, governance, and managerial incentives. When the nonprofit sample is split into nongovernmental organizations (NGOs) and member-based cooperatives and credit unions, we find that the cooperatives and credit unions score significantly higher on conventional earnings management metrics compared with the NGOs. Thus, our empirical results suggest that the reported earnings for cooperatives and credit unions may be contaminated by earnings management, which implies that these organizations have lower earnings quality. This finding may be attributed to cooperatives’ preferences for reporting small but smooth profits, which is possibly caused by the distribution of surplus among stakeholders (Perrileux, Hudon, & Bloy, 2012). Because earnings management is notoriously difficult to measure (Lang, Smith Raedy, & Wilson, 2006), the results should be interpreted with caution. However, the results illustrate the need to differentiate among groups of the nonprofit sector when performing accounting quality research.
This article is organized as follows. The Theoretical Background and Research Design section discusses relevant prior research and outlines the research design. The Data Sample section describes the data sample, and the Empirical Findings section presents the empirical findings of the analyses. Conclusion concludes.
Theoretical Background and Research Design
Prior Research
Melumad and Nissim (2008) state, “Earnings are of high quality if they are representative of long term earning ability” (p. 91). According to Dechow, Ge, & Schrand (2010), high-quality earnings provide financial performance information that is more useful for decision making. Prior research has demonstrated that earnings quality is important to the stakeholders of an organization. For instance, Francis et al. (2004) document that earnings quality is associated with a lower cost of capital (cf. Michelson & Jordan-Wagner, 2000). This finding can be attributed to the fact that more trustworthy accounting information reduces investors’ information risk. A firm’s value is the present value of its future cash flows; thus, earnings numbers reduce investors’ information risk if they accurately reflect the current and future cash flow-generating capabilities of a firm (Beisland & Mersland, 2013). Earnings quality is also important to debt holders (Crabtree & Maher, 2005) and, in general, to all parties that use accounting information for contracting purposes (cf. Dechow et al., 2010; Schipper & Vincent, 2003), including donors.
Earnings quality is typically measured by scores on various earnings attributes (cf. Dechow et al., 2010). Because earnings quality typically cannot be summarized into one composite score, several metrics are applied to examine the various dimensions of the concept. Francis et al. (2004) investigate earnings quality using the following attributes: accrual quality, persistence, predictability, smoothness, value relevance, and timeliness and conservatism. Accrual quality, persistence, predictability, and smoothness are accounting-based earnings attributes, whereas value relevance and timeliness are market-based attributes.
There is no unique definition of earnings quality (Ben-Hsien & Da-Hsien, 2004), so different earnings quality studies examine different attributes. For instance, Barth et al. (2008) limit their analyses to earnings management, timely loss recognition, and the value relevance of earnings and equity book values. In general, it is impossible to rank the earnings attributes according to their importance. However, consistent with the findings of Graham, Harvey, and Rajgopal (2005) that managers have an “obsession” with stable earnings, Melumad and Nissim (2008) contend that practitioners seem to equate earnings quality with earnings persistence. The importance of persistence and stability is also highlighted by Francis et al. (2004), who report that the largest cost-of-equity effects are observed for the accounting-based attributes of earnings quality.
In the earnings quality literature, prior research has tended to focus on for-profit organizations, in particular publicly listed companies. Nonprofit organizations may differ from for-profit entities because they are supposed to spend all their available resources on current operations. However, the importance of positive earnings for nonprofit organizations is illustrated by Calabrese (2012). In general, “nonprofit net assets are differentiated from for-profit equity by the ability of donors to restrict certain assets” (Calabrese, 2012, p. 302). Calabrese (2012) demonstrates that nonprofit organizations adjust unrestricted assets by accumulating earnings. A major motivation for increasing unrestricted assets is to decrease their financial vulnerability, and larger unrestricted assets aid nonprofits in satisfying the continuity of service provision. Calabrese (2012) concludes that nonprofit organizations act in a manner consistent with sound business practices.
A few earnings quality studies have included nonlisted organizations in their analyses. Givoly, Hayn, and Katz (2010) compare the earnings quality of publicly listed corporations with that of private equity firms and conclude that private firms have higher earnings quality. A study by Pinnuck and Potter (2009) is one of the few studies to investigate earnings quality for organizations other than for-profit organizations. They examine the earnings quality of local governments across Australia and report that governmental financial accounting is less useful than corporate financial reporting. Their finding is attributed to less demand for high-quality accrual-based financial reports in the public sector.
The findings of Pinnuck and Potter (2009) can be interpreted in light of the “demand hypothesis” discussed by Givoly et al. (2010). One may argue that professional investors demand higher earnings quality than do the stakeholders of nonprofit or government organizations. Thus, for-profit organizations should have higher earnings quality than nonprofit organizations. However, under the “opportunistic behavior hypothesis,” which is thoroughly discussed by Givoly et al. (2010), the management’s private incentives may depress earnings quality in for-profit entities compared with nonprofit organizations. The basic idea behind this hypothesis is that CEOs of for-profit organizations are likely under strong pressure from investors to meet performance benchmarks and they often have a personal stake in the firms’ profits because of results-based compensations contracts or personal stock ownership. Therefore, incentives to manipulate earnings may lead to lower earnings quality in for-profit organizations than in nonprofit organizations. Still, it is possible to challenge this line of reasoning; because nonprofit actors receive subsidies, they could have equally strong incentives to manipulate earnings because of pressure from donors. Nonprofit organizations may experience pressure from donors to report positive earnings because donors would not want to be involved in entities that are not financially sustainable. However, nonprofit organizations may also have an incentive not to report high profits because this could signal that the entities do not actually need support from donors.
Overall, the research on earnings quality of nonprofit organizations is scarce and contradictory. Whereas the demand hypothesis appears to explain the results of Pinnuck and Potter (2009), the findings of Givoly et al. (2010), that private firms have higher earnings quality than public firms, are consistent with the opportunistic behavior hypothesis.
Although the incentives summarized by the opportunistic behavior hypothesis may be an important driving force for earnings management, the specific influences of these incentives on earnings quality depend on the possibilities that managers have to influence the reported earnings. These possibilities are dependent on governance mechanisms, and Francis, Olsson, and Schipper (2008) provide a thorough discussion of the relation between earnings quality and governance structures. For instance, Francis et al. (2008) claim that firms with greater board independence, greater ownership of stocks, and greater external monitoring have higher earnings quality (cf. Dechow et al., 2010). Therefore, although the opportunistic behavior hypothesis possibly provides an accurate description of the incentives for for-profit organizations, stronger governance mechanisms in for-profit MFIs (Galema, Lensink, & Mersland, 2012) may limit the possibility of earnings management such that the for-profit MFIs do not have lower earnings quality than their nonprofit counterparts.
Because of the scarce and contradictory empirical research and the competing theoretical models, we will not propose an alternative hypothesis regarding the relative earnings quality of for-profit and nonprofit MFIs. To the best of our knowledge, our study is the first within this line of research. We begin with the null hypothesis that there is no difference in earnings quality between the two types of organizations.
Research Design
Earnings quality research seeks to identify whether reported earnings are representative of the long-term earning ability of a company or organization (Melumad & Nissim, 2008). We evaluate the usefulness of current earnings for forecasting future earnings using the earnings numbers’ smoothness, persistence, and predictability (Francis et al., 2004). The standard deviation of earnings scaled by total assets is used as our metric of earnings smoothness (Barth et al., 2008; Dechow & Dichev, 2002). A smaller standard deviation indicates that earnings are more stable and easier to forecast; thus, they are of higher quality. Persistence is measured as the slope coefficient calculated from a regression of current earnings on lagged earnings, whereas the explanatory power from the same regression is our predictability measure (Francis et al., 2004). A higher slope coefficient and a larger adjusted R2 (i.e., higher persistence and predictability, respectively) are interpreted as measures of higher earnings quality because then the current earnings will provide us with more information about future earnings, or, more generally, future financial performance.
Note that the measures of smoothness, persistence, and predictability are expected to be related, but they are not identical. Smoothness measures earnings stability, persistence measures the degree to which future earnings equal current earnings, and predictability measures the proportion of the variance in future earnings that can be explained using current earnings.
A certain degree of subjectivity is generally applied when financial statements are prepared. If the subjectivity is exercised to obtain some sort of private gain, either for the company or for the management, the use of the subjectivity can be categorized as earnings management (Schipper, 1989). Earnings management reduces the financial reporting’s ability to reflect the underlying economics of an entity. The trustworthiness of earnings as a conveyor of important information is damaged; thus, greater earnings management is associated with lower earnings quality. Therefore, an evaluation of earnings quality must also include an assessment of possible earnings management (Barth et al., 2008). In this study, we apply three metrics for earnings management.
Following Barth et al. (2008), we use the standard deviation of the change in earnings scaled by total assets as a metric for earnings management. A low standard deviation of the change in earnings is evidence of earnings management. The standard deviation of the change in earnings can also be considered a proxy for earnings smoothness; hence, we complement the analysis with two other measures of earnings management. Prior research has suggested an overrepresentation of small positive earnings (Hayn, 1995), which is regarded as evidence that companies often manage earnings toward a target (in this case, zero) to avoid reporting a loss (Melumad & Nissim, 2008). Moreover, for nonprofit organizations, donors may prefer to support organizations with small profits (see the discussion in Prior Research). Thus, the fraction of small profits is our second proxy variable for earnings management. Small profits are defined as scaled earnings in the interval 0 to 0.01. Nontimely recognition of losses can also be regarded as an example of earnings management. Losses should be recognized as they occur and should not be postponed to future periods. We expect that higher-quality earnings will exhibit a higher frequency of large losses. Following Barth et al. (2008), a large loss is defined as scaled earnings less than −0.2.
The typical external or market-based measure of accounting usefulness, the value relevance of accounting information, cannot be studied for nonlisted companies. However, even if prior research has documented that value relevance is closely related to accounting attributes such as earnings persistence and predictability (Beisland, 2011), we do use one additional proxy for market-based earnings quality: the degree to which the earnings numbers are related to the MFI external ratings (Beisland & Mersland, 2013). The MFI ratings are a broad measure of MFI performance and must not be confused with traditional credit ratings, which focus solely on repayment risk (Reille, Sananikone, & Helms, 2002). The MFI ratings measure a combination of creditworthiness, trustworthiness, and excellence in microfinance (www.ratinginitiative.org) and are frequently applied by investors, donors, and other stakeholders when evaluating the overall performance of an MFI. If the MFI’s earnings are related to these global risk assessments, it can be concluded that the earnings are relevant and useful for the MFI’s stakeholders and thus are of high quality.
Because there is no single best measure of earnings quality (Dechow et al., 2010), we apply a large number of earnings quality metrics. An advantage of using several metrics is that we can identify the source of any accounting quality differences between for-profit and nonprofit MFIs (Barth et al., 2008). Table 1 summarizes our earnings quality metrics and outlines how they are measured (cf. Barth et al., 2008; Beisland & Mersland, 2013; Francis et al., 2004).
Earnings Quality Metrics.
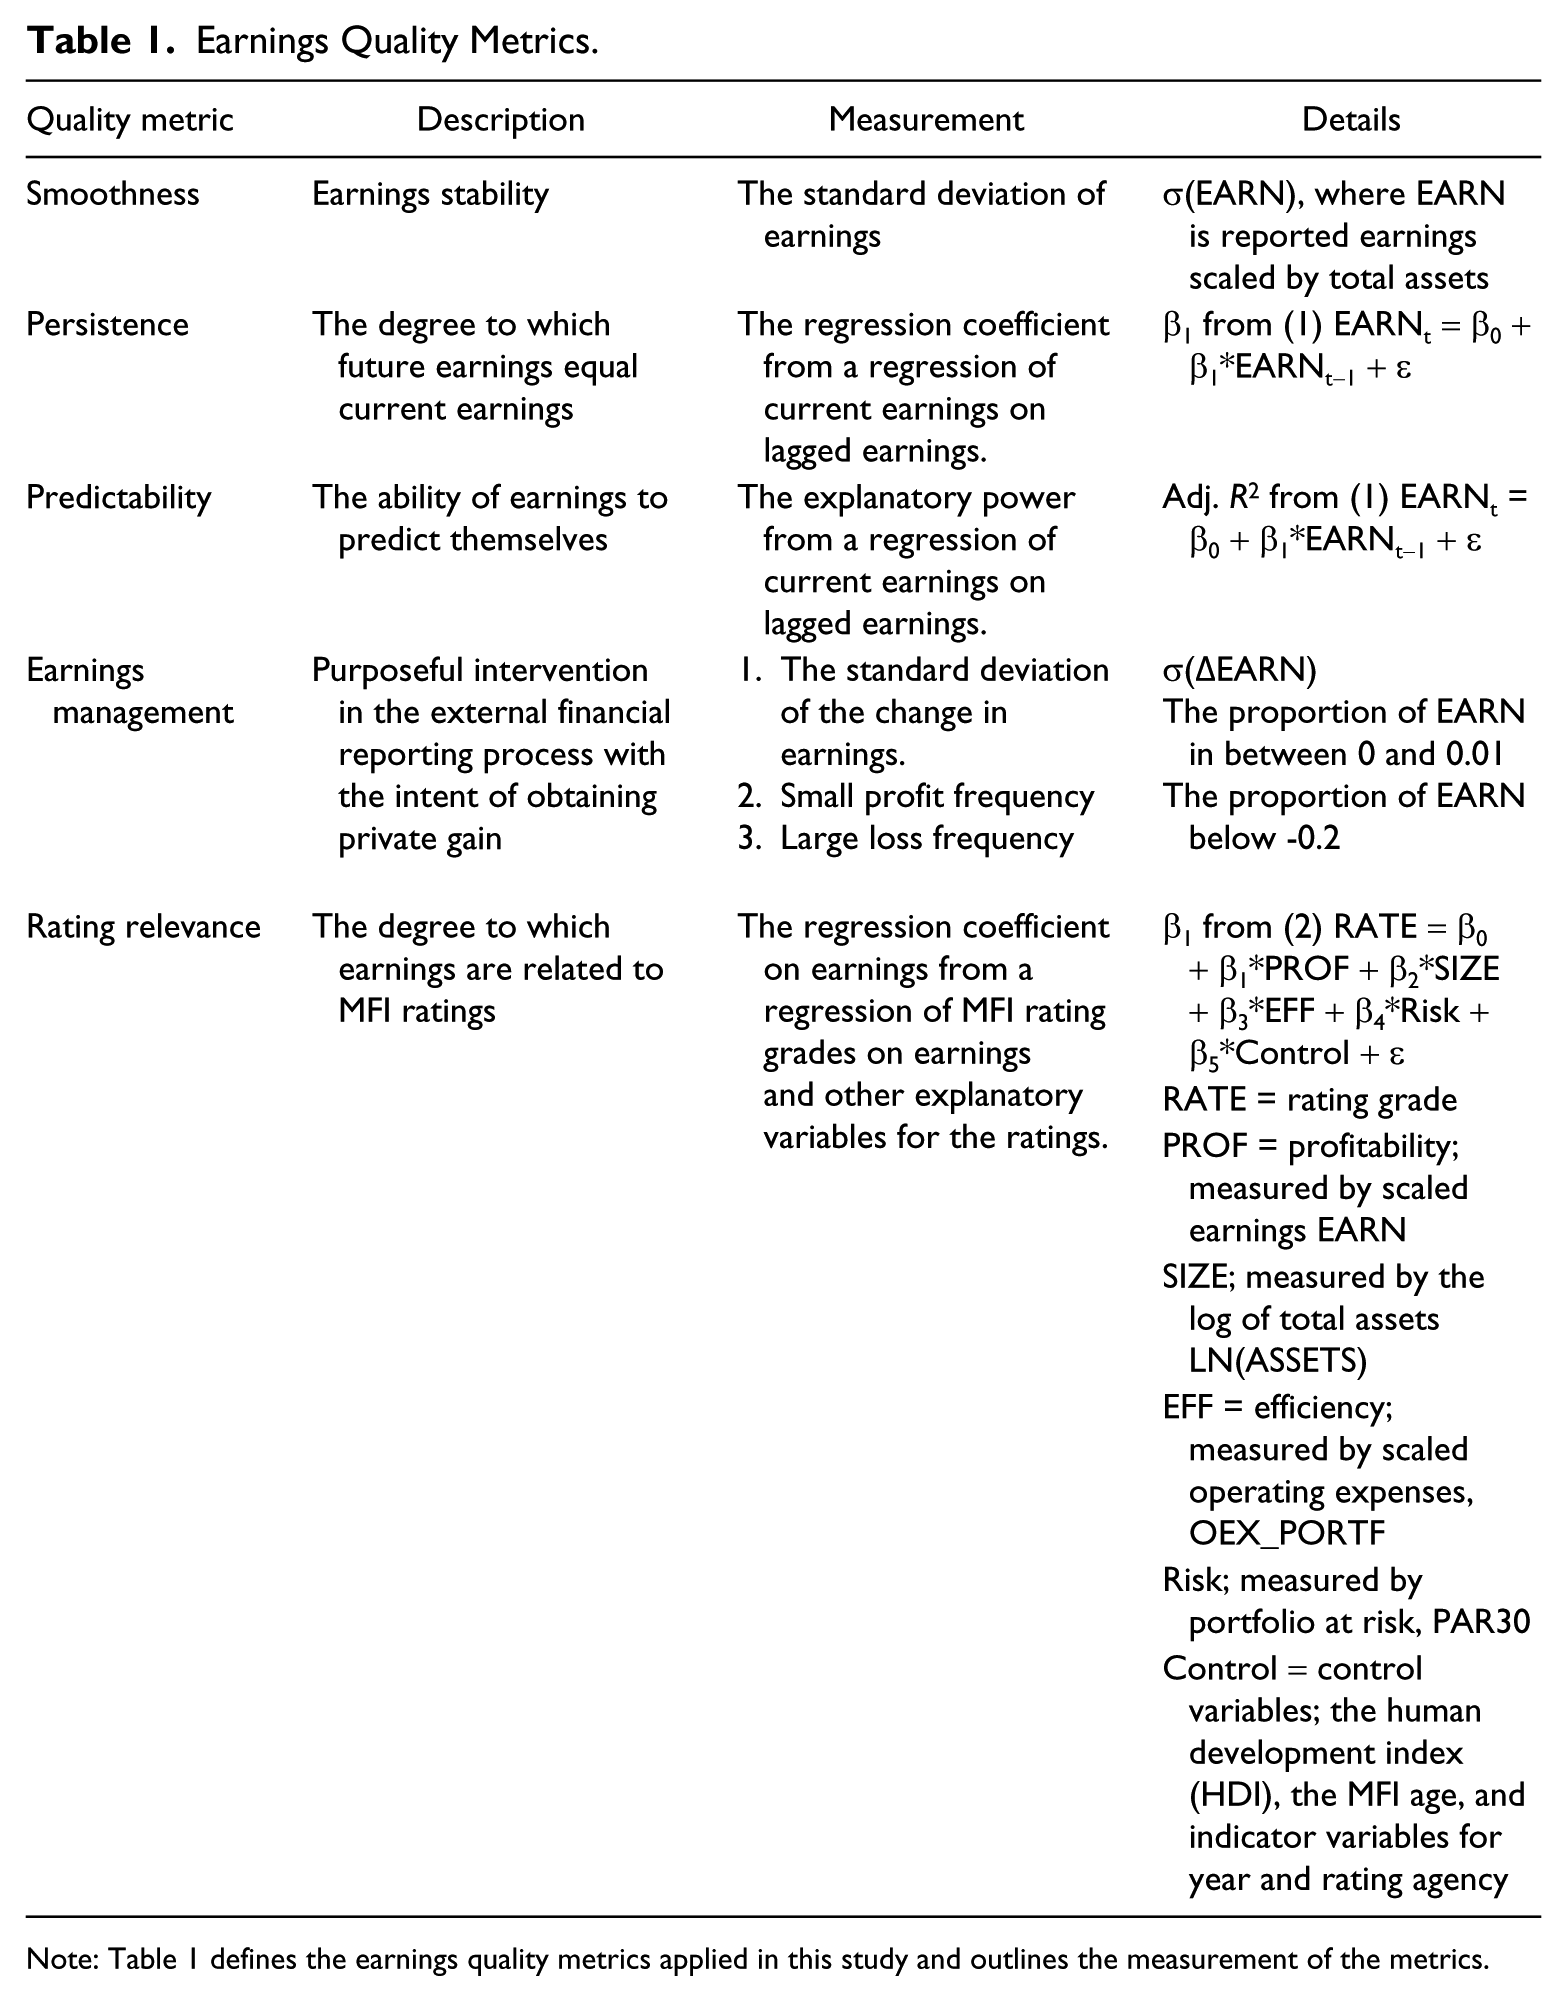
Note: Table 1 defines the earnings quality metrics applied in this study and outlines the measurement of the metrics.
All earnings attributes are estimated separately for the for-profit and nonprofit MFIs. Following Barth et al. (2008), we compute our earnings quality metrics from cross-sectional data. When such a pooled estimation is performed, metrics are presented for the subsamples as a whole and possible differences between the samples are analyzed, as described by Barth et al. (2008, p. 481): “As with prior research, we interpret differences in various summary statistics (e.g., variances, correlations, and regression R2 values) relating to the metrics between two samples of firms being compared as evidence of differences in accounting quality. This approach to comparing accounting quality metrics for two groups of firms assumes that the metrics for the firms within each group are drawn from the same distribution and that the metrics for firms in different groups are potentially drawn from different distributions.”
Data Sample
Access to machine-readable firm-level financial data for countries outside the United States is limited (Dechow et al., 2010). Our unique dataset is collected by hand from accounting information publically available in reports from the providers of the MFI ratings, the microfinance rating agencies. The purpose of rating reports is to present independent information that stakeholders, such as lenders, owners, donors, and managers, can use to make informed decisions. The rating reports are publicly available at www.ratingfund2.org. Reports made by the following five leading rating agencies are included: MicroRate, Microfinanza, Planet Rating, Crisil, and M-Cril.
The fact that MFIs in the sample are rated indicates a certain selection bias; the data are skewed toward the better-performing MFIs. However, this is an advantage for our comparative analysis because it filters out background “noise,” such as very small or unprofessional MFIs. The rating reports included in the database are from 1998 to 2009, but the vast majority are from the last 5 years. As required, all numbers in the dataset have been annualized and converted to US$ using the prevailing official exchange rates. The rating agencies differ in the information they provide in the reports. Thus, different numbers of observations are reported for different variables and in different years. The dataset consists of 403 MFIs from 73 countries and 1,616 firm-year observations. All shareholder-owned banks and nonbank financial institutions are regarded as for-profit organizations, whereas nongovernmental organizations, credit unions, and cooperatives constitute the nonprofit organizations (Galema et al., 2012). Although some of the for-profit MFIs have NGOs among their shareholders, this division into nonprofit and for-profit entities is meaningful because the difference in ownership structure should theoretically cause the organizations to be different (Hansmann, 1996; Mersland, 2009) with respect, for instance, to the incentives and governance mechanisms discussed in the Theoretical Background and Research Design section. Table 2 summarizes the most important characteristics of the two subsamples (based on Galema et al., 2012).
Characteristics of Nonprofit Versus For-Profit MFIs.

Note: Table 2 presents characteristics of the two samples in this study, nonprofit microfinance institutions (MFIs) and for-profit MFIs. The table is based on Galema et al. (2012).
Empirical Findings
Earnings Smoothness
The metric of earnings smoothness, the standard deviations of earnings scaled by end-of-year total assets, is reported in Table 3 for for-profit and nonprofit organizations. The table also includes mean earnings numbers and some distributional characteristics. Consistent with the findings of Hartarska (2005) and Mersland and Strøm (2009) that the type of MFI legal incorporation has little effect on financial performance, the difference in the earnings level is moderate. It should be noted, however, that the profitability level itself is not a component of earnings quality.
Earnings Quality as Measured by Earnings Smoothness.

Note: Table 3 presents the mean, standard deviation, first quartile (Q1), median, third quartile (Q3), and number of observations (n) of earnings scaled by end-of-period assets for the subsamples of for-profit and nonprofit MFIs, respectively. The standard deviation of scaled earnings is applied as a proxy variable for earnings smoothness (shaded column). The p value is estimated using a standard F-test for the difference in standard deviations between two samples.
For-profit MFIs have a lower standard deviation of reported earnings than their nonprofit counterparts. However, the difference is not statistically significant. Hence, we can conclude that no difference between the earnings quality of for-profit and nonprofit organizations has been documented by this first test of earnings quality.
Earnings Persistence
Persistence is measured as the slope coefficient calculated from a regression of (scaled) current earnings on lagged earnings (Francis et al., 2004; Sloan, 1996; see Table 1), and a higher coefficient is associated with higher earnings quality. Table 3 reports the results of this regression. The regression coefficient of reported earnings is 0.52 for the for-profit organizations and 0.47 for the nonprofit MFIs. The difference is not statistically significant. Thus, our second earnings quality metric does not suggest a difference in earnings quality between for-profit and nonprofit organizations.
Earnings Predictability
Earnings predictability is measured as the adjusted R2 from the regression of current on lagged earnings. Table 4 suggests that earnings quality, as measured by predictability, is larger for for-profit MFIs; compare the adjusted R2 of 54.62% for the for-profit MFIs with the value of only 34.43% for the nonprofit organizations. This difference is highly significant. The overall conclusion from Table 4 is that the third metric of earnings quality, earnings predictability, is larger for for-profit MFIs than for nonprofit MFIs.
Earnings Quality as Measured by Earnings Persistence and Predictability.

Note: Table 4 presents the results from the regression (1) EARNi,t = β0 + β1*EARNi,t-1 + ϵ, where EARN denotes the earnings scaled by end-of-period total assets. One (*), two (**) and three (***) asterisks denote the conventional 10%, 5% and 1% significance levels for the explanatory variable of the regression. The slope coefficient β1 is applied as a proxy variable for earnings persistence, whereas the adjusted R2 is our proxy variable for earnings predictability (shaded columns). The p value for the difference in earnings persistence is estimated by rerunning (1) on a pooled sample with a binary variable for nonprofit organizations. The listed p value is the significance level of an interaction variable of lagged EARN multiplied by the binary variable. The p value for the difference in earnings predictability is measured using the Cramer (1987) test.
Earnings Management
The presence of earnings management depresses earnings quality. We apply three metrics for earnings management (see Table 1). The results are presented in Table 5. If the standard deviation of the change in earnings is used as an earnings management proxy, the reported earnings of nonprofit MFIs appear to be the least contaminated by earnings manipulation. However, the for-profit MFIs report a smaller frequency of small profits and a larger frequency of large losses. These two findings suggest less earnings management among the for-profit MFIs than among their nonprofit counterparts. The result for the standard deviation of the change in earnings is statistically significant, whereas the results for small profits and large losses are insignificant. Because of the statistically weak results and the difficulty of measuring earnings management (Lang et al., 2006), we conclude that we are unable to document differences in earnings management between the two samples.
Earnings Quality as Measured by Earnings Management.

Note: Table 5 presents the mean, standard deviation, and number of observations (n) of the change in earnings scaled by end-of-period assets. The standard deviation of the change in scaled earnings is applied as a proxy variable for earnings management (shaded column). A second proxy variable for earnings management is the proportion of small profits, defined as earnings scaled by total assets between 0 and 0.01 (shaded column). The proportion of large losses, defined as earnings scaled by total assets smaller than −0.2, is a proxy variable for timely loss recognition (shaded column). The p value for the difference in standard deviation is estimated using a standard F-test, whereas the p values for the differences in small-profit proportion and large-loss proportion are estimated using a standard t-test for differences in means.
Rating Relevance
MFI ratings are frequently applied by investors, donors, and other stakeholders when evaluating the overall performance of an MFI. We interpret a positive association between earnings and the ratings as a measure of earnings usefulness and thus of earnings quality (Beisland & Mersland, 2013). We follow prior research (Beisland & Mersland, 2012; Gutiérrez-Nieto & Serrano-Cinka, 2007) in assuming that the rating of an MFI is a function of its size, profitability, efficiency, and risk. Because of the ordinal nature of the rating scale, the regression is estimated using an ordered logistic regression (Greene, 2003). See Table 6 for the results of the regression.
Earnings Quality as Measured by Rating Relevance.
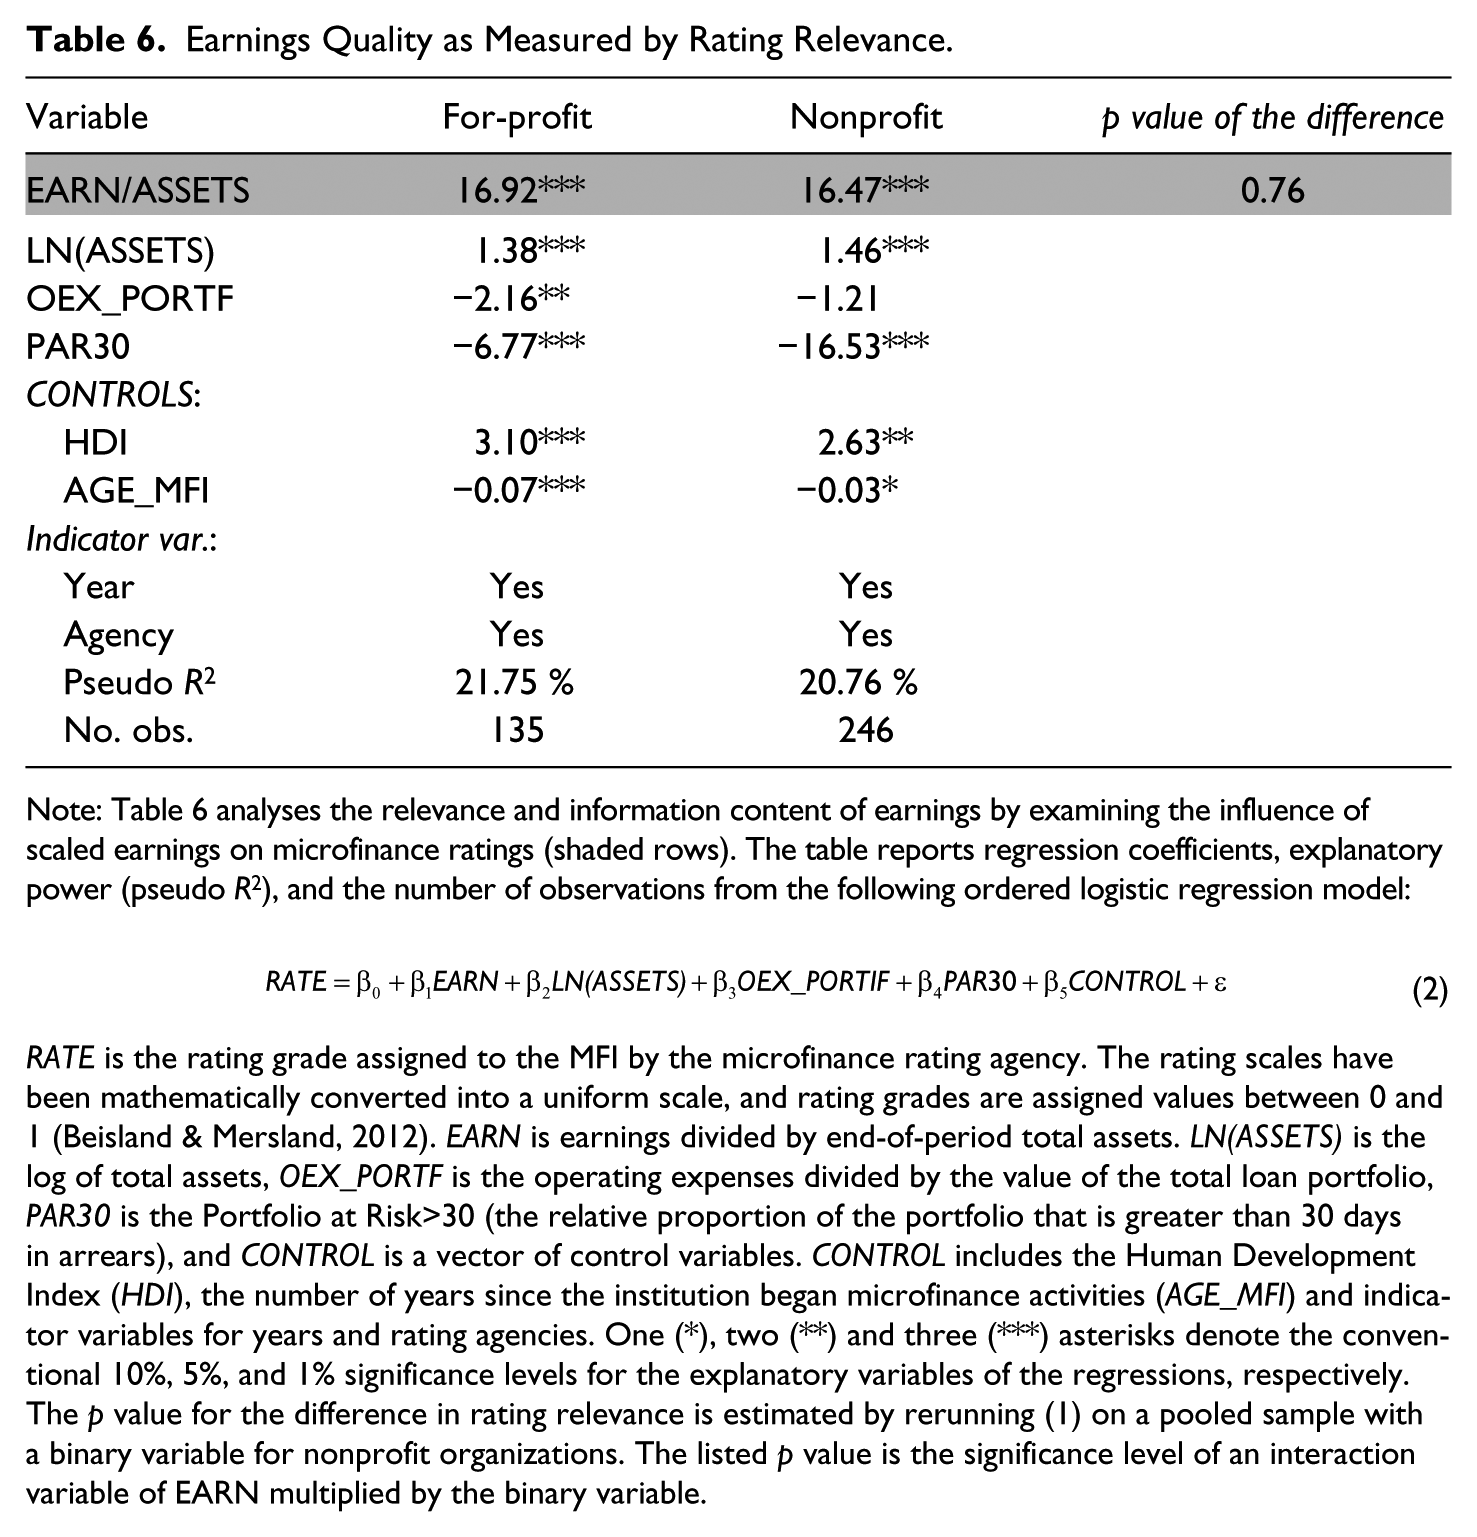
Note: Table 6 analyses the relevance and information content of earnings by examining the influence of scaled earnings on microfinance ratings (shaded rows). The table reports regression coefficients, explanatory power (pseudo R2), and the number of observations from the following ordered logistic regression model:

RATE is the rating grade assigned to the MFI by the microfinance rating agency. The rating scales have been mathematically converted into a uniform scale, and rating grades are assigned values between 0 and 1 (Beisland & Mersland, 2012). EARN is earnings divided by end-of-period total assets. LN(ASSETS) is the log of total assets, OEX_PORTF is the operating expenses divided by the value of the total loan portfolio, PAR30 is the Portfolio at Risk>30 (the relative proportion of the portfolio that is greater than 30 days in arrears), and CONTROL is a vector of control variables. CONTROL includes the Human Development Index (HDI), the number of years since the institution began microfinance activities (AGE_MFI) and indicator variables for years and rating agencies. One (*), two (**) and three (***) asterisks denote the conventional 10%, 5%, and 1% significance levels for the explanatory variables of the regressions, respectively. The p value for the difference in rating relevance is estimated by rerunning (1) on a pooled sample with a binary variable for nonprofit organizations. The listed p value is the significance level of an interaction variable of EARN multiplied by the binary variable.
In contrast to prior research (Beisland & Mersland, 2012; Gutiérrez-Nieto & Serrano-Cinka, 2007), we study if the for-profit objective affects the determinants of the ratings. We focus the analysis on earnings and note that scaled earnings are a highly significant explanatory variable for the ratings for both subsamples. However, the difference is not statistically significant. Collectively, our results demonstrate that earnings numbers are relevant for the MFI ratings of both for-profit and nonprofit entities, but we are unable to find significant differences in this earnings quality metric between the two sets of organizations.
Robustness Tests
The primary analysis has only found one statistically significant difference (for earnings predictability) in earnings quality between the for-profit and nonprofit samples. All other tests show insignificant results. Thus, we cannot conclude that there are major differences in earnings quality between for-profit and nonprofit organizations.1 This subsection challenges this conclusion through several alternative tests.
Accrual quality
Accrual quality is an element of earnings quality (Francis et al., 2004). Our tests thus far provide only indirect tests of accrual quality, which is typically quantified as the statistical association between accruals and cash flows (Dechow & Dichev, 2002). Accruals are of good quality if they lead to cash flow. For financial institutions, the most important accrual component is provisions for future losses. Loss provisions are of high quality if they are related to actual, future losses. Although data limitations reduce our ability to test accrual quality in our sample, we perform one empirical analysis: we regress the write-off ratio on lagged observations of net loss provisions (scaled by the total loan portfolio). From an earnings quality perspective, the write-offs should be closely related to previous loss provisions. This test demonstrates that the regression coefficient is larger (0.18 vs. 0.10) for the for-profit sample than for the nonprofit sample, but the difference is not statistically significant (p value = .17). Thus, our first alternative test suggests no difference in earnings quality.
Loss proportion and size
Earnings quality may be a function of more variables than the ones summarized by the degree of profit maximization. For instance, Francis et al. (2008) identify the loss frequency of a company as a determinant of earnings quality. In our sample, there is no statistically significant difference between the loss proportion of for-profit MFIs compared with that of nonprofit MFIs (p value = .35). However, a frequently used determinant of earnings quality is company size (Dechow & Dichev, 2002). Our sample of for-profit MFIs includes, on average, larger entities than the sample of nonprofit MFIs (p value = .00 when the difference in mean assets is tested). As a test of the relation between MFI size and earnings quality, we divide the for-profit and the nonprofit samples into equally sized subsamples based on the MFIs’ total assets. Then, we rerun all previously described tests on these four new subsamples. The disadvantage of this procedure is that the number of observations is very low in some tests (for instance, the test of rating relevance); thus, we use it only as a robustness test.
We find only minor differences in earnings smoothness between for-profit MFIs and nonprofit MFIs for both small and large organizations. Moreover, the tests suggest negligible differences in persistence and predictability when the MFIs are large, but for small MFIs, the predictability is superior for for-profit MFIs. This effect of size on predictability is primarily caused by differences within the nonprofit sample (the explanatory power is 61% for the large nonprofit MFIs versus 27% for the small nonprofit MFIs; these values are not tabulated); in the for-profit sample, this earnings quality metric is barely affected by the size split. We find no statistically significant difference in earnings management for the size-adjusted samples. We find some indications of higher rating relevance for large for-profit MFIs than for large nonprofit MFIs, but the number of observations in the alternative tests is small, and the results are not significant.
Country-specific differences
A major strength of our sample is its broad geographical coverage. However, earnings quality varies with regulatory scrutiny and financial reporting standards (Francis et al., 2008). These determinants vary by jurisdiction, not by institution. Because our sample is not balanced for every country included in the study, we acknowledge that some differences in regulatory scrutiny and financial reporting standards may exist between our subsamples. We cannot rule out the possibility that such average differences, if they exist, may affect some findings. Unfortunately, the number of observations for each country is too low for us to run meaningful country-specific tests. Nevertheless, because the nonprofit and for-profit samples both include a very large number of countries (58 and 48 countries, respectively), none of our conclusions are dependent on single-country characteristics and the findings should be generalizable (compare the contention of Barth et al. [2008] that focusing on a particular country makes it difficult to extrapolate inferences to other countries).
Nonetheless, as a robustness test, we rerun all tests on the observations from the countries for which we have observations in both samples. Briefly summarized, no conclusion is altered for persistence, predictability, earnings management, and rating relevance. However, this alternative sample selection shows significantly larger earnings smoothness for for-profit than nonprofit organizations.
Outliers
To ensure that none of our results are driven by outliers, we truncate the upper and lower percentile of reported earnings as a final robustness test. Except for the finding that the predictability in the nonprofit sector is slightly higher than in the primary test, no empirical results are altered.
Nongovernmental Organizations Versus Cooperatives and Credit Unions
Loss proportion and size revealed substantial differences in predictability within the nonprofit sample that are related to MFI size. The size-adjusted analyses also revealed systematically larger within-sample differences for nonprofit MFIs than for-profit MFIs (not tabulated). We conclude the empirical section with an analysis of possible systematic intra-sample differences for nonprofit organizations.
Generally, possible systematic differences in earnings quality can be caused by differences in managerial incentives or governance structures. Table 2 observes few differences in the for-profit sample, whereas in the nonprofit sample, NGOs may differ from cooperatives and credit unions with respect to both profit distribution and governance. NGOs never distribute profits, whereas cooperatives and credit unions may distribute profits to their members. Moreover, in contrast to NGOs, cooperatives and credit unions have governance structures tied to their members. These differing characteristics may cause visible differences in earnings quality. Thus, we rerun all the primary tests on the nonprofit sample after splitting the sample into NGOs and cooperatives and credit unions.
Table 7 summarizes the earnings quality metrics for the NGO sample and the cooperatives and credit union sample. The results reported for the NGOs are very similar to those reported for nonprofit organizations in the primary tests. Thus, the results for nonprofit organizations appear to be driven by the NGOs, and a comparison of the for-profits and the NGOs generally shows insignificant differences in earnings quality (not tabulated).
Earnings Quality for Nonprofit Organizations.

However, Table 7 reveals some substantial differences between the NGO sample and the cooperatives and credit unions sample. NGOs report significantly more persistent earnings, whereas cooperatives and credit unions have the smoothest earnings. Thus, these tests of earnings quality present contradictory results. However, note that smooth earnings are an ambiguous concept in earnings quality research. Although smooth earnings suggest that current earnings are more indicative of future earnings, earnings smoothing may also be an indication of earnings management (Barth et al. 2008). Barth et al. contend that companies that manage earnings tend to smooth earnings, they seek to report positive earnings (profits) and they avoid reporting large losses. Table 7 strongly indicates that cooperatives and credit unions are more involved in earnings management. All three earnings quality metrics suggest that cooperatives and credit unions manage earnings more than NGOs do (however, the results for large loss avoidance are only weakly significant). The presence of earnings management in the nonprofit sector is not an unknown phenomenon; see, for example, Trussel (2003). The findings can be related to those of Calabrese (2012), who finds that nonprofit organizations often target profits, even if the targets are set at very low levels.
Overall, Table 7 indicates that NGOs have higher earnings quality than do cooperatives and credit unions, both because NGOs have more persistent earnings and because they appear to report earnings numbers less contaminated by earnings management. The finding can be interpreted in the context of the results of Perilleux, Hudon, and Bloy (2012). This study shows that whereas NGOs retain their surpluses2 within the institution, the surplus distributions of cooperatives favor providers and employees (e.g., favorable prices and relatively high salaries). Obviously, if an organization seeks to distribute its profits to persons with an (economic) interest in the organization, they have a greater incentive to report smooth, positive earnings and avoid large losses. According to Perilleux et al. (2012), the cooperatives have the possibility to pursue such a strategy; whereas NGOs typically have board members without a personal stake in the organization, cooperatives’ members most often exercise the ultimate control of the organization and influence the major decisions through their voting rights. Cooperatives’ members lack the incentive to retain profits for future growth because growth leads to the risk that some key actors can take advantage of the organization at the expense of the other members (Perilleux et al., 2012). This final empirical analysis illustrates that there may be large differences in earnings quality within the nonprofit sector; these differences are likely caused by differing incentives or governance structures.
Conclusion
This study uses a sample of microfinance institutions to study earnings quality differences between for-profit and nonprofit organizations. It is commonly believed that financial reporting is more challenging for nonprofit organizations (cf. Manos & Yaron, 2009; Pinnuck & Potter, 2009), which causes the financial reporting of such entities to be less trustworthy, less useful, and less relevant. However, in this study, we are unable to statistically document any earnings quality differences between the for-profit and nonprofit organizations.
The findings may be related to two forces working in opposite directions. According to the “demand hypothesis” (Givoly et al., 2010), earnings quality is largest for for-profit organizations simply because the demand for earnings quality is largest in this subsample. Moreover, because governance mechanisms are determinants of earnings quality (Francis et al., 2008), stronger governance structures in for-profit organizations compared with their nonprofit counterparts (cf. Galema et al., 2012) may also improve earnings quality for the former sector. In contrast, according to the “opportunistic behavior hypothesis” (Givoly et al., 2010), strong pressure to reach performance thresholds and performance-based incentive systems may decrease earnings quality in the for-profit sector compared with the nonprofit sector. Because we find significant differences in earnings quality only for a single earnings attribute (the earnings predictability), we propose that the two effects cancel each other and thus lead to no or only minor differences in earnings quality in the aggregate.
Based on robustness tests that suggest that there might be intra-sample differences within the nonprofit sector, we split the nonprofit sample and demonstrate that the NGOs of our sample have higher earnings quality than the cooperatives and credit unions. The latter types of MFIs seem to publish financial reports that are more contaminated by earnings management. This finding suggests that there may be significant differences within the nonprofit community, which are likely caused by differences in incentives and governance structures. Overall, there is a need for substantially more research about the quality of financial reporting in the nonprofit sector. A possible fruitful avenue for future research could be to identify situations in which earnings management may be more likely for a specific group of nonprofit entities and then to compare the earnings quality of this group with a control group not affected by the situation identified. Another approach, based on the contention that earnings quality depends on the earnings numbers’ ability to forecast future financial performance, could be to apply more advanced time-series techniques to study earnings persistence and predictability. Because the microfinance industry includes both for-profit and nonprofit organizations, as well as different organization types within the latter category, the industry provides an excellent sample for future studies of differences in earnings quality.
Footnotes
Authors’ Note
We would like to thank Øystein Strøm, Otto Andersen, Theis Theisen, participants on the 2011 International Microfinance Workshop in Kristiansand, Norway, participants on the 2011 EIBA Conference in Bucharest, Romania, two anonymous referees and Jeffrey Brudney (the editor) for helpful suggestions and comments.
Declaration of Conflicting Interests
The authors declared no potential conflicts of interest with respect to the research, authorship, and/or publication of this article.
Funding
The authors received no financial support for the research, authorship, and/or publication of this article.