
Abstract
Scholars have long debated how best to define organizational effectiveness in the nonprofit sector. Throughout the academic literature on this topic various “models of organizational effectiveness” have been proposed. These models are often derived from conceptual analyses or empirical studies of stakeholder judgments. I instead take a descriptive approach by directly asking a large sample of nonprofit leaders how their organizations define effectiveness. A mixed-method analysis of in-depth, face-to-face interviews with top leaders of international nonprofits across the United States identifies two distinct definitions of organizational effectiveness. Most leaders define effectiveness as “outcome accountability,” whereas a smaller number define effectiveness as “overhead minimization.” I conclude by discussing the implications of these findings for academic scholarship about nonprofit effectiveness as well as for popular efforts aimed at improving the overall accountability and efficiency of the U.S. nonprofit sector.
Keywords
Discipline: Political Science
How to define a nonprofit’s organizational effectiveness is among the most important but also most difficult challenges of the nonprofit sector. Over the past half century, scholars have proposed various definitions or “models” of organizational effectiveness. Much of this research is based on conceptual analyses and stakeholder surveys. Largely absent from this rich academic literature, however, are systematic efforts to understand directly how nonprofit leaders define organizational effectiveness in practice. 1 In recognition of the increasing internationalization of the nonprofit sector in the United States, this article addresses a simple research question: How do leaders of international nonprofits in the United States define organizational effectiveness? To answer this question, I analyze data from in-depth, face-to-face interviews. The results yield implications for both academic scholarship about nonprofit effectiveness as well as for popular efforts aimed at improving the overall accountability and efficiency of the U.S. nonprofit sector.
Background
Within the academic literature on nonprofit management and leadership, scholars have proposed various models of organizational effectiveness. One model, generally known as the goal attainment model of effectiveness, has served as a conceptual anchor in organizational effectiveness scholarship (Campbell, 1977; Etzioni, 1964; Price, 1972; Sheehan, 1996; Spar & Dail, 2002). Herman and Renz (1997, 1998, 2004, 2008) have consistently characterized the research program as mostly working out alternatives to, or modifications of, the goal attainment model. However, many scholars argue that this model, which simply posits that organizations are effective to the extent to which they achieve their goals, is problematic. For example, since goals reflect negotiated values and priorities, they may be perceived as subjective (Mohr, 1982) and political (Murray & Tassie, 1994). Moreover, goals can be challenging to concretely specify, which may deter measurement (Fowler, 1996; Herman & Renz, 1999; Mohr, 1982; Murray & Tassie, 1994; Stone & Cutcher-Gershenfeld, 2001; Yuchtman & Seashore, 1967), while differences in measurement can make comparisons between organizations difficult (Mohr, 1982). Finally, organizations may not be able to undertake rigorous impact evaluations capable of establishing causal attribution (Herman & Renz, 1999; Mohr, 1982; Stone & Cutcher-Gershenfeld, 2001).
In light of the many challenges associated with the goal attainment model of effectiveness, scholars have proposed a variety of alternatives. Etzioni (1960), for instance, proposed effectiveness be defined in terms of well-functioning bureaucratic systems; Katz and Kahn (1966) proposed it be a ratio of an organization’s inputs to its outputs; Yuchtman and Seashore (1967), borrowing from ecological theory, proposed it be a nonprofit’s ability to exploit its environment through fundraising; Price (1986) equated organizational effectiveness with a nonprofit’s financial viability; more recently, Herman and Renz (1997) have proposed effectiveness be understood as “a set of judgments by various stakeholders” rather than “a real property” of organizations (p. 188). Scholarship in this most recent vein has generally sought to identify the implicit criteria stakeholders employ when judging the effectiveness of specific organizations, as distinct from identifying how nonprofits define effectiveness per se (e.g., Herman & Renz, 1997; Packard, 2010; Shilbury & Moore, 2006; Tassie, Murray, & Cutt, 1998).
Forbes (1998) reviewed the literature on nonprofit effectiveness from 1977 to 1997 and concluded that treatments of the topic initially attempted to evaluate organizational effectiveness, then to identify correlates of effectiveness, and finally to focus on processes. However, this impressive body of academic research has generally not examined how nonprofit leaders define organizational effectiveness in practice.
More recently, Herman and Renz (2008) aptly summarized the state of the art of organizational effectiveness research in “nine theses.” Among their theses, they concluded that organizational effectiveness is always comparative, multidimensional, and socially constructed and offered “stakeholder responsiveness” as “a useful organizational-level effectiveness measure” (Herman & Renz, 2008, p. 399). They noted that a “measure that leaves to the respondent just what criteria are to be used might offer a way [of] recognizing the social construction of effectiveness but still allow for aggregating stakeholders’ judgments of effectiveness” (Herman & Renz, 2008, p. 405).
Such conclusions appear to validate a general trend toward increasingly complex perceptual (Packard, 2010), multiple stakeholder (Herman & Renz, 1997; Tassie et al., 1998), multidimensional (Shilbury & Moore, 2006), and multilevel models (Sowa, Selden, & Sandfort, 2004), many of which emphasize organizational practices and stakeholder judgments rather than organizational effectiveness per se (Lecy, Schmitz, & Swedlund, 2011). Meanwhile, the practical challenge of measuring organizational effectiveness persists. Independent evaluation agencies have emerged in the United States offering ratings of nonprofits based primarily or exclusively on financial data. Such assessments take neither stakeholders’ perceptions nor organizations’ programmatic achievements into account, and, although these ratings are widely consulted, they are also considered to be deeply flawed (Hager & Flack, 2004; Lowell, Trelstad, & Meehan, 2005; Ogden et al., 2009; Wing & Hager, 2004a, 2004b). Although some scholars have even recommended the construct of organizational effectiveness be dropped (Kahn, 1977), the quest for a workable definition is simply too important to abandon. Despite the “conceptual disarray and contradictions of organizational effectiveness . . . ,” Murray and Tassie (1994) remind us, “managers still must manage, and various stakeholders still make judgments . . .” (p. 322). Much hangs in the balance, but without a workable definition of what it means for a nonprofit to be effective, the problem of appropriately evaluating organizational effectiveness remains.
I complement the research examining how multiple external stakeholders judge organizational effectiveness by identifying how leaders of nonprofit organizations define effectiveness. From a managerial standpoint, nonprofits need tools to help them achieve and improve organizational effectiveness—however, they choose to define it. For nonprofits, the question of a practical definition of effectiveness is logically prior to the problems of measurement and management. Thus, to borrow Herman and Renz’s phrase, I “leave it to the respondent”—the leaders of nonprofit organizations—to define effectiveness so that organizations may be judged appropriately according to their own terms.
To understand how nonprofits define organizational effectiveness, I examine the perspectives of organizations’ top leaders. Leaders’ views are relevant and important because of their informedness and centrality (Herman, 2010), and because they are specifically empowered to speak on behalf of their organizations. This contrasts with approaches that examine the perspectives of external stakeholders: Whereas external stakeholders speak about organizations, leaders speak for organizations. In analyzing how leaders define organizational effectiveness, I seek to understand how their organizations define effectiveness.
In the sections that follow, I first describe the data, which are derived from face-to-face interviews with leaders of international nonprofits across the United States. I then introduce the results of an exploratory latent class analysis (LCA) of leaders’ open-ended responses to an interview question asking them to define organizational effectiveness. This analysis discovers that leaders tend to define organizational effectiveness in one of two distinct ways. The two subsequent sections correspondingly provide structured qualitative analyses of these two definitions of effectiveness. In the final two sections, I offer further discussion and concluding remarks.
Data 2
This study is based on data from the Transnational NGO Initiative at Syracuse University, derived from interviews with top leaders of international nonprofits registered in the United States, and so offers a Northern, U.S.-centric perspective. According to the Union of International Associations (UIA), which uses the term international NGO rather than international nonprofit, the United States itself is home to 13% of international NGO headquarters, more than any other country. Worldwide, the UIA has recognized 10,196 international headquarters, more than half of which are located in the United States and Europe (“Yearbook of International Associations: Statistics, visualizations and patterns,” 2003/2004, pp. 61-84, 87). Within the United States, such international NGOs are generally regarded as international nonprofits. At the time of the study, the U.S. Internal Revenue Service (IRS) required nonprofits with 501(c)(3) tax-exempt status and more than US$25,000 in annual receipts to file IRS Forms 990, which were available for public inspection. Based on these forms, the National Center for Charitable Statistics (NCCS) identified 6,500 international nonprofits in the United States in 2007. According to their data, these organizations spent almost US$30 billion combined (nominally) during their most recent fiscal years. 3 The combined average expenditures for the 152 organizations that participated in the interview study over the period 2001-2006 was about US$20 billion, accounting for approximately two thirds of total U.S. international nonprofit expenditures. 4
To identify leaders for the interview study, researchers initially sampled 182 organizations from a database of 334 international nonprofits rated by Charity Navigator in 2005. 5 An international nonprofit was defined as a U.S.-registered nonprofit with operations in another country. Researchers employed stratified random sampling to ensure representation by size, sector, and financial characteristics. 6 One hundred twenty-three interviews were completed with leaders from the initial sample and 29 replacements were subsequently added for a total sample size of 152 interviews. The overall response rate was 68%. 7 In the final sample, 81% of respondents were the CEOs, presidents, or executive directors of their organizations, 12% were vice presidents, and only 7% were below the level of vice president.
Charity Navigator is an online nonprofit rating agency in the United States. At the time of the interview study, it evaluated organizations with 501(c)(3) tax-exempt status from the IRS, at least 4 consecutive years of Forms 990 available and public support greater than US$500,000 during their most recent fiscal years. Organizations that reported zero fundraising costs or that were overwhelmingly funded through government grants or fees for services were excluded, along with private foundations, hospitals, hospital foundations, private universities, colleges, community foundations, and public broadcasting stations. These criteria effectively exclude very small organizations, new organizations, and organizations that are unreliant on the general public for fundraising. The size criterion introduces a small bias toward oversampling larger organizations. 8
The interview protocol was not designed to test specific models or theories. It was designed to collect baseline information about how leaders understand issues related to governance, goals, strategies, activities, effectiveness, accountability, collaboration, transnationalism, communication, and leadership. Nearly all of the interview questions solicited open-ended responses where leaders were free to speak in the own words. Specific protocol questions were developed in consultation with practitioners and pilot tested during workshops in the United States and India throughout 2005 and 2006.
Interviews took place between 2006 and 2008 and were conducted at leaders’ preferred locations, usually their offices. Leaders were guaranteed confidentiality to promote candor. The interviews averaged 82.5 min; the shortest was 32 min and the longest was 153 min. Interviewers ultimately collected about 209 hr of digital recording. All the interviews were recorded with the permission of the interviewees and subsequently transcribed.
An interdisciplinary committee of scholars created the codebook based on prior expectations, inductive readings of initial transcripts for emergent themes and input from the coding team. The coding team then coded the complete interview transcripts using computer-assisted qualitative data analysis software (CAQDAS). The final codebook contains 413 individual codes. In this article, I focus only on the nine substantive codes specifically pertaining to the definition of organizational effectiveness.
To measure the overall degree of intercoder agreement across all 413 codes, 10 complete in-sample interviews were each coded twice by separate coders. Scores were calculated measuring the percentage of agreement between the two coders of each interview transcript. The 10 scores were then averaged. A value of 0 indicates complete disagreement, whereas a value of 1 indicates complete agreement. The overall intercoder agreement score is 0.80, indicating satisfactory intercoder agreement.
Among several questions in the interview protocol related to organizational effectiveness, interviewers asked leaders, “Let me ask you about the concept of effectiveness, which is something we all have trouble defining. How does your organization define effectiveness?” Leaders’ open-ended responses were captured with nine substantive codes. Again, these codes were informed by inductive readings of initial transcripts and were not created to test for the presence of preexisting theories or models of effectiveness. The nine codes, which were organized into a group of codes or code family, are resources (e.g., material resources such as money), flexibility (e.g., nimbleness and adaptability), innovation (e.g., innovative thinking), expertise (e.g., expertise in an issue area or established credibility), contacts (e.g., making contacts for networking and collaboration), staff or associates (e.g., competencies, a well-trained staff), stakeholder satisfaction (e.g., donors, members, and other constituents), goal achievement (e.g., achievement of own goals, loyalty to own mission, and meeting of own standards), and evaluation (e.g., project evaluations, evaluations for donors, global assessments, and certifications). 9 Leaders’ responses are distributed across 150 valid cases. 10
The nine codes may be alternatively regarded as nine binary response variables. As these variables are not mutually exclusive, mathematically there are 2 9 possible response patterns corresponding to 512 different ways in which leaders could have defined organizational effectiveness. As a typical human analyst can only consider about seven patterns simultaneously, quantitative analysis is used to explore the data more efficiently and effectively (Grimmer & King, 2009). In the following section, I use LCA to determine the number of ways in which leaders understand organizational effectiveness. In the two sections after that, I employ structured information retrieval to help interpret leaders’ response patterns using qualitative evidence.
LCA
LCA was first formalized by American sociologist Paul Lazarsfeld in 1950, but as a concept is traceable as far back as 1884 to the philosopher Charles Sanders Peirce (Goodman, n.d.; Lazarsfeld, 1950; Lazarsfeld & Henry, 1968; Peirce, 1884). Although the technique enjoys a long and impressive lineage, it was not until more recent developments in computer hardware and software that LCA became practicable for mainstream social science research.
In common social science parlance, traditional LCA can be understood as discovering an unobserved or latent categorical variable that accounts for spurious association among observed or manifest response variables (Goodman, n.d.). A key assumption of LCA is that the manifest variables are statistically independent within the categories of the latent variable, a condition called local independence (Lazarsfeld & Henry, 1968; Magidson & Vermunt, 2003; McCutcheon, 1987). In the present context, LCA is employed to discover a latent variable that explains how nonprofit leaders define organizational effectiveness.
Four exploratory latent class models were estimated, each including all of the nine response variables listed above. The models differ only according to the number of categories of the posited latent variable. Model 1, Model 2, Model 3, and Model 4 test the hypotheses that there are one, two, three, and four definitions of organizational effectiveness present in the data, respectively. Finally, a multidimensional model, Model 5, with two dichotomous factors was estimated to test the hypothesis that there are two dimensions of organizational effectiveness. Fit statistics for the models are provided in Table 1.
Model Choice.
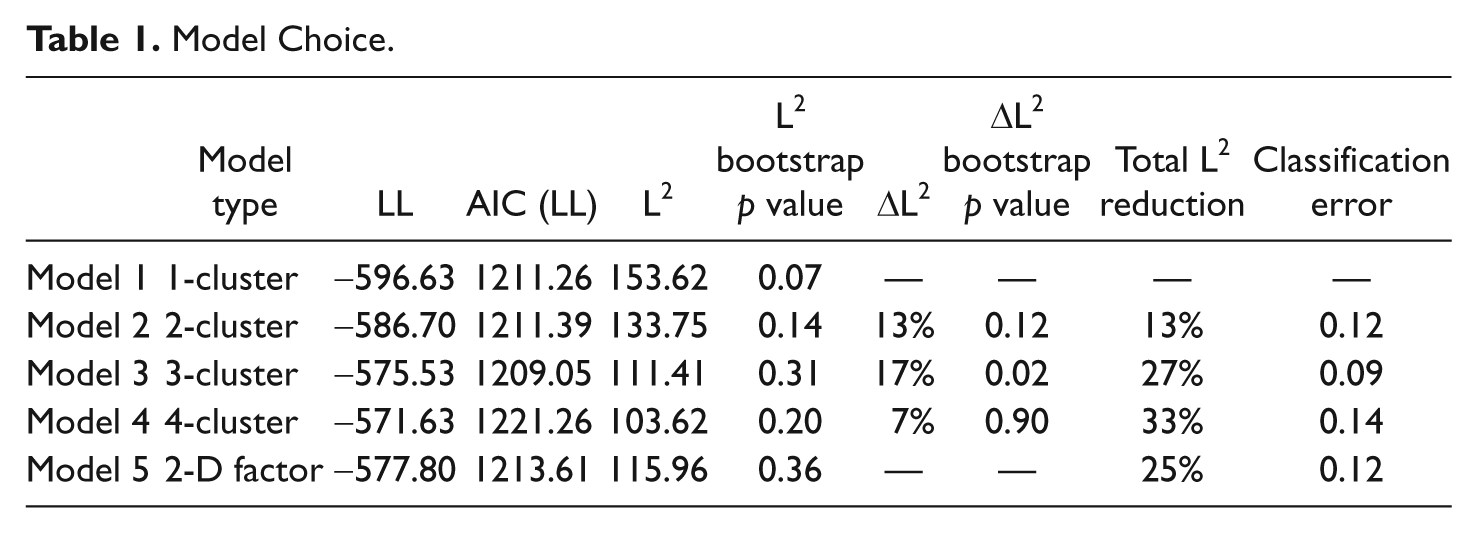
The retention of all nine response variables regardless of statistical significance complicates formal hypothesis testing. The null hypothesis that all leaders define effectiveness similarly is initially accepted according to the usual rule since the L2 bootstrap p value for the baseline model, Model 1, .07 > .05. However, upon closer inspection, we must reject the null hypothesis because significant unexplained association (local dependence) exists among four pairs of response variables (see appendix), suggesting that the L2 statistic is simply diluted by the inclusion of many variables that fail to significantly discriminate between clusters. 11
Model 2 does not provide a significant improvement in model fit over Model 1 according to the ΔL2 bootstrap p value and contains three local dependencies, again violating the local independence assumption required of LCA (see appendix). This means that Model 2 fails to explain significant association among the response variables and is therefore unacceptable. Model 3 provides a significant improvement in model fit over Model 2 and contains no local dependencies (see appendix), meaning that Model 3 successfully explains the observed association among the response variables. According to the ΔL2 bootstrap p value, Model 4 does not significantly improve on Model 3, indicating that Model 3 is the preferred latent class model.
All five models (including the discrete factor model, Model 5) can be compared according to the Akaike information criterion (AIC). The AIC is a measure of model fit that penalizes overfitting. According to the AIC Model 3 is still preferred, implying that—given these data—there are three different ways in which leaders define organizational effectiveness.
The classification of leaders into clusters occurs after model estimation. Posterior membership probabilities (PMPs) are estimated for each leader based on his or her observed response pattern and Model 3’s parameter estimates. These PMPs quantify the likelihood that each leader belongs to each cluster. Each leader is subsequently classified into the cluster to which he or she most likely belongs based on his or her PMPs, a procedure known as modal assignment (Magidson & Vermunt, 2003; McCutcheon, 1987). For example, two respondents defined organizational effectiveness in terms of resources and expertise. Their PMPs are 0.13 for Cluster 1, 0.87 for Cluster 2, and 0.00 for Cluster 3. These leaders most likely belong to Cluster 2 and are therefore assigned to that cluster, despite a 0.13 probability of misclassification. The classification errors introduced by modal assignment are displayed for each model in Table 1. Model 3 has the lowest classification error.
An important consideration when analyzing data of this nature is whether the various ways of defining effectiveness are truly the result of respondents’ conceptualizations or merely artifacts of coder bias or interviewer baiting. A chi-square test for independence performed between Model 3’s assignment solution and the variable interviewer identification indicates no evidence of interviewer baiting, χ2(12) = 13.63, p = 0.33, but a similar test with the variable coder identification implies the presence of significant coder bias, χ2(8) = 28.38, p = 0.00. Further analysis discovers that coder 4 is entirely responsible for the existence of the third latent class and a chi-square decomposition reveals that this coder accounts for an overwhelming 81% of the statistic’s magnitude. 12
Conveniently, the 3-class solution perfectly identifies the small outlier group generated by coder 4, isolating the bias. Removing the four outliers introduced by coder 4 has a negligible effect on sample size and results in a statistically significant reduction in coder bias as measured by the difference in chi-square statistics, (χ2[8] = 28.38) – (χ 2 [4] = 9.75) = (χ2[4] = 18.63, p = 0.00). 13 As an artifact of coder bias, the third cluster will simply be ignored. 14 To test for the robustness of this strategy, a two-class model was estimated with the outliers deleted ex ante and the assignment solution was compared against that of Model 3 with the outliers deleted ex post. The assignments are identical, indicating that outlier deletion has no effect on the composition of the two main clusters.
The key quantities of LCA are the latent class and conditional probabilities (Magidson & Vermunt, 2003; McCutcheon, 1987). The latent class probabilities provide estimates of the size of each cluster and the conditional probabilities describe the profiles of each cluster. These quantities for Model 3 are indicated in Table 2. 15 The profile for Cluster 1 describes about 82% of respondents whereas the profile for Cluster 2 describes about 15% of respondents. The other values in the columns labeled Cluster 1 and Cluster 2 are the probabilities that respondents in those clusters mentioned the corresponding items during the interviews, given their latent class assignments. 16 As can be seen in Table 2, the definition of effectiveness indicated by the profile for Cluster 1 involves goal achievement and evaluation, whereas the definition indicated by the profile for Cluster 2 emphasizes resources and evaluation.
Definitions of Organizational Effectiveness (Model 3).

Although LCA is very useful for discovering latent structure in data, quantitative results alone are seldom adequate for interpretation. How do we interpret the definitions of organizational effectiveness implied by the profiles for Cluster 1 and Cluster 2 in Table 2?
In the next two sections, I have retrieved leaders’ actual statements about organizational effectiveness from the interview transcripts separately for those assigned to Cluster 1 and to Cluster 2. To discipline analysis and mitigate the risk of misinterpreting atypical evidence as typical, I interpret each definition of organizational effectiveness based on exemplary qualitative evidence. The exemplarity of a leader’s statements about organizational effectiveness is defined as the probability that the leader belongs to the cluster to which he or she has been assigned. This probability is the leader’s PMP for the modal assignment. A PMP close to 0 indicates that a leader’s statements are not likely to provide good qualitative evidence to facilitate interpretation, whereas a PMP close to 1 indicates that a leader’s statements are very likely to provide good qualitative evidence to aid interpretation. Leaders’ statements about organizational effectiveness have been interpreted within the contexts of their complete interview transcripts, which are organized in the CAQDAS for efficient querying.
Cluster 1: Organizational Effectiveness as Outcome Accountability
The most prevalent way leaders think about organizational effectiveness is indicated by the profile for Cluster 1 in Table 2 and may be labeled outcome accountability. This conceptualization involves several themes. The strongest theme underlying this conceptualization (mean PMP = 0.94) is the notion that effectiveness involves achieving measurable progress toward specific outcomes. “Well for us to be effective,” one such leader noted (ID = 34, PMP = 1.00), “is to achieve the programmatic or strategic goals that we’ve identified.” Another phrased it slightly differently (ID = 7, PMP = 0.99): “We define it as whether or not we are getting the tasks achieved that we set for ourselves.” Still another put it even more simply (ID = 22, PMP = 0.94): “We set important goals and we achieve them.” Whatever phrasing they chose, most leaders seem to agree that effectiveness involves goal attainment.
Another common theme is that of promise-keeping. Leaders routinely promise donors to use their resources to achieve specific outcomes, such as is commonly exemplified in formal contracts. One leader who conceptualized effectiveness in this way argued that “if we’ve done the work that we’ve said we would do that should be one level of effectiveness” (ID = 147, PMP = 0.73). Other respondents characterized effectiveness more mission-centrically. “To me,” a leader asserted (ID = 136, PMP = 1.00), “it’s when you are doing what you’re saying you’re doing, that you’re serving your mission and that you’re able to show that you’re serving your mission.” To be effective involves not just goal attainment but also demonstrability.
Another widespread theme involves the use of detailed frameworks and timelines for outcome evaluation. A typical leader responded to the question about effectiveness by first emphasizing the goal attainment and promise-keeping aspects of organizational effectiveness, then describing sometimes very elaborate evaluation frameworks and providing examples of recent program evaluations. Leaders frequently discussed mixed-methods and multiple indicators and defined broad frameworks encompassing outputs and outcomes. One leader said as follows (ID = 115, PMP = 1.00):
Well very simply we set out in the logical frameworks, where our goals and objectives are, and then through our [monitoring and evaluation] . . . we measure outputs and outcomes . . . it’s easy to measure the outputs, and that’s one measurement of effectiveness, but the outcome is of course in the goals and objectives we’ve set out.
The precise delimitation of the output/outcome distinction is not always crystal clear, but respondents were generally adept at distinguishing between notions like inputs and outputs on the one hand, and outcomes and impacts on the other—consistent with the well-known logic model and theory of change approaches (McLaughlin & Jordan, 2010; Weiss, 1998; Wholey, 1987). Such leaders persevere with their evaluation frameworks despite technical challenges (Carman & Fredericks, 2010; Plantz, Greenway, & Hendricks, 1997; Poole, Davis, Reisman, & Nelson, 2001). Another leader said as follows (ID = 112, PMP = 0.73):
On the education part, that’s the part that’s hard, that’s the part I talked about just a little while ago, and you can’t just measure . . . you can just measure how many people show up for a lecture, but that’s not going to do it. That’ll give you your output; it won’t give you your impact. And so we’re struggling right now to make sure that all of our measuring and evaluation instruments look at . . . what are the three? There’s output, impact—I guess result, output, and impact.
Generally, leaders at least implicitly acknowledge potential disconnections in the causal chain between upstream output indicators and downstream outcome and impact indicators. They distinguish between inputs, outputs, outcomes, and impacts. Inputs involve the resources necessary for producing goods and services, such as money. Outputs generally refer to the goods and services organizations provide, whereas outcomes are the presumed effects of these services on beneficiaries. Finally, impacts are effects that are causally attributable to an organization’s activities (White, 2009). As might be expected, outputs are often associated with short-term objectives, whereas outcomes are associated with longer-term goals, again consistent with a logic model approach (Thomas, 1994).
Although leaders affirm the primacy of achieving meaningful results, their organizations do not necessarily take the additional steps to rigorously evaluate outcomes and impacts (Berger, 2009; Poole et al., 2001; Sawhill & Williamson, 2001; Sheehan, 1996). Many organizations are held accountable for inputs, such as functional expenses, and outputs, such as quantities delivered, but not necessarily outcomes or impacts. One leader remarked that (ID = 125, PMP = 1.00)
. . . there has been a tendency in the organization in the past and there’s tendency for a lot of organizations just to measure outputs. I am opposed, personally, to measuring output because I think you have to measure outcomes, and so we don’t count . . . I’ve already told you that we don’t pay attention to the fact that we did 50 missions in a year or that we saw 10,000 patients. What we’re all about is changing behaviors, changing capabilities . . .
Measuring goal attainment on an ongoing basis usually involves complex systems. Leaders expound “matrix” (ID = 17, PMP = 1.00) systems and assess progress quarterly, annually, and even according to “five-year plans” (ID = 98, PMP = 0.98). “Well we have a strategic plan,” a respondent (ID = 98, PMP = 0.98) said, “we have certain goals that evolve annually, and we, at least quarterly, we measure what is happening against what our goals for the year are, our five-year plan.” Another leader’s account illustrates a concern about the practical difficulty of operationalizing abstract outcome variables with proxy measures (ID = 36, PMP = 0.81):
So effectiveness for us is really seeing concrete positive change on the ground for the displaced people that we’re concerned about. So that’s really the only measure. Ultimately, there are many. You try to make those changes through a variety of means. So for example, getting an op-ed article in a newspaper or getting an important meeting or having someone publicly acknowledge the importance of a report that we’ve put out. But unless you see actual change, unless the recommendations are adopted and you see actual change for the people that we’re concerned about those other things don’t really add up to very much.
Moreover, just as leaders differentiate between outputs and outcomes, they also distinguish between short-term, intermediate, and long-term goals in a variety of ways. For example, one leader said as follows (ID = 143, PMP = 0.99):
The way we broke it down is that we have goals, and then we have objectives, and then we have performance indicators. And my expectation of my staff is that they are attempting to determine whether we are hitting our performance indicators, which are leading to our objectives, which, long term, will lead to our goals. Or whether we need to constantly reevaluate and determine whether or not we’re aiming for the right things, whether we have the right performance indicators, whether we have the right objectives, and ultimately, whether we have the right goals.
Leaders also differentiate between long-term abstract missions and short-term programmatic goals. When pressed, respondents often discussed effectiveness at the programmatic level rather than the more abstract level of their organizational missions. Outcome accountability involves the demonstrable achievement of measurable goals, not necessarily the complete fulfillment of overarching missions. As Sawhill and Williamson (2001) found, nonprofits need “specific, actionable, and, most critical, measurable goals to bridge the gap between their lofty missions and their near-term operating objectives” (p. 380). Although some scholars criticize the conceptualization of organizational-level effectiveness as a function of program effectiveness (e.g., Herman & Renz, 2008), many nonprofit leaders appear to make precisely this connection.
In sum, outcome accountability involves the themes of goal attainment, promise-keeping, complex intertemporal evaluation frameworks, and multiple levels of analysis. Many leaders adhere to a logic model approach, whether explicitly or implicitly, despite practical implementation challenges. Leaders subscribing to this general view believe that effectiveness means being accountable for achieving their promised outcomes.
Cluster 2: Organizational Effectiveness as Overhead Minimization
The second latent class is indicated by the profile for Cluster 2 in Table 2 and may be labeled overhead minimization (mean PMP = 0.72). This conceptualization involves several financially oriented themes. One leader, for example, described organizational effectiveness as whether programs achieve “bang for the buck,” emphasizing a general theme of efficiency (ID = 144, PMP = 1.00). Another leader’s “way of thinking about a nonprofit is that you want to . . . strive to do what you do for less until you can do it for free” (ID = 103, PMP = 0.90), illustrating a more specific theme of cost minimization.
Cost minimization, particularly the minimization of nonprogram costs, is the central theme of this conceptualization of effectiveness. One particularly succinct illustration comes from a respondent who simply stated that “to be effective in [DELETED] is to deliver services and assistance to the people of [DELETED] at low cost” (ID = 78, PMP = 0.53). Other leaders included both conceptualizations of effectiveness in their definitions, simply prioritizing overhead minimization over outcome accountability. One defined effectiveness in “two ways. The amount of money that’s actually getting to the field dedicated to the programs . . . and secondarily the actual impact of projects that you can quantify” (ID = 44, PMP = 0.65). The leader’s focus on the proportion of resources allocated to programs evokes the overarching theme of overhead minimization. Another respondent offered a slightly more detailed explanation (ID = 40, PMP = 0.89):
I think we define effectiveness in three ways. In terms of fundraising we consider ourselves effective if we meet our fundraising goals and if we turn over a substantial amount, obviously an overwhelming amount of that to [DELETED], and if we keep the administrative costs on that low. So right now we say we have . . . about ninety-two cents on the dollar are used for programs.
The leader continued to describe his or her organization’s second and third ways of defining effectiveness, one of which was also financial and the other of which was programmatic. However, achieving fundraising goals and minimizing overhead were the respondent’s most immediate associations with effectiveness.
There are many possible explanations as to why some leaders would understand effectiveness more as overhead minimization than outcome accountability. Leaders may be responding to external pressures from donors and independent evaluation agencies in the United States rating nonprofits based on publicly available financial information from the Form 990. Indeed, many leaders touted their organizations’ low overhead ratios during the interviews and some explicitly commented that low overhead is an important selling point for fundraising. One such leader volunteered that “our best ace card is our efficiency in terms of how we have a low overhead,” and subsequently explained how he or she measured effectiveness in the context of disaster relief, where the construct is possibly easier to define (ID = 63, PMP = 1.00). How to measure effectiveness “depends on what kind of program it is. In disaster relief . . . it’s the number of people you treat, the injuries you’ve come in contact with, the number of patient contacts and the amount of medicines you’ve dispensed . . .” (ID = 63, PMP = 1.00).
That low overhead is an “ace card” and that effectiveness can be measured by counting outputs are more typical of the overhead minimization perspective than the outcome accountability view. Indeed, a propensity for output counting emerges as another notable theme. Measuring effectiveness, another leader admitted (ID = 74, PMP = 0.65):
Well that’s very difficult for the international programs . . . we can’t determine the outcomes, so we measure products. We measure outputs. What is sent over, what its purpose is, where it goes. We don’t necessarily know how many people it will affect. If it’s a missionary group that we’re equipping, they can say well we treated two-thousand people within a two week time period. This is what you gave us, this is what we did with it, and these were the outcomes. I mean you can do that. But when you’re dealing with, let’s say a clinic or a hospital . . . you can measure success primarily by your outputs.
Efficiency, cost minimization, and output counting constitute the themes of overhead minimization, which contrast with the themes of goal attainment, promise-keeping, and program evaluation that characterize outcome accountability. Even though the general concept of evaluation is prevalent within both conceptualizations of effectiveness, outcome accountability emphasizes program evaluation and outcomes while overhead minimization emphasizes financial evaluation and outputs.
Discussion
Leaders interviewed for this study were based in the United States, where we might expect to discover a cultural contingent favoring financial accountability and the use of business metrics such as the overhead ratio. Moreover, leaders headed international nonprofits, where organizational effectiveness may be defined differently than for domestic nonprofits. It is possible that leaders of purely domestic U.S. nonprofits may conceptualize organizational effectiveness slightly differently, as may leaders of international nonprofits located in other countries. More research is needed here.
It is also useful to note that leaders’ conceptualizations of organizational effectiveness do not significantly vary based on sector, function, Charity Navigator efficiency rating and capacity rating, headquarters location, respondent’s gender, tenure at organization, or country of residence. 17 They do, however, vary based on organizational size. This association, χ 2 (2) = 9.11, p = 0.01, is driven by the larger than expected number of “overhead minimizers” within large nonprofits (annual budget greater than US$10 million), accounting for 67% of the chi-square statistic’s magnitude. 18 This may be the result of larger nonprofits being more likely to hire financial professionals, but again more research is needed.
Finally, there is reason to suspect that the proportion of leaders holding the overhead minimization view may be overstated due to Charity Navigator’s selection criteria, which excluded nonprofits with revenues less than US$500,000. The data suggest that leaders from smaller organizations may be less likely to define effectiveness as overhead minimization.
Summary and Implications
Leaders of international nonprofits in the United States tend to conceptualize the construct of organizational effectiveness in one of two ways (see Table 2). Most leaders (about 82%) conceptualize it as outcome accountability. They focus on achieving substantive outcomes, not just maximizing outputs, and believe that their organizations are effective when they keep their promises to stakeholders, particularly donors. 19 Only a minority (about 15%) subscribe to an overhead minimization model of effectiveness that is focused more on financial evaluation and output reporting.
These findings pose a number of challenges to the academic literature summarized earlier. First, although the difficulties of the goal attainment model have encouraged the development of alternative models of organizational effectiveness, most leaders would appear to benefit more from improved methods of goal attainment evaluation than from additional alternatives to the goal attainment model. Second, although recent scholarship has tended toward the exploration of multidimensional models of organizational effectiveness, the literature has lacked explicit comparisons between multidimensional approaches, which view effectiveness as a multifaceted construct, and multidefinitional approaches, which disaggregate effectiveness into multiple conceptualizations. Given the interview data analyzed for this study, a direct statistical comparison making use of LCA and discrete factor analysis favored a multidefinitional model over a multidimensional model.
There are also a number of implications for various systemic efforts underway in the United States aimed at improving overall nonprofit performance and accountability. First, although overhead minimization is much less common than outcome accountability as a conceptualization of organizational effectiveness, it still appears to have significant support among many leaders. One plausible explanation is the dominance of the Form 990 as the principal nationwide, standardized accountability mechanism for nonprofit organizations in the United States. As the Form 990 requires nonprofits to disclose data on costs, but not outcomes, perceptions of accountability may be skewed toward financial practices. In addition, public scrutiny of the Form 990 incentivizes nonprofits to optimize reported financial information to generate favorable evaluations. This might be seen as positive evidence that some nonprofits are responding appropriately to an accountability mechanism that encourages overhead minimization. However, low overhead is not necessarily desirable (Wing & Hager, 2004a). According to the outcome accountability view, a nonprofit may have low overhead but if its programs have no impact its effectiveness is zero.
Second, the apparent multidefinitionality of organizational effectiveness raises the question of whether nonprofits are best judged in accordance with the principles of outcome accountability or overhead minimization. However, if the overall goal of contemporary performance and accountability initiatives is to promote greater efficiency in the nonprofit sector, information about both financial costs and substantive outcomes must be linked together to indicate cost-effectiveness. Efforts of government regulators, independent evaluation agencies, and the general public to improve the efficiency of the nonprofit sector will remain severely limited until nonprofits are able to generate, and are required to systematically disclose, meaningful information about both costs and outcomes.
Demonstrating effectiveness is increasingly necessary for maintaining accountability, and outcome-oriented measures of organizational effectiveness are gradually augmenting, if not replacing, process-oriented measures for evaluation purposes (Alexander, Brudney, & Yang, 2010). If these trends are to culminate in a more efficient nonprofit sector, both nonprofits and those wishing to hold them accountable will have to overcome the practical challenges associated with outcome accountability and the goal attainment model of organizational effectiveness.
Footnotes
Appendix
Bivariate Residuals
| Code | Resources | Flexibility | Innovation | Expertise | Contacts | Staff or associates | Stakeholder Satisfaction | Goal achievement | Evaluation |
|---|---|---|---|---|---|---|---|---|---|
| Model 1 a | |||||||||
| Resources | — | ||||||||
| Flexibility | 0.55 | — | |||||||
| Innovation | 10.42 | 1.58 | — | ||||||
| Expertise | 3.49 | 3.86 | 0.80 | — | |||||
| Contacts | 0.00 | 2.16 | 0.99 | 2.69 | — | ||||
| Staff or associates | 0.11 | 2.10 | 0.31 | 0.88 | 5.43 | — | |||
| Stakeholder Satisfaction | 0.00 | 0.94 | 0.15 | 0.10 | 0.12 | 5.04 | — | ||
| Goal achievement | 3.14 | 0.00 | 0.43 | 0.33 | 0.22 | 0.11 | 0.14 | — | |
| Evaluation | 0.15 | 0.26 | 1.56 | 0.08 | 0.13 | 1.47 | 0.33 | 0.54 | — |
| Model 2 a | |||||||||
| Resources | — | ||||||||
| Flexibility | 0.28 | — | |||||||
| Innovation | 0.27 | 2.55 | — | ||||||
| Expertise | 0.00 | 4.71 | 0.05 | — | |||||
| Contacts | 0.05 | 2.20 | 0.72 | 2.39 | — | ||||
| Staff or associates | 0.50 | 2.19 | 0.08 | 0.55 | 5.34 | — | |||
| Stakeholder Satisfaction | 0.06 | 0.96 | 0.26 | 0.05 | 0.12 | 4.95 | — | ||
| Goal achievement | 0.00 | 0.01 | 0.20 | 0.02 | 0.29 | 0.23 | 0.09 | — | |
| Evaluation | 0.12 | 0.22 | 0.68 | 0.36 | 0.15 | 1.33 | 0.29 | 0.22 | — |
| Model 3 a | |||||||||
| Resources | — | ||||||||
| Flexibility | 0.46 | — | |||||||
| Innovation | 0.82 | 0.04 | — | ||||||
| Expertise | 0.04 | 0.94 | 0.41 | — | |||||
| Contacts | 0.28 | 0.01 | 0.03 | 0.85 | — | ||||
| Staff or associates | 0.14 | 0.03 | 0.19 | 0.01 | 0.59 | — | |||
| Stakeholder Satisfaction | 0.00 | 0.05 | 0.92 | 0.03 | 0.23 | 1.82 | — | ||
| Goal achievement | 0.01 | 0.57 | 0.00 | 0.05 | 0.31 | 0.13 | 0.63 | — | |
| Evaluation | 0.11 | 0.88 | 0.18 | 0.88 | 0.54 | 0.63 | 0.10 | 0.39 | — |

BVR = χ2 / df. A value greater than 3.84 indicates a local dependence at the 95% confidence level.
Acknowledgements
An earlier version of this article was presented at the 39th annual conference of the Association for Research on Nonprofit Organizations and Voluntary Action in Alexandria, Virginia.
Author’s Note
The author is especially grateful to Alejandro S. Amezcua, Tosca Bruno-van Vijfeijken, Derrick L. Cogburn, Jesse D. Lecy, Margaret Hermann, Christiane Pagé, Paloma Raggo, Michael J. Scialdone, Hans Peter Schmitz, and Lorena Viñuela, without whom this research would not have been possible. The author also thanks three anonymous reviewers for their invaluable advice and criticism.
Declaration of Conflicting Interests
The author declared no potential conflicts of interest with respect to the research, authorship, and/or publication of this article.
Funding
The author disclosed receipt of the following financial support for the research, authorship, and/or publication of this article: This research was supported by National Science Foundation Grant No. SES-0527679 (Agents of Change: Transnational NGOs as Agents of Change: Toward Understanding Their Governance, Leadership, and Effectiveness) and the Transnational NGO Initiative at the Moynihan Institute of Global Affairs at Syracuse University.