
Abstract
Scholars and practitioners have argued that effective financial management, particularly the development of operating reserves, can help nonprofits survive economic shocks. The COVID-19 pandemic, which has had a significant impact on the nonprofit sector, provides an opportunity to test whether nonprofits have followed that recommendation, and if so, whether nonprofits with operating reserves were better prepared for the pandemic. Using data from an original survey of more than 600 nonprofit human service and arts organizations, administered when most states had stay-at-home restrictions, we show that most nonprofits experienced an immediate impact on their programs and financing. Yet, those nonprofits with more reserves were less likely to reduce operating hours, lose staff, or experience difficulty acquiring supplies or vendor services. Our study provides rare empirical data on the benefits of operating reserves for nonprofits. Our results also confirm that arts and culture nonprofits were more severely affected than human service nonprofits.
Keywords
The COVID-19 pandemic has brought major disruptions to nonprofit activities. Within the first few weeks of the pandemic, many nonprofits had to suspend programs or quickly adapt their program delivery models, lost government contracts, or canceled fundraising events (Kim & Mason, 2020). Additional impacts are expected due to declining tax revenue (National Conference of State Legislators, 2020), a portion of which is appropriated for nonprofits to deliver services (Mosley, 2020). In this article, we explore how nonprofits responded to the initial impact of COVID-19 and the resulting economic contraction.
In the context of the COVID-19 pandemic, we explore whether organizations heeded past warnings to protect themselves through effective financial management (Hung & Hager, 2019; Lu et al., 2019; Mitchell, 2017; Park & Mosley, 2017). Specifically, did nonprofits develop operating reserves to help sustain operations, avoid layoffs, and protect their programs during economic uncertainty? We examine whether nonprofits with larger operating reserves were better able to absorb the initial impact of COVID-19. The impact of COVID-19 has not been monolithic, however. While it has forced many arts organizations to go dark (Fraser, 2020), some human service nonprofits such as food banks had a surge in demand (Kulish, 2020). Given differences in their programs and funding market, we also examine the pandemic’s varying effects on human service and arts nonprofits.
Literature Review
Over the past decade, various financial management measures have been considered to estimate the financial vulnerability and resilience of nonprofits, with a special focus on operating reserves (Blackwood & Pollak, 2009; Calabrese, 2013). The Nonprofit Operating Reserves Initiative Workgroup (2008) defines operating reserves as “the portion of unrestricted net assets that nonprofit boards designate for use in financial emergencies.” A growing number of studies (Blackwood & Pollak, 2009; Calabrese, 2013; Sloan et al., 2016) have discussed the factors associated with the size of nonprofit operating reserves. The normative idea of creating operating reserves (rainy day funds) is increasingly embraced in the field (National Council of Nonprofits, n.d.). However, little evidence exists on the actual benefits of having rainy day funds during economic downturns. One exception is Calabrese (2018) who showed that nonprofits with adequate reserves are better able to weather short-term disruptions in revenue or increased spending, and are able to maintain budgetary stability. Our study adds to the literature by testing the extent to which nonprofits with different amount of reserves experienced the initial impact of COVID-19.
Different types of organizations experience economic shocks differently. Arts nonprofits often face additional pressure during economic downturns, given that they must compete for donations with human service organizations, whose needs are often perceived as more urgent (Kim, 2017). Furthermore, human service nonprofits tend to experience increased demand for their services during recessions (Hasenfeld, 2010) and may benefit from emergency foundation support and donations, at least in the short term, as funders seek to fill immediate community needs (Walker, 2020). Arts and culture organizations, however, depend largely on consumer spending and leisure activities (e.g., ticket sales, admission fees, and sponsorship for events), making them vulnerable to shocks (Grodach & Seman, 2013). COVID-19 has presented additional challenges for arts nonprofits whose programs rely upon community gatherings and shared experience. Still, Grizzle at al. (2015) found human service organizations to have smaller operating reserves than arts nonprofits on average and argued that could be because their relatively diversified revenue streams give them some sense of protection to weather financial storms.
Data
The data for this study come from a survey of nonprofits in the arts and culture and human service sectors conducted shortly after stay-at-home or similar orders were issued or extended by state and local governments. Between April 20 and May 8, 2020, email invitations were sent out to 2,652 nonprofits to complete a survey about the impact of COVID-19 and their perceptions of future challenges. These nonprofits are part of a university-affiliated panel consisting of organizations that have opted to participate in two to three surveys per year. When the survey was closed after two reminders, 641 nonprofits representing all 50 U.S. states had participated in the survey. Respondents were mostly executive directors, or someone in an equivalent position. The survey was composed of 16 questions, and for this study, we use three questions explained below. Responses were combined with the corresponding organizations’ Form 990s, obtained from the National Center for Charitable Statistics (NCCS) 2017 Core Files.
Our findings are based on the 614 complete survey responses whose Form 990s are available. Slightly more than 70% were answered by human service nonprofits and the rest were completed by arts and cultural nonprofits. Due to some missing values, regression results are based on 487 observations. Table 1 compares the weighted and unweighted profiles of respondents (i.e., nonprofits) to the overall human service and arts nonprofits in the United States (i.e., population). Because there are fewer smaller and younger organizations in the sample, we apply poststratification adjustments for budget size, organization age, type, and region for all results unless otherwise noted. Although it helps make the results more generalizable, weighting does not eliminate sources of bias that are independent of the weighted variables (Pasek, 2016).
Comparison of Weighted and Unweighted Profile of Respondents (%).
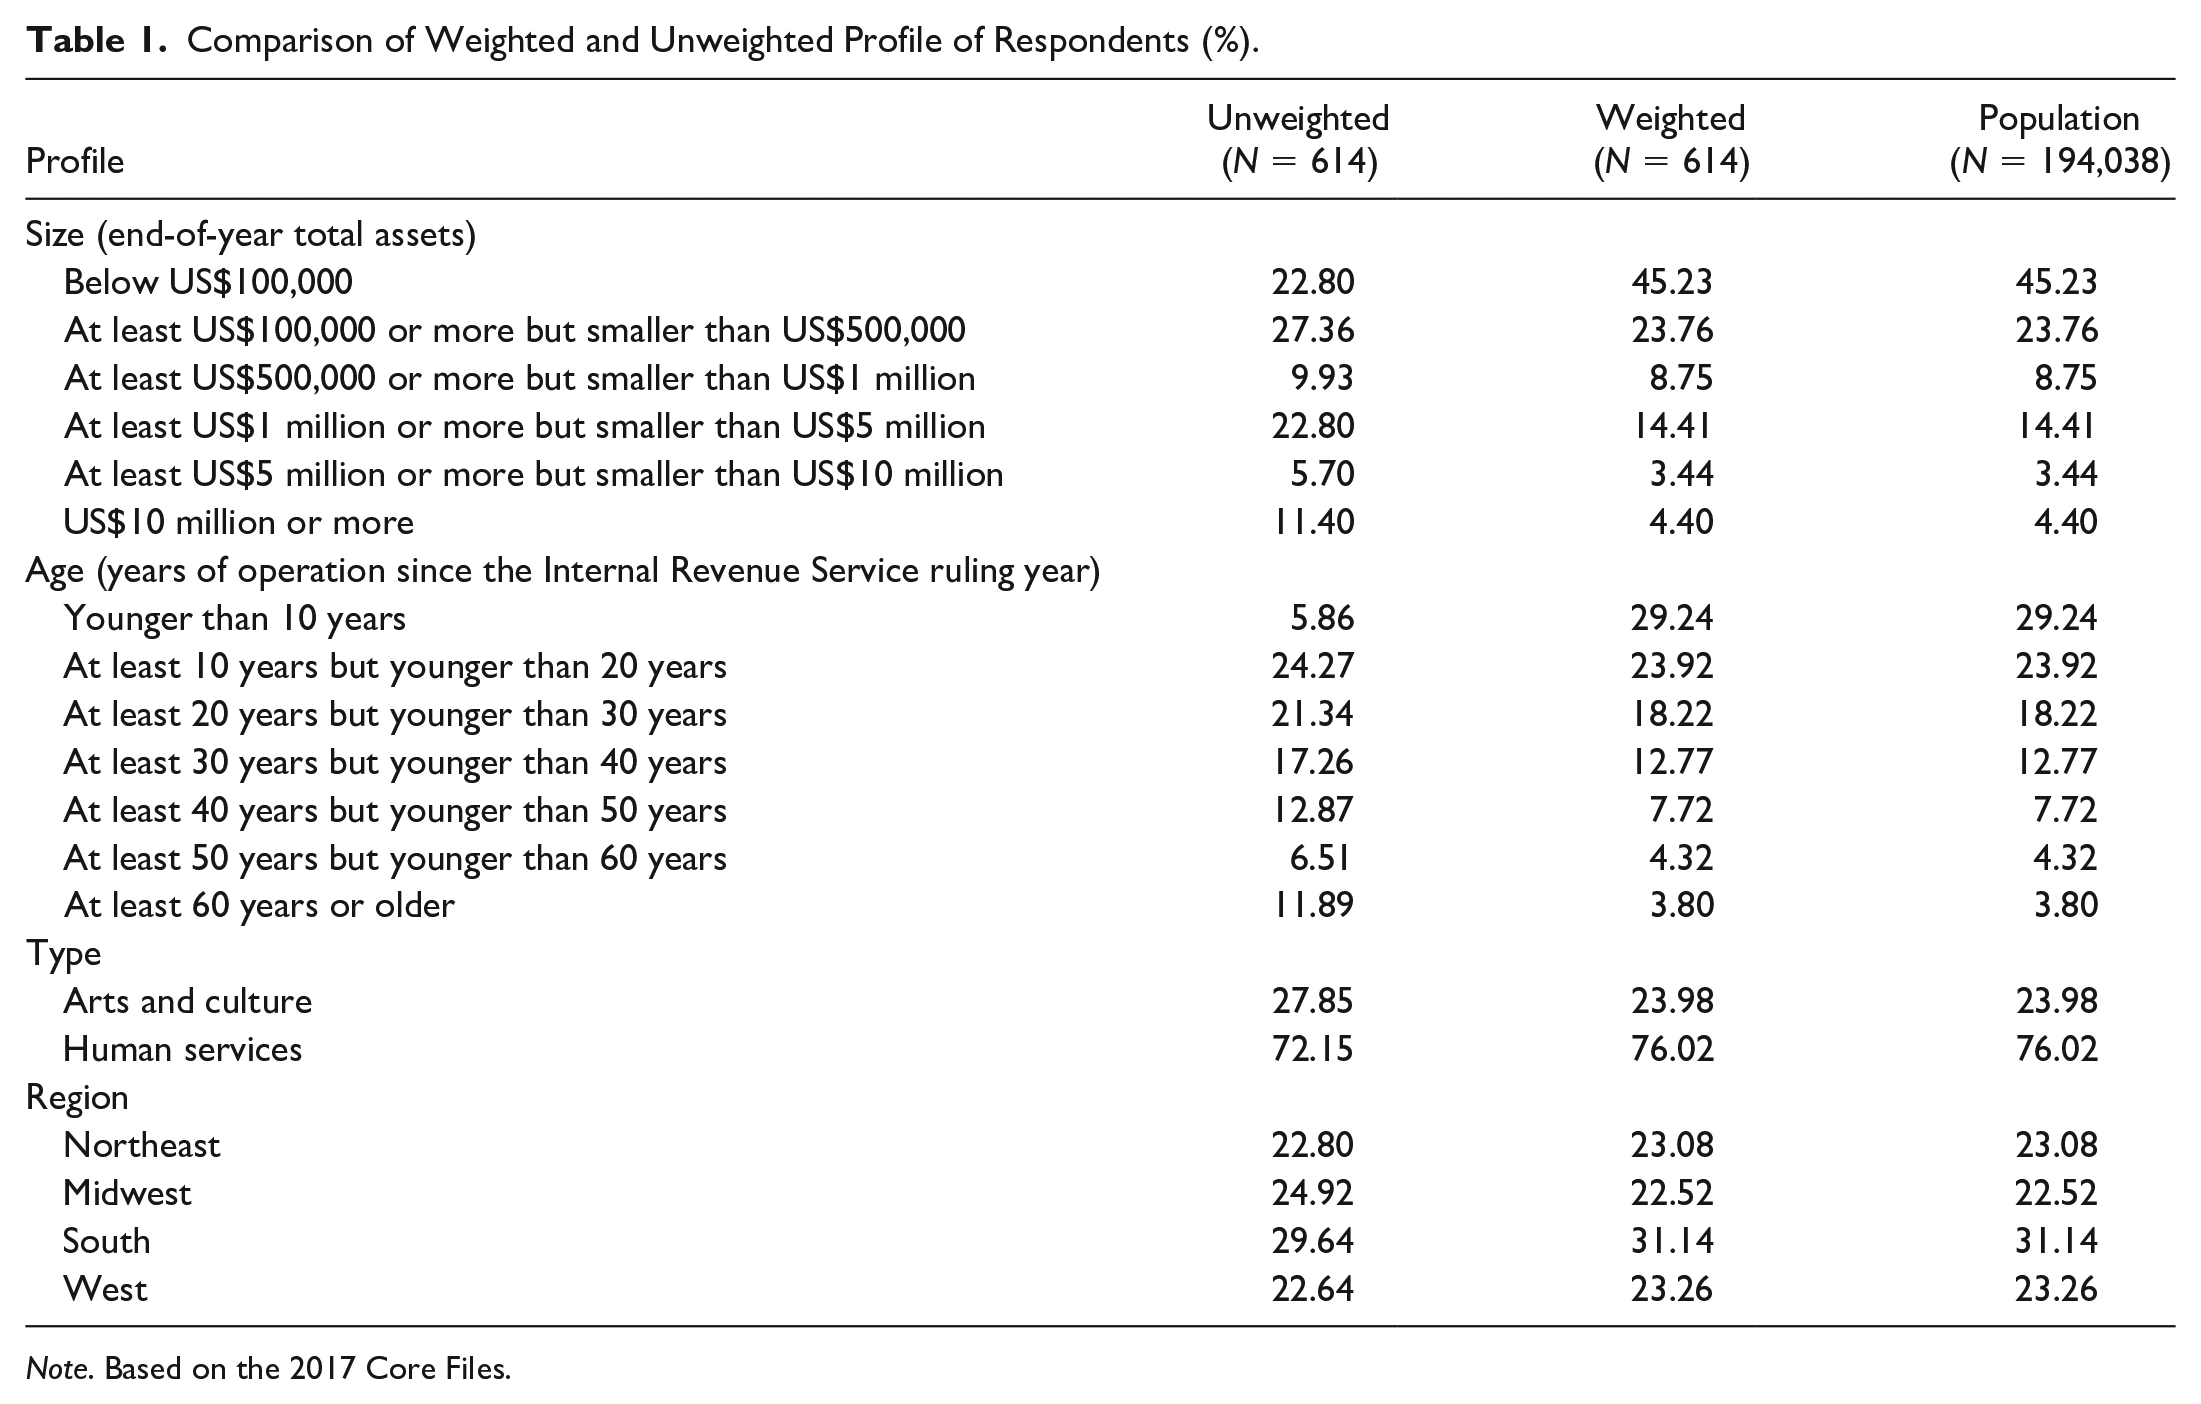
Note. Based on the 2017 Core Files.
Variables
Dependent Variables
The survey asked “Which of the following impacts has your organization experienced already or do you anticipate experiencing due to COVID-19? (Check all that apply, and/or share additional ways),” offering four choices—“experienced already, anticipate experiencing, do not anticipate, and not relevant.” Figure 1 shows the percentage of organizations that either “experienced already” or “anticipate experiencing” for each item, in rank order and separately for arts and culture nonprofits and human service nonprofits. We combined the responses for “experienced already” and “anticipate experiencing” because an organization’s response could depend highly on their location, rather than their own financial situation.

The impacts of COVID-19 on nonprofits.
Descriptive findings confirm the immediate and intense shock most organizations faced. The vast majority of nonprofits had to or expected to cancel events and suspend programs until further notice, or otherwise change the way programs were offered. While it is clear that the pandemic affected most nonprofits, arts organizations were generally hit harder. For example, 93% of arts organizations had to or expected to suspend programs, compared with 66% of human service organizations. 1 Also, 75% of arts nonprofits reported decreasing demand for services, whereas 57% of human service nonprofits reported increasing demand. Arts nonprofits also faced more resource-related challenges compared with human service nonprofits. For instance, a larger percentage of arts nonprofits experienced or anticipated decreasing donations (71%) compared with human service organizations (57%).
Independent Variables
To measure an organization’s rainy-day-funds, we asked respondents, “Does your organization have operating reserves, rainy day funds? (Please choose 0 if none, and choose 13 if longer than 12 months).” Arts nonprofits reported an average of 6.05 months of reserves and human service organizations reported 5.70 months, on average. The difference between the two types was not statistically significant. Figure 2 shows the distribution of rainy-day-funds for each type. The average values are larger than those found in previous studies: Blackwood and Pollak (2009) found that operating public charities in the Washington, D.C., area had a median operating reserve of 2.1 months in 2006. Grizzle et al. (2015) and Calabrese (2013) both used a national nonprofit panel from 1998 to 2003 and found the median size of reserve to be about 1 month of expenses.
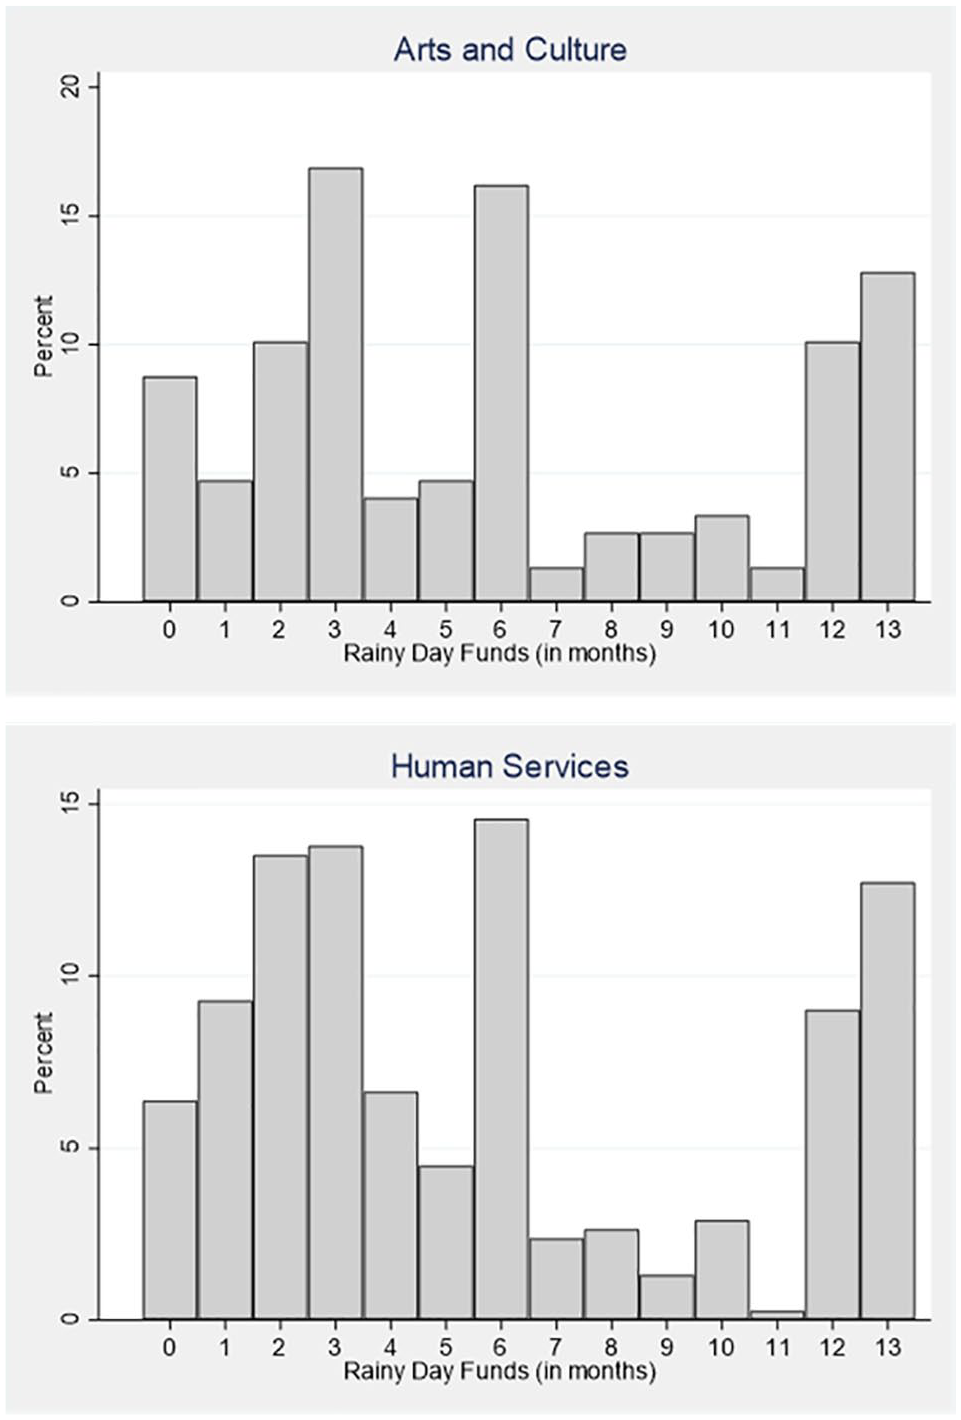
Distribution of rainy day funds.
We note two points to account for the discrepancy between our results and previous findings. First, these studies used data from before the Great Recession (2007–2009), which may have catalyzed the development of reserves moving forward. Second, previous studies used 990 data and measured operating reserves in terms of “unrestricted net assets less fixed assets net of debt,” the definition provided by the Nonprofit Operating Reserves Initiative (NORI) Workgroup (2008). Although practitioners agree that reserves need to be highly liquid and unrestricted, nonprofit leaders have different perspectives of what constitutes reserves; it may include lines of credit, investment accounts, endowments, sister foundations, and capital funds (Sloan et al., 2016). For this reason, Sloan et al. (2016) argued that measuring reserves based on assets can underestimate other forms of liquid cash available during emergencies. Furthermore, while it is true that all nonprofits should have reserves, there is not a single standard that is applicable for all nonprofits (National Council of Nonprofits, n.d.). As such, we allowed respondents to provide answers in terms of months that can be covered when regular income is disrupted or decreased without giving respondents a definition. We limited the answer to 13 months to curtail potential outliers because it is unlikely that a large number of nonprofits would have more than 12 months of reserves, given the 3- to 6-month recommendation by practitioners and findings in previous studies (Zietlow, 2010).
To check the validity of rainy-day-funds, we turn to a variable measuring leaders’ perception of their stability, given their continuing operating capacity. Respondents answered the question, “Given the current financial situation, how long do you estimate that your organization could continue operating? (Please choose 0 if none, and choose 13 if longer than 12 months)” with the average answer 9.26 months. The current situation in this question refers to the pandemic and growing economic uncertainty during the survey period. The correlation between the two measures was .5161 and statistically significant. We use this measure as an alternative to rainy-day-funds to test the robustness of our findings. It is worth noting that 33 organizations that answered the second question did not answer the first. It is possible that respondents found it easier to think of how long they can continue operating, given the situation, especially if they have a substitute such as a sister foundation to finance their operations during a crisis. To make the results comparable, we dropped these 33 organizations from the analysis.
Control Variables
Our empirical model controls factors that are closely related to a nonprofit’s capacity to build reserves. We chose this set of control variables to balance the risk of omitted variable bias and the merits of parsimonious model. For the sake of brevity, we provide comprehensive details on each control variable in Table 2, which describes how each variable was defined and operationalized, their statistics, data source, and rationales. There is a 3-year gap between the financial ratios, obtained from NCCS 2017 Core Files, and the dependent variable, obtained from 2020 survey data. This is partly because 2017 records are the most recent data available, but it is also because lagged financial values prevent the possibility of a reciprocal relationship between the two. Furthermore, our approach helps minimize potential common source bias by drawing variables from two separate sources. We also tested our hypotheses with NCCS Core Files from 2014, 2015, and 2016 and found that they produced qualitatively similar results (i.e., direction of relationships and statistical significance).
Description of Variables (N = 487).
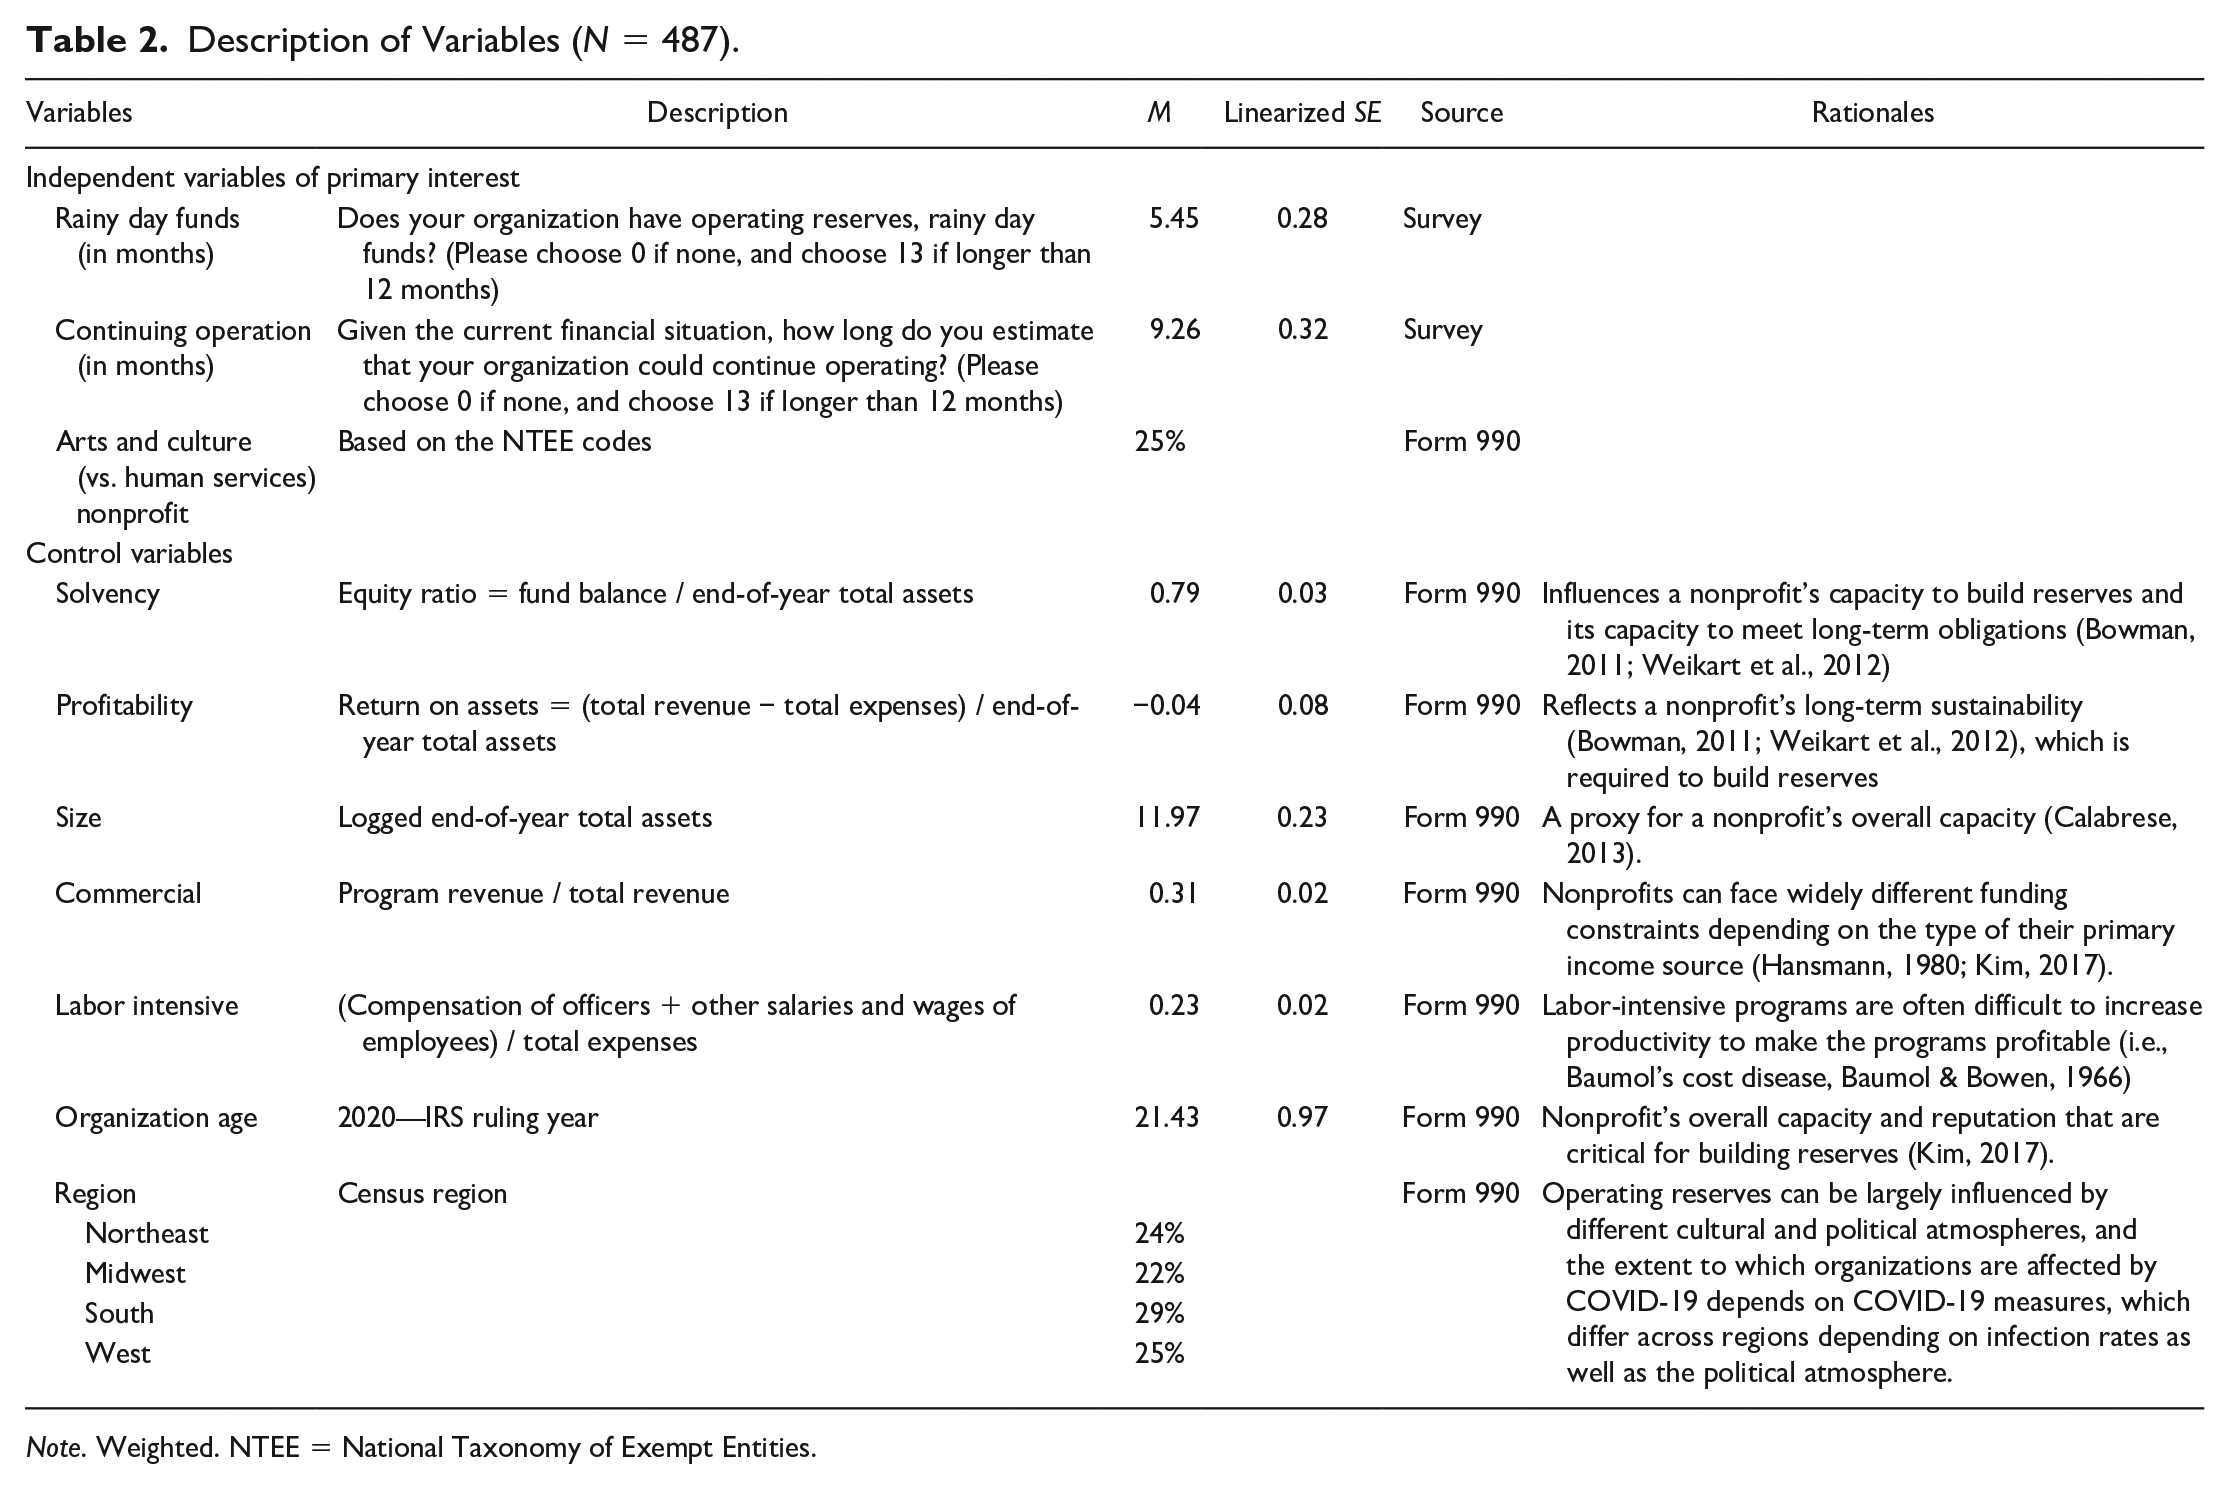
Note. Weighted. NTEE = National Taxonomy of Exempt Entities.
Results
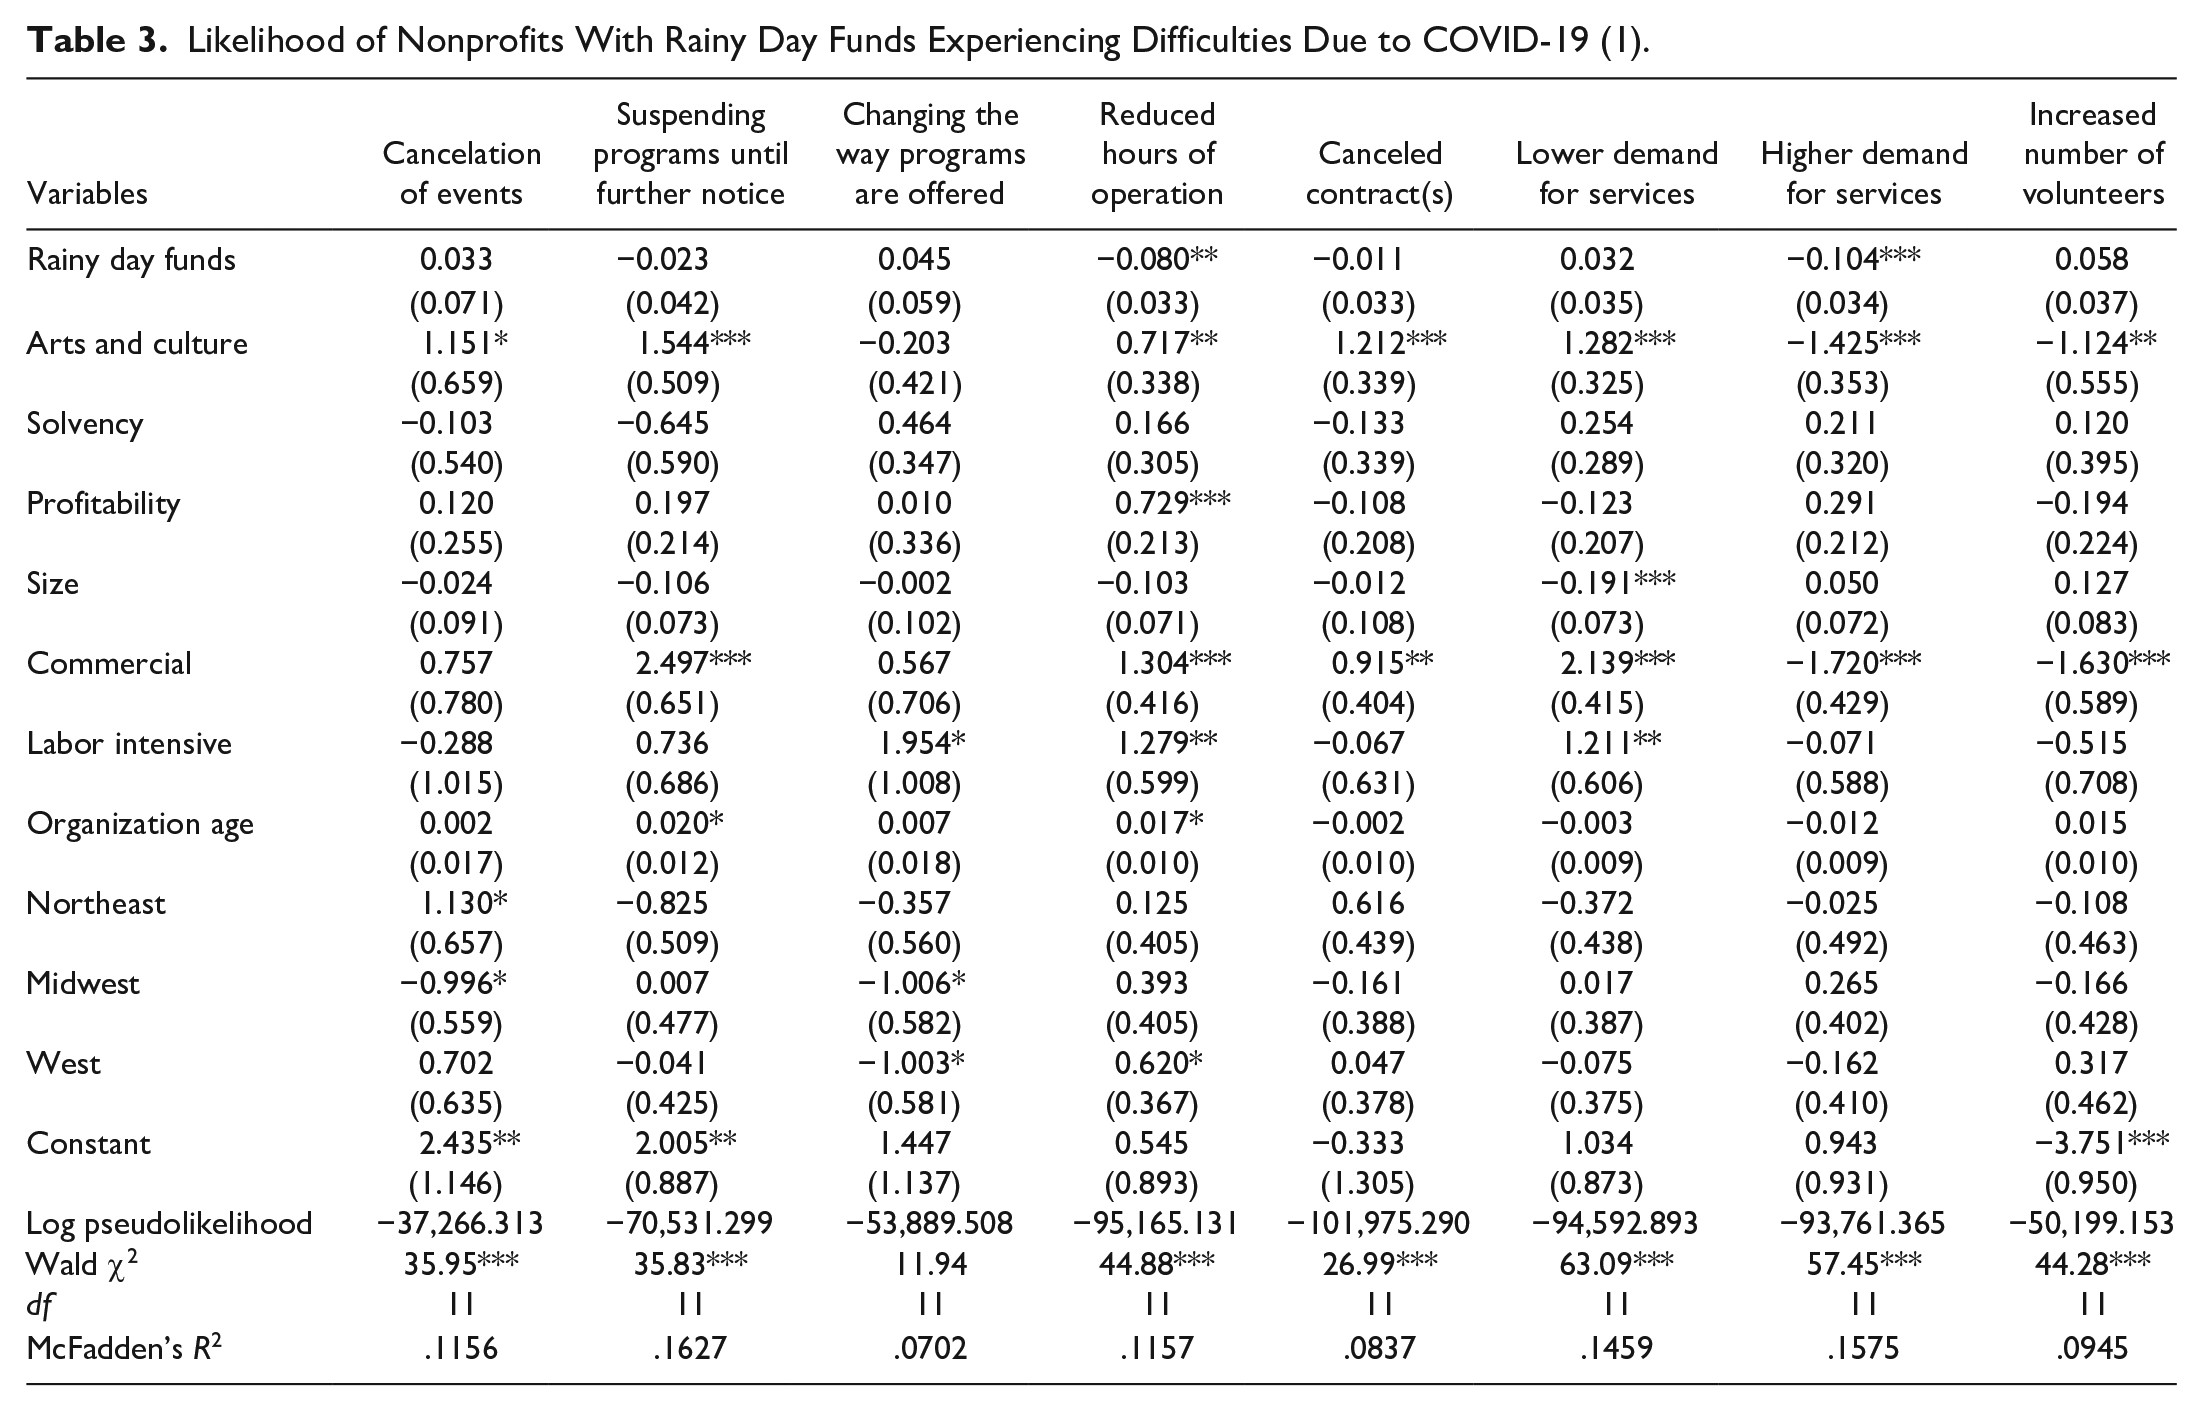
Table 3 estimates the likelihood that nonprofits experienced an impact from COVID-19, and the results provide support for both hypotheses. First, organizations with more reserves were less likely to report being forced to reduce staffing and operating hours. They were also less likely to face difficulties in receiving supplies and services from vendors. Without having put money aside for unforeseen emergencies like COVID-19, nonprofits may not be able to pay vendors and employees. Those with larger reserves were also less likely to report seeing a higher demand for services during the pandemic. It is possible that organizations offering relatively nonessential services such as theaters, sports associations, or youth clubs built up their reserves because they expected less demand during a crisis. Interestingly, we see no relationship between the size of reserves and the number of volunteers, donations, and donors discontinuing funding. It suggests that donors and volunteers are less concerned about their overall financial position. The predicted probabilities in Figure 3 visualize the relationship between the size of reserves and the impact of COVID-19 for several variables, providing further evidence for the first hypothesis.
Likelihood of Nonprofits With Rainy Day Funds Experiencing Difficulties Due to COVID-19 (1).
Likelihood of Nonprofits With Rainy Day Funds Experiencing Difficulties Due to COVID-19 (2).
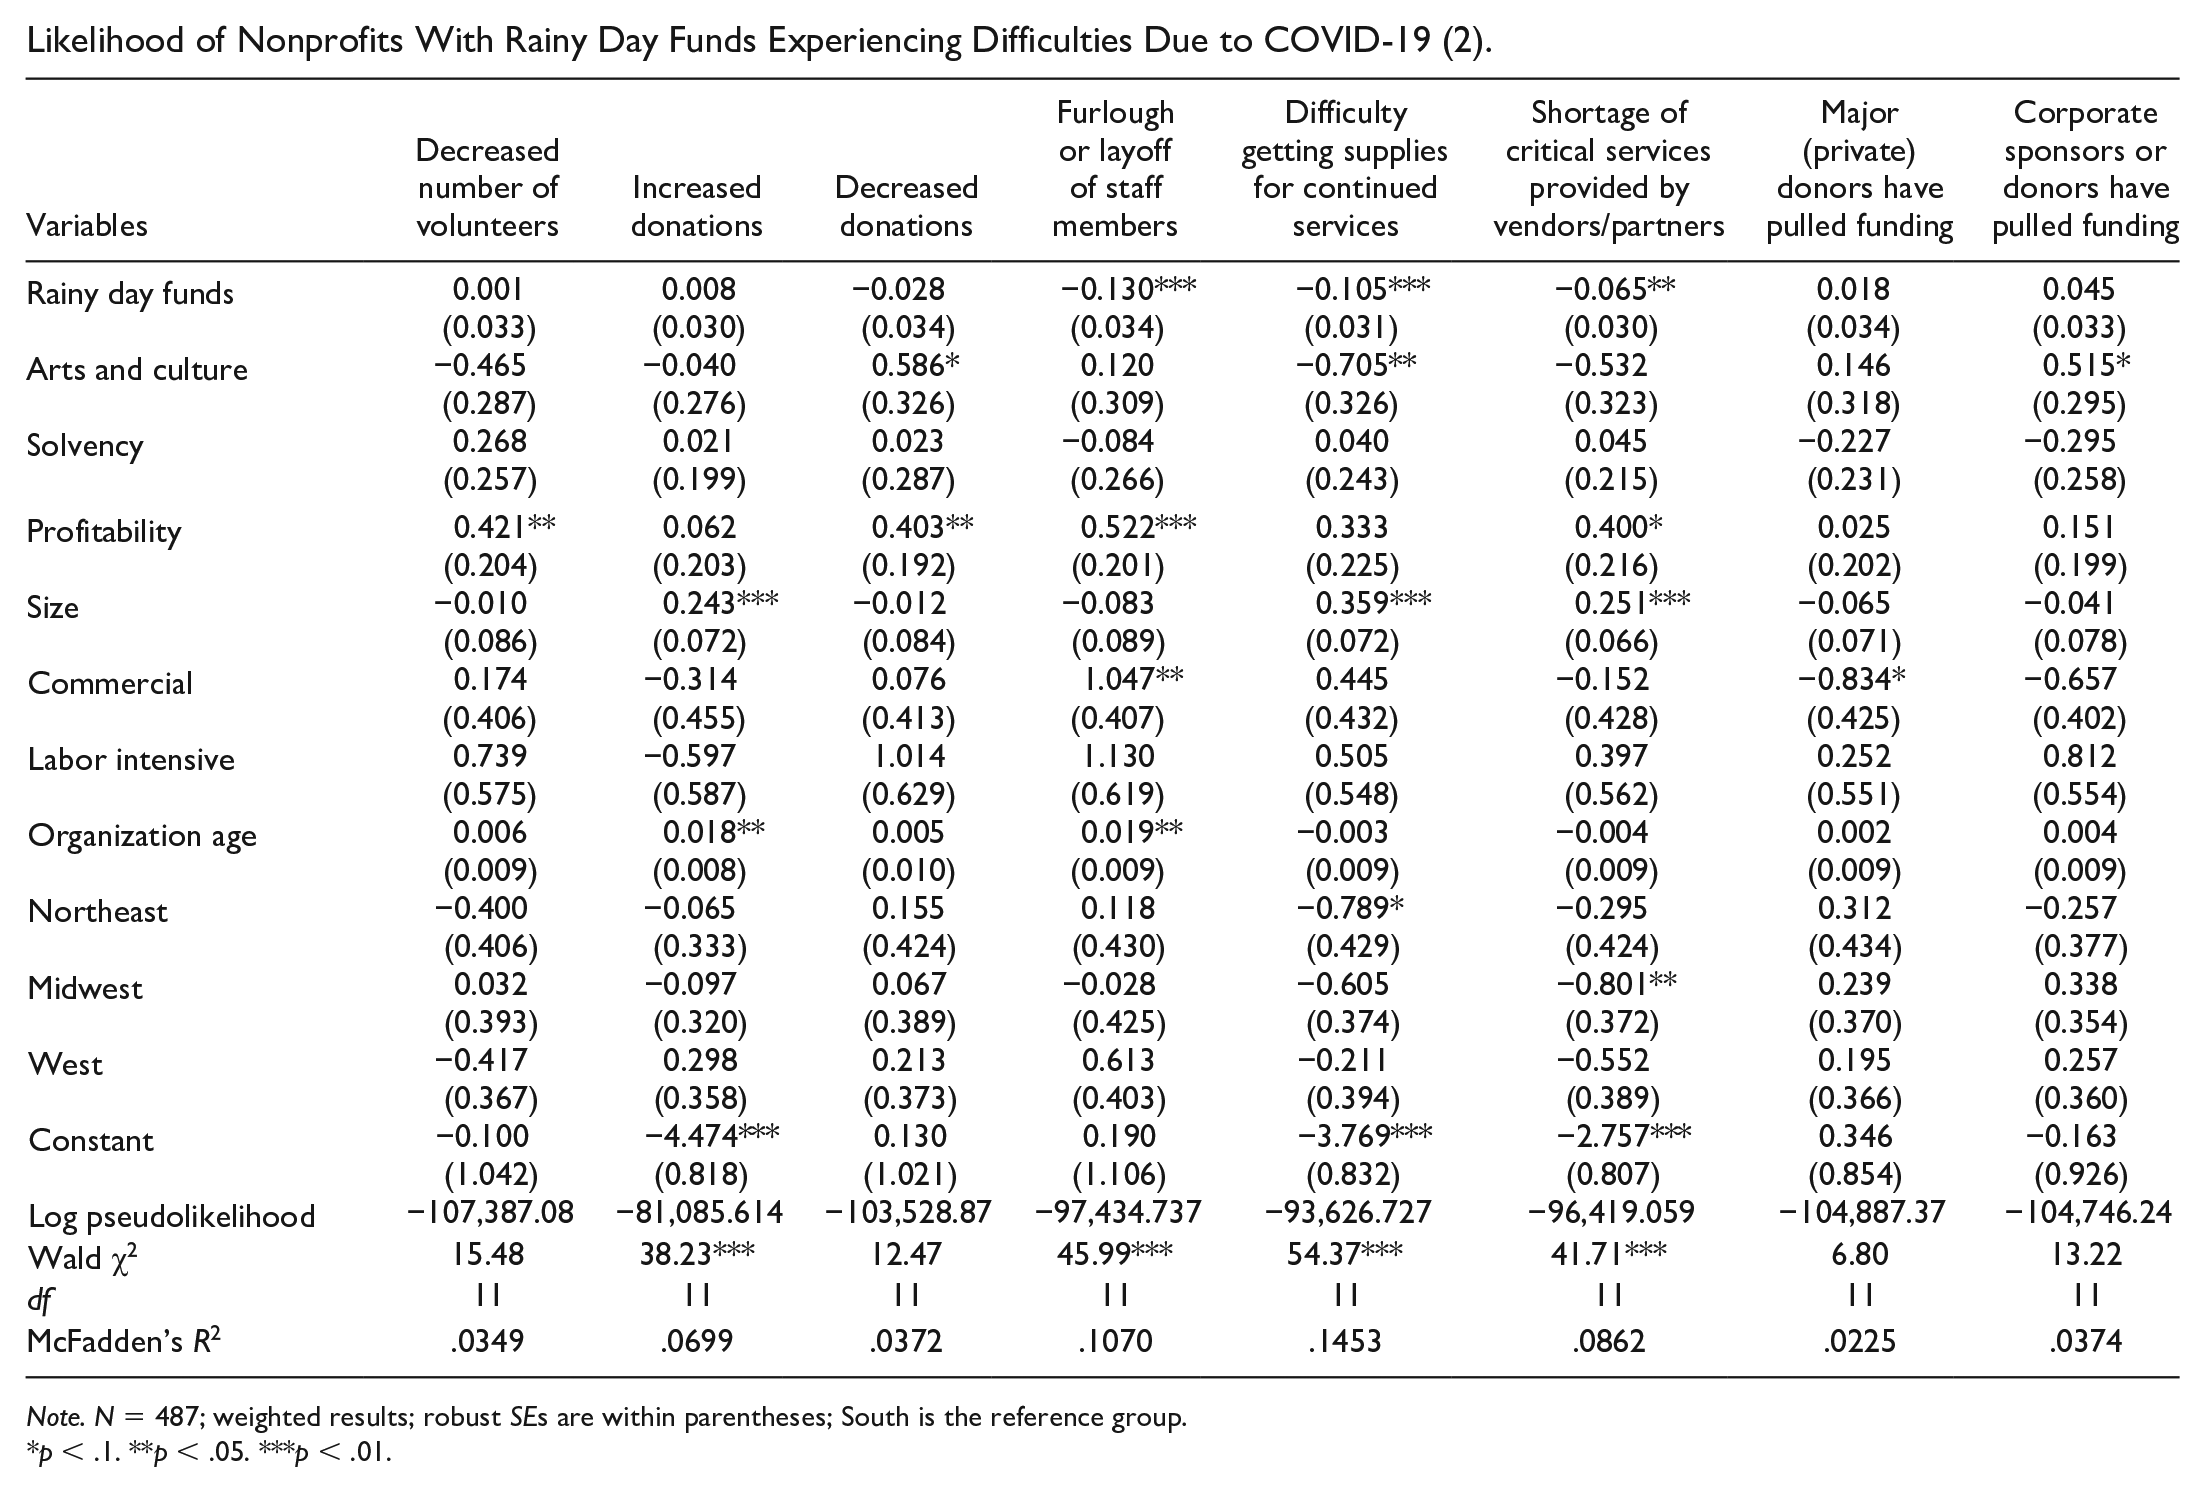
Note. N = 487; weighted results; robust SEs are within parentheses; South is the reference group.
p < .1. **p < .05. ***p < .01.

Predicted probabilities for experiencing the impact of COVID-19.
Second, our data show arts nonprofits were more severely affected by the pandemic and saw a greater retraction of funding and programs. This provides additional evidence in favor of H2, and is consistent with the literature that arts organizations are more vulnerable to economic shocks than others. Arts nonprofits, as compared with human service nonprofits, were more likely to have already or expected to cancel events, suspend programs, reduce hours of operation, cancel contracts, experience lower demand, have decreased donations, and have corporate sponsors or donors pull funding. They were also less likely to experience higher demand and see increased number of volunteers, which are attributable to the social distancing. Because they have to offer fewer programs, it is understandable that arts nonprofits were less likely to have difficulty getting supplies than human service organizations.
To check the robustness of our results, Table 4 compares the estimated results with the rainy-day-funds variable versus the results with the continuing operating capacity variable for key findings pertinent to our two hypotheses. The full regression results for the continuing operating capacity model can be found in Appendix. The results are generally consistent, yet the continuing operating capacity model shows more statistically significant relationships between the COVID-19 impact items and the size of reserves. Consistent with the results of the rainy-day-funds variable, the continuing operating capacity did not make a difference regarding canceling events or changing the way programs were offered, which were likely due to the uncertainty around the stay-at-home orders.
Summary of Results.
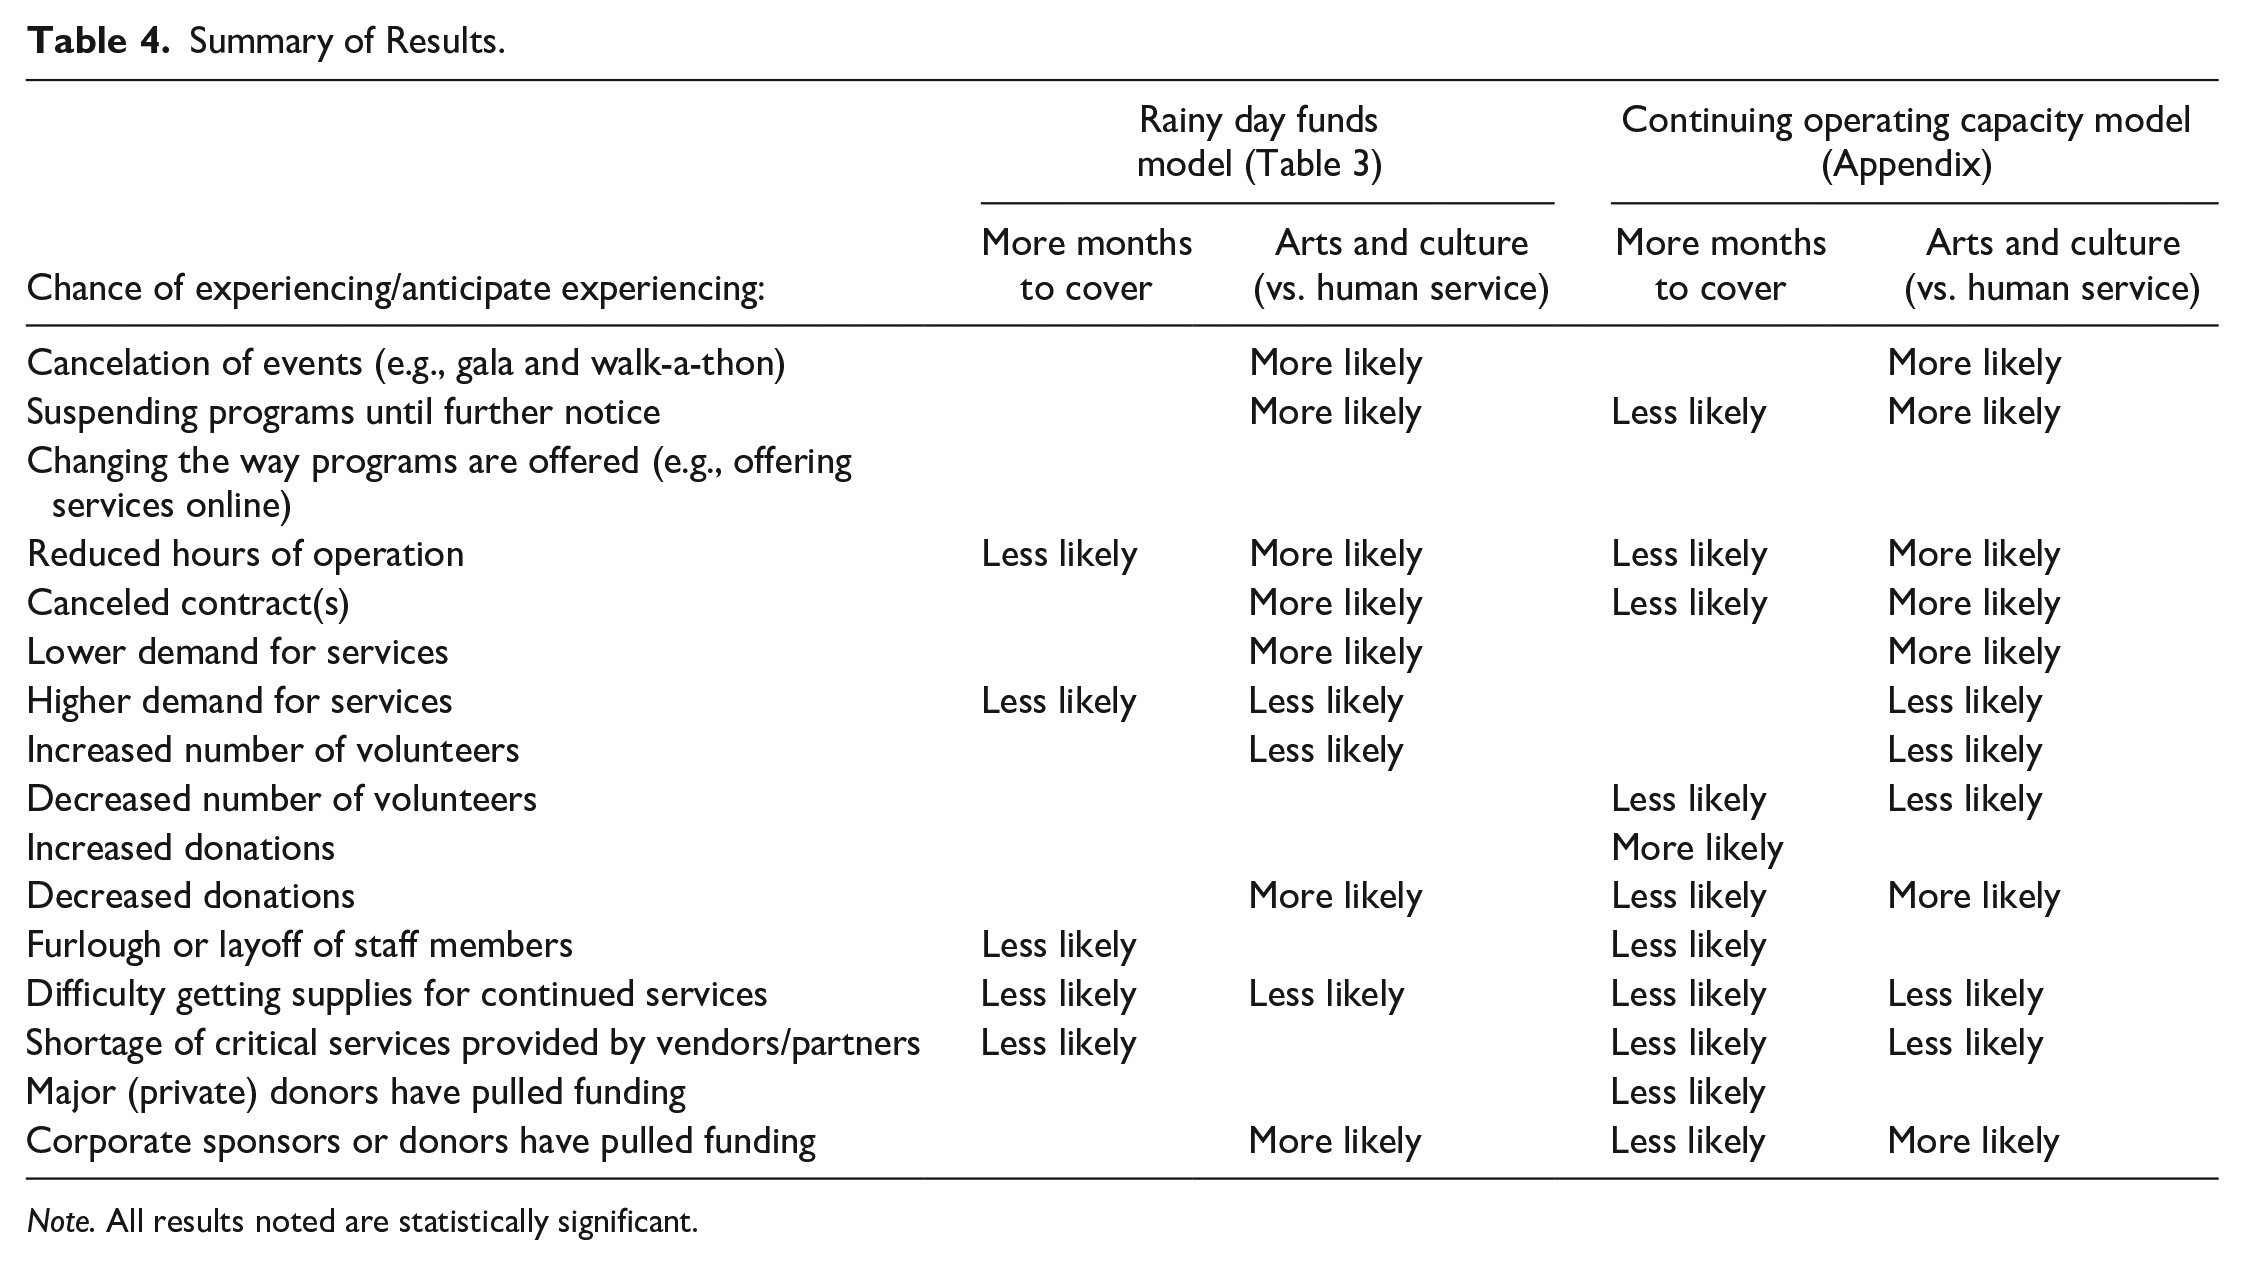
Note. All results noted are statistically significant.
Discussion and Conclusion
To place our findings in context, we note a few limitations. First, in a dynamic economic environment, we were only able to capture a snapshot of executive perspectives during one point in time—slightly over a 2-week period at the beginning of the pandemic. With many nonprofits receiving emergency support from donors, foundations and Coronavirus Aid, Relief, and Economic Security Act (CARES Act) provisions like the Payroll Protection Act, future research should determine whether those with sufficient reserves were more or less likely to take advantage of these opportunities than others. Second, nearly half of the survey participants said that their organizations have at least 6 months of reserves. While it is possible that the way respondents defined reserves was different from the academic definition, it is also possible that those who were more comfortable with their financial situation were more likely to respond to this survey. Future research should compare our current measure of reserves with the measure defined by the Nonprofit Organization Researves Initiative Workgroup (2008) when the 990 data of the current year become available. Finally, despite the use of sampling weights, our results cannot be free from self-selection bias and should not be generalized for all types of human service and arts nonprofits.
Despite these limitations, our study contributes to the symposium issue with empirical evidence suggesting that having reserves helped nonprofits absorb the initial impact of COVID-19. This reinforces the importance of effective financial management to protect organizations from economic shocks. Yet, some nonprofits have been reluctant or unable to develop adequate operating reserves; many nonprofits are already stretched thin (Mirabella, 2013). Furthermore, nonprofits often feel pressure to not appear “too wealthy” (Calabrese, 2013), preferring to appear “lean” (Mitchell, 2017). The findings in this study can help nonprofit funders better understand the importance of reserves and incentivize nonprofits to develop reserves.
Our relatively strong response rate, despite the short survey timeframe during the pandemic, suggests the wish and need for nonprofits to be heard. Our results confirm that most nonprofits were hit hard by COVID-19, and that arts organizations were hit harder than human service organizations. While a likely reason is that arts organizations often rely on gatherings to deliver their programs, our results serve as a reminder that arts nonprofits are generally more vulnerable to economic shocks and need to develop a more significant financial cushion for emergencies.
Footnotes
Appendix

| Variables | Decreased number of volunteers | Increased donations | Decreased donations | Furlough or layoff of staff members | Difficulty getting supplies for continued services | Shortage of critical services provided by vendors/partners | Major (private) donors have pulled funding | Corporate sponsors or donors have pulled funding |
|---|---|---|---|---|---|---|---|---|
| Continuing operation | −0.062* | 0.054* | −0.109*** | −0.193*** | −0.095*** | −0.097*** | −0.138*** | −0.058* |
| (0.036) | (0.031) | (0.036) | (0.035) | (0.036) | (0.035) | (0.035) | (0.032) | |
| Arts and culture | −0.483* | −0.016 | 0.570* | 0.087 | −0.736** | −0.553* | 0.132 | 0.504* |
| (0.283) | (0.279) | (0.335) | (0.335) | (0.343) | (0.329) | (0.326) | (0.304) | |
| Solvency | 0.389 | −0.041 | 0.144 | 0.048 | 0.046 | 0.102 | −0.019 | −0.158 |
| (0.302) | (0.189) | (0.342) | (0.260) | (0.232) | (0.222) | (0.292) | (0.254) | |
| Profitability | 0.400* | 0.082 | 0.358* | 0.529* | 0.251 | 0.382 | −0.077 | 0.124 |
| (0.211) | (0.194) | (0.205) | (0.305) | (0.226) | (0.250) | (0.189) | (0.201) | |
| Size | 0.021 | 0.225*** | 0.030 | −0.053 | 0.337*** | 0.263*** | 0.013 | 0.010 |
| (0.085) | (0.071) | (0.080) | (0.082) | (0.068) | (0.066) | (0.073) | (0.079) | |
| Commercial | 0.070 | −0.249 | −0.085 | 0.803** | 0.309 | −0.300 | −1.160*** | −0.781* |
| (0.391) | (0.455) | (0.409) | (0.398) | (0.406) | (0.407) | (0.396) | (0.407) | |
| Labor intensive | 0.501 | −0.467 | 0.746 | 1.004* | 0.613 | 0.300 | −0.391 | 0.383 |
| (0.570) | (0.591) | (0.634) | (0.599) | (0.544) | (0.571) | (0.560) | (0.539) | |
| Organization age | 0.005 | 0.019** | 0.004 | 0.017* | −0.004 | −0.005 | 0.001 | 0.004 |
| (0.009) | (0.008) | (0.010) | (0.009) | (0.009) | (0.009) | (0.009) | (0.009) | |
| Northeast | −0.306 | −0.141 | 0.322 | 0.422 | −0.691* | −0.170 | 0.562 | −0.154 |
| (0.399) | (0.340) | (0.408) | (0.433) | (0.410) | (0.414) | (0.449) | (0.403) | |
| Midwest | 0.066 | −0.119 | 0.145 | 0.121 | −0.485 | −0.723* | 0.321 | 0.347 |
| (0.400) | (0.321) | (0.382) | (0.422) | (0.368) | (0.374) | (0.395) | (0.362) | |
| West | −0.336 | 0.244 | 0.361 | 0.841** | −0.125 | −0.444 | 0.415 | 0.370 |
| (0.371) | (0.357) | (0.374) | (0.393) | (0.390) | (0.375) | (0.406) | (0.375) | |
| Constant | 0.061 | −4.706*** | 0.463 | 0.797 | −3.246*** | −2.401*** | 0.737 | −0.018 |
| (1.056) | (0.840) | (1.030) | (1.045) | (0.816) | (0.811) | (0.903) | (0.977) | |
| Log pseudolikelihood | −106,311.18 | −80,547.16 | −100,659.58 | −92,382.29 | −94,028.67 | −95,089.10 | −99,791.09 | −104,363.87 |
| Wald χ2 | 17.88* | 40.20*** | 20.44** | 57.31*** | 51.64*** | 41.82*** | 26.64*** | 13.95 |
| df | 11 | 11 | 11 | 11 | 11 | 11 | 11 | 11 |
| McFadden’s R2 | .0466 | .0760 | .0639 | .1533 | .1416 | .0988 | .0700 | .0409 |
Note. N = 487; weighted results; robust SEs are within parentheses; South is the reference group.
p < .1. **p < .05. ***p < .01.
Correction (August 2023):
Authors’ Note
We appreciate Thad Calabrese and NVSQ anonymous reviewers for their valuable comments and suggestions on earlier versions of this article.
Declaration of Conflicting Interests
The author(s) declared no potential conflicts of interest with respect to the research, authorship, and/or publication of this article.
Funding
The author(s) received no financial support for the research, authorship, and/or publication of this article.
Notes
Author Biographies
![]() ), which she developed to provide valuable information for nonprofit practitioners while producing much needed data for researchers in the nonprofit community. Her research addressed issues of nonprofit financial management, the role of 501c3 organizations in civil society, nonprofit arts management, and interorganizational partnerships.
), which she developed to provide valuable information for nonprofit practitioners while producing much needed data for researchers in the nonprofit community. Her research addressed issues of nonprofit financial management, the role of 501c3 organizations in civil society, nonprofit arts management, and interorganizational partnerships.