




Abstract
Organizational survival is a primary current focus, as the unforeseen economic effects of the pandemic ravage the civil sector. Over time, however, we turn to questions of resilience: How can organizations prepare for rare, but devastating, financial shocks? Three months of funds to cover operating expenses are often described as a suitable savings target. However, organizations differ greatly in their revenue volatility, which suggests that “3 months” may severely underestimate the reserves that certain organizations should hold. We measure revenue volatility and calculate reserve fund targets for 25 nonprofit subsectors, showing sharp differences in optimal savings levels ranging up to 1 year of total expenses. We also explore organizational characteristics associated with revenue volatility. We argue for a resilience strategy that goes beyond optimizing the contents of the revenue portfolio. Funders and nonprofit practitioners should consider the broader context of financial resilience that includes correctly sized reserves as a stabilizing force.
Keywords
Introduction
The coronavirus disease 2019 (COVID-19) pandemic struck the nonprofit sector with a speed that could not have been imagined only weeks prior. Operations ceased, depriving organizations of key revenue sources (Streitfeld, 2020). Demand for services in many subsectors escalated sharply. Time will reveal the sector’s resulting restructuring. Early results showed that organizations with financial reserves exhibited more resilience in the wake of the extraordinary financial shock and less disruption to their mission-related programming, compared with other organizations lacking significant savings (Kim & Mason, 2020).
This study closely examines nonprofit savings, and in doing so reveals a need for a broader conceptualization of financial performance in the nonprofit sector. We first explore the definition of operating reserves as it fits within a financial stability framework. The study summarizes a robust literature on nonprofit financial vulnerability, revenue diversification, and portfolio optimization strategies to minimize revenue volatility. The study then turns to the question, “how much reserves should my organization hold?” To produce estimates for optimal reserves, the study utilizes a national dataset of over 30,000 Australian nonprofit organizations. Findings illustrate the wide range of revenue volatility—and the preferred ranges for reserves—depending on size, subsector, and organizational characteristics.
Defining Reserves
Reserves are also referred to as operating reserves, rainy day funds, and budget stabilization funds. Many studies refer specifically to “operating reserves” (Bowman et al., 2007; Calabrese, 2013; Sloan et al., 2016), but “operating reserves” could imply a combination of both cash reserves and funds set aside for financial emergencies. As Sloan, Charles, and Kim (p. 417) explain, however, operating reserves are for “providing a cushion against unexpected events (or) an opportunity to seize a strategic opportunity.” We adhere to this conceptual definition strictly in this article.
In contrast to operating reserves, cash reserves are entirely liquid funds kept on hand to meet short term, anticipated seasonal fluctuations in cash needs, such as months when revenues dip below ongoing expenses. Also in contrast, endowment funds are either true endowments, restricted by donors to fund specific purposes steadily over time, or quasi-endowments designated by the board to provide a steady flow of revenue from the endowment’s earnings over time (Bowman et al., 2007). Finally, capital project funds accumulate savings for purchases of property, buildings, or equipment.
In short, reserves are specifically for fiscal emergencies—sharp and unanticipated revenue shortfalls or expense spikes. The COVID-19 pandemic provided an extreme example of an unanticipated financial shock—that is, a true Black Swan event (Taleb, 2007). Thus, emergency reserves are operationally separate from cash reserves, endowment funds, or capital project funds. To emphasize the use of reserves as a source of funding for rare events, Table 1 uses the label “emergency reserves,” though reserves may also be used to address strategic opportunities.
Types of Nonprofit Reserve Funds and Their Purposes.
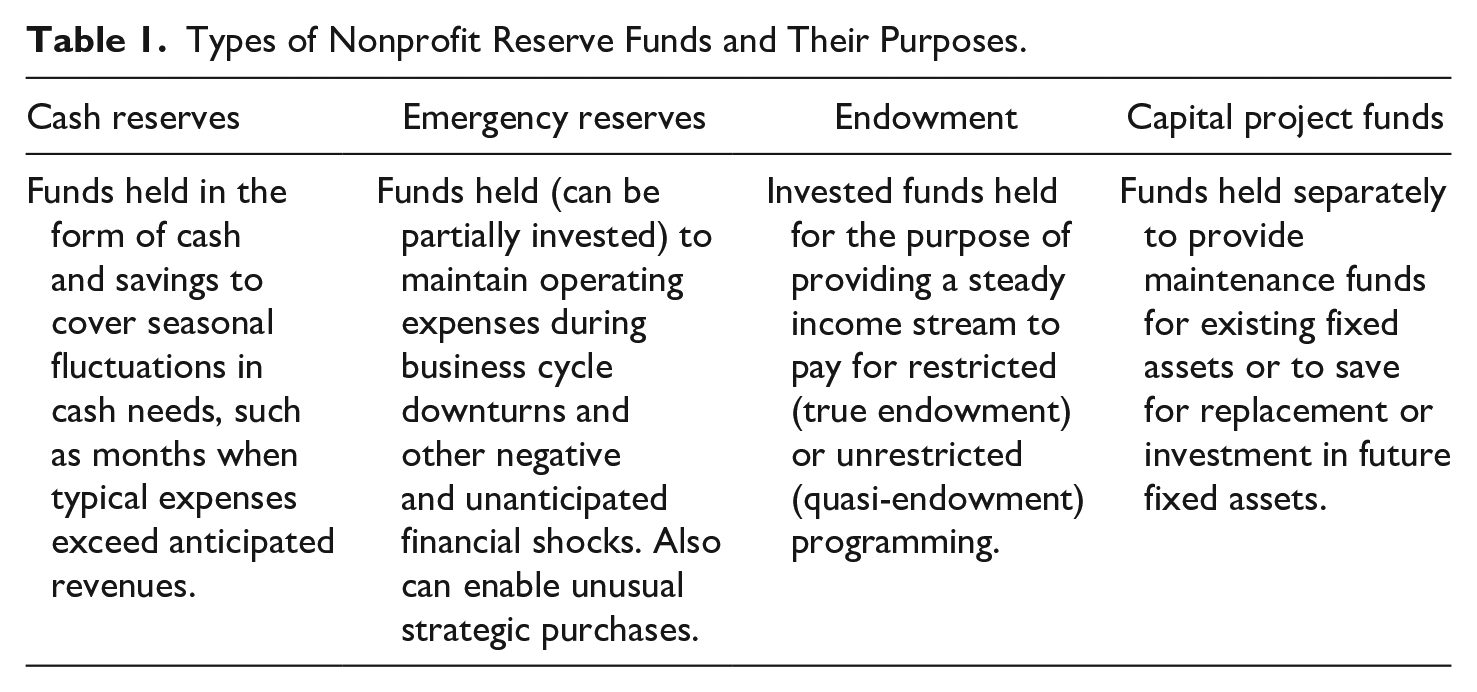
Table 1 provides an idealized delineation of funding structures, belied by the muddled practice of nonprofit financial management. Sloan et al. (2016) showed that many nonprofits had no reserves, some listed a line of credit as “reserves,” and Mitchell and Calabrese (2018) even describe borrowing from pension savings as a source of emergency funding. Taking on debt is another alternative to accumulating reserves but entails drawbacks that may make it a second-best practice. Payments on the debt add to future expenses and access to credit may disappear quickly during a negative financial shock—precisely when the organization may need funds. In addition, an increase in the organization’s debt may make borrowing for future capital purchases more expensive.
Accounting Definitions of Reserves
To approximate reserves, Bowman (2011) and Prentice (2016a) compare net assets (total assets—total liabilities) to annual operating expenses. This can be modified by utilizing only unrestricted and liquid assets. For example, donor-restricted funds, fixed assets, and pension funds should not be considered accessible in a financial downturn. Some fixed assets could be sold in a financial crisis, but nonprofit ownership of fixed assets is not usually speculative, and selling an asset may imply a reduction in programming, such as a museum selling its exhibit space. Ramirez (2011), Ryan and Irvine (2012), and Cortis and Lee (2019) measure reserves in terms of cash only. We favor a definition of “months of reserves” that excludes restricted and fixed net assets and includes only funds that would be accessible in times of financial distress; that is:

Dividing accessible assets by total expenses often yields a fraction, which signifies the portion of the year the organization can “last” using reserves. The fraction is commonly multiplied by 12 months (as we have done) to better illustrate how many months the organization can rely on reserves during a sharp downturn.
Why Might an Organization Hold Reserves?
Following Tuckman and Chang (1991), we also consider the sine qua non of nonprofit financial management to be the maintenance and growth of mission-related programs over time, even while experiencing the occasional financial shock. Given an uncertain future of revenue and flows, the prudent organization saves when times are good and draws upon reserves when times are bad, to smoothen mission-driven programming. Thomas and Trafford (2013); Lin and Wang (2016); Sloan et al. (2015); Kim and Mason (2020); and Tevel et al. (2015) show how accumulated savings enabled well-prepared organizations to maintain critical operations despite fiscal shocks such as the recession of 2008–2009 and the COVID-19 pandemic.
Other benefits of building and utilizing reserves include managerial efficiency, strategic opportunity, and maximizing revenue portfolio performance: First, having reserves allows a tighter managerial focus, as less effort is expended on coping with the latest fiscal shock and correspondingly more effort can be devoted to mission-related programs (Calabrese, 2013). Second, reserves might be employed to take advantage of strategic growth opportunities (Bowman, 2007). Guerrero (2016) showed that organizations with “excess cash” were able to take advantage of growth opportunities when they arose (see also Zietlow, 2010).
Third, an organization with reserves will have a higher credit rating and may be able to borrow at lower rates when taking on debt for capital purchases. Fourth, reserve funds can be at least partially invested, and the earnings are not restricted to certain purposes (Bowman et al., 2007). Fifth, having a robust reserve fund allows an organization to tolerate more overall volatility in its revenue sources. Kingma (1993) discusses the risk-return portfolio trade-off in the nonprofit context, but his analysis focuses on the trade-off when different types of revenue sources are added or subtracted. We argue that when reserves are introduced as an accompanying managerial strategy, the risk-return choices change: instead of choosing non-correlated or low-volatility revenue sources to stabilize total revenue for a given level of expected revenues, having a reserve fund allows the organization to pursue some higher risk, higher return strategies and thus may improve overall financial performance. Booth et al. (2017), for example, show “saver” organizations enjoying a higher return on their assets and better fundraising outcomes than “spender” organizations.
Why Might an Organization Not Hold Reserves?
If an organization has stable and predictable revenues and expenses, the organization has little need to establish a reserve fund for weathering negative financial shocks (Nonprofit Operating Reserves Initiative Workgroup [NORI], 2008). Accumulating the reserve funds in the first place implies an intertemporal sacrifice of current mission-related programming to ensure the stability of future programming (Fremont-Smith, 2004; Irvin, 2007). Other objections to building reserves center on the difficulty of ensuring managerial accountability when there is a ready source of available funding (Fisman & Hubbard, 2003). Sizable endowments may provide the nonprofit manager with more independence from the accountability imperative of the constant struggle to generate revenue. An endowment large enough to provide a significant portion of annual revenue for the nonprofit will be much larger than the typical reserve fund we describe in this study, so excessive independence is not a prominent concern. Nevertheless, any amount of financial assets set aside for years could draw attention from self-serving managers. Policies for stewardship of reserve funds are important for ensuring managers do not use funds for fraudulent purposes.
Other objections to reserves stem from fears that donors, grantmakers, and government contractors will consider the organization too wealthy and will reduce support (Bowman, 2007; Handy & Webb, 2003). This argument assumes that donors and other funders base their funding criteria primarily on the organization’s financial neediness, rather than on the potential outcomes that might be produced. Calabrese (2011) found that organizations holding reserves were generally not penalized by funders, yet funders reduced support when nonprofits had amassed reserves exceeding five times their annual operating budget. In a later study, Calabrese (2013) showed no statistically significant relationship between levels of operating reserves and donations; a result also shown by Ramirez (2011). The opposite situation—too little reserves—may also dissuade potential funders, and the Charity Commission for England and Wales (2018, p. 3) advises, “there could be a refusal to fund on the basis that the charity’s finances are unstable and the charity may be at risk of financial difficulty or insolvency.”
How Much Reserves Should an Organization Hold?
Estimates for recommended reserves have coalesced around the figure of 3 months of operating expenses as a minimum dosage of reserves to hold, yet the genesis of this figure is difficult to ascertain (Barr & Bell, 2011; Blackwood & Pollak, 2009; Bowman, 2011; NORI, 2008; Urban Institute, 2016; Zietlow, 2010). The sources are circumspect in their recommendations, consistently stressing that the 3-month (or more) reserves figure depends on the organization’s circumstances. Neither the Charity Commission for England and Wales (2018) nor the Australian Charities and Not-for-profits Commission [ACNC] (2016), two independent regulators, recommends a benchmark of any kind. The 3-month figure cited in the academic literature could be far afield from the actual needs of an organization. In addition, the “it depends” advice offers little guidance for nonprofit managers and funders, which provides the motivation for this study. The first task of this study, therefore, is framing the “how much reserves” research question in terms of addressing the worst-case financial scenario that a nonprofit may face:
U.S. nonprofits’ lack of reserves (Calabrese, 2013) was a growing concern even before the pandemic, and prominent grant makers are beginning to encourage organizations to build financial resilience (Etzel & Pennington, 2017). From a 2018 survey of 3,369 U.S. nonprofits, the Nonprofit Finance Fund (2018) reports that 50% of nonprofits had “cash on hand” of less than 3 months, and 19% held no more than 1 month. Determining “average” reserves is not easy, however. First, the accounting definition of reserves varies from study to study. Another problem is that the smallest organizations are often eliminated from research studies due to incomplete data. If the size of the organization influences revenue volatility, eliminating small organizations from the data will bias the recommendations for optimal reserves. In addition, subsectors of nonprofits operate in difference resource environments. This suggests a second research question:
Financial Vulnerability and Revenue Portfolio Design
Organizations with robust net assets in comparison to their operating expenses have been shown to have more resilience during economic downturns (Lin & Wang, 2016; Sloan et al., 2015; Tevel et al., 2015; Thomas & Trafford, 2013). Additional measures of financial vulnerability have undergone lengthy scrutiny in the literature, with revenue diversification in the research spotlight since it appeared in Tuckman and Chang’s (1991) model. Decades later, a voluminous literature on nonprofit revenue diversification shows inconclusive results (Carroll & Stater, 2009; Chikoto & Neely, 2013; Lin & Wang, 2016). Hager and Hung (2019) show that the positive effects of revenue diversification are stronger with U.S. data than with non-U.S. data: Adding another revenue source may have a small positive effect on fiscal health. Lu, Lin, and Wang’s (2019) meta-study, however, indicates little to no effect on financial vulnerability from revenue diversification, and a slightly negative effect on financial capacity.
Organizational strategies to stabilize revenue volatility include not only just adding more revenue sources to the mix but also optimizing the covariance between the revenue sources to arrive at the preferred (low, it is hoped) level of risk for the expected revenue return. This is the essence of Modern Portfolio Theory, introduced to the nonprofit context by Kingma (1993). Carroll and Stater (2009), Mayer et al. (2014), Chikoto-Schultz and Neely (2016), Grasse et al. (2015) and Qu (2019) explore different measures of volatility to examine revenue portfolio stability and growth. An important contribution of these studies is in explaining that any decision to expand the revenue portfolio should consider the overall contribution of the new revenue source: Does it increase total revenue in a way that increases or decreases overall risk?
An organization’s optimal revenue strategy and resulting costs of administration might also be strongly influenced by the nature of its programs. Weisbrod (1977), Young (2007), and Wilsker and Young (2010) discuss the link between the nonprofit mission and the mix of revenue gained from donations versus earned income. Although a domestic violence shelter may not charge fees for services, a private school will rely more on earned income in the form of tuition, for example. Extending the implication of Young’s Benefits Theory (2007), the optimal revenue mix—and thus the optimal revenue volatility profile – is more preordained for a nonprofit organization, and less a matter for deliberate portfolio design than Modern Portfolio Theory would posit.
A final consideration regarding optimal revenue mix and volatility stems from Modern Portfolio Theory’s genesis in the for-profit finance literature (Markowitz, 1952). In the for-profit context, a firm is an attractive target for takeover if it accumulates cash (Dickerson et al., 1998). The hostile takeover mechanism does not exist in the nonprofit sector, so accumulating savings to ameliorate the effects of a negative shock can be a key nonprofit stabilization strategy (see Young, 2017)—a strategy less attractive to a for-profit firm. Using investments and cash to protect the organization from negative revenue shocks could change financial performance decision-making in a profound way: A nonprofit could pursue revenue sources that exhibit more volatility, earning the higher returns implied by the more volatile sources. Thus, the nonprofit may choose the revenue sources that provide the highest net returns, despite differences in volatility of the specific revenue sources.
Because we observe distinctly different revenue volatility profiles across nonprofit subsectors, our analysis turns to organizational characteristics linked with differential revenue volatility. Large organizations might acquire revenue sources that are difficult for smaller organizations to obtain (bequests from major donors, government contracts, and so on), and thus may experience less year by year revenue volatility. Older organizations may have less revenue volatility due to having more established community connections, better brand reputation, and organizational trust (Besel et al., 2011; Furneaux & Wymer, 2015). In the reverse causal direction, organizations holding comparatively more net assets may be motivated to do so by their own revenue volatility in the past.
Revenue source choice—and therefore volatility profile—springs from the forces governing the existence of the nonprofit sector itself. Weisbrod (1977) modeled nonprofit organizations as supplementary providers of services when voters’ preferences are heterogenous and the median voter’s choice is considered by some to be insufficient. Thus, donors step up to launch and fund nonprofits to provide more of these services. Salamon (1987) turns a mirror on this theoretical model to explain not only the existence of donors but also why governments fund nonprofits to deliver services. One key reason is “philanthropic insufficiency,” as Salamon (p. 111) illustrates, “The fluctuations that have accompanied the growing complexity of economic life mean that benevolent individuals may find themselves least able to help others when those others are most in need of help, as happened with disastrous results during the Great Depression.” That is, governments supplement donated funding and stabilize nonprofit service provision.
Prior research (Carroll & Stater, 2009; Kingma, 1993; Lu, Shon, & Zhang, 2019; Qu, 2019) shows that revenue from government and earned sources exhibits lower volatility than revenue from donations and investment earnings. One possible reason for this is that governments seek to stabilize spending for services from year to year. In addition, government funding to nonprofits is often provided via contracts that legally bind the government, at least in the short run, to honor its commitment.
Determining why earned revenue is relatively stable is less straightforward, since earned income can be directly affected by the business cycle and payments from third-party payers may arrive with substantial lags. Certain types of nonprofit-specific earned income are in markets with steady market demand, such as health care and education. In contrast, investment income is expected to track closely with the ebb and flow of financial markets. Donations will also track closely with the business cycle, as donors reduce discretionary spending during financial downturns. These considerations motivate our third research question:
Method
We first clarify optimal savings targets, delineated by organizational size and subsector. Optimal size of savings or “reserves” (held, one hopes, in the form of liquid financial assets) depends on the organizations’ revenue fluctuation. Following the calculation of these suggested reserves levels, the study then analyses organizational attributes to determine how they are related to overall revenue volatility.
Data
The dataset of 33,046 organizations is provided by the Australian Charities and Not-for-profits Commission (ACNC), an independent regulator of Australia’s charities (ACNC, 2019). The ACNC was established in 2012 to promote and sustain a vibrant not-for-profit sector, maintain and enhance public trust in charities, and reduce the complexity of prior regulatory structures. Australia’s nonprofit sector, as in many industrialized nations, includes long-standing organizations founded prior to the 20th century. However, the latter half of the 20th century featured the sharpest growth in the number of Australian nonprofits operating in a wide variety of fields.
Nonprofit organizations with total annual revenue over AUD $50,000 are required to file Annual Information Statements, which include information on the organization’s finances and activities in a specified format. The data collected are analogous to the USA-IRS 990 data. Subsectors, based on the main activity described by the organization, are classified according to the International Classification of Non-Profit Organizations (ICNPO) rubric (United Nations, 2003). The Australian Bureau of Statistics (2009) provides the descriptions of the various types of nonprofits falling under each subsector heading. In addition to the main activity, the Annual Information Statement datasets are especially rich in detail regarding additional areas of activity (that is, a housing organization may report additional work in substance abuse counseling), including the intended beneficiaries of the activity. The data include some nonprofits reporting as a group, with multiple reporting organizations summarized in a consolidated report. Table 2 provides the summary statistics for the dataset.
Descriptive Statistics, 2017 Australian Nonprofit Organization Finances and Revenue Volatility.
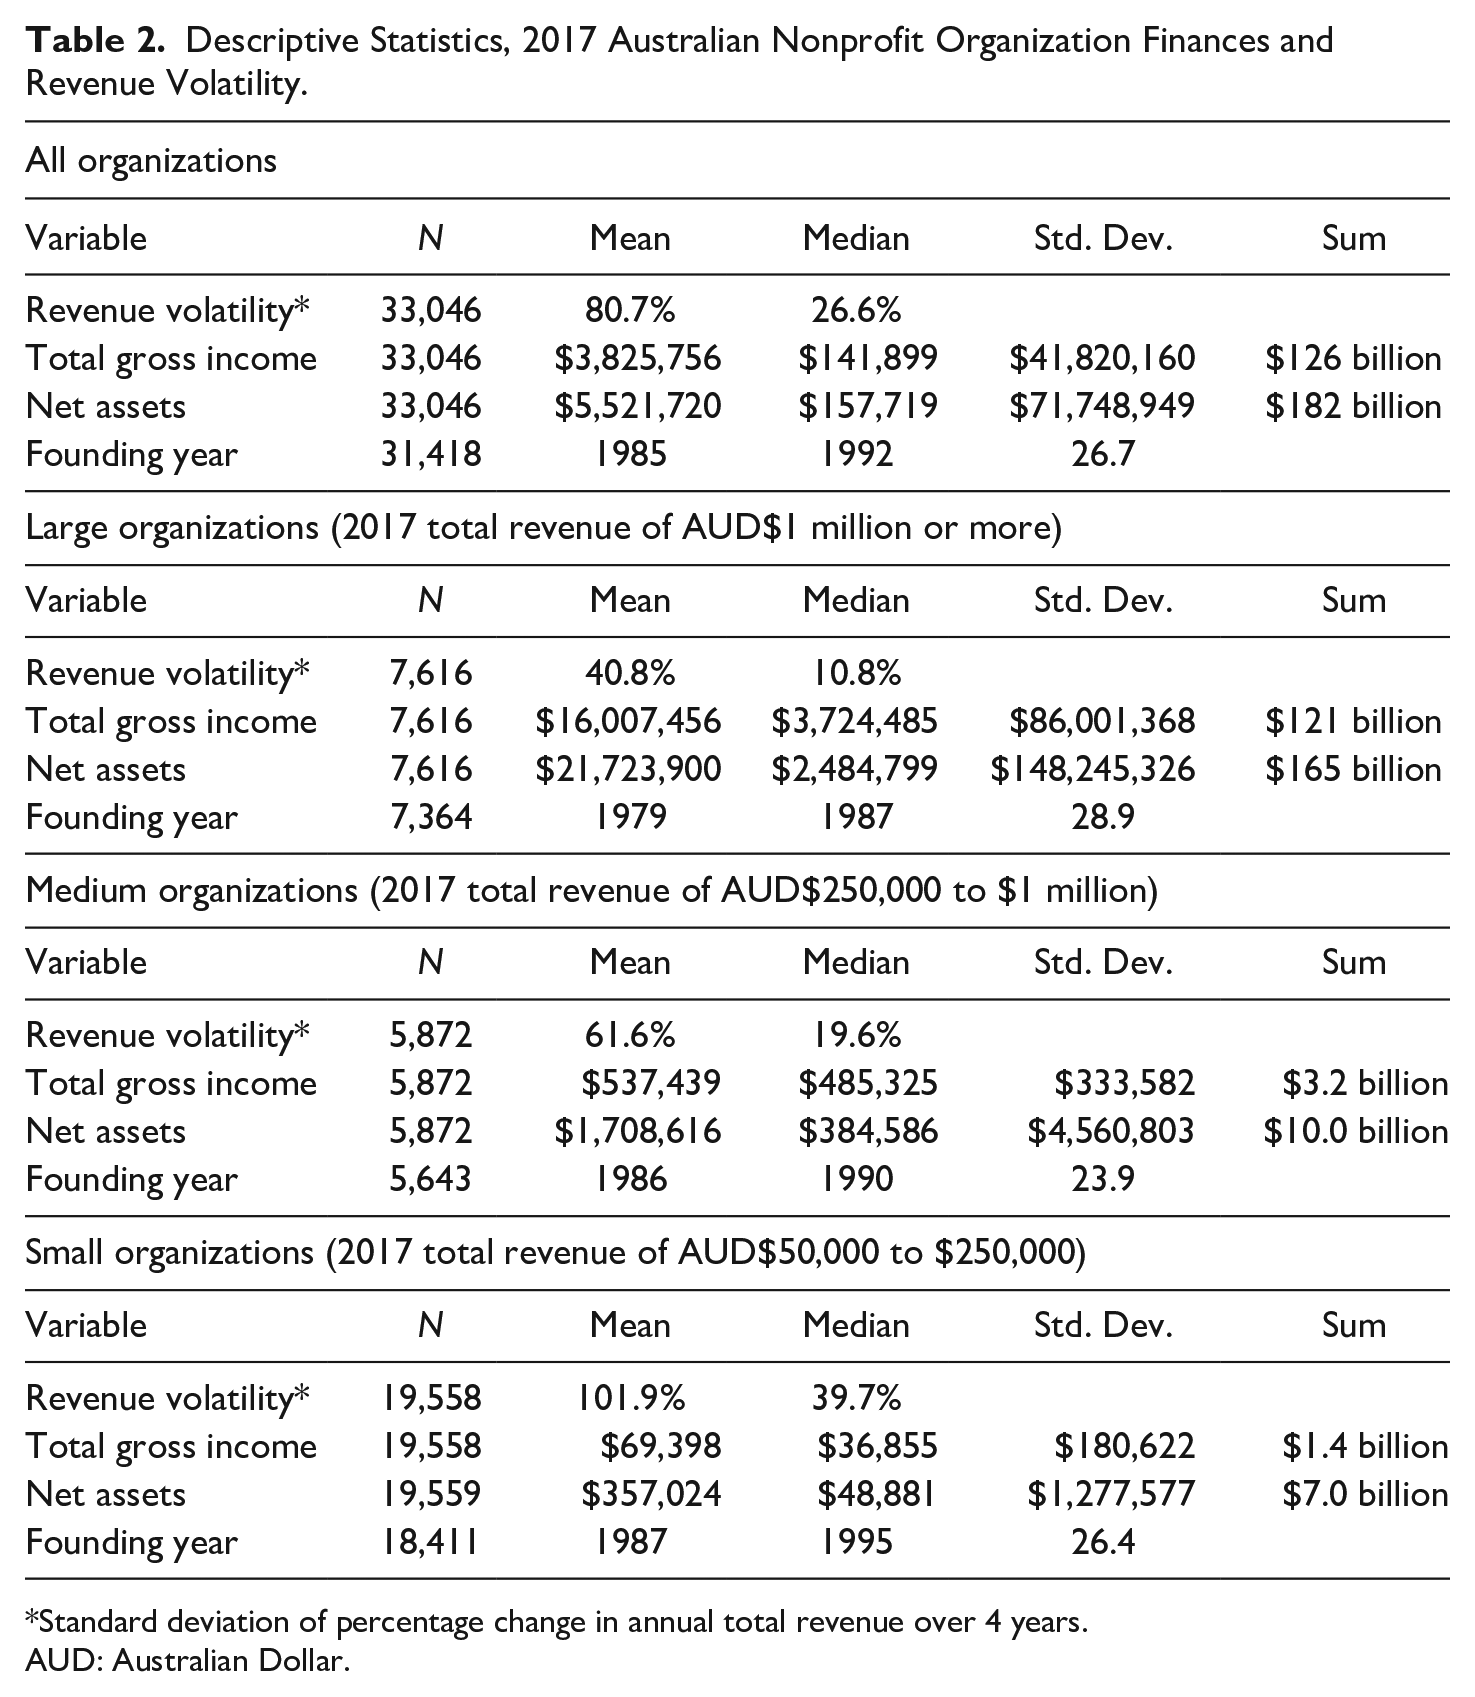
Standard deviation of percentage change in annual total revenue over 4 years.
AUD: Australian Dollar.
The dataset includes organizations with Annual Information Statements for all 4 years under observation in our study from 2014 through 2017 (Annual Information Statement data prior to 2014 lacks financial variables). Note that since the data are limited to a sample of organizations that were in operation all 4 years, our results will underestimate the volatility of the entire population of nonprofits. Our results may also underestimate revenue volatility because the sample period was a time of relative economic calm. Since not all churches are required to report revenue (namely, those classified as basic religious charities), 8,583 religious organizations with zero reported revenue were removed from the data. Some religious organizations remain, as shown in Tables 3–5. Finally, the data were Winsorized to remove the top 1% outlier observations with the most extreme standard deviations. The final dataset was 33,046 organizations spanning all nonprofit sectors in Australia.
Large Organizations’ Reserve Fund Optimal Range Expressed in Months of Operating Expenditures, by Subsector.
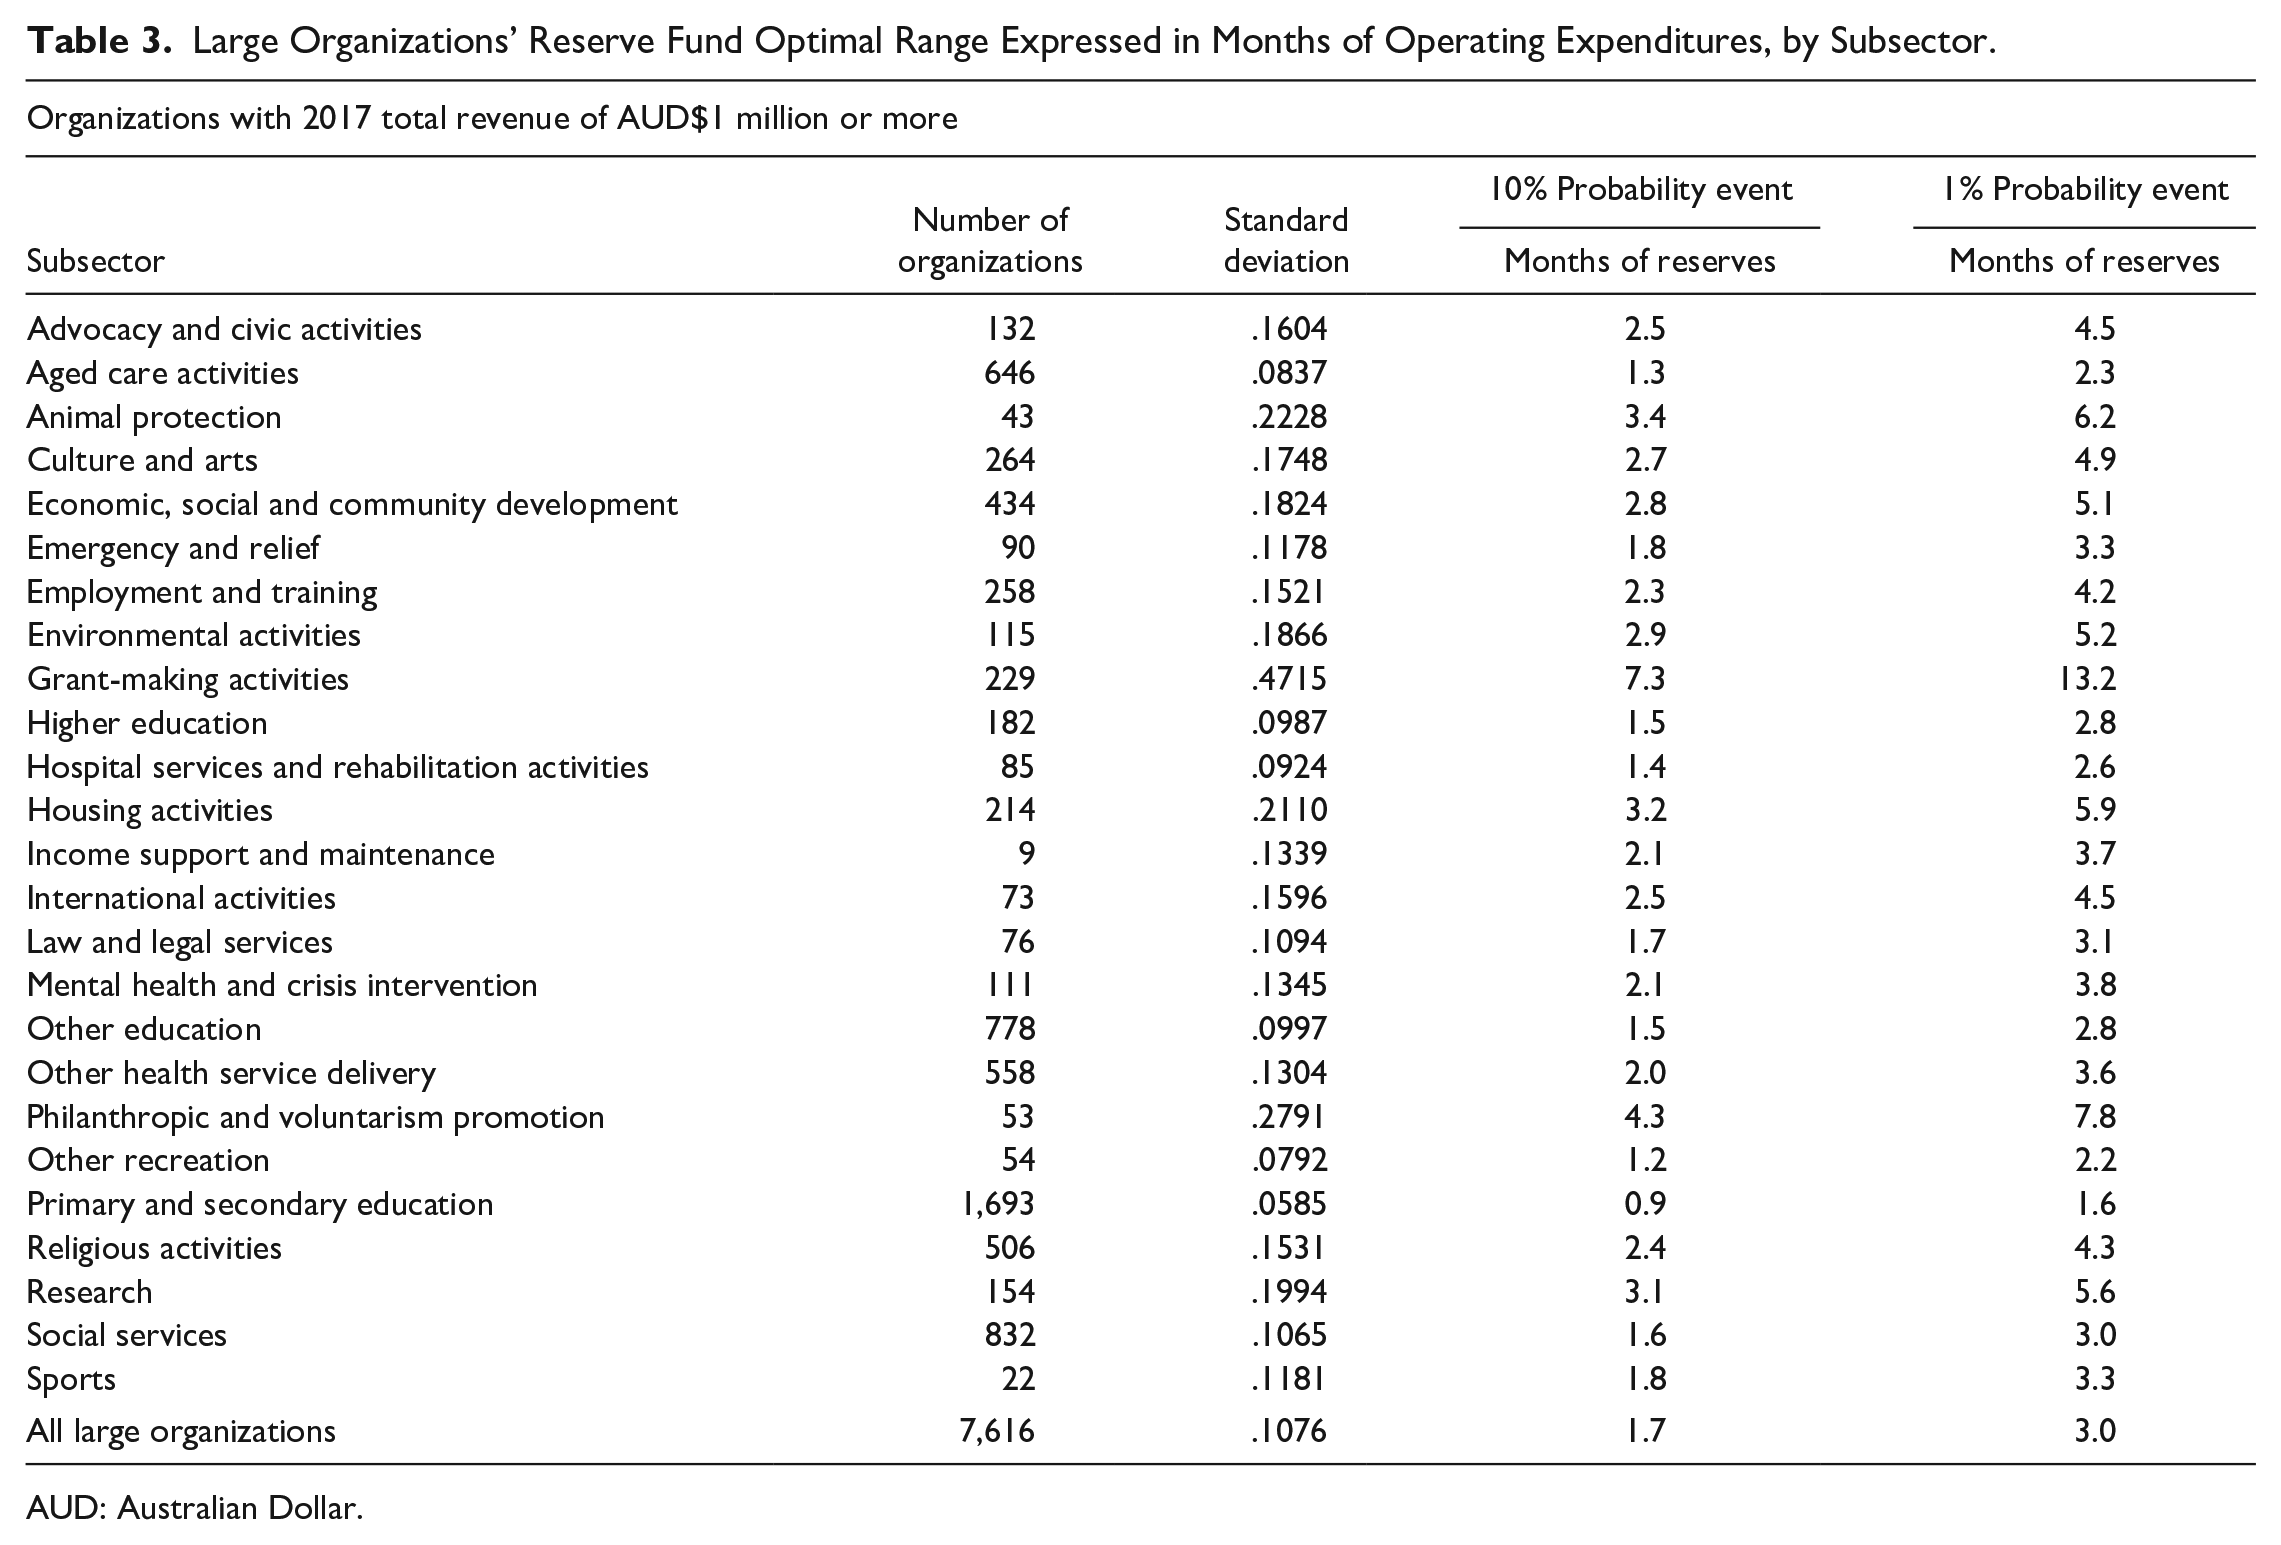
AUD: Australian Dollar.
Medium Organizations’ Reserve Fund Optimal Range Expressed in Months of Operating Expenditures, by Subsector.
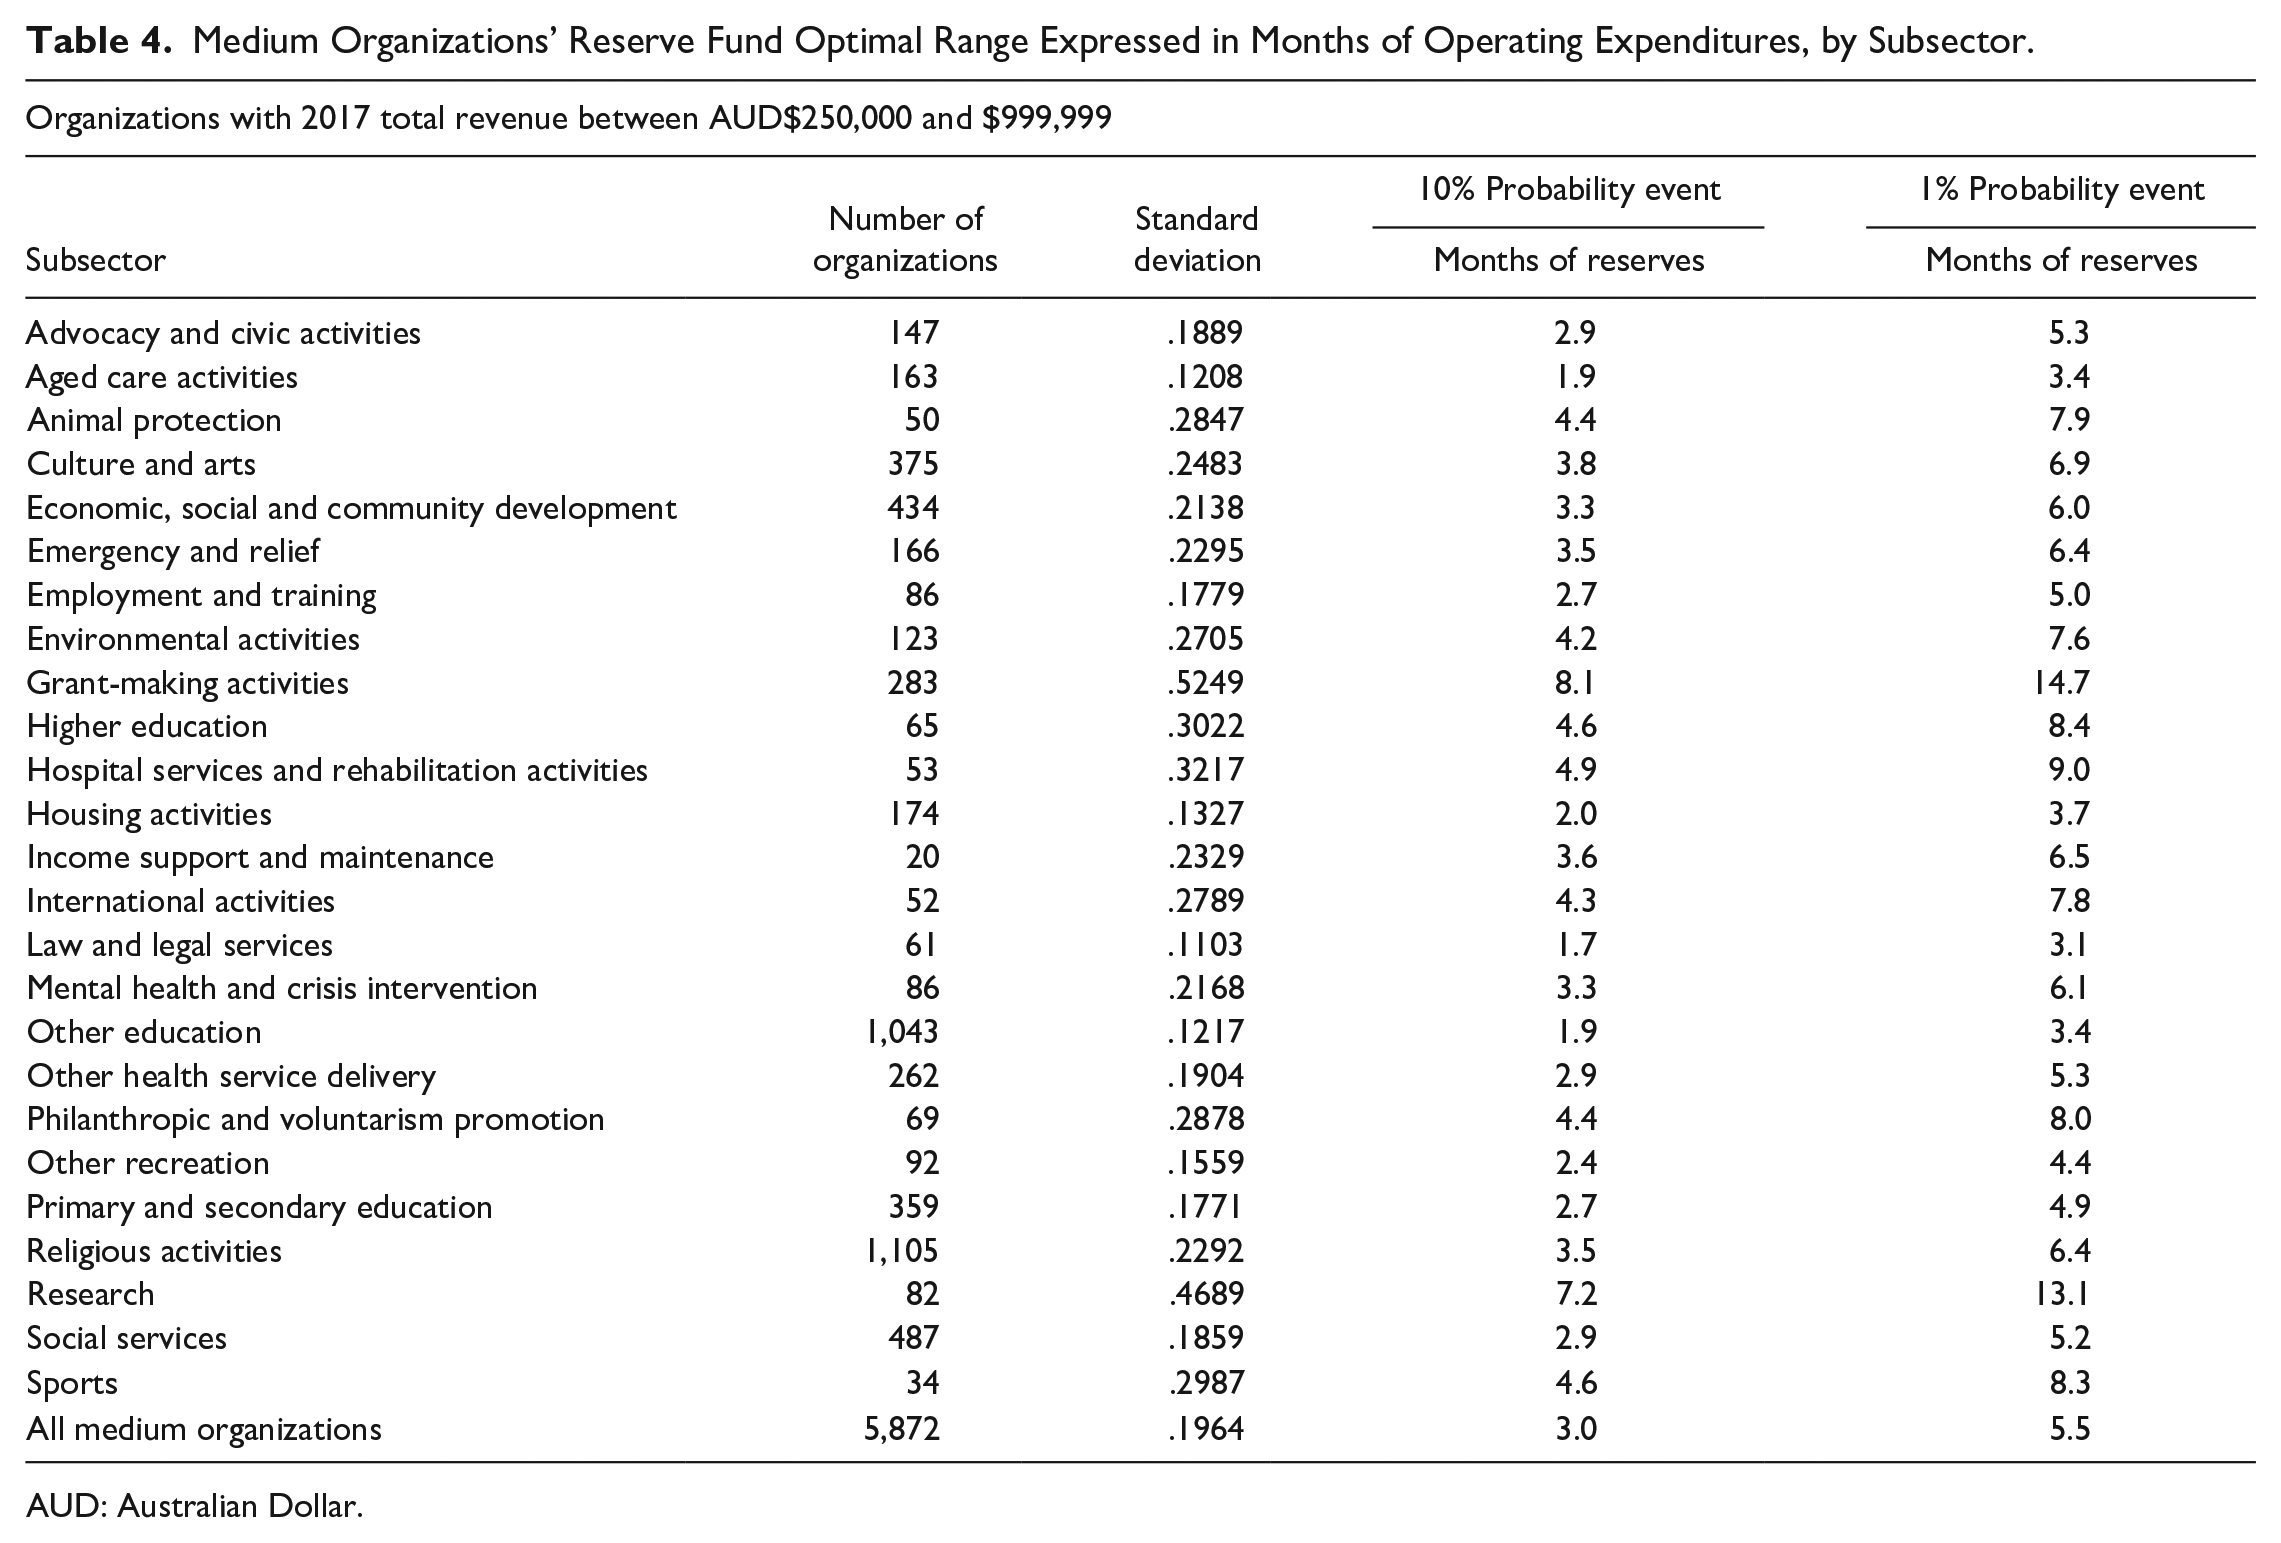
AUD: Australian Dollar.
Small Organizations’ Reserve Fund Optimal Range Expressed in Months of Operating Expenditures, by Subsector.
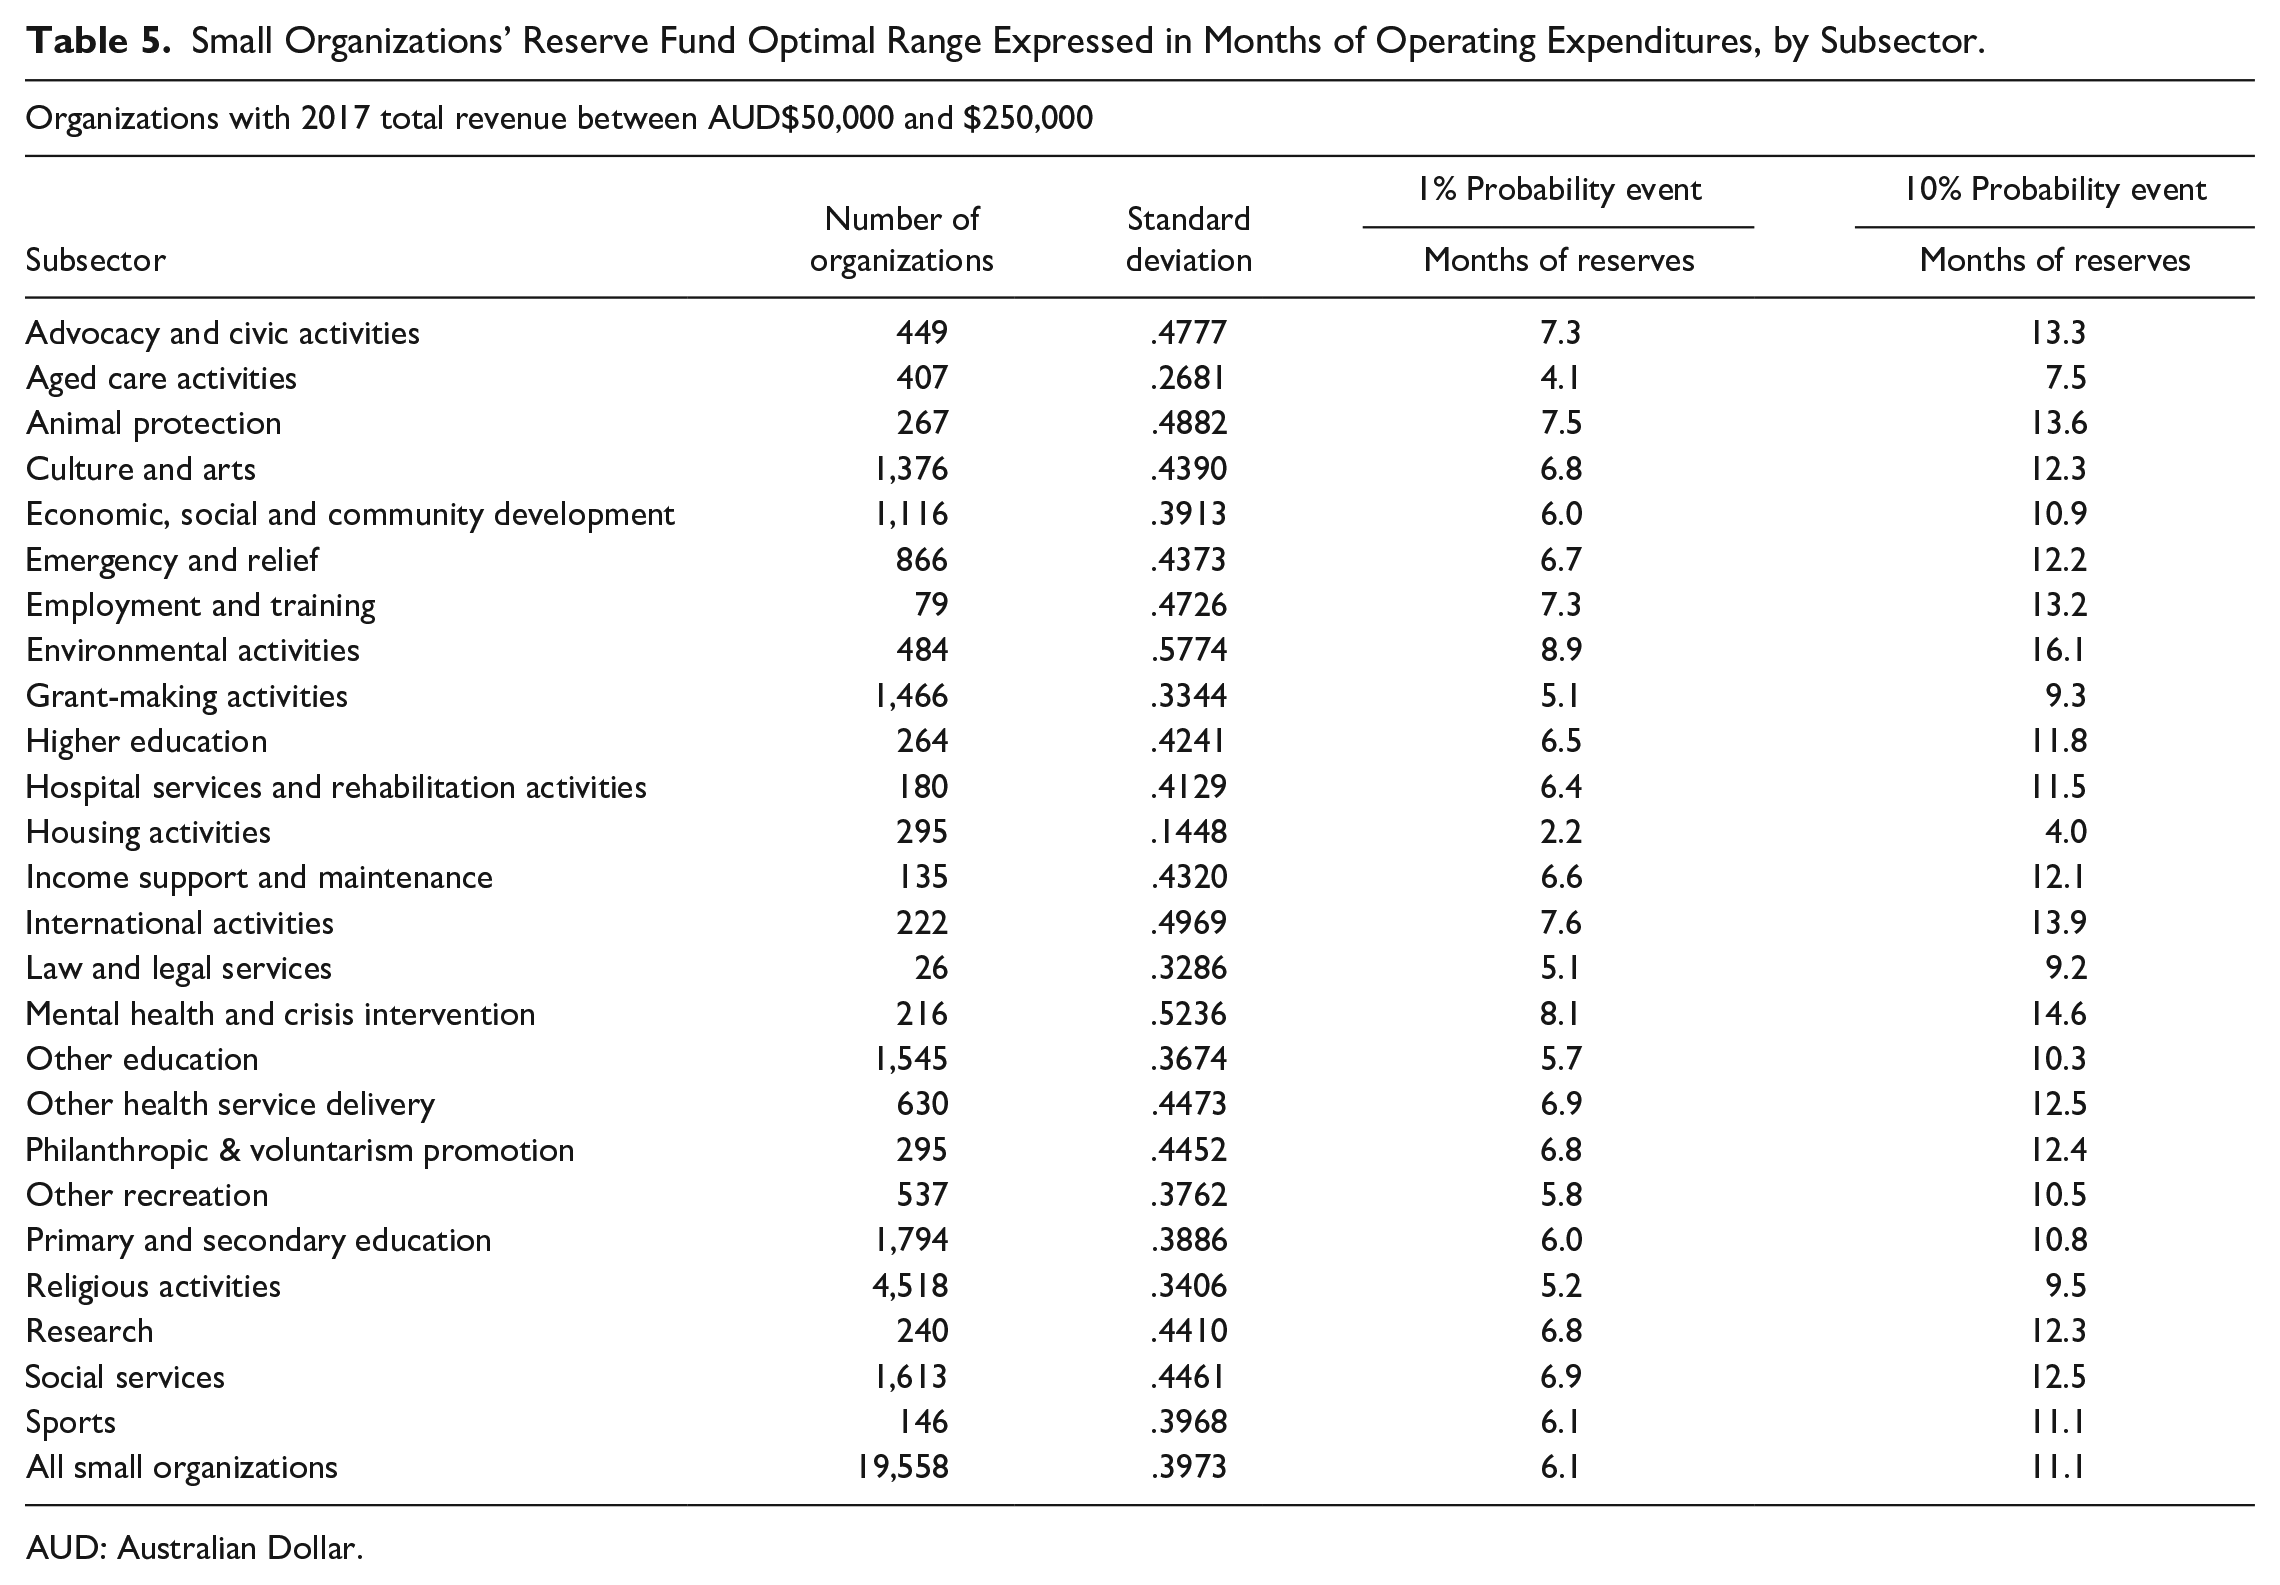
AUD: Australian Dollar.
Measuring Systemic Revenue Volatility
We used 4 years of annual total gross revenue to compute the standard deviation of the percentage change in revenue over time, which is analogous to how one would measure volatility of annual price changes in stocks. To minimize the distortion from extreme outlier observations in our sample, we used the median standard deviation as our volatility measure for each subsector, and we Winsorized the data as described above. Based on the median standard deviation and assuming a normal distribution, we utilized z-values from one-tailed t-tests to calculate the probability of a negative shock occurring with the probability (α) of 10% and 1%. A one-tailed t-test is necessary to examine the problem of preparing for negative financial events only: The probability of positive economic shocks is a topic for a much less dour article.
Multiplying the appropriate one-tailed z-value by the standard deviation provides the menu of targets for reserve funds shown in Tables 3–5 above. For a 10% chance of a negative shock occurring, the z-value is 1.282. For a 1% chance of a negative shock occurring, the z-value is 2.326. Thus, the unfortunate event occurring with the probability of 10% and very rare event occurring with the probability of 1% are reflected in the table as the calculated months of reserves needed to cover the resulting revenue shortfall. We multiplied the standard deviations by 1.282 and 2.346, respectively, and then by 12 months (as described on page 4) to arrive at the expression of recommended “months of reserves.” These event probabilities provide, based on the observed revenue fluctuations in that sector, a straightforward boundary for a target range of optimal reserves to cover operating expenses.
To illustrate, animal protection organizations with revenues above AUD 1 million (Table 3) had a 1% chance of experiencing a 51.7% drop in annual revenue, given the animal protection organizations’ revenue trend over the observed time period. We multiplied this 51.7% revenue decrease by 12 months to express the figure in months (6.2 months). For the largest category of animal protection organizations, therefore, a good half-year of reserves might be enough to withstand the revenue decrease from a catastrophic year.
RQ1 and RQ2: Reserves Recommendations Results
Table 3 shows that overall, larger organizations (over $1 million AUD in revenue, or US$680,000) experience modest revenue volatility, and would need to hold just 3 months of their annual operating expenses in reserves to weather shortfalls from an exceedingly bad year (1% chance of occurring). This corresponds, serendipitously, to the recommendation of “3 months” often noted in the literature. The larger NPOs are often older and have more net assets, so this recommendation of 25% of annual expenses held in reserves may be quite easily met. Researchers have expressed surprise that larger organizations sometimes have low reserves (Blackwood & Pollak, 2009; Cortis & Lee, 2019), but given the stability of their revenue over time, it is appropriate that large nonprofits hold less reserves as a percentage of annual expenditures, compared with small organizations.
Medium organizations (Table 4) with between AUD$250,000 and $999,999 in annual revenue were found to need 3 months’ worth of reserves, on average, to maintain programming in the event of a fiscal shock occurring with a 10% probability. This also corresponds to the 3-month benchmark recommended in the literature. However, medium-sized organizations need 5.5 months of reserves to maintain programming through a severe fiscal shock occurring with a 1% probability.
Small organizations (with less than AUD$250,000 in annual revenue), shown in Table 5, would require reserves of almost 1 year of their annual operating expenses to weather the losses in revenue from an extreme (1% probability) fiscal shock. For small organizations, holding only 3 months of reserves would be inadequate, exposing the small organization to destabilizing fiscal stress and program disruption.
The information in these tables might assist nonprofit leaders in strategizing and building stakeholder and funder support to build reserves funds over time to ensure the sustainability of the organization. However, readers should note that the estimates for preferred ranges of reserves are likely to be low, and nonprofit organizations are encouraged to save beyond our implied “optimal” intervals for these reasons: In our dataset, only organizations that were in existence for all 4 years of study were included, and those 4 years were a relatively stable macroeconomic period. The standard deviations measured in this study are calculated based on an assumption of a normal distribution of revenue changes, whereas the actual distribution is likely to be more dispersed. In addition, the very smallest organizations with total annual revenue below AUD$50,000 were not included in the study.
Substantial differences are apparent across nonprofit subsectors in all three tables. Large grant-making organizations have very volatile revenue streams, due to their primary reliance on investment earnings, which can be negative 1 year and positive the next. The largest grant-makers are likely to be investing at least partially in high-risk, high-return assets. Among the large organizations showing the lowest revenue volatility are private primary and secondary schools and organizations serving the aged. As Table 5 illustrates, smaller organizations—small environmental, mental health and crisis intervention, and international organizations, for example—are particularly vulnerable to large fluctuations in revenue and may be wisely counseled to hold a year of reserves.
RQ3: Measuring Characteristics and Revenue Volatility
To explore why different subsectors have different revenue volatility, we utilized the dataset’s latest (2017) values to undertake a linear regression. Utilizing the 2017 data exclusively for the independent variables makes conceptual sense when examining savings behavior in response to prior revenue volatility summarized by the 4-year median standard deviation. However, the conceptual framing of revenue shares (percent of revenue from donations, government support, earned income, etc.) usually is in the reverse causal direction: The portfolio of revenue shares influences the volatility of the overall portfolio. Thus, for the revenue share variables, the ideal analysis would utilize all 4 years of the data. However, one drawback of the ACNC data is that the ACNC did not delineate revenue sources fully until 2017, so the independent variables here are solely 2017 values. We invite future researchers to examine common nonprofit reserves practices by measuring, for example, reserves held (dependent variable) against subsector covariates and median subsector revenue standard deviation (independent variables).
The Herfindahl index is a measure of how concentrated the revenue mix is, with higher values indicating fewer revenue sources (see Lin & Wang, 2016). Clusters of subsectors (education and research; health and care for the aged; arts, sports and recreation; religious activities; and community services) were identified based on the reported “main activity,” with remaining categories comprising the “other subsectors” serving as an omitted reference variable.
Independent variables in the linear regression (Table 6) included: the founding year of the organization; the Herfindahl index; the log of total gross income; the natural log of total margin (total surplus or deficit/total expenses); natural log of the debt ratio (liabilities/assets); and the natural log of the organization’s reserves (approximated by current net assets/total expenses). This measure of reserves includes assets that may be restricted in use by the donor, and thus is not as conservative as our preferred definition of reserves noted in the introduction. ACNC data does not specify restrictions on assets.
Linear Regression.
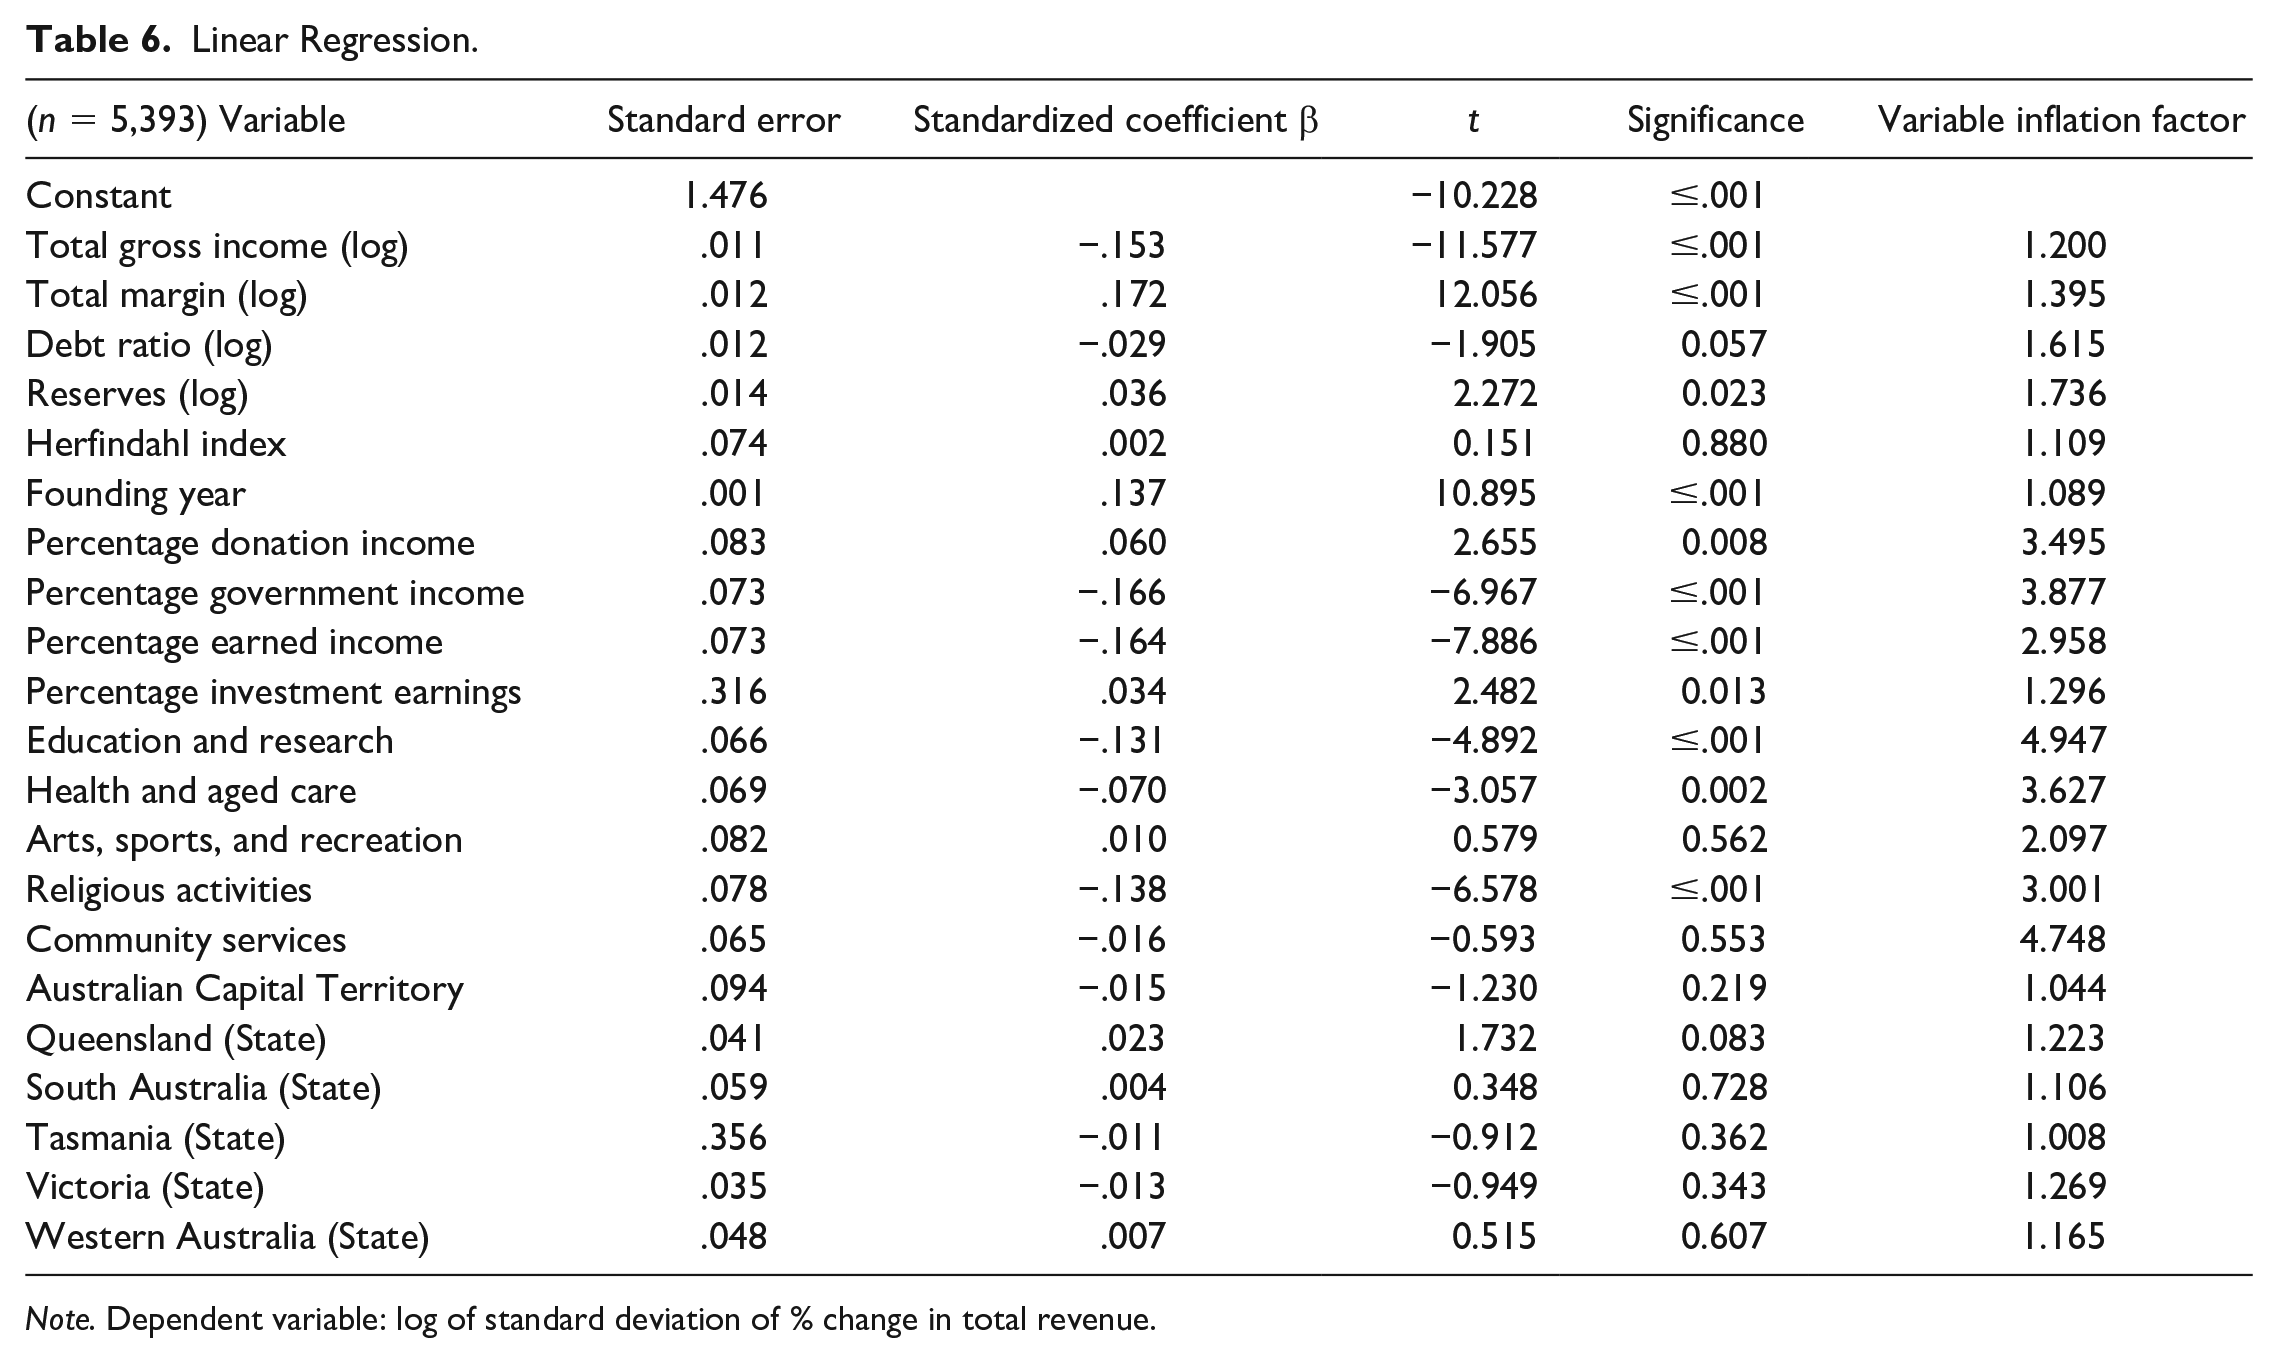
Note. Dependent variable: log of standard deviation of % change in total revenue.
Additional independent variables investigated reliance of income sources, measured by percentages of income from government, earned, donor, and investment income. Geographic location is indicated by binary variables for the Australian states, with New South Wales serving as the omitted reference state. Independent variables also included main activity clusters of organizations (groupings of subsectors). The dependent variable, expressing revenue volatility, is the log of standard deviation of percentage change in total gross revenue over the 4-year span.
Several independent scale variables in the regression analysis required transformation to obtain variables with normal distributions. These included total gross income (log), total margin (log), debt ratio (log), and reserves (log).
We removed the grantmakers from the data due to their almost exclusive reliance on investment earnings for their revenue. In addition, we removed organizations if they were missing a record of their founding year, had zero or negative total gross income. The Mahalanobis distance criteria were calculated for all independent variables in the equation and this identified further observations for removal (if p < .001). Standard deviations for all scale variables were calculated, and observations with a standard deviation ±3 were removed from the data set. Because we calculated the reserves variable using current net assets, smaller organizations, comprising the majority of nonprofits in the ACNC data, were excluded from the data because they are not required to report current assets and liabilities. In the process of removing outliers and organizations lacking key variables, the few observations from the Northern Territory (the state with the least number of charities) were dropped from the data set. The remaining data for the regression analysis includes 5,393 observations. In the final model, Durbin–Watson criterion was 2.013, Variance Inflation Factor values, probability and residual plots, standardized residuals, Cook’s distance (<1), and collinearity diagnostics indicated that regression assumptions had been met. The regression, yielded an R significantly different from zero, F(21, 5371) = 70.564, p < .001 with R2 = .216.
Results shown in Table 6 indicate the following: Larger organizations, as measured by total gross income, had more stable revenue over time, with lower revenue volatility. Organizations with greater reserves showed somewhat higher revenue volatility, suggesting they could be holding more savings to manage their systemic revenue volatility. The diversification of the revenue mix as measured by the Herfindahl index was not statistically significantly linked with revenue volatility. However, different transformations of the Herfindahl index (square root, inverse square root, log, inverse log) had resulted in positive and negative correlations with revenue volatility, although none were significant. The results evident from the Herfindahl index testing echo the conflicting evidence on revenue diversification noted in prior research (see Hager & Hung, 2019; Lu, Lin, & Wang, 2019), to which we would add minor perturbations of the index as a possible cause for variant findings.
Organizations carrying relatively more debt showed somewhat less revenue volatility, although this was just outside the significant range (p=.57). This could imply that organizations are utilizing debt sensibly for overall strategic growth, not for covering operating expenses in turbulent times. The recent profitability of the organization, as measured by the total margin, was positively correlated with higher revenue volatility. Although the total margin is a snapshot measure, this result suggests that highly variable revenue flows, while requiring good fiscal oversight and response, may not be harmful.
The earlier the organization was founded, the less revenue volatility was shown. The data did not show significant regional differences in revenue volatility, as indicated by the lack of statistical significance on most of the state variable coefficients compared with the reference state of New South Wales.
Government funding is shown in the regression analysis to be associated with lower revenue volatility, corroborating prior research noted above. This supports Salamon’s (1987) description of philanthropic insufficiency, especially vis-à-vis the stabilizing effect of income from governments. Similarly, organizations heavily reliant on commercial (earned) income showed more stable revenue flows. Reliance on investment earnings, however, is associated with a higher level of revenue volatility, as is expected, due to the possibility of investment losses. Likewise, reliance on donation income is also associated with higher levels of volatility.
Finally, the regression results in Table 6 show that subsector matters: Even when clustering subsectors together, differences in revenue volatility are evident across missions. Nonprofits engaged in education and research, health, care for the aged, and religious activities exhibited less revenue volatility. Community service organizations and arts, sports, and recreation nonprofits were not statistically significantly different from the reference group of omitted other subsector organizations.
Discussion
The data suggest that the prevailing ballpark figure of 3 months of operating reserves is quite on target, but only for the largest nonprofits. For medium and especially for small organizations, 3 months appears inadequate—and sometimes grossly inadequate – to ensure stability of programming in the event of financial shocks. If anything, our estimates of optimal reserves are low because we measured the volatility of revenue over a period of relative macroeconomic stability in Australia. Nevertheless, by presenting the entire range of 25 organizational subtypes by size categories in Table 3–5, this study provides a comparative reference source for nonprofit manager and funders to consult.
We found that certain subsectors stand out for their relative stability. Australian organizations caring for the aged, for example, have stable income and need only a modest amount of reserves to weather downturns. Other subsectors of nonprofits show more volatility and should hold significantly more in reserves. Differing reliance on various revenue sources by subsector, as well as typical “demographics” (organizational age, size, etc.) within subsectors may be at the heart of the volatility differences. Thus, we examined the following for their effects on volatility: Primary revenue reliance; revenue diversification; age; size; profitability, reliance on debt, geographic region, subsector grouping, and reserves as measured by current net assets/total expenses.
Results from the regression analysis corroborated prior research on revenue volatility in other countries, which suggests that the Australian sourcing of this study is likely to have explanatory value elsewhere. Our data suggest larger organizations, organizations reliant on government or earned revenue, and older organizations are likely to have more stable revenue patterns over time and may operate with somewhat lower reserves without endangering their mission, as noted in Tables 3–5. The results also provide some intriguing financial management tips: Debt burden is linked with somewhat less revenue volatility and may reflect more managerial confidence to borrow funds if the organization’s annual revenue flow is fairly stable. Higher revenue volatility over the 4-year study period was also linked with higher profit margin in the 2017 data. These findings provide a caution regarding financial advice that is often too blunt. Debt might play a role in a stable fiscal structure, and highly variable revenue flows might reward organizations that tolerate and plan for the added risk.
The sharply differing revenue volatility, plus the significance of different types of revenue in either dampening or exacerbating volatility, suggest support for Benefits Theory (Young, 2007). That is, the circumstances of the organization’s mission-related services favor patterns of revenue mix selection that are mission-specific. In addition, the existence of different revenue mix patterns associated with savings behavior casts doubt on nonprofit sector-wide applications of Modern Portfolio Theory (Kingma, 1993; Markowitz, 1952), because if there were an optimal, volatility-minimizing risk of revenue, we would not see consistent differences across types of nonprofits, as all would pursue similar portfolio strategies. Grasse et al. (2015) apply portfolio theory in an appropriately limited sector-specific context.
Financial performance and endurance of the mission are, as we have argued earlier, a function not only of revenue mix, but also savings strategy. Sectors that do not have ready access to stable government funding and earned income rely on other revenue sources that are less stable (Jegers, 1997) and, therefore, exhibit more precautionary savings by holding more assets.
Establishing and Managing Reserves, Harnessing Volatility
The process of building and maintaining a reserves fund requires managerial savvy and a policy to guide reserves accumulation and usage. As Sloan et al. (2015) illustrate, a reserve fund can be built quickly with a generous unrestricted bequest, or slowly and steadily, as the organization adds a line item expense to its budget to ensure that the reserves accumulate. More research is needed to provide additional guidance on optimal managerial strategies for building reserves.
Compared with the difficulty of accumulating reserves, the task of identifying a target reserve size is comparatively straightforward. An organization can note their total gross revenue for the past several years and calculate the percentage change from each year to the next. After calculating the standard deviation of the revenue percentage change figures, the standard deviation can then be multiplied by the z values noted on page 14 to arrive at the percent-of-year figure. This figure corresponds to the percentage drop in revenue the organization would experience in a moderately bad year (10% chance of occurring) or a horrific year (1% chance of occurring). The expected drop in revenue—40% to 90%, for example—guides the organization in its determination of how much reserves to set aside to cover operating expense. In Tables 3–5, we have multiplied this percentage by 12 to express this as “months of reserves” needed to cover the organization’s budget.
Revenue volatility is not always a sign of financial distress, though researchers have stressed revenue stabilization as a dominant strategy in nonprofit financial management. An organization should maximize the net returns from their various revenue streams over time to fund their mission-related services, and in doing so, tolerate some volatility in their annual revenue. When revenue is so uneven that mission-related programming cannot be provided consistently, however, the organization would benefit from a stabilization strategy that includes the right amount of reserves.
Future research should examine actual reserves (or accounting definition proxies for reserves) for each subsector separately, comparing the reserves dosage recommendations here with results found in practice: Which subsectors appear particularly unprepared for the level of revenue volatility they regularly encounter, let alone an outlier event such as the pandemic? Do organizations with seemingly sufficient reserves maintain programming during negative financial shocks?
We encourage researchers to extend their inquiry further than revenue portfolio design. Specifically, incorporate reserves into the nonprofit stabilization calculus, contributing to a more global modeling of nonprofit financial performance (see Chikoto-Schultz & Neely, 2016). Because nonprofits are unique in their ability to hold reserves (unlike in the for-profit context), using reserves to hedge against future financial shocks could profoundly change decisions regarding optimal revenue sources. Ideally, with an adequate reserve fund in place, the managerial decision could change from “which revenue mix is the most stable over time?” to “which revenue mix can maximize programming over time?”
A notable drawback to this study is related to a potential advantage of holding reserves. As Taleb (2007) argues, random events do not follow social science’s favorite bell curve. Providing recommendations for specific levels of reserves based on an assumption of normal distribution of revenue fluctuation implies a finality of preparedness that cannot ever exist. However, holding reserves allows an organization to harness some benefits of risk inherent in volatile revenue sources. As Jegers (1997) notes, “(O)ne must consider the possibility that by employing a riskier revenue mix, the NPO will, on average, have more resources to devote to its organizational mission” (p. 65). That is, the fat tail events that escape the normal distribution might occur on both ends of the distribution, and invested assets, though risky, can reward the organization. Preparing the organization to weather negative economic shocks would allow the organization to experience positive economic shocks as well. Prudence, in this context, can pay risk-based dividends.
We urge researchers to add the Australian data utilized in this study to the mix of comparative sources often found in the literature. Although the ACNC data does not presently delineate restricted from unrestricted assets and does not provide liquidity details on assets for smaller organizations, other features of the data merit researchers’ attention. The results of our analysis showed congruence with the U.K. and U.S. evidence regarding the volatility profile of different revenue sources, providing reassurance that Australian nonprofits are not outliers, but operate similarly to their global counterparts. The ACNC data are readily accessible for public use and provide exceptional detail in the service mix produced by each organization, far beyond the 25 subsectors we have noted in this study.
Finally, we turn to nonprofit organizations themselves to urge board members and nonprofit managers to actively build substantive reserves. We also entreat governments, grantmakers, and individual donors to not just tolerate nonprofit saving, but systematically encourage nonprofit organizations to accumulate reserves to prepare for the horrific financial events of the future.
Footnotes
Declaration of Conflicting Interests
The author(s) declared no potential conflicts of interest with respect to the research, authorship, and/or publication of this article.
Funding
The author(s) disclosed receipt of the following financial support for the research, authorship, and/or publication of this article: This research project was made possible by a visiting fellowship from the Ian Potter Foundation.
