
Abstract
Background:
Chronic Kidney Disease (CKD) is a prevalent health condition that requires personalized treatment planning at each of its five stages. Machine Learning (ML) and Generative AI have shown promise in predicting CKD progression based on patient data. However, existing prediction models have limitations on generalizability, interpretability, and resource requirements.
Objective:
This study aims to develop a clinical support system using ML models to classify CKD stages accurately. The research focuses on feature selection strategies and model performance evaluation to enhance prediction accuracy and guide personalized treatment planning for CKD patients.
Methods:
The study utilizes ML algorithms, including Gradient Boosting, XGBoost, CatBoost, and GAN AML, to categorize CKD stages. Various feature selection techniques such as Recursive Feature Elimination, chi-square test, and SHAP are employed to identify relevant features for improved prediction accuracy. The models are evaluated based on precision, recall, F1-score, accuracy, and AUC-ROC metrics.
Conclusions:
The findings demonstrate the effectiveness of CatBoost and GAN AML in accurately classifying CKD stages, highlighting the importance of expert knowledge in selecting feature selection strategies to enhance ML model performance. Future research directions include validating diverse datasets, integrating with clinical practice, and improving interpretability and explainability in CKD prediction models.
Introduction
Chronic Kidney Disease (CKD) is a disease that causes kidneys to lose function slowly over time. It impacts millions of people globally. The leading causes are high blood pressure, diabetes, and glomerulonephritis, with less common but equally severe being autoimmune illnesses or long-term exposure to particular drugs or toxins. Any living habits and trends contribute to the increase in CKD. The prevalence of the disease is rising worldwide as the population ages and as predisposing conditions increase in occurrence. CKD has several long-lasting implications for the people who suffer from it. Complications such as cardiovascular disease, anaemia, bone diseases, and metabolic problems significantly impact the patient's health and quality of life.1,2 The costs of CKD should also be mentioned in this regard – the high cost of medication, hospitalization, and productivity due to ongoing therapy can present a considerable financial burden for healthcare systems. Public health campaigns that raise awareness promote screening programmes, and drive research are fundamental to fighting CKD.
There are different stages of chronic renal disease, each with varying levels of kidney function and symptoms. Stages 3a and 3b show reduced renal function with symptoms like fluid retention, tiredness, and itching.3,4 Stage 4 is characterized by severe nephron capacity loss, leading to anaemia and bone damage. In Stage 5, kidney function is drastically reduced, often requiring dialysis or a kidney transplant. Bones are crucial in overall health, protecting vital organs and mobility. Fractures can have severe consequences, highlighting the need for accurate classification systems. The proposed Systematized Attention Gate UNet (SAG-UNet) 5 achieved a high accuracy rate in classifying bone fractures compared to existing models. To address data maintenance challenges in healthcare, Deep Federated Collaborative Learning (DFCL) 6 has been suggested for improved diagnoses and analysis rates. In skin disease identification, an IoT-based monitoring system has shown significant improvements in detecting moles, skin tags, and warts, contributing to early diagnosis and treatment. 7
The paper's main contribution is discussed as follows: This study aims to develop a clinical support system for accurately classifying CKD stages using machine learning (ML) models. It emphasizes feature selection strategies and model performance evaluation to improve prediction accuracy and guide personalized treatment planning for CKD patients. The research utilizes several ML algorithms to categorize CKD stages, including Gradient Boosting, XGBoost, CatBoost, and GAN AML. Various feature selection techniques, such as Recursive Feature Elimination (RFE), chi-square test, and SHAP, are employed to identify relevant features for enhanced prediction accuracy. The models are evaluated based on precision, recall, F1-score, accuracy, and AUC-ROC metrics. The findings demonstrate that CatBoost and GAN AML are particularly effective in accurately classifying CKD stages, underscoring the importance of expert knowledge in selecting feature selection strategies to boost ML model performance.
The paper is organized as follows: The Introduction (Section I) provides an overview of CKD; the Literature Review (Section II) provides a summary of relevant research; the Proposed Work (Section III) presents the research findings, the Experimental Results (Section IV) present the findings, and the Conclusion (Section V) summarizes the main points and makes suggestions for future work.
Related works
Deep learning and machine learning models predict end-stage renal disease in CKD patients. 8 Eight models and four correction methods have been used. The deep learning model, with an AUC-ROC of 0.8991, identified positive associations with CKD progression. The research supports using attribution algorithms in deep learning to identify CKD progression's comprehensible characteristics, enhancing clinical management and treatment. An AHDCNN is proposed for early CKD diagnosis using CT images and hidden layers to identify unusual patterns. 9 AI algorithms are investigated for CKD diagnosis, employing extreme gradient boosting (XGBoost) as a baseline model. 10 AI is used to analyze patients’ electronic health information and forecast the probability that they will have severe CKD. 11 The above-average Matthews correlation coefficient (MCC) values of +0.499 in both cases and +0.469 in the third case were reached. Age, estimated glomerular filtration rate (eGFR), creatinine, hypertension, smoking, and diabetes were among the most significant clinical characteristics subsequently identified by a feature ranking analysis.
A new hybrid deep-learning network model (HDLNet) is created to find and identify CKD early on. 12 The Sooty Tern Optimization Algorithm (STOA) can identify CKD and non-CKD renal illnesses. The suggested method surpasses the present state-of-the-art method on every metric—specificality, accuracy, sensitivity, MCC, PPV, FPR, and FNR. A modified Deep Belief Network model is proposed to develop an intelligent renal illness prediction and classification model. 13 Compared to other models, the prediction of the occurrence of CKD yielded a sensitivity level of 87.5% and an accuracy level of 98.5%.
The proposed optimization framework balances test accuracy and explainability to build a CKD prediction model. 14 First, the model employs an extreme gradient boosting classifier based on hypertension, specific gravity, and haemoglobin to diagnose CKD as quickly as possible. Second, the model reached 99.2% and 97.5% accuracy, using 5-fold cross-validation and newly-seen data. Third, the prediction was affected mainly by haemoglobin, secondly by specific gravity, and lastly by hypertension. The study 15 aimed to evaluate machine learning algorithms that require the fewest features to predict CKD. The Gradient Boosting classifier had an accuracy of 99.1% for the researchers who used logistic regression, support vector machine, random forest, and boosting. Hemoglobin was the most significant contributor to detecting CKD, while albumin was the smallest.
A new model was introduced that anticipates chronic renal disease, cardiac heart disease, hypertension, and many other diseases. 16 A PSWN is a patient symptom-weighted network where the health condition correlation appears in similar patients. This method enhances healthcare development and disease identification by smart surveillance and forecasting accurately. It assists healthcare providers in classifying risk beforehand and advancing chronic disease healthcare with increased performance scores.
Machine-learning designs that establish clinical test characteristics to facilitate early and precise CKD diagnosis using specific cores’ pathological groups were discussed in. 17 The random forest classifier was the best among the optimized datasets and had prominent attributes while diagnosing CKD. Thus, this method could facilitate improved CKD screening and treatment. Feature selection methods have been used alongside five unsupervised algorithms: K-Means Clustering, DB-Scan, I-Forest, and Autoencoder. 18 According to the results of a computer-aided design system, clinical data on CKD and non-CKD was classified at a high accuracy of 99%. A method for diagnosing CKD 19 was presented using a dataset from the University of California, Irvine. Models were built using six machine learning methods, and random forest showed the best diagnosis accuracy of 99.75%. After ten simulations, an integrated model combined logistic regression and gradient boosting with a support vector machine, random forest, or Perceptron to create an average accuracy of 99.83%.
An ensemble learning-based technique for detecting CKD on UCI machine-learning datasets was presented. 20 The proposed technique had the highest average of 99.75% accuracy, 99.40% precision, 99.41% recall, 99.61% F-measure, and 99.57% AUC-ROC. The method also increased the average detection rate by 5.64%, 1%, 2.04%, 8.63%, 1.99%, 2.84%, 2.42%, and 4.76% compared to the other approaches. An efficient e-healthcare risk prediction system powered by a heterogeneous network centred around licensed medical practitioners. 21 It enhances monogenic score, density accuracy, execution time, and prediction accuracy by 73.98%.
The COVID-19 pandemic has resulted in millions of deaths globally. A new Deep Neural Network (IDA-DNN) has been developed to detect various diseases in COVID-19 patients.22,23 A hybrid feature selection approach with different Machine Learning algorithms was developed to build a diagnosis system for chronic renal disease.24,25 The evaluation of 14 classifiers revealed that CKD can be detected by the Extra Tress classifier in 98% of cases under a 2% actual negative rate, applying no data leakage. The Extra Tress was tested over the CKD dataset under the hybrid wrapper feature selection approach (Chi2-MI), where the accuracy score increased.
The linear discriminant analysis method from the feature selection method shows the best results with 99.5% accuracy. Machine learning and feature optimization are applied to achieve a high-accuracy automatic CKD detection model using patient clinical variables. LDA is the best feature optimizer, with an overall error rate of 0.5%. Deep learning models are complex and difficult for non-experts to interpret. In healthcare, imbalanced datasets and biases can skew performance, especially in healthcare applications. Some models require excessive computational resources, making them unsuitable for resource-constrained healthcare. Limited collaboration and data sharing can lead to weak models. In severe cases, researchers may work on private datasets, requiring more practicality. Without careful consideration, models may overpredict non-severe CKD threats, missing early intervention and personalized treatment.
Proposed methodology
Machine learning algorithms create a predictive model to estimate CKD stages based on data analysis of vital signs, health behaviour, lab results, and demographic information. The model includes data preprocessing, critical feature engineering, hyperparameter-optimized algorithms training, and performance analysis. Key features include creatinine levels, eGFR, urine protein, and blood pressure. The model is then integrated into a clinical support system for healthcare providers. Over time, the model's accuracy in predicting CKD stages can be improved by monitoring its operation in real-world conditions, receiving feedback, and periodically retraining using the latest data and advances in machine learning and CKD studies. This approach helps identify individuals at risk or in the early stages of CKD.
Data collection
Data, such as demographics, vital signs, laboratory test results, and health behaviour, is required to develop a clinical support system for identifying CKD stages. It is possible to interpret uneven prevalence and outcomes of CKD using a sample including demographic data, and the latter includes self-reporting and medical record definition of gender. Data was collected from the University of California, Irvine, to develop a clinical support system for diagnosing the CKD stage. A clinical support system for identifying the CKD stage must collect different data types. Thus, laboratory result data are collected and include gender data; the data on patient behaviour, including a family history of heart attack and CKD, diabetes, and smoking, are collected. In total, 23 characteristics of 491 patients were collected.
The efficiency and implementation of the clinical support system rely on all data being collected across the spectrum of the population, relying heavily on CKD patients. For this reason, the provided approach is both beneficial and justifiable because it allows the creation of a robust predictive model capable of understanding the difference between the CKD stages across multiple populations with various degrees of CKD severity. Healthcare professionals train the system of CKD support on a large dataset that includes demographics, vital signs, lab, and patient behaviour data. It allows them to make fast and comprehensive decisions about CKD diagnosis and effective treatments. Table 1 shows the data collection process,
Data collection.

Data collection.
The data preprocessing procedure was conducted to create a clinical decision support system for CKD. This was important to ensure that the data were high quality and appropriate for analysis. A better understanding of the preprocessing procedure was facilitated by describing each step. Providing some equations about the procedure was also appropriate because they were applicable. The steps are as follows:
Missing values handling
The absence of the values was frequent in the Electronic Health Record datasets. It was caused by several reasons, such as the mistakes that happened while collecting the data, the malfunction of the equipment, and cases when a particular measurement was not taken. As for the new missing values in EHR data, the K – nearest Neighbours or KNN imputation tended to be applied instead of mean imputation. The KNN imputation was executed by determining the k nearest neighbours to the missing data point within the EHR dataset. It was conducted by applying a distance metric, such as Euclidean distance, to determine the distance between the two points. Finally, the missing value was imputed by calculating the average or weighted average of the corresponding feature values from these nearest neighbours within the EHR framework. It was conducted to replace the missing value.
Dataset D comprises missing values
The number of closest neighbours (k).
Determine the attributes connected to every missing value.
For every absent value xi in dataset D:
Determine the distance between x i and every other data point in the dataset employing the selected distance metric. In most cases, the distance metric is computed as:

The sum of all features is denoted by F.
Using the calculated distances, choose the k closest neighbours.
Take the feature values’ average (or weighted average) from the chosen closest neighbours to determine the imputed value for xi. Typically, this is expressed as:

xij is the feature value of the j-th neighbour to the missing data point xi, where i is the number of features.
Revised dataset D with KNN Imputation filled in for missing values.
In data preprocessing, Z-score normalization, or standardization, is an extensively utilized method in which numerical characteristics are standardized to have a mean of 1 and a standard deviation of 0. This normalization method works wonders when the feature distribution is close to normal or Gaussian. To normalize the data, the mean of the feature is subtracted from each data point, and the resulting value is subsequently divided by the standard deviation. The main principle of Z-score normalization consists of standardizing data, which implies that all features have the same magnitude and can be connected on a standard scale. The exact form for Z-score normalization is as follows:

A Z-score normalization is a robust approach that is not sensitive to outliers. It ensures that the data is centred around and adequately scaled to zero by removing the mean and dividing by the std. As such, it may be appropriately applied in situations with outliers. Using medical datasets to detect a patient's CKD stage with high variability is also relevant. The method is accompanied by a simple arrangement in implementation and interpretation, involving only three simple arithmetic operations. As a result, it is widely used in various kinds of machine learning and analytical algorithms. Specifically, in this task's environment, its application would impose a standard scale on the numerical features for modelling and analysis, ensuring their success. Hence, Z-score normalization is the most appropriate option for normalizing numerical features in the CKD stage detection project because it does not require outliers, is a simple method, and is widely used.
The one-hot encoding method is critical in preprocessing data for the clinical support system I want to create to find the CKD stage. This method is essential in this process as it makes it possible for categorical variables to be converted and machine learning algorithms to understand categorical factors. The one-hot encoding uses binary features to represent each category in the data such that the categorical variables are turned into binary vectors. The approach does not imply any ordinality or put any category above the other, and it automatically ensures that categorical data is correctly represented. The one-hot encoding function takes a category as the input and returns 0 if the observation is part of the category and one if it is not part. The formula that describes one-hot encoding is:

Feature selection using different feature selection methods.

In constructing a clinical support system for detecting CKD stage, the preprocessing of data, including detecting and removing outliers via a Box-Cox transformation, can be significantly enhanced. Statistical methods are first used to determine the presence of outliers after performing the preprocessing measures, including missing value management, numerical feature normalization, and categorical variable encoding. Although it may indicate anomalies, these methods allow data points to be differentiated from the rest of the set. The Box-Cox transformation is also applied to the numerical features containing outliers when detected. The following formula determines the formula with which the data distribution may become more similar to a normal distribution:

Feature selection is essential in developing a clinical support system to detect CKD. This phase aims to narrow down the current dataset and select the most relevant predictors. Proper feature selection can ensure that the model focuses on the most critical variables, which can enhance performance and interpretability. Many feature selection methods are relevant to the current project, such as RFE, chi-square test, information gain, and Shapley Additive explanations (SHAP). These are included in the table below.
No feature selection (NFS)
The technique implies using all the features that are in the dataset without implementing the feature selection process. It uses no algorithm or method to determine the dataset's most significant or relevant information. No characteristic is given priority during training or prediction. The considerable advantage of this method is that all information in the dataset is included. Furthermore, no further preprocessing must be done before feeding the data into the algorithm, and all potentially relevant information is retained. However, this approach may increase computational complexity, reduce interpretability, and decrease prediction accuracy if characteristics that are not necessary or repetitive.
Recursive feature elimination (RFE)
The goal of RFE, in this case, is to extract the best features from a long list of potential predictors, such as history of diabetes, demographic information, and lab results, among others. The identified features are critical for developing CKD stage-specific classification models that would be both effective and interpretable. Implementing this technique involves several crucial steps; each adapted to the specificities of the dataset and the selected classification model. The first step is initialization, when a gradient boosting-based estimator, Gradient Boosting Classifier, XGB Classifier, or CatBoost Classifier, for instance, is selected, along with either the complete feature set or a maximum number. The second step is joining the model fitting with the feature ranking phase, which involves training the gradient boosting model with the existing set of features and assessing the importance of individual features. Lastly, the final classification model is developed, with the subset of features selected through RFE at the second phase of the process, during which metrics, such as feature importance scores, are applied.
Xselected = X Selected_features = all_features Score = 0 Apply the estimator to the specified dataset (X selected) and calculate the feature importance scores. Denote the function importance(Xselected,y) that computes the significance of Xselected features to predict y. Assign a ranking to the features according to their respective significance scores. Eliminate the least significant attribute(s) from the chosen Xselected and modify selected_features appropriately. Eliminate the least significant feature(s) from the chosen Xselected and update selected_features accordingly. If the number of chosen features (k) equals the target number of features to be selected, terminate the process. Else repeat steps 2 and 3 Build a final classification model using the chosen subset of characteristics (X selected) and the target vector (y).
Chi-Square test
The Chi-square test is one of the statistical techniques used in different research, including medical studies. It is an effective tool used to evaluate the relationship between categorical factors. Analyzing the possibility of using the Chi-square test to predict the stage of CKD, it is possible to speak about the importance of considering categorical factors related to demographics, medical history, and laboratory findings as predictors. At least six variables can be mentioned, including gender, age group, the presence or absence of diabetes and hypertension, smoking status, and ingestion of prescribed drugs. The target variable is the stages of CKD, which are identifiable with the help of eGFR and several other findings that are often defined as complaints and symptoms, physical examination information, and additional notes in medical histories. The Chi-square test is used to find the differences observed in the stages of CKD related to each categorical predictor.
The computation of the Chi-square statistic is the process of measuring the discrepancy or the relationship between the observed and expected frequencies of CKD stages available in the sources across all levels of the predictors. A high Chi-square value can be observed when strong relationships are detected between one predictor and the stages of CKD. In such cases, the predictor can help detect the disease, and this value is valuable for the present and future studies. After the Chi-square test is performed, the p-value must be interpreted. This is the probability that the observed relationship is accidental and dependent on the high value of the test. The relationship is unlikely to be accidental if the p-value is low, usually less than 0.05. If the p-value exceeds 0.05, then there is not enough evidence to state that the null hypothesis is rejected and that the two variables, predictors and stages of CKD, are independent.
X: Matrix of Predictor variables. y: Labels vector for CKD stage. α: Level of significance. The chi-square statistic(χ2) p-value (p)
Create a contingency table that compares each categorical predictor variable with the CKD stages. Determine the predicted (E) and observed frequencies (O) for every cell in the contingency table. Apply the following formula to get the Chi-square statistic (χ2):
The degrees of freedom (df) can be calculated as (r−1) × (c−1), where r and c represent the number of columns and rows, respectively, in the contingency table. The p-value (p) can be determined by employing the Chi-square distribution with degrees of freedom (df).
If p-value < α, reject the null hypothesis and conclude a substantial connection between categorical predictor and CKD stages. For p-values ≥ α, the null hypothesis is not rejected, indicating no significant correlation between categorical predictor variables and CKD stages.


Information gain
The machine learning approach called Information Gain, particularly choosing an appropriate subset of features that can help classify different stages of CKD, is targeted at identifying the most relevant subset of features that can accurately classify different patients to their specific stages. In the case of IG, features describe a patient's attributes, and the result of the Information Gain selection is a relevant subset of features used to classify many CKD stages.
Usually, the process of definition of Information Gain features for selecting different CKD stages includes the following stages:


The subset of features selected by high Information Gain features is expected to have the most relevant data for properly predicting CKD stages. By prioritizing the most distinct features, the dimensionality of the dataset will decrease, and the classification models’ efficiency will increase. Thus, selecting information gain features is necessary to improve the accuracy and interpretability of models that detect the CKD stage.
SHAP
SHAP are machine learning methods for explaining predictions made by models. SHAP can explain how each attribute contributed to the model's prediction regarding a patient's CKD stage.
SHAP values are based on cooperative game theory and aim to attribute a contribution score to the features to make predictions. SHAP values show the feature's impact on the model's output. When SHAP is positive, the feature positively impacts the likelihood that a specific stage of CKD will be predicted. At the same time, when it is negative, this is not the case.
SHAP values are determined by utilizing Shapley values derived from cooperative game theory. These values are computed according to the subsequent equation:

N – is the entire set of features.
v(S) - denotes a model's prediction when a particular set of features is considered.
S∪{i} - means including the feature i in this subset.
|S| denotes the cardinality representing the subset S.
|N| is the total number of all features.
Model selection
Several aspects are included at the stage of model selection of the CKD stage detection project. They are the selection of machine learning models and the exploration of machine learning with generative AI. Furthermore, ML models, such as LightGBM, CatBoost, and XGBoost, should be evaluated in terms of performance, interpretability, and scalability. Additionally, the investigations are conducted to fuse machine learning and generative artificial intelligence to develop interpretable models that can efficiently represent complex relationships. The models are described below:
Gradient boosting
For the CKD stage detection project, a gradient boosting framework called LightGBM is beneficial because of its efficiency, scalability, and performance with large datasets. Specifically, by using gradient boosting, LightGBM iteratively minimizes a loss function by fixing errors by sequentially fitting new models to the residuals of the prior ones. Additional advantages include the fact that LightGBM divides data into small pieces, making it ‘lighter’ and using less memory. Thus, the training can be done faster, and memory can be economized, which is critical for CKD data, which has numerous features. Finally, the leaf-wise tree growth strategy allows the generation of more balanced and deeper tree structures, which has a good potential for improving accuracy performance. Notably, the final equation of the model's prediction includes a weighted total from each leaf region to consider the multiplicative effect of each tree's predictions. This expression can be written as

K - tree's leaf count
wk − The weight connected with the leaf k
Rk − The attached region or leaf k
I—Indicator function. I evaluate to 1 if xi belongs to the area Rk; otherwise, it is 0.
The extreme gradient Boosting approach, abbreviated as XGBoost, is an efficient method of finding the stage of CKD. This approach utilizes gradient boosting algorithms to construct a predictive model that accurately categorizes different CKD stages of patients by using their demographic information, vital signs, lab test results, and health behaviour. XGBoost repeatedly includes fragile learners, often decision trees, in an ensemble to improve the model's effectiveness. The method is particularly suitable for medical data, such as CKD data, because of its scalability, efficiency, and capability to model big data with many attributes. Concerning the features, this model allows for using different types of regularization approaches, scalability, handling of missing data, and interpretation of the relevance of features. The equation for XGBoost is expressed as given below:

K - Number of trees in the model,
fk - Prediction of the k-th tree
xi - Feature vector for sample i.
CatBoost, an algorithm based on gradient boosting, attempts to apply techniques learned about managing categorical features, such as using a particular drug or medical history. The formula used by the tree-building algorithm is:

A prospective approach for CKD identification is to implement Generative Adversarial Networks (GANs) with machine learning models to enhance their performance. GAN-Augmented ML is a novel, robust data augmentation approach that utilizes GANs to boost traditional ML models by providing them with a wider and more precise variety of data samples. GANs generate synthetic data that accurately mimic actual patient data's empirical distribution. The synthetic data creation process is unrestricted by a two-player game. Consequently, the discriminator network must distinguish between natural and artificial data, whereas the generator network generates synthetic samples. As a result of applying the GANs to the original dataset, the generator can intelligently replicate the complicated features and behaviours of actual patient data.
Consequently, it generates synthetic data sets that must be suitably combined into the training dataset and accurate patient records. Working with the GANs’ synthetic data, the ML model is trained on a more substantial and diverse set. The more comprehensive dataset improves the ML model's ability to generalize and reliably detect CKD stages across diverse patient populations. Using Generative AI and ML models, the GAN-AML hybrid model strikes a satisfactory balance and outperforms the models in healthcare environments.
Set the initial values of θG and θD for the generator G and discriminator D networks of the GAN model. Define the hyperparameters for the training process, which consist of the learning rate (η), batch size (B), and number of epochs (Nepochs).
Repeat over a predetermined number of epochs (Nepochs):
Extract X samples of actual patient record Xreal from the original dataset. Use the generator network to generate a batch of synthetic data samples Xsynthetic = G(Z), where Z is a noise vector taken from a latent space. Use the binary cross-entropy loss to calculate the discriminator loss LD for both natural and synthetic data samples:
Use the discriminator's feedback to calculate the generator loss LG:
Reset the generator weights with gradient ascending to optimize the discriminator loss:
Utilize the trained generator network to create artificial data samples after training. Construct an augmented training dataset combining authentic patient data with created synthetic (Xaugmented = Xreal ∪ Xsynthetic). Choose the Gradient Boosting Machine Learning model to detect CKD stages. Set up the ML model's hyperparameters. Use the enhanced training dataset to train ML: Split the expanded dataset into training and validation sets. Train the machine learning model using the training data. Optimize the hyperparameters through cross-validation. Assess the model's performance on the validation set.
Train the Discriminator network to discriminate:
Using gradient descent, modify the discriminator weights to minimize the discriminator loss:


Model evaluation
During the model evaluation process, the models trained on the training set are evaluated on the testing set. Hence, appropriate evaluation measures such as F1-score, recall, accuracy, precision, and the area under the ROC curve are calculated. 26 Moreover, the model is tested for its ability to detect CKD cases with high specificity while maintaining a low rate of false positives. All these evaluations and analyses ensure that the model can be applied in reality for CKD stage identification.
Deployment and integration
Deployment and integration, which entails linking the trained model into a clinical support system interface, is another workflow component. The healthcare providers are given an interface with which they can interact easily and input the patient data. The system then offers predictions based on the input data on the probability of CKD and its stage. The method ensures that it provides reasons or justifications for predictions to help healthcare professionals understand and trust the model's recommendations. This method also ensures that the system is user-friendly and assists healthcare providers in understanding and relying on the model's predictions to manage CKD.
Experimental results
The experimental findings reveal the performance of 4 ML models, namely Gradient Boosting, XGBoost, CatBoost, and GAN AML, in categorizing CKD stages. To understand the efficiencies of the models in predicting stages, various feature selection strategies were adopted to explore relevant features for enhanced prediction accuracy. Tables 3, 4, 5, 6, and 7 depict the performance evaluation of all Models for NFS, RFE, Chi-square test, Information Gain, and SHAP. Regarding the model's performance in selecting features, it was notable that CatBoost and GAN AML performed excellently in determining the completeness of all the criteria. In this case, CatBoost achieved 92% precision, GAN AML 98% recall, 95% F1-score, 91% accuracy, and 90% AUC-ROC. According to the research findings, it is essential to note that these models have natural processes that allow them to separate the stages of CKD without utilizing feature selection strategies. This notion is proven by improvements in all models’ performance measures after applying the RFE. In this instance, a method called Gradient Boosting had 93% precision rate, 95% recall rate, 94% F1-score, 90% accuracy rate, and 86% AUC-ROC. As for XGBoost, the performance rates were 94% precision, 93% recall, 94% F1-score, 89% accuracy, and 87% AUC-ROC. CatBoost consistently had good results concerning precision, 92%; recall, 97%; F1-score, 94%; accuracy, 90%; and AUC-ROC, 90%. In the same line, the performance of GAN AML was also remarkable, as evidenced by a precision rate of 96%, recall rate of 97%, F1-score 97%, accuracy rate of 94%, and AUC-ROC 96%. The findings confirm equivalent separation among CKD stages, thus implying that the identified features are more relevant when separating into groups.
Performance evaluation of all Models for NFS.

Performance evaluation of all Models for NFS.
Performance evaluation of all Models for RFE.

Performance evaluation of all Models for the Chi-square Test.

Performance evaluation of all Models for Information Gain.

Performance evaluation of all Models for SHAP.

Using the Chi-square test for feature selection, the performance of the Gradient Boosting and CatBoost models improved significantly. With the deployment of Gradient Boosting, the precision rate was 93%, the recall rate was 97%, the F1-score was 95%, the accuracy rate was 91%, and the AUC-ROC value was 85%. The performance metrics of CatBoost were as follows: precision was 93%, recall was 98%, F1-score was 96%, the accuracy rate was 92%, and the AUC-ROC was 88%. The improvements demonstrated the effectiveness of the chosen features in acquiring relevant data for categorization tasks. However, the results of the Information Gain selection of features differed across the models. The following were the precision, recall, F1-score, accuracy, and AUC-ROC of Gradient Boosting: 91%, 93%, 92%, 86%, and 87%. On the other hand, XGBoost had a precision rate of 91%, a recall rate of 98%, an F1-score of 94%, an accuracy of 90%, and an AUC-ROC of 83%. Regarding CatBoost, the precision rate was 92%, the recall rate was 93%, the F1-score was 93%, the accuracy rate was 87%, and the AUC-ROC rate was 92%. Moreover, GAN AML had a precision rate of 95%, a recall rate of 98%, an F1-score of 96%, an accuracy rate of 93%, and an AUC-ROC rate of 95%. In conclusion, the results from this research suggest that for specific models, the chosen features may not represent the dataset's ability to discriminate across various factors.

Comparison of evaluation metrics with NFS.
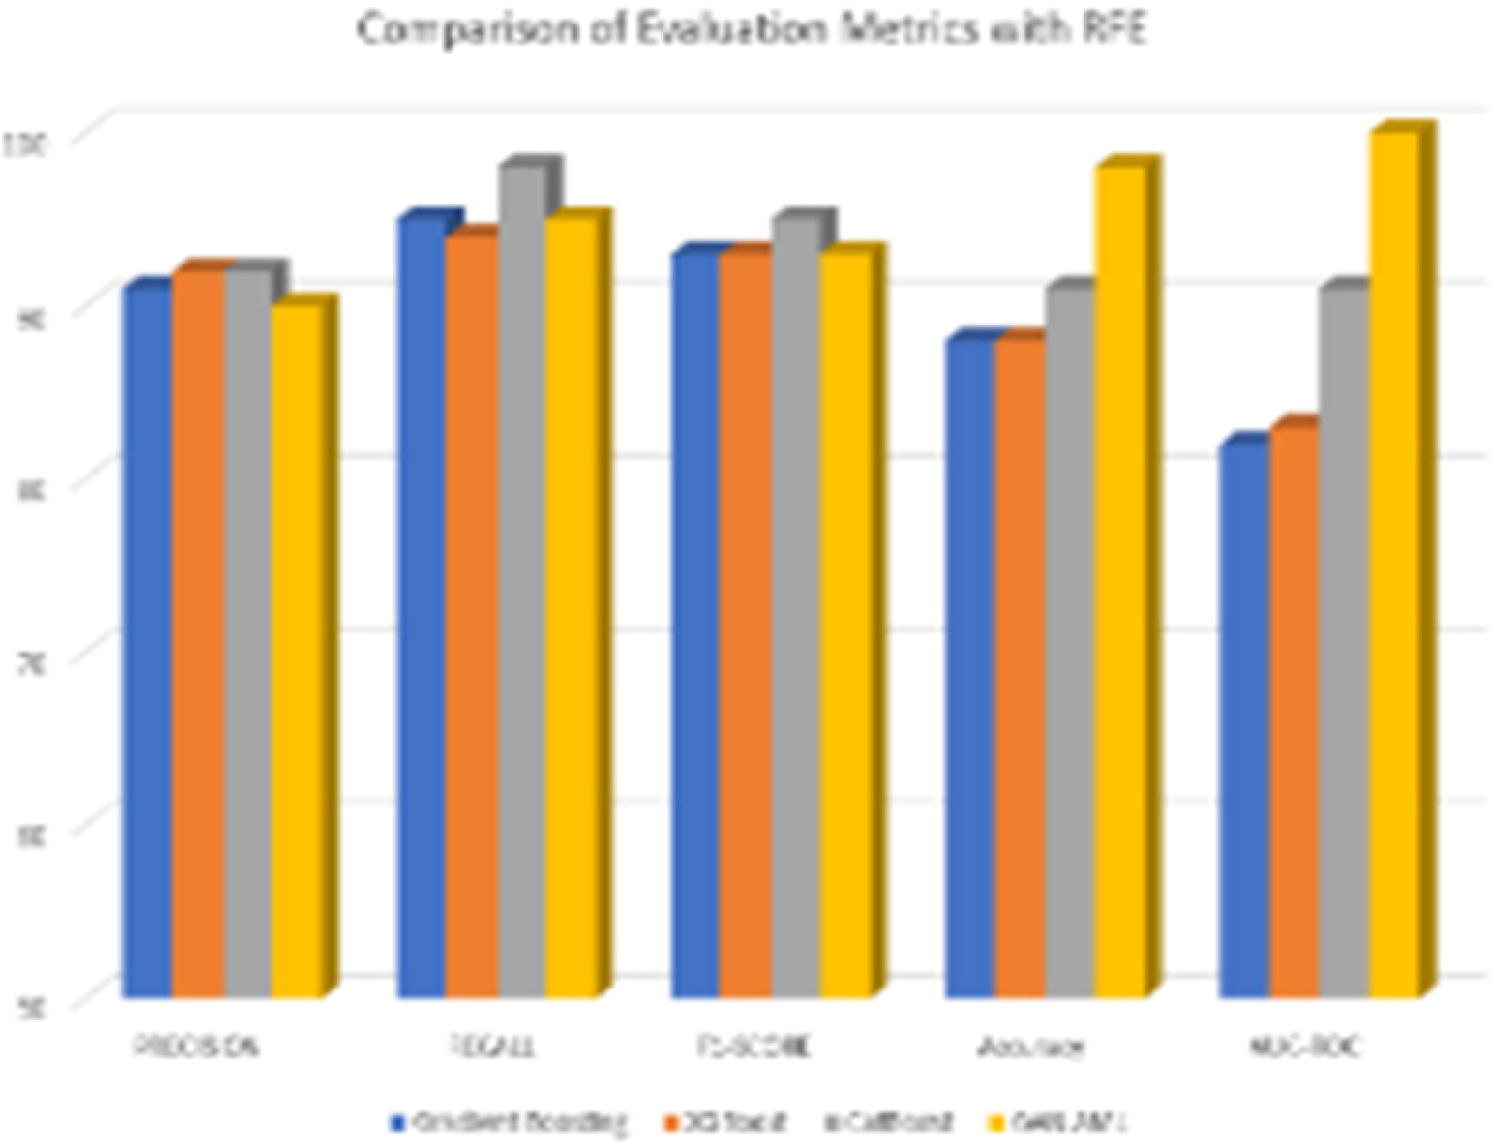
Comparison of evaluation metrics with RFE.
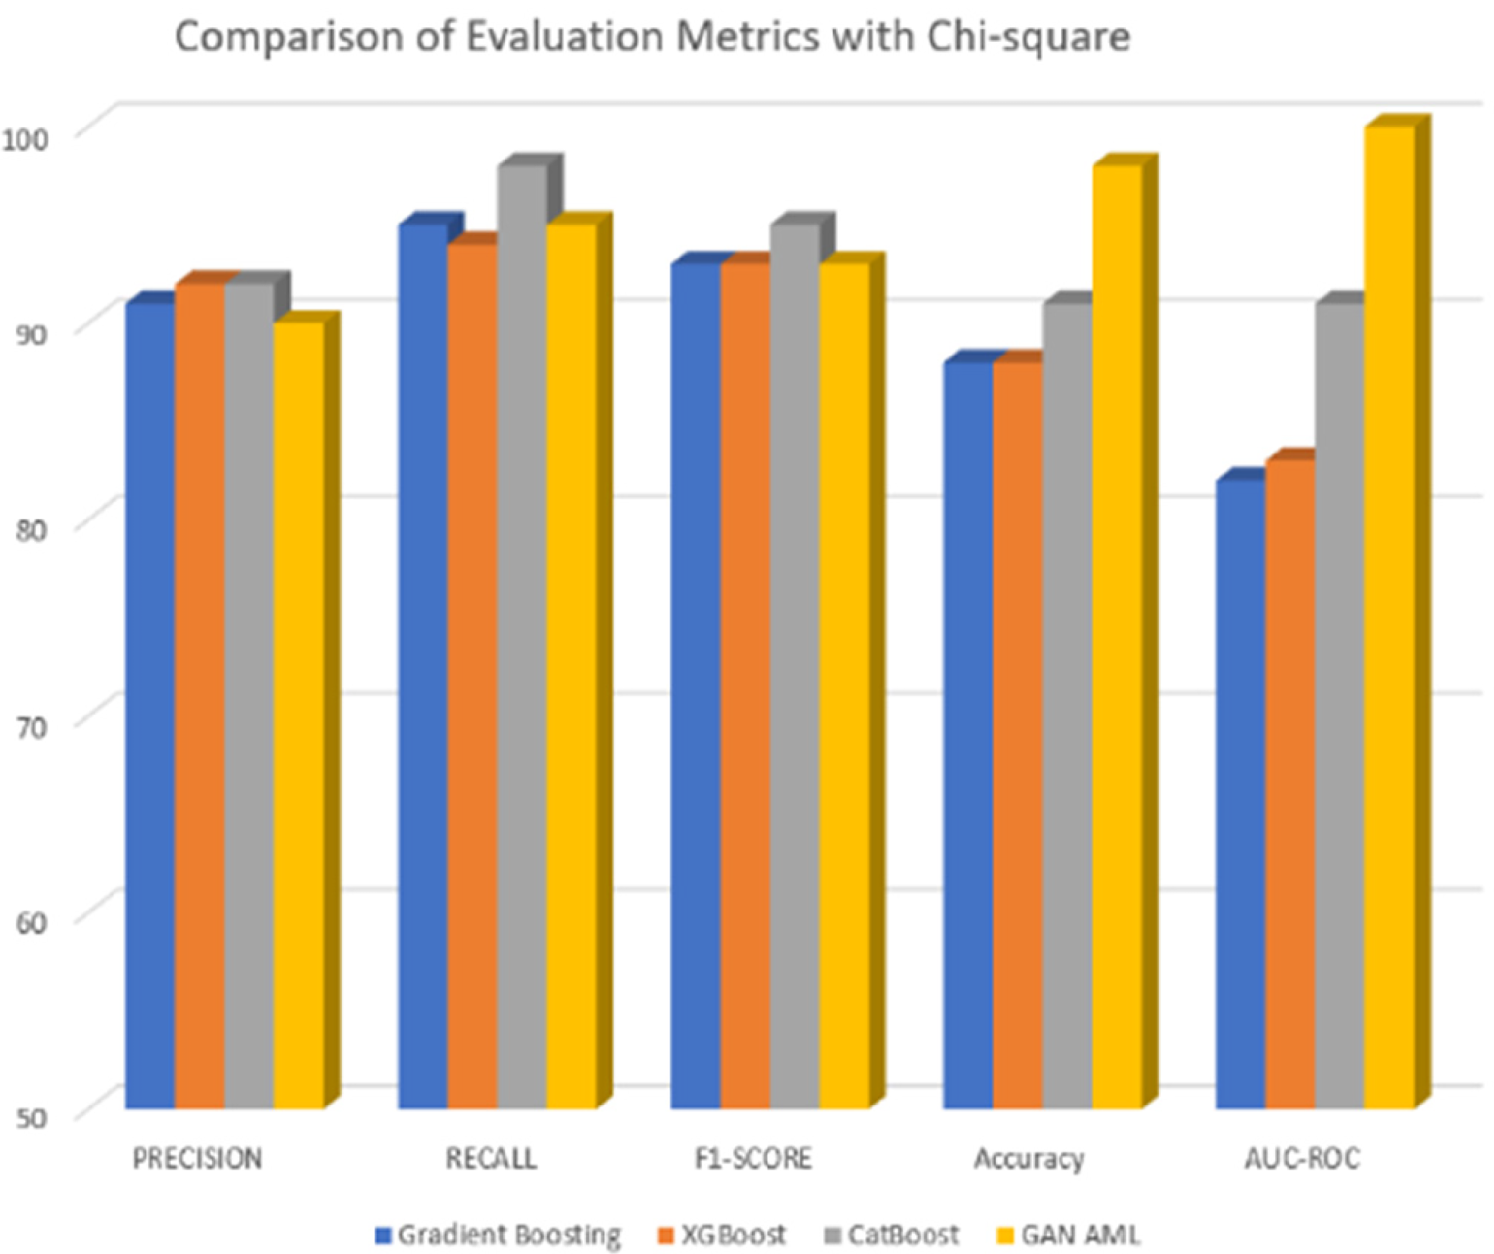
Comparison of evaluation metrics with Chi-square test.
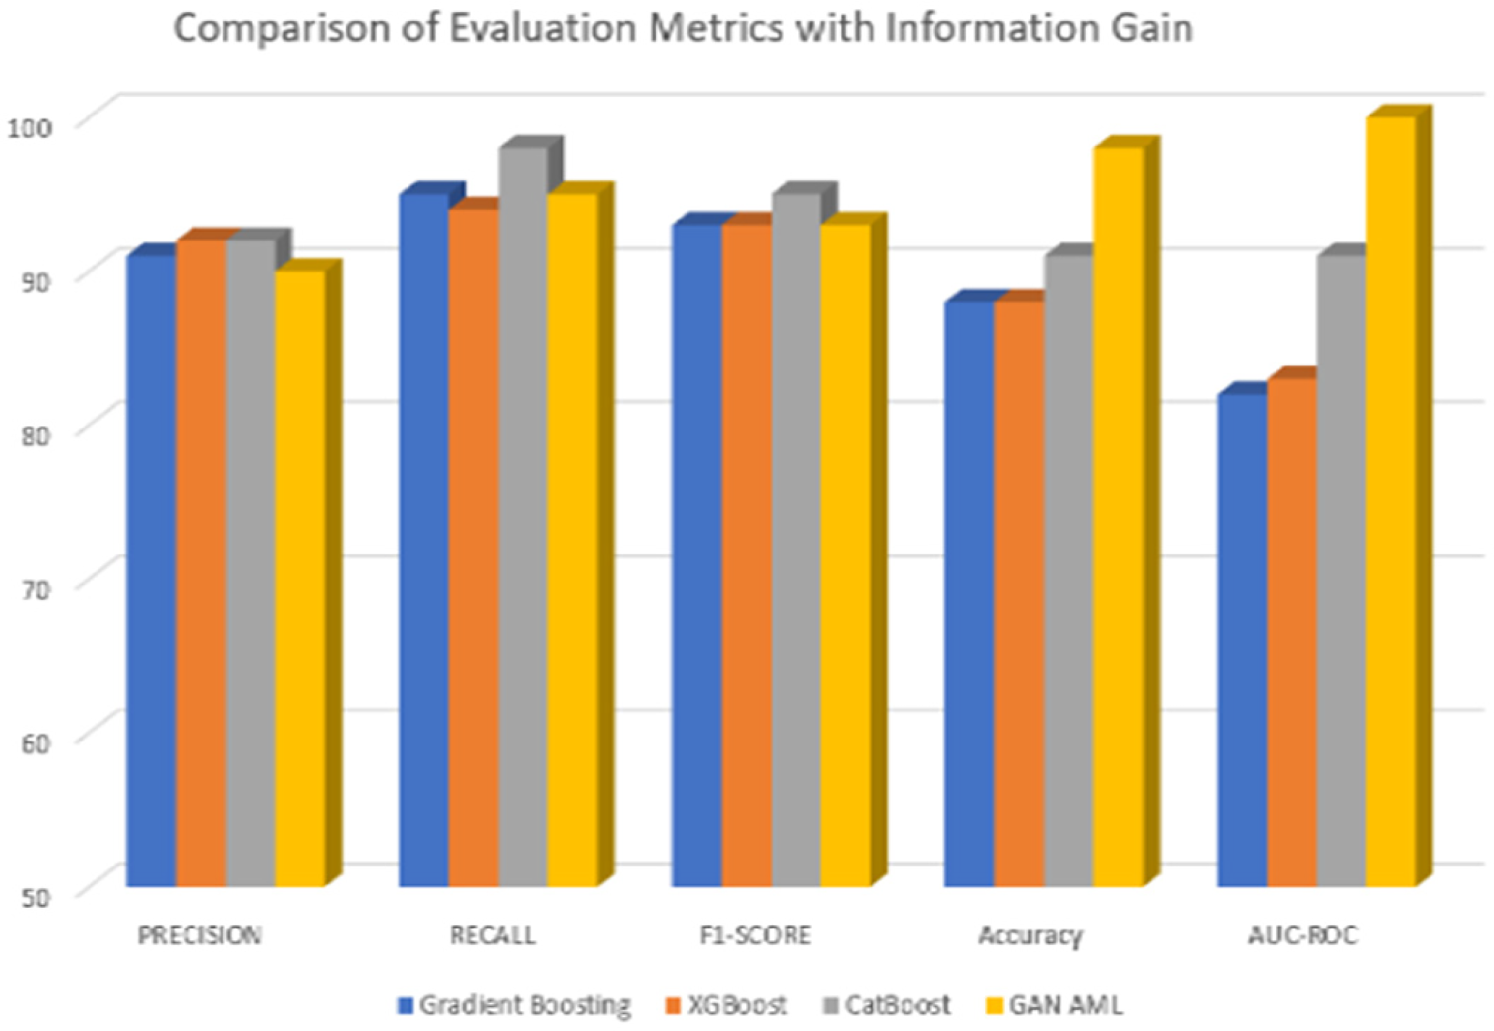
Comparison of evaluation metrics with Information Gain.
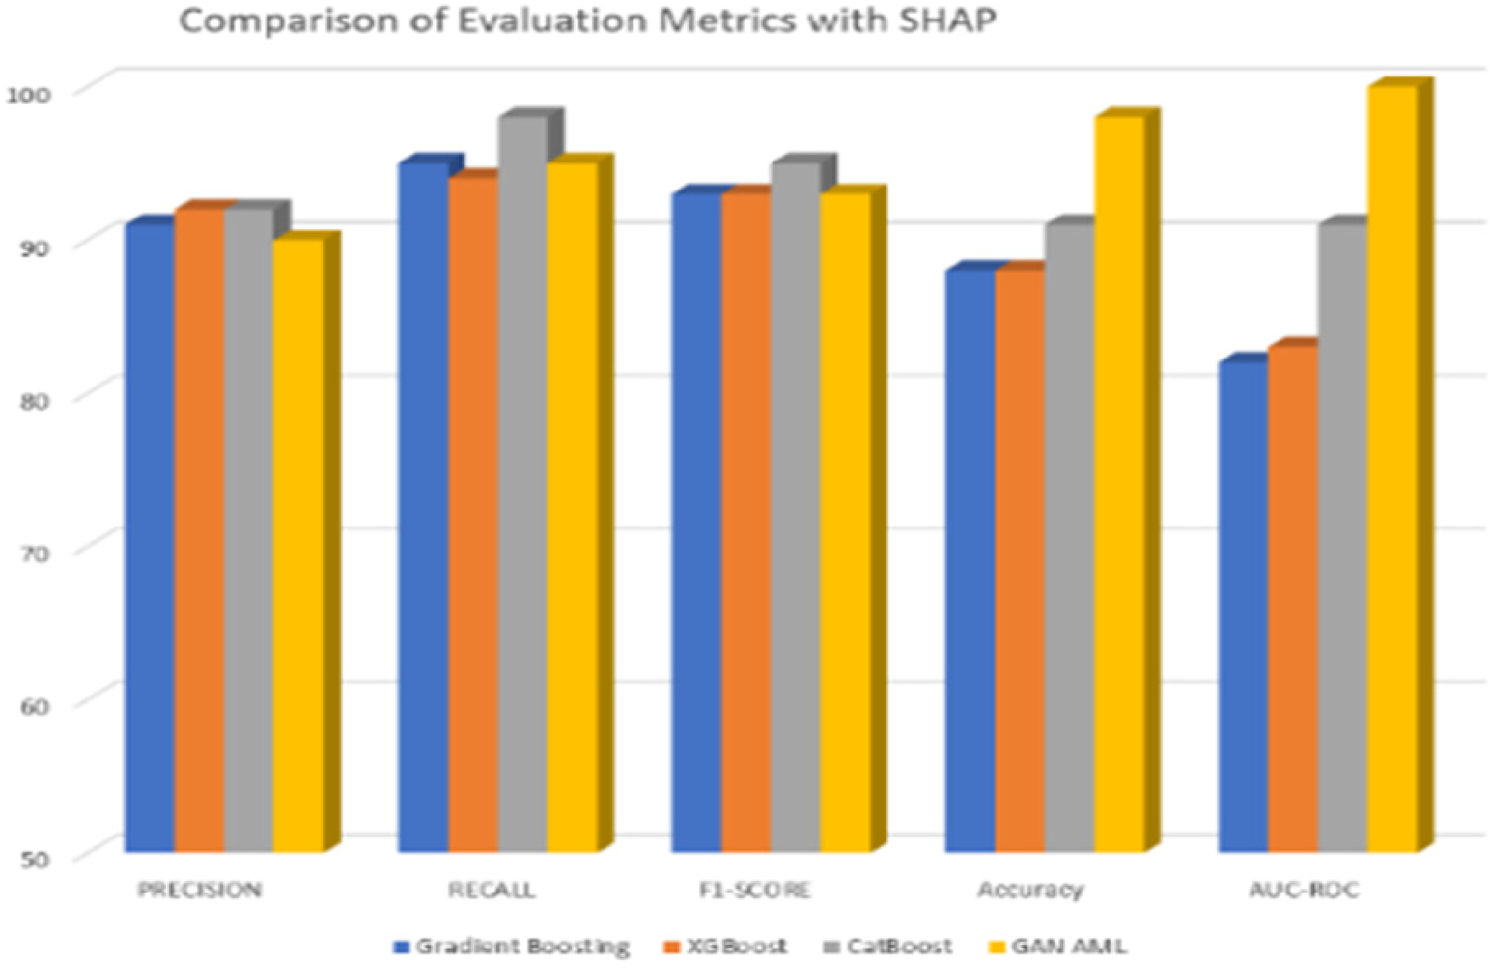
Comparison of evaluation metrics with SHAP.

Features selected using GB with RFE.
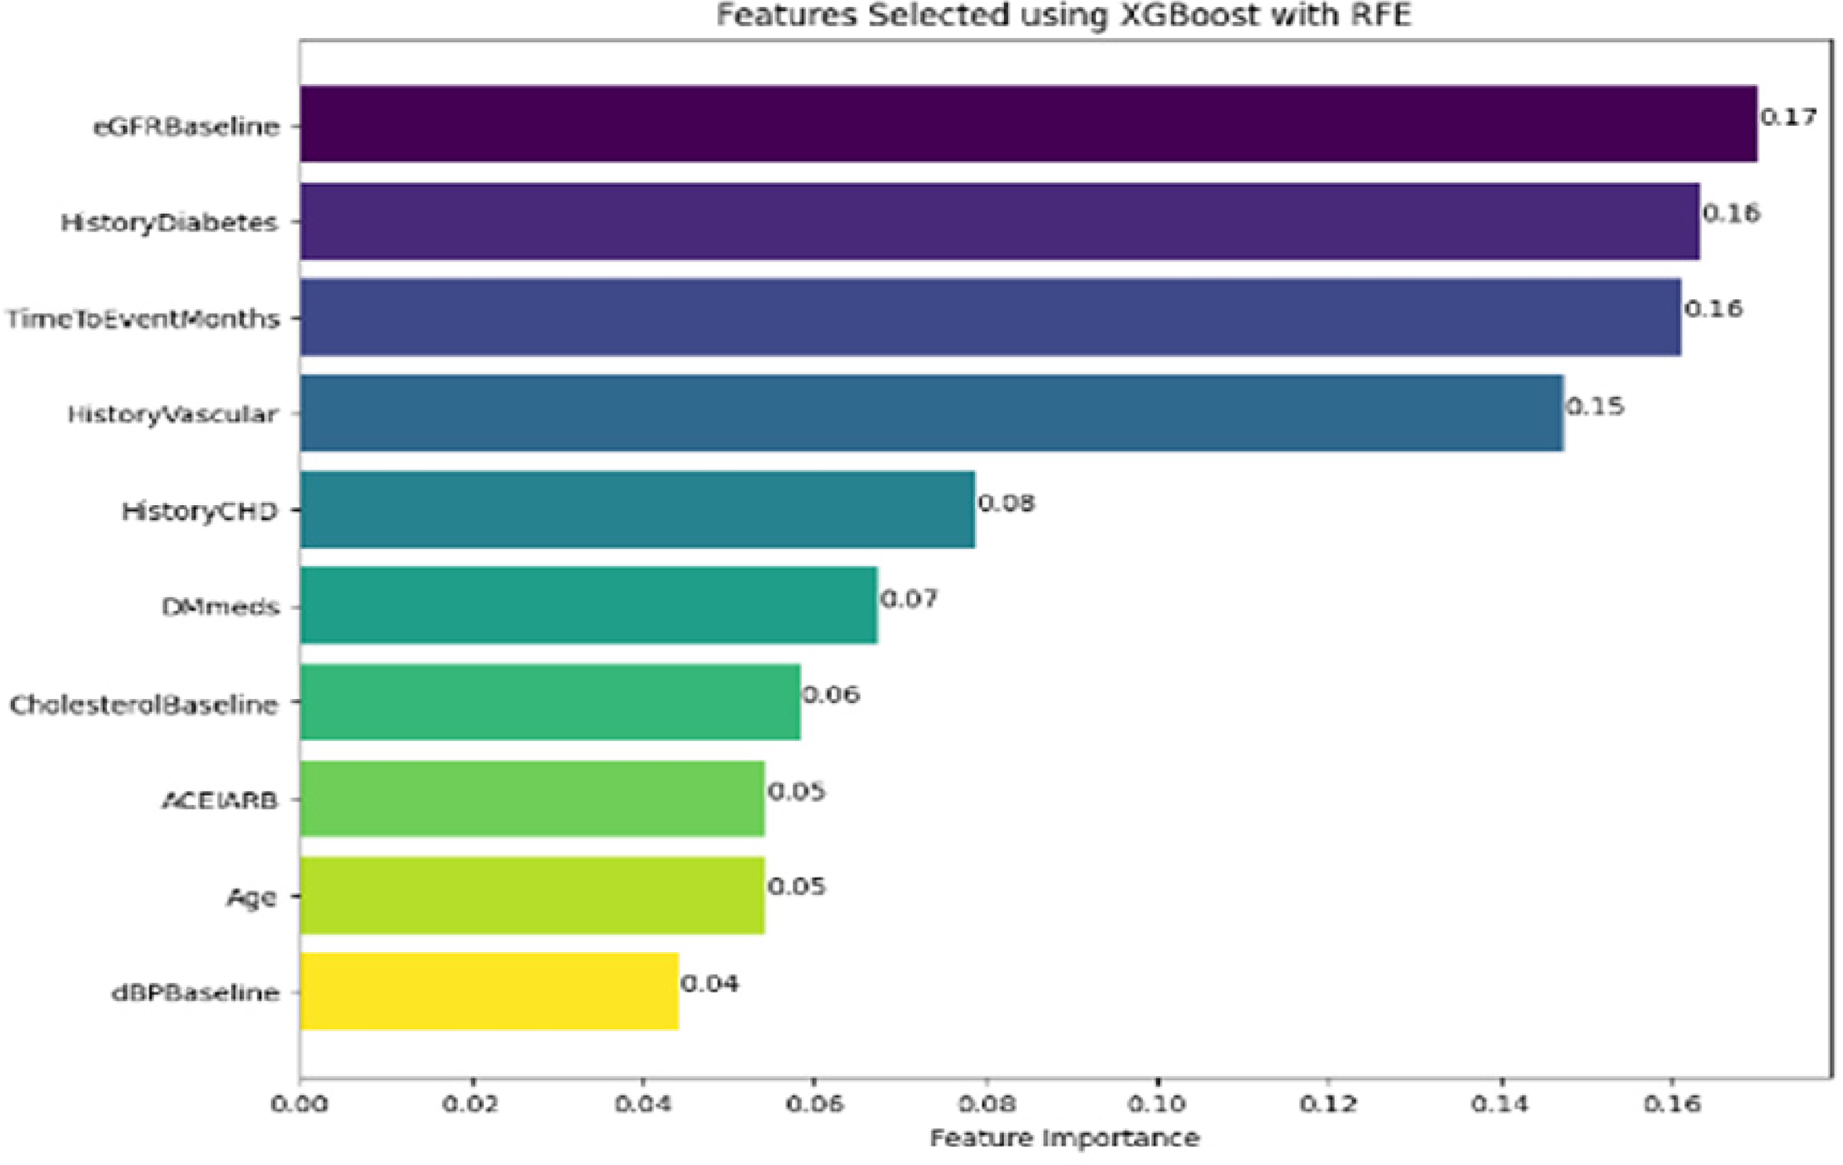
Features selected using XGBoost with RFE.

Features selected using CatBoost with RFE.
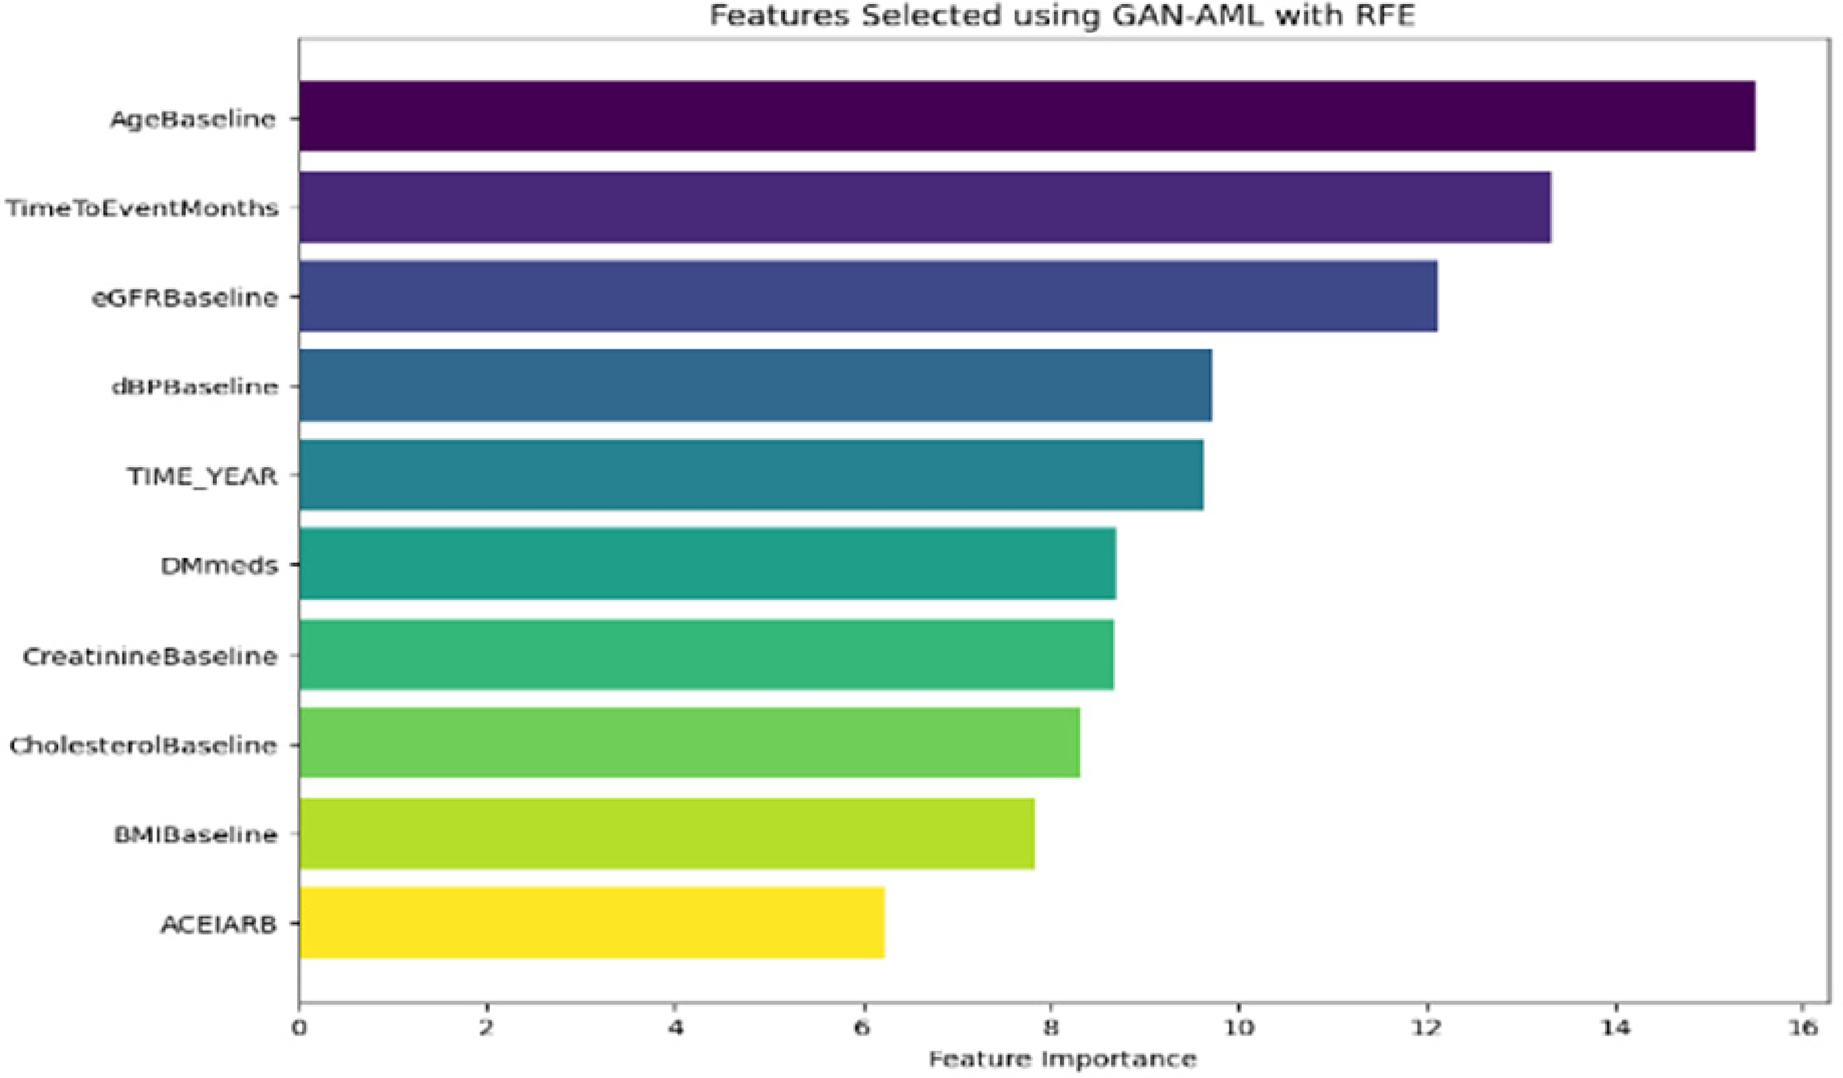
Features selected using GAN AML with RFE.

Features selected using XGB with Chi-square test.

Features selected using GB with Chi-square test.

Features selected using CatBoost with Chi-square test.

Features selected using GAN-AML with Chi-square test.

Features selected using XGBoost with IG.

Features selected using GB with IG.

Features selected using CatBoost with IG.

Features selected using GAN-AML with IG.

Features selected using XGBoost with SHAP.

Features selected using GB with SHAP.

Features selected using CatBoost with SHAP.

Features selected using GAN-AML with SHAP.

ROC curve for XGBoost with SHAP.

ROC curve for GB with SHAP.

ROC curve for CatBoost with SHAP.

ROC curve for GAN-AML with SHAP.
Finally, it can be observed that SHAP feature selection had varying impacts on the overall model performance. While Gradient Boosting and XGBoost saw marginal decreases in accuracy and AUC-ROC, CatBoost and GAN AML saw consistently superior performance across all metrics. Specifically, CatBoost saw a precision of 92%, recall of 98%, F1-score of 95%, accuracy of 91%, AUC-ROC of 91%, and GAN AML saw a precision of 90%, recall of 95%, F1-score of 93%, accuracy of 98%, and AUC-ROC of 100%. This is indicative of the fact that both of these models are capable of handling feature importance in a far more resilient manner, allowing them not to require the use of further selection methods. In conclusion, the main findings of the experiment highlight the need for proper feature selection methods, which should be chosen based on the individual characteristics of an ML algorithm and the classification of CKD stages. While some models benefit from such measures, CatBoost and GAN AML showed consistent superiority without explicit feature selection. Therefore, properly considering such methods is necessary for achieving optimal performance in CKD stage classification tasks. Figures 1–25 depicts the Comparison of Evaluation Metrics with NFS, RFE, Chi-square test, Information Gain, and SHAP.
The study presents a comprehensive approach to developing a Clinical Decision System for accurately classifying CKD stages using machine learning (ML) models, highlighting several vital aspects. It identifies significant drawbacks in current CKD prediction models, such as their inability to generalize across diverse populations and datasets, reliance on limited data leading to unreliable predictions, and the complexity of deep learning models that make them difficult for non-experts to interpret. Additionally, imbalanced datasets can skew performance metrics, particularly in healthcare applications where equal representation is crucial. The research emphasizes the importance of feature selection and model performance evaluation, utilizing various ML algorithms, including Gradient Boosting, XGBoost, CatBoost, and GAN AML, to enhance prediction accuracy, with key features such as creatinine levels, eGFR, urine protein and blood pressure being integral to the model's development. It underscores the necessity of collecting diverse data, including demographics, vital signs, and laboratory test results, to create a robust predictive model, with the dataset comprising 491 patients allowing for a comprehensive understanding of CKD across different populations and severity levels. The study outlines a systematic approach to model evaluation, employing metrics such as F1-score, recall, accuracy, precision, and the area under the ROC curve to ensure effective detection of CKD cases with high specificity and a low rate of false positives, which is critical for real-world application. Furthermore, it suggests that continuous monitoring and feedback can enhance the model's accuracy over time, with periodic retraining using the latest data and advancements in CKD studies enabling the system to adapt to evolving healthcare needs and improve early detection and intervention strategies for CKD patients. Overall, this study contributes significantly to the field of CKD management by proposing a machine learning-based clinical support system that addresses the limitations of existing models and emphasizes the importance of data diversity and model evaluation, with findings that have the potential to improve patient outcomes through timely and accurate CKD stage identification.
Conclusion
This research aims to develop a clinical support system that uses data from the University of California, Irvine, for CKD. This paper presents the study of different machine learning models comprising Gradient Boosting, XGBoost, CatBoost, and GAN AML to classify stages of CKD. It involves the application of a feature selection strategy to enhance the prediction accuracy. The existing dataset, which has 491 patients’ demographic information, vital signs, laboratory test results, and health behaviour data, went through preprocessing. It is followed by missing value imputation using K-nearest Neighbors, Z-score normalization to numerical features, and one-hot encoding to categorical features.
Further activities constitute the resolution of outliers, where they are identified and removed using statistical methods and the Box-Cox transformation. The performance evaluation of four separate models, accompanied by various feature selection strategies, including no feature selection, RFE, chi-square test, information gain, and SHAP, is carried out. Empirical results illustrate the consistently higher performance of CatBoost and GAN AML in terms of the feature selection strategies applied and those not explicitly implemented. It is demonstrated that most models performed far better using RFE, signifying that the feature selection application is influential in classification activities. Most relevantly, information gain benefits are mixed, indicating the need for feature selection methods best suited for different situations. Ultimately, these results demonstrate the importance of expert knowledge in selecting feature selection strategies to enhance the performance of machine learning models for the classification of CKD stages. In the following investigation, longitudinal patient data is considered across many years to provide invaluable insight into the progression of CKD phases. This includes the identification of predictive biomarkers or risk factors related to the progression of the disease. The research recognizes the shortcomings of current models for predicting CKD, including their inability to be broadly applied, the intricacy of deep learning models, the unbalanced nature of datasets, and the need for computational resources. These restrictions significantly affect the models’ applicability and dependability in healthcare settings. The study investigates the possibility of employing a variety of datasets to forecast CKD using machine learning, and it makes recommendations for more investigation, better feature selection, and the incorporation of Gen AI. Enhancing trust among healthcare providers is the focus of its interpretability and explainability approach.
Footnotes
Authors’ contributions
E. Chandralekha and T. R. Saravanan designed the framework, analyzed performance, validated the results, and wrote the article. N. Vijayaraj collected the information required for the framework, provided software, conducted critical reviews, and administered the process.
Code availability
Not applicable.
Funding
The authors received no financial support for the research, authorship, and/or publication of this article.
Declaration of conflicting interests
The author(s) declared no potential conflicts of interest with respect to the research, authorship, and/or publication of this article.
Data availability
No datasets were generated or analyzed during the current study.