
Abstract
BACKGROUND:
Heart disease is a severe health issue that results in high fatality rates worldwide. Identifying cardiovascular diseases such as coronary artery disease (CAD) and heart attacks through repetitive clinical data analysis is a significant task. Detecting heart disease in its early stages can save lives. The most lethal cardiovascular condition is CAD, which develops over time due to plaque buildup in coronary arteries, causing incomplete blood flow obstruction. Machine Learning (ML) is progressively used in the medical sector to detect CAD disease.
OBJECTIVE:
The primary aim of this work is to deliver a state-of-the-art approach to enhancing CAD prediction accuracy by using a DL algorithm in a classification context.
METHODS:
A unique ML technique is proposed in this study to predict CAD disease accurately using a deep learning algorithm in a classification context. An ensemble voting classifier classification model is developed based on various methods such as Naïve Bayes (NB), Logistic Regression (LR), Decision Tree (DT), XGBoost, Random Forest (RF), Convolutional Neural Network (CNN), Support Vector Machine (SVM), K Nearest Neighbor (KNN), Bidirectional LSTM and Long Short-Term Memory (LSTM). The performance of the ensemble models and a novel model are compared in this study. The Alizadeh Sani dataset, which consists of a random sample of 216 cases with CAD, is used in this study. Synthetic Minority Over Sampling Technique (SMOTE) is used to address the issue of imbalanced datasets, and the Chi-square test is used for feature selection optimization. Performance is assessed using various assessment methodologies, such as confusion matrix, accuracy, recall, precision, f1-score, and auc-roc.
RESULTS:
When a novel algorithm achieves the highest accuracy relative to other algorithms, it demonstrates its effectiveness in several ways, including superior performance, robustness, generalization capability, efficiency, innovative approaches, and benchmarking against baselines. These characteristics collectively contribute to establishing the novel algorithm as a promising solution for addressing the target problem in machine learning and related fields.
CONCLUSION:
Implementing the novel model in this study significantly improved performance, achieving a prediction accuracy rate of 92% in the detection of CAD. These findings are competitive and on par with the top outcomes among other methods.
Introduction
Since the dawn of civilization, humanity has greatly advanced technology and medical treatment [1]. Identifying one’s risk of heart failure when they have cardiac disease is a big problem. The use of numerous longitudinal study auto-regression studies creates the forecast approach. Healthcare institutions today have to keep a massive quantity of data in their databases due to technological improvements, making it exceedingly problematic to interpret the data [2]. The cardiac condition known as Coronary Heart Disease (CHD) results in hypoxia and myocardial ischemia because of coronary atherosclerosis. The mortality rate of cardiovascular diseases is the top hazard to human well-being in the globe today, according to the World Health Report [3]. The biggest reason of death globally is coronary artery disease (CAD). It is a complicated cardiac condition with several risk factors and a wide range of signs. The progress of CAD during the past ten years has been quite astounding. The objective of this study is to produce a prototype system utilizing several Machine Learning(ML) algorithms and evaluate their effectiveness to find a model that works best [4, 5]. To generate a prototype system that utilizes several machine learning algorithms, these are the steps that can be followed: problem definition and data collection, feature engineering and selection, algorithm selection and model building, model evaluation and selection, prototype system development, testing and validation, and deployment and monitoring. Cross-validation, train-test split, comparison against baselines, A/B testing, and user feedback and satisfaction can be used to evaluate the model’s effectiveness within the system. These methods help practitioners build effective prototype systems using multiple ML algorithms and assess their effectiveness in solving real-world problems or addressing specific tasks.
A more prominent ML technique is deep learning (DL) [6]. It is used for more than only picture classification jobs; it also uses regular tabular data [7]. Also, illnesses can be predicted using ML techniques [8]. Several standard approaches to using this fettle data to extract the latent material are available, but they need to be more accurate and take a long time. Therefore, we need modern technology to support the appraisal and collection of helpful information from this complicated data. Integrating deep learning and machine learning techniques into CAD disease prediction offers several advantages. Deep learning models excel at complex pattern recognition, feature learning and representation, multimodal data integration, ample data adaptability, model interpretability and explainability, and ensemble learning. By leveraging these techniques, researchers can develop more accurate and clinically relevant CAD risk prediction models, leading to improved patient outcomes and personalized healthcare interventions.
Recently, many initiatives have been made to include Artificial Intelligence (AI) and clinical Decision Support Systems (DSS) to forecast the CAD. These prediction algorithms give medical professionals the individualized data they need to perform better, more specialized patient care. It is sometimes impossible to analyze healthcare data using standard statistical approaches since they are frequently vast and contain various information gathered from many individuals. Machine learning algorithms are incredibly effective and powerful tools for examining and analyzing such an extensive multi-dimensional dataset. Due to this, ML and other forms of Deep Learning (DL) have been effectively applied and beneficial in medicine for decades. Machine learning algorithms are powerful tools for analyzing large datasets. They can automatically extract relevant features, capture non-linear relationships, reduce dimensions, handle incomplete data, and learn complex features from raw data. Ensemble learning techniques can improve predictive performance, and deep learning algorithms excel at learning hierarchical representations of data. Machine learning algorithms are highly adaptable and can be customized to suit specific requirements.
DL techniques outperform the extracted features used in conventional ML algorithms by learning features from the training data. Recurrent neural networks (RNN), LSTM, CNN, and Gated Recurrent Units (GRU) are instances of contemporary designs. RNNs process sequential data by maintaining a state of previous inputs. They’re used for NLP and time series analysis. CNNs are for image recognition and computer vision tasks. LSTMs are RNNs that address the vanishing gradient problem with gated units. GRUs are similar to LSTMs but with a simpler architecture and are more memory efficient. The current networks trust in a cure-all approach to sickness. Modern architectures like LSTM [9, 10], and GRU are applied to the existing dataset to assess the performance for classifying heart illness in patients [11]. In some ways, the most accurate method for detecting CAD is coronary angiography. Images from coronary angiography can be utilized to identify artery stenosis, which is then used to measure the severity of ACS and CAD. It is, however, a time-consuming and costly approach [12].
Since ML is good at revealing hidden data correlations, it is applied to develop non-invasive assessment techniques for analyzing several disorders, particularly CAD. In this sense, data gathering, data pre-processing (data preparation), model selection (ML methods), training and assessment of the selected model, prediction, and parameter adjusting are some of the steps of ML. Social networks, big data, computer-assisted and Internet of Things (IoT) diagnostic systems are limited applications where ML methods are applied. However, further study is necessary to generalize ML models. Researchers have created a range of ML models, including SVM, KNN, FR, DT, LR, and others, for improved CAD prediction.
On the other hand, accuracy in heart disease prognosis continues to be a problem. It is significant to create a cutting-edge, economical method of accurately forecasting the risk of cardiovascular disease. The entire degree of complexity for NB, BN, RF, and MLP has yet to be determined. To develop a predictive model for coronary artery disease (CAD), we can use machine learning algorithms, deep learning techniques, feature selection and engineering, ensemble methods, data imputation and pre-processing, and cross-validation and model evaluation. These methods can help researchers and practitioners develop practical approaches for CAD prediction that leverage the power of data-driven techniques to improve diagnostic accuracy, risk stratification, and patient outcomes.
ML frequently uses ensemble classifiers or systems that categorize cases using various techniques. Recent research focuses on decision mechanisms that may manage divergent viewpoints and deliver a more accurate outcome based on the specificity of each classifier [19]. The usage of ML techniques in the medical sector has dramatically improved. The suggested study uses a novel ML approach to predict the development of CAD [15, 16, 17, 18] illness. The main objective of this research is to provide a state-of-the-art approach to enhancing CAD prediction accuracy by using a DL algorithm in a classification context. To do this, we created an ensemble voting classifier model based on DT, NB, XGBoost, LR, KNN, RF, SVM, CNN, Bidirectional LSTM, and LSTM. Next, a comparison of the ensemble models’ performance and a novel model’s performance was made. A random sample of 216 CAD patients comprised the Alizadeh Sani dataset used in this work’s trials. This dataset comprises 216 CAD patients and 87 normal individuals with 56 distinct characteristics. To resolve the problem of unbalanced datasets, we applied the adaptive synthetic (ADASYN) approach and the Synthetic Minority Over Sampling Technique (SMOTE). The Chi-square test was then included in the feature selection optimization technique. Several assessment approaches have been used to assess performance, including confusion matrix structures, accuracy, recall, precision, fi score, and auc roc.
The research structure is formulated as follows: Section 2 presents a literature survey. This section delivers an overview of prevailing methods and algorithms for detecting heart-related disease, especially CAD. Then, the proposed methodology and architecture are described in Section 3. Section 4 provides the work’s results and decisions. Finally, the conclusion offers a profound summary of the whole system.
Literature review
The most important organ, the heart, transfers blood to all other human body areas. The mind and other organs will terminate working if the heart fails to function correctly, which causes the individual to expire in just a matter of minutes. Thus, appropriate cardiac function is crucial. Heart conditions are becoming one of the leading killers on a global scale. Because of this, many academics worldwide started intending to misuse the massive datasets to predict heart-related illnesses. Several ML [20] techniques may analyze massive datasets and generate meaningful findings. These algorithms are essential for accurately predicting whether or not cardiac issues will arise since ML models hire various techniques [21].
On a CAD dataset called Z-Alizadeh Sani, ML methods were employed to identify CAD early. Since there are 54 features in this dataset, the Pearson correlation feature selection approach was used to determine which characteristics are the most useful. Then, six ML approaches were applied based on a semi-random partitioning framework, including DT, DL, logistic regression, random forests, SVM, and Xgboost. Only eight characteristics were the most useful for diagnosing CAD when Pearson feature selection was applied to the dataset. When the six ML models were applied to the chosen features, the results revealed that LR and SVM performed. The ROC curve shows a comparable outcome for the AUC (0.98) [22, 23].
A correlation between CAD and electrocardiography (ECG), which measures the heart’s electrical activity, has been suggested. The use of ECG to create a feasible screening tool deserves exploration due to its non-invasive nature and cheap and widespread operational accessibility. Nevertheless, using patient ECG recordings to screen for CAD patients adequately might be challenging due to significant inter and intra-individual variability [24].
ML classifiers, including CART, LR, SVM, AB, MNB, LDA, ET, XGB, and RF, on the final dataset after and before hyperparameter tweaking. The most common K-fold cross-validation method to train and assess the ML algorithms. Lastly, the experimental results showed that the ML algorithms’ data standardization and hyperparameter modification pointedly enhanced the forecast classifiers’ accuracy [25].
Different techniques used in existing papers
Different techniques used in existing papers
Table 1 shows C-CADZ, an intelligent system for diagnosing CAD. The Z-Alizadeh Sani CAD dataset from the UCI repository is considered to validate the model using C-CADZ. C-CADZ uses the fixed analysis of mixed data (FAMD) for feature extraction. Ninety-six characteristics are extracted using FAMD [26]. The UCI ML Repository, which has a variety of data sets often utilized by the ML community, is where the data set was gathered. The SMOTE Algorithm was used to balance the dataset since it had a class imbalance, and performance analysis was done on both data sets. The outcomes demonstrate that while training the balanced dataset, all models’ accuracy scores have grown [27]. While the accuracy, sensitivity, and specificity ratings for the LR method were 90%, 92.18%, and 81.34%, respectively, outperforming those of other algorithms [28].
Ensemble learning and DL are used with data mining techniques for categorization. Single C5.0 Tree (C5.0), CART, kernel-based SVM with linear kernel, and ensemble classification are the techniques used for classification. The results demonstrate that the EHBM-DNN and ensemble model [13, 14] are superior to other approaches in terms of classification accuracy [29]. Heart disease detection using DT, RF, Naïve Bayes, K- NN, and SVM. A meta-LR model is utilized to combine the predictions of the basis models [30]. In this sense, the early identification of CAD uses PSO, the Firefly Algorithm, and DT-based categorization using features extracted using PCA. The accuracy of the suggested method is 95.3%. It is possible to employ the technical solution as an automated diagnostic tool [31]. The confusion matrix was used to gauge the performance of the diagnosis system model after it had been constructed using feature selection using FCBF, a hybrid, and SVM-GA [32].
Due to their accuracy and clinical use, the established ensemble learning classification and prediction models for CHD can help patients worldwide, especially those in underdeveloped nations [34]. In addition to the Internet of Medical Things (IoMT) [35, 36, 37] enabled competent healthcare [38, 39, 40, 41] the healthcare data preserved in the cloud will be available to patients, caregivers, and healthcare practitioners. The system is then calibrated using the feature selection model to identify the feature that will be most useful for CVD prediction, and the suggested framework can be used to forecast CVD [33]. The ML technique’s pooling area curve (PUC) construction. This knowledge-based identification influences the accuracy of the prediction. Despite the poor pixels nearby, this significant policy has a good influence on determining variance in medical snaps. With the aid of blood artery blockage and plaque, this pooling area building in our ML algorithm is bagging tissues and veins that are contracting [42]. Accuracy is a method of assessment that is used to calculate the proportion of events that the models correctly predict [43, 44, 15, 45, 46, 47].
Data description
We obtained the freely available Z-Alizadeh Sani dataset from the UCL Machine Learning Repository for this work, which has a substantial number of datasets that have been extensively used by the ML communal. The Z-Alizadeh Sani dataset comprises the medical records of 303 randomly chosen patients who visited Tehran, Iran’s Shaheed Rajaei Cardiovascular, Medicine, and Research Centre [47]. Eighty-seven of the individuals who attended had normal findings, whereas 216 had been diagnosed with CAD. Each item in the collection encompasses facts about the patient, such as age and gender. In all, 56 factors are broken down into four groups: demographic, ECG, examinations and symptoms, laboratory, and echo characteristics. The labels for the binary target variable “Cath” are “Cad” and “Normal.” The “Cad” indicates that CAD is present, whereas the “Normal” designates those with normal circumstances. In 2017, the UCL Machine Learning Repository received the data set [45, 48, 48].
Describe the features used in the Z-Alizadeh-Sani dataset with important characters
Describe the features used in the Z-Alizadeh-Sani dataset with important characters
According to the following table, Z Alizadeh Sani Dataset displays attribute description or feature name, attribute data range, values, and attribute type such as std deviation, mean, median, and variance. Most importantly, people aged 30 to 80 years were selected for the dataset. Other attributes, such as weight, length, sex, BMI, etc., were defined accordingly. The attribute types are usually numeric and binary. Somehow, it varies depending on the attributes. The attribute data range is fixed, and the attribute type defines it. The total of experiential values is separated by the number of observations, n, to get the mean, often recognized as the average. Whether an observation is above, below, or on the mean, it can be estimated and utilized to predict future data points. This dataset stands out because it includes hitherto unutilized characteristics for CAD diagnosis utilizing ML and data mining techniques. The dataset’s primary characteristics may be categorized into four groups: ECG, examination and Symptoms, demographics, and laboratory.
Real-world datasets contain particular characteristics with missing, inconsistent, and incomplete data. Pre-processing procedures for a coronary artery disease (CAD) dataset involve several steps to clean, transform, and prepare the data for modeling. Standard pre-processing procedures include data cleaning, feature engineering and transformation, data balancing, handling time-series or sequential data, cross-validation and splitting, and data standardization. By implementing these procedures, researchers and practitioners can ensure that the CAD dataset is clean, standardized, and well-prepared for subsequent modeling steps. For machine learning algorithms to readily describe the feature set, data pre-processing is employed to clean and prepare the dataset’s raw data. Data pre-processing is a critical machine learning step involving cleaning, transforming, and preparing data for analysis and modeling. It ensures data quality, facilitates feature engineering, normalization, and scaling, handles categorical data, reduces dimensionality, balances data, and helps assess model generalization. Pre-processing lays the foundation for building accurate, reliable, and interpretable models and extracting meaningful insights from data. We used several data preparation techniques in this investigation. The initial actions are encoding, normalization, feature selection, and data balancing. Data pre-processing involves encoding, normalization, feature selection, and balancing. These processes are crucial for preparing data for machine learning tasks. Encoding converts categorical data into numerical representations, normalization ensures all features are on a similar scale, feature selection identifies and retains only relevant features, and data balancing addresses class imbalances. By addressing these processes, practitioners ensure data is appropriately prepared for modeling, improving machine learning models’ performance, reliability, and interpretability.
Predictor importance imported for feature based on ranking for model.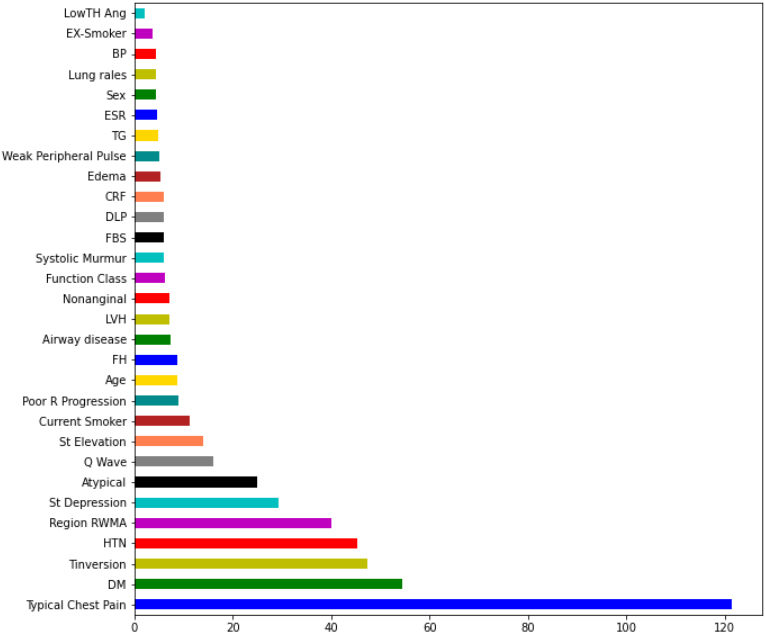
Turning categorical data into numerical format, or encoding, allows the data with transformed categorical values to be fed into models and used to enhance and make forecasts. Among these, encoding categorical data is one of the most essential duties. Categorical data can’t be processed by algorithms requiring numerical input, so encoding techniques convert categorical variables into integers. Four standard techniques are label encoding, one-hot encoding, binary encoding, and ordinal encoding. The choice of method depends on factors such as the nature of the categorical variables, the requirements of the Algorithm, and the desired properties of the encoded data. Label Encoding is used in our system, which changes category columns into numerical ones. The categorical properties of the dataset are first encoded before being translated into numerical values. Categorical variables represent limited distinct categories. Nominal variables have no inherent order, while ordinal variables have a meaningful order. To encode categorical data, one-hot encoding is used for nominal variables, and ordinal encoding or label encoding is used for ordinal variables. Choosing the appropriate encoding technique is crucial to preserve the original data and ensure the encoding reflects the correct ordinal ranking. Because the category with the highest value will prevail over those with the lowest, it may lead to model confusion.
Normalization
The standard normalization process is performed using the Min-Max function. After normalizing the numbers [52], it was time to transform the textual data to numeric. After providing the string data’s attributes in this situation, they received the value in the interval. Because ML algorithms can only read and interpret numeric values, categorical characteristics must be converted to numerical values. Normalization is essential in machine learning because it ensures that all features are on a similar scale, accelerates convergence, improves the conditioning of the optimization problem, removes sensitivity to units, facilitates regularization, and enhances interpretability. Practitioners can develop more accurate and robust predictive models by normalizing numerical data.
Data balancing
We used the data set balancing method SMOTE. SMOTE [53, 48, 12], established by, is an oversampling method used to produce synthetic minority samples. Using a strategy that creates fictitious sample classes of KNN and combines informed oversampling of the minority class with random under-sampling of the majority class, as shown in Fig. 2, the minority class is oversampled. SMOTE balances a data set by artificially inflating the number of members of the minority class to match the number of members of the majority class.
The framework of the proposed model for an initial prediction of CAD.
An irrelevant characteristic has little bearing on the response variable. We frequently deal with a large number of inputs in predictive modeling. Irrelevant features in predictive modeling are variables that do not provide meaningful information for predicting the target variable. Including them in a predictive model can increase complexity, reduce interpretability, computational overhead, bias, and error propagation, and diminish discriminative power. In predicting coronary artery disease (CAD), relevant features such as age, gender, blood pressure, cholesterol levels, smoking status, and family history of heart disease are crucial for developing accurate and reliable predictive models. Feature selection and engineering techniques play a vital role in identifying and prioritizing relevant features for CAD prediction, ultimately enhancing the clinical utility and reliability of the predictive models. Some of these inputs may have no bearing on the desired outcome. An initial screening may control the number of inputs, which can remove unnecessary variables [14]. Feature selection is pivotal in prediction modeling, contributing to improved model performance, reduced overfitting, computational efficiency, interpretability, and enhanced robustness. The ‘Select Best’ method, which we have used in this investigation, is a simple and computationally efficient initial screening step for identifying the most significant features in predicting the target variable. It provides a baseline performance for feature selection and balances simplicity, interpretability, and computational efficiency, thereby advancing the field of prediction modeling. The irrelevant characteristics increase the noise in the dataset. Denoising can be done using a variety of methods [15]. One of the most popular methods is to eliminate pointless features. Many feature selection techniques automatically discard the unimportant characteristics. This method can use various techniques, such as univariate feature selection, feature importance ranking, wrapper methods, dimensionality reduction, and embedded methods, to identify and select relevant features related to coronary artery disease (CAD). These methods help improve model interpretability, reduce overfitting, and enhance the predictive performance of CAD prediction models. A variable selection node has been utilized. During feature selection, it is essential to acknowledge potential limitations. These include data quality, high dimensionality, correlation, non-linear relationships, domain knowledge requirement, overfitting, bias, fairness, and the dynamic nature of data. We openly acknowledge these limitations and demonstrate our commitment to transparent and responsible model development. We employ robust validation techniques and ongoing evaluations to mitigate these issues and ensure the model’s generalization capability.
The Alizadeh Sani Dataset was used to collect the dataset. For feature selection, we used SelectKBest [26]. Due to the binary nature of our objective variable Cath, we used the Chi-square criterion. The Z-Alizadeh Sani dataset is suitable for machine learning-based coronary artery disease (CAD) diagnosis due to its clinical relevance, large sample size, multimodal data, real-world nature, expert annotations, longitudinal information, ethnic diversity, and annotated features. It provides a valuable resource for developing ML-based CAD diagnosis models. This strategy was primarily chosen because it aids feature selection based on the top k scores. The algorithms were then applied to the 34 attributes selected among the numerous with weights larger than 0.6.
The threshold of 0.6 for attribute selection based on weights may involve statistical significance and practical relevance. It prioritizes important and impactful features while managing model complexity and reducing the risk of overfitting. The threshold can be determined based on validation, performance, stakeholder preferences, and domain-specific considerations. Ultimately, the threshold choice involves a trade-off between model complexity, interpretability, and predictive accuracy. Using predictive characteristics is one of the critical assessments for comparing sorting models to forecast the CAD from ordinary. We looked at the models’ significance throughout the features’ ranking step to do this. The models are evaluated based on how heavily the predictor characteristics are weighted.
Predictor importance imported for feature based on ranking for model
Predictor importance imported for feature based on ranking for model
As shown in Fig. 2, we first applied pre-processing for numerical and categorical attributes with various approaches. Raw data are frequently unavailable in the form and shape needed for learning algorithms to function at their best. Therefore, in ML Applications, the pre-processing stage is crucial. The pre-processing stage is critical to machine learning. It ensures data quality, improves model performance, and enhances interpretability. Pre-processing involves data cleaning, feature engineering, normalization, and scaling, handling categorical data, dimensionality reduction, data balancing, cross-validation, and model evaluation. By carefully preparing the data, practitioners can build accurate and reliable predictive models that deliver valuable insights for informed decision-making.
A process flow diagram of our proposed approach is illustrated in Fig. 2, and the proposed Algorithm’s pseudo-code is presented in Algorithm. We take the Alizadeh Sani dataset as input to predict the final output. Firstly, we applied pre-processing activities for the CAD disease dataset. Data pre-processing is a crucial step in ML that involves cleaning, transforming, and preparing data to make it suitable for analysis and modeling. Encoding, Normalization, Feature Selection, and Data Balancing are applied during the data pre-processing. Then, the dataset is divided into training and testing. The data is trained before sending it to the several ML and DL classifier models. Then, numerous ensemble methods are used to get the outcomes. To do that, hybrid DT and KNN, hybrid SVM and LR, hybrid XGB and RF, hybrid CNN and LSTM, hybrid XGB and LSTM, hybrid CNN and BiLSTm, and a novel algorithm were used.
Model evaluation was processed. Model evaluation is a method that uses several procedures to assess the model’s efficacy. Next, the Novel model is developed to compare the performance metrics. Finally, the results are predicted for CAD. Finally, the output revealed the final ensemble predictions for the absence or presence of heart illness. Ensemble methods combine multiple machine learning models to generate a collective prediction. In predicting heart disease, ensemble predictions involve aggregating individual predictions from various models trained on relevant features and datasets. Ensemble prediction can take different forms, such as simple voting, weighted averaging, or stacking. The final prediction represents the collective wisdom of the individual models, making it more accurate and robust. Ensemble methods are widely used in medical diagnostics to improve diagnostic accuracy and reduce uncertainty.
Giving data to the ML algorithm throughout the model training process enables it to recognize and discover the optimal values for all pertinent characteristics. ML models come in a wide variety, but unsupervised and supervised learning models are among the most common. In this study, we used ML and DL. In the proportion of 80:20, the data are divided between testing and training. Before testing the data, which has 76 observations, we trained it using the 227 observation data. We follow a specific methodology to train a model and test its effectiveness. First, we split the dataset into training and test sets. The model is then trained on the training set, which allows it to learn meaningful patterns. Next, its performance is evaluated on the test set, containing data the model has not seen before. If the model performs well on this new data, it can make accurate predictions on new, unseen data. If not, the model needs further refinement. Finally, a final evaluation is conducted to assess its performance before deployment. The training data is utilized when determining the link between the target and predictor variables, and the test data is used to evaluate the model’s effectiveness.
Both unsupervised and supervised learning are essential in CAD prediction model training. Unsupervised learning helps identify hidden patterns, reduce data dimensionality, and detect anomalies. Supervised learning predicts CAD presence, severity, and risk scores and validates model performance. Leveraging both approaches provides deeper insights into CAD data structure and risk factors and builds accurate predictive models. By that, LR, RF, SVM, DT, XGBoost, and KNN are used under the ML technology. As per the DL technology, we have used CNN, LSTM, CNN 1d, and Bidirectional LSTM. So, combining these technologies and algorithms makes accuracy high in the proposed system.
Ensemble techniques
The ensemble learning method combines the basis classifiers to provide outcomes superior to those of a single classifier. Ensemble approaches combine several models into a single, highly dependable model to increase model predictability. They are excellent for regression and classification, where they decrease bias and variance to improve the accuracy of models. The most often used ensemble methods include boosting, bagging, and stacking. Ensemble approaches combine predictions from multiple individual models, leveraging diverse models and producing more generalized, stable, accurate, and reliable predictive models. Ensemble methods mitigate overfitting, enhance model interpretability, and employ various diversity strategies such as bagging, boosting, and stacking. Researchers can build more robust, accurate, and reliable predictive models for CAD diagnosis, risk assessment, and patient management by incorporating ensemble approaches.
Multiple classifiers provide the final forecast in an ensemble learning process. Ensemble methods combine numerous machine learning models to generate a collective prediction. In predicting heart disease, ensemble predictions involve aggregating individual predictions from various models trained on relevant features and datasets. Ensemble prediction can take different forms, such as simple voting, weighted averaging, or stacking. The final prediction represents the collective wisdom of the individual models, making it more accurate and robust. Ensemble methods are widely used in medical diagnostics to improve diagnostic accuracy and reduce uncertainty. The ensemble model creates a single compound model with improved accuracy by combining some classifiers [10, 13, 14, 15, 16]. The voting classifier is an ensemble learning technique combining several base models for the best result. This study uses different algorithms, such as LR, RF, SVM, DT, XGBoost, KNN, CNN, LSTM ML CNN 1d, Bidirectional LSTM by DL technology, etc., to forecast individual outputs. This brings variety to the production, thus called a Heterogeneous ensemble. Integrating multiple technologies and algorithms can improve accuracy by leveraging the complementary strengths of each approach. This can enhance the system’s robustness and adaptability, reduce risks, enable cross-validation, and capture domain-specific knowledge.
This study predicted the likelihood of CAD illness using the majority vote ensemble approach. The Algorithm employs the consensus of numerous ML models to identify the patient and deliver more accurate findings. Finally, we increased the accuracy rate using our method based on the complex voting ensemble model. Integrating machine and deep learning for coronary artery disease (CAD) prediction presents opportunities and challenges. Researchers must tackle limited and variable data quality, interpretability, feature engineering, model complexity, data imbalance, validation, and ethical considerations. Addressing these challenges can lead to developing robust and clinically relevant predictive models for improved CAD diagnosis and patient care.
In the ensemble model, diverse predictors/classifiers are used for classification.
Different ensemble models are voting, averaging, weighted averaging, stacking, blending, bagging, boosting, etc. In this research, the voting and averaging ensemble models have been used. The following figure shows the concept of the ensemble model using a voting approach
Performance evaluation
Model assessment is a technique that uses several processes to measure the model’s efficiency. Model assessment in model monitoring may be done in various ways utilizing metrics like classification and regression. Machine learning models require evaluation to assess their performance, generalization capability, and reliability. Standard evaluation techniques include train-test split, cross-validation, performance metrics, confusion matrix, ROC curve analysis, learning curves, and understanding the bias-variance trade-off. Evaluation is crucial for model selection, generalization assessment, performance monitoring and improvement, and interpretability and transparency. Overall, evaluation is integral to the machine learning pipeline, ensuring models meet performance standards, are robust, and fulfill real-world objectives. This study used precision, accuracy, the F measure, AUC (area under the ROC curve), and recall to quantify classification performance. As indicated in Table 4, we construct the confusion matrix for each model. Precision, accuracy, F-measure, AUC, and recall are performance metrics used to evaluate classification tasks in machine learning. Each metric provides different insights into a model’s performance. Precision measures accurate optimistic predictions and helps avoid false positives. Accuracy measures overall correctness but may not be suitable for imbalanced datasets. F-measure is useful when false positives and false negatives have different costs. AUC measures the model’s ability to discriminate between positive and negative instances. Recall identifies all positive instances correctly. Evaluating a model using these metrics can help practitioners better understand its performance and make informed decisions. The various categorization metrics are built on the confusion matrix. It is a matrix that accurately captures how the model performed. A confusion matrix provides a detailed explanation of the appropriate and inappropriate groupings for each class. In addition to accuracy, precision, recall, and F-score may all be seen in the confusion matrix since it depicts the four possible categorization outcomes indicated above. It is simple to compute them from the matrix.
Performance metrics
Performance metrics
The “TN–True Negative, TP–True Positive, FP–False Positive, and FN–False Negative” rate is used to determine the F measure, accuracy, recall, and precision in ML. Negative and positive predictions are divided into actual pessimistic and accurate optimistic forecasts. Every model foresaw TP, TN, FN, and FP. The letters TP stand for diseased. It is predicted that FN is not a kind of cardiac disease. It was believed that FP would not constitute a kind of cardiac disease. The sickness known as FP was predicted but never materialized. TN is not now a disease and is not anticipated to become one shortly.
Accuracy: Accuracy is the most typical assessment parameter for categorization issues. The equation calculates it as the quantity of correctly predicted events to all predicted events.
Precision: The precision is calculated by dividing the total positive outcomes predicted by a classifier by the number of true positives. Precision seeks to determine what percentage of optimistic forecasts were accurate. The formula is shown below.
Recall: Recall, on the other hand, is calculated by dividing the total number of samples that were expected to be positive by the number of actual positives. Recall seeks to determine the percentage of correct optimistic predictions that were made. The formula is shown below.
F1 Score: The precision and recall of a test are both considered while calculating the F-score, which is a measure. In this post, it is described as the harmonic mean of precision and recall. The equation for the F-score, also known as the F1 score, is shown below.
AUC-ROC: AUC ROC is the primary metric for assessing the effectiveness of classification models. The AUC ROC metric unquestionably helps assess and educate us about a model’s ability to categorize data. The grading criteria state that a model with a higher AUC is superior. AUC-ROC curves are often used to visually represent the relationship and trade-off between specificity and sensitivity for each conceivable cut-off for a test or series of tests. The area under the ROC curve shows the benefit of using the test for the underlying question. AUC-ROC curves are another performance measure for classification issues at varying threshold levels. The two metrics on which the ROC curve is constructed are the False Positive Rate (FPR) and True Positive Rate (TPR). The following is the TPR, also known as sensitivity, hit rate, or recall:
We created an ensemble classifier model using Naive Bayes, XGBoost, DS, LR, SVM, RF, CNN, LSTM, and BLSTM. Next, a comparison of the ensemble models’ performance and a novel model’s performance was made. A random sample of 216 CAD patients comprised the Alizadeh Sani dataset used in this work’s trials. This dataset comprises 216 CAD patients and 87 normal individuals with 56 distinct characteristics. To resolve the problem of unbalanced datasets, we applied the SMOTE. The Chi-square test was then included in the feature selection optimization technique. The Chi-square test is used in feature selection optimization to identify relevant features contributing to predictive modeling by assessing the statistical significance of the relationship between categorical features and the target variable in a classification task. By selecting features with significant Chi-square test statistics, feature selection techniques can reduce dimensionality, improve model performance, mitigate overfitting, and enhance the interpretability of classification models in various domains. Several assessment approaches have been used to assess performance, including confusion matrix Precision, accuracy, f1-score, recall, and roc auc. When the innovative model was used in our investigation, performance significantly improved, yielding a prediction accuracy rate of 92% for identifying CAD. These outcomes are competitive and on par with the best outcomes from other approaches.
Results of models
Comparison of precision, accuracy, F1-score, and recall of novel algorithm
Comparison of precision, accuracy, F1-score, and recall of novel algorithm
According to the following table, the ML and DL classifiers have precision, accuracy, recall, and F1-score, which are less than the novel algorithm metric’s performance. Particularly in accuracy, hybrid CNN and LSTM metrics show less than the rest of the metrics. The novel Algorithm has the highest accuracy of 93%. When it comes to precision, the lowest is hybrid CNN and LSTM metrics, and the same is true for accuracy. However, hybrid CNN and BiLSTM metrics are the highest, with 94% precision. For recall, the hybrid XGB and LSTM metrics are the highest. The lowest are hybrid CNN and LSTM metrics and hybrid CNN and BiLSTM metrics. These two metrics have the same percentage of recall. Finally, the F1-score measured and novel algorithm metrics got 93% of the highest score; hybrid CNN and LSTM metrics also got 86% of the lowest score. Compared to traditional ML models, our proposed model reaches a recall value of 0.93, similar to the SVM classifier.
However, our model’s test accuracy (0.82) and specificity (0.81) are suggestively higher than the SVM classifier. The figure below screens the precision, accuracy, F1-score, and recall in a graphical manner.
The accuracy comparison between the various algorithms is shown in the following Fig. 3. Every Algorithm has an accuracy level of at least 85%. That indicates that hybrid CNN and LSTM have the lowest accuracy compared to other algorithms. That has an overall accuracy rate of 86%. When considered, the optimal model-new method has the best accuracy (92%). On the other hand, hybrid CNN and BiLSTM, SVM, and LR achieved 90% accuracy. Like DT and KNN, XGB and RF hybrids also achieved 89% parallel accuracy.
Comparison of accuracy of each Algorithm.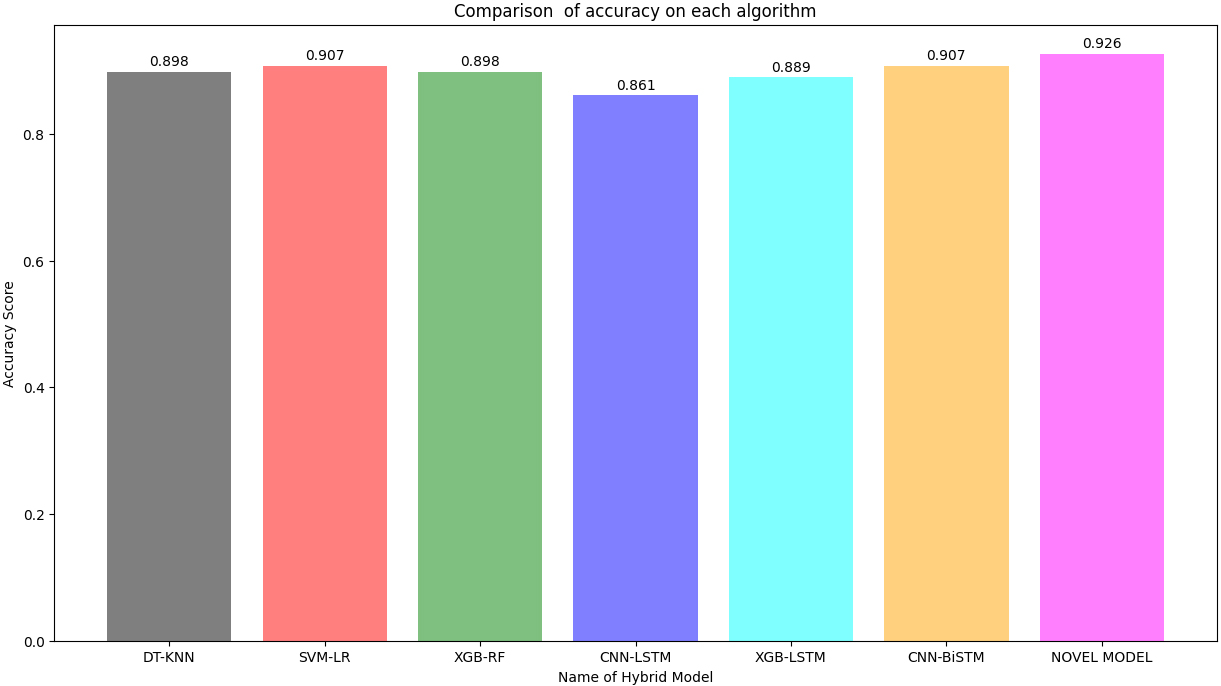
Performance evaluation of ensemble classifier models.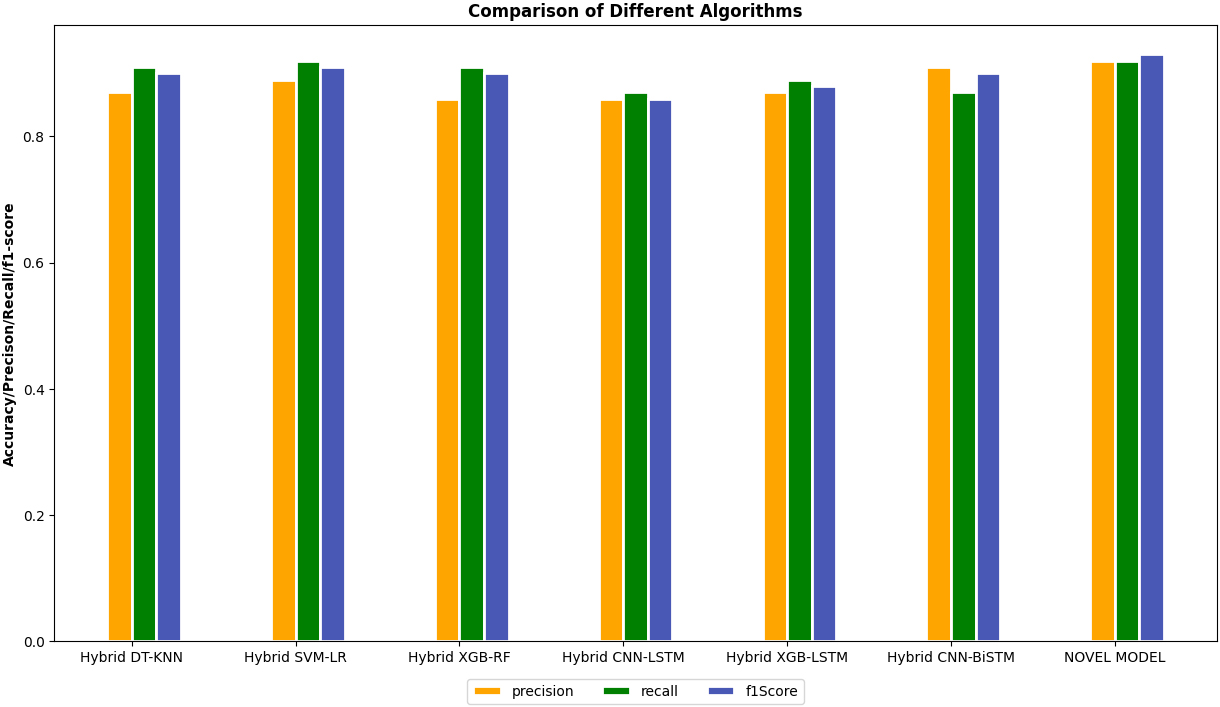
Table 4 shows the precision, accuracy, f1 scores, and recall for each ML approach. The values for hybrid DT and KNN, hybrid SVM and LR, hybrid XGB and RF, hybrid CNN, and LSTM, hybrid XGB and LSTM, hybrid CNN, and BiLSTm, and the novel algorithm are displayed. The novel Algorithm has the highest precision, accuracy, f1 scores, and recall. It gained the highest accuracy of 92%, respectively.
ROC of hybrid DT and KNN metrics.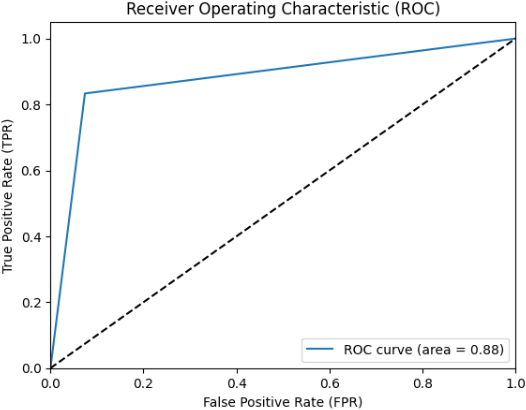
ROC of hybrid SVM and LR metrics.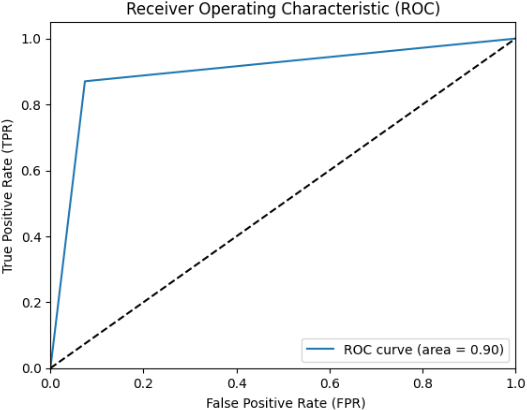
Figures 5–11 show the ROCs of several approaches, such as Hybrid DT and KNN metrics, Hybrid SVM and LR metrics, Hybrid XGB and RF metrics, Hybrid CNN and LSTM metrics, Hybrid XGB and LSTM metrics, Hybrid CNN and BiLSTM metrics and Novel Algorithm respectively. We obtained the different ROC values for SVM-LR, DT-KNN, XGB-RF, CNN-LSTM, XGB-LSTM, CNN, and BiLSTM in Figs 5–11.
ROC of hybrid XGB and RF metrics.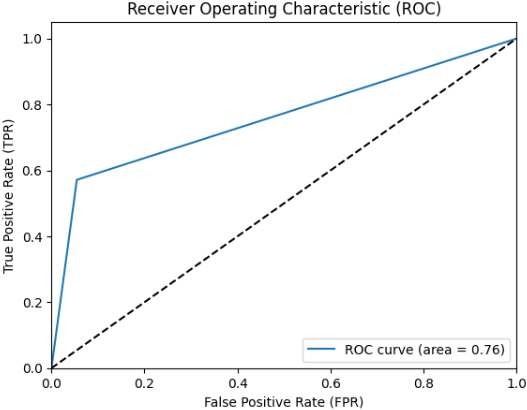
The best-performing ML classifiers are the Hybrid DT and KNN metrics, Hybrid SVM and LR metrics, Hybrid XGB and RF metrics, Hybrid CNN and LSTM metrics, Hybrid XGB and LSTM metrics, Hybrid CNN and BiLSTM metrics, and Novel algorithm metrics. We developed various models to choose the most effective models and utilized the roc auc curve operation. The voting ensemble models applied roc auc and the resulting are displayed in Table 5, and the comparison of each model is in Table 5. In this sense, hybrid DT and KNN metrics show 88% of ROC. Then, hybrid SVM and LR metrics display 90%, higher than the hybrid DT and KNN metrics. Next, hybrid XGB and RF metrics show 76% of ROC.
Meanwhile, hybrid CNN and LSTM metrics illustrate 87%. Afterward, hybrid XGB and LSTM metrics prove 81% ROC. Hybrid CNN and BiLSTM metrics verify 83% of micro-average ROC. Finally, the novel Algorithm shows 92% of micro-average ROC and 92% of the ROC curve of classes 0 and 1, which is the highest rate of ROC curve among others.
Category of ROC curve
ROC of hybrid CNN and LSTM metrics.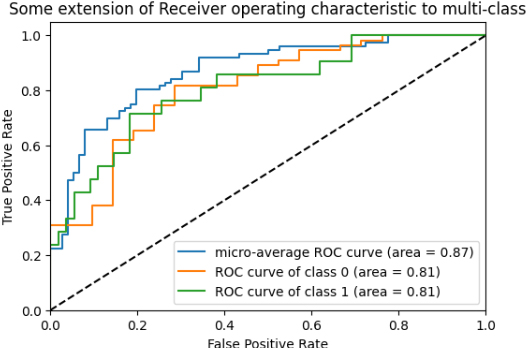
ROC of hybrid XGB and LSTM metrics.
ROC of hybrid CNN and BiLSTM metrics.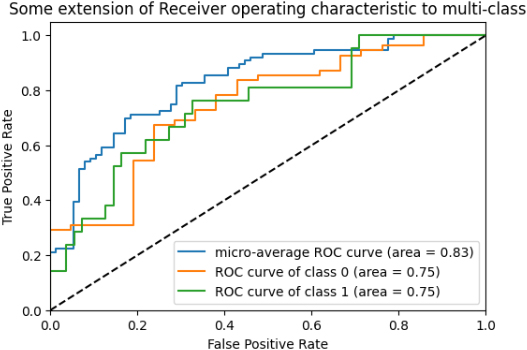
ROC of Novel Algorithms.
ROC Curve comparison.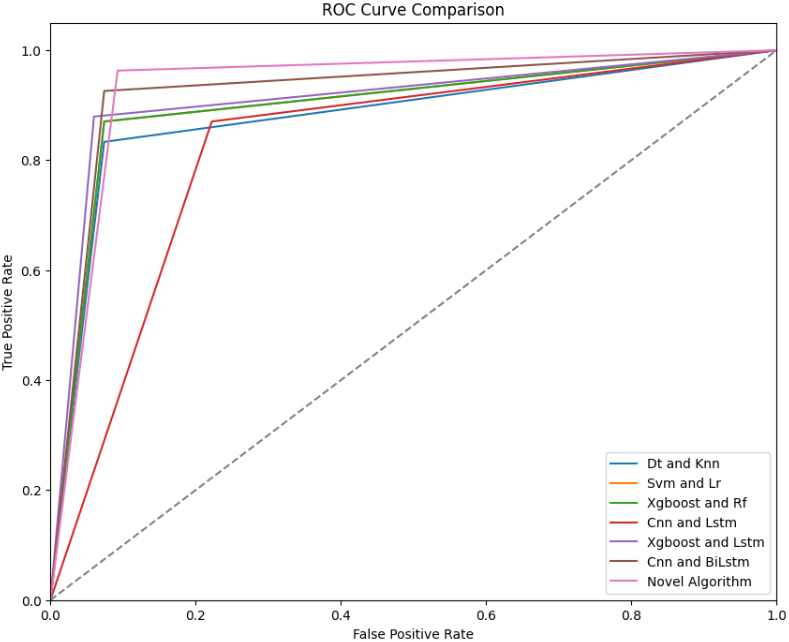
Several ensemble models have been used in the existing papers. In the reference [37], the authors used Multilayer RF and AdaBoost classifiers to detect CAD disease. Hybrid Decision Trees and K-nearest neighbors (KNN) with novel algorithms are top-performing machine learning models due to their high discriminative power, large AUC values, robustness to imbalanced data, adaptability to complex data structures, and incorporation of innovative techniques. In short, they accurately distinguish between positive and negative instances, with their ROC curves reflecting their superior performance on classification tasks. They have chosen the Z-Alizadeh Sani dataset. The accuracy is 88.12%. SVM with randomized search cross-validation was used in [53]. They got 87.102% of accuracy. The dataset was same Z-Alizadeh Sani. PSO and K-means clustering algorithms. Supervised learning algorithms MLP, MLR, C4.5, and FURIA were used in the paper [54]. 88.4% accuracy was achieved with clinical data containing 26 features and 335 instances at the Department of Cardiology, Indira Gandhi Medical College data set. The Data mining algorithms SVM, ANN, and RF, with an accuracy of 89.73%, were gained by the Isfahan Cohort Study dataset of the Isfahan Cardiovascular Research Center data set. The paper is [55]. Comparing ensemble models with a novel model provides valuable insights into the effectiveness of different modeling approaches for CAD prediction. Ensemble models leverage multiple models to produce more accurate forecasts, while novel models may introduce innovative features or techniques. One can use standard evaluation metrics and statistical tests to compare these approaches to determine each approach’s strengths, weaknesses, and trade-offs. Researchers can identify the most effective modeling strategies by evaluating predictive accuracy, robustness, efficiency, and clinical relevance and advance state-of-the-art CAD prediction research.
The SVM was added as a classifier about [56]. However, they achieved 88% accuracy. As with the above reference [50], they used SVM as an algorithm for their study and got 89.47%. The ensemble model of DT, RF, SVM, k-NN, and MLP was used in [51] with an accuracy of 90%. And then, LR, KNN, SVM, Naïve Bayes, DT, and RF algorithms were used [57]. The accuracy level is 85.52%. The Z-Alizadeh Sani data set was used by the references [56, 51, 44] respectively. Regarding the reference [48], they used XGBoost, RF, GNB, DT classifiers, and the Nasarian CAD dataset. Their accuracy is 81.23%. Finally [57], reference used LR, KNN, SVM, Naïve Bayes, DT, RF algorithms, and a Kaggle data set. However, they got 88.52% of accuracy. When these research papers used various kinds of classifiers or algorithms to enhance their accuracy level. Our book system gained 92% of the highest accuracy when comparing our novel system with this system. The classic measure in ML is accuracy. It’s a statistic for assessing the effectiveness of models in categorization tasks. When a novel algorithm achieves the highest accuracy relative to other algorithms, it demonstrates its effectiveness in several ways, including superior performance, robustness, generalization capability, efficiency, innovative approaches, and benchmarking against baselines. These characteristics collectively contribute to establishing the novel algorithm as a promising solution for addressing the target problem in machine learning and related fields. In this sense, our most accurate novel algorithm hits the most effective among other algorithms.
Comparison of accuracy between models
Comparison of accuracy between models
Due to its high fatality rate globally, heart disease has become a severe health problem for numerous persons. By routinely analyzing clinical data, it is possible to recognize cardiovascular issues such as heart attacks, CAD, etc.; early diagnosis of heart illness could save many lives. The cardiovascular ailment known as CAD is well noted for its propensity to cause death. Accurate and early identification of cardiovascular disorders in humans can meaningfully develop the patient’s chance of survival by slowing the course of heart failure. Over time, CAD develops due to plaque buildup in the coronary arteries, partially obstructing blood flow and mainly composed of fibrin, cholesterol, and calcium. By supplying it, coronary arteries enable the human heart to circulate oxygen-rich blood.
Nevertheless, an early prognosis and proper diagnosis will reduce the probability of contracting it. ML enables making exact forecasts and well-informed judgments. The use of ML methods in the health field has improved dramatically. The recommended study uses a novel ML approach to predict CAD illness.
The primary aim of this work is to deliver a state-of-the-art approach to enhancing CAD prediction accuracy by using a DL algorithm in a classification context. To do this, we created an ensemble model based on NB, DT, XGBoost, LR, SVM, KNN, RF, Bidirectional LSTM, CNN, and LSTM. Next, a comparison of the ensemble models’ performance and a novel model’s performance was made. A random sample of 216 CAD patients comprised the Alizadeh Sani dataset used in this research’s trials. This dataset comprises 216 CAD patients and 87 normal individuals with 56 distinct characteristics. To resolve the problem of unbalanced datasets, we applied the adaptive synthetic (ADASYN) approach and the SMOTE. The Chi-square test was then included in the feature selection optimization technique. Several assessment approaches have been used to evaluate performance, including confusion matrix structures, accuracy, AUC, and roc. When the innovative model was used in our investigation, performance significantly improved, yielding a 92% prediction accuracy rate for the identification of CAD.
Footnotes
Conflict of interest
None to report.