
Abstract
Background
Determining the type of arrhythmia is crucial for prevention and early diagnosis of cardiovascular diseases.
Objective
This aims to address potential information loss caused by preprocessing, improve model performance, and accurately identify multiple types of arrhythmias.
Methods
This study proposes the use of wavelet transform denoising and convolutional neural network (CNN) model to classify and identify six types of arrhythmias. The original electrocardiosignal was transformed into a two-dimensional gray image by construction, and the data were amplified by fixed template clipping. Then, six arrhythmias were identified using an improved two-dimensional CNN model.
Results
The classification accuracy, sensitivity, and specificity of the proposed method reached 90.50%, 81.70%, and 97.16%, respectively, and six types of arrhythmias were accurately identified.
Conclusions
The results showed that the wavelet transform as a preprocessing method can effectively improve the classification accuracy of the multiple types of arrhythmias. The method proposed in this study can provide a new reference for clinicians in diagnosing arrhythmia.
Introduction
The incidence and mortality rates of cardiovascular diseases in the global society have increased rapidly year by year, and have surpassed cancer as the “first killer” of human health threats. The situation regarding cardiovascular disease prevention and control in China remains grim. 1 In most patients with cardiovascular diseases, the disease is often accompanied by arrhythmia, and different types of cardiovascular diseases have different arrhythmia characteristics; therefore, in the diagnosis of cardiovascular disease it is crucial to accurately determine the type of arrhythmia. 2
An electrocardiogram (ECG) records the changes in electromotive force, caused by the beating of the heart, on the surface of the human skin and visually reflects the working condition of the patient's heart in image form. Therefore, the electrocardiogram is the most intuitive and convenient tool for diagnosing arrhythmia. 3 The recognition and diagnosis using traditional ECGs mainly rely on the personal experience of doctors, and manual diagnosis is time-consuming and laborious.
With time, using machine learning technology to assist doctors in electrocardiogram diagnosis can quickly process large amounts of ECG data, reducing the burden on doctors’ diagnoses. 4 Common machine learning methods include support vector machines (SVM), 5 random forest, 6 and neural networks. 7 Acharya et al. 8 preprocessed the ECG signals of seven patients with coronary heart disease, 148 patients with myocardial infarction, and 52 controls from the PTB Diagnostic ECG database and the St Petersburg INCART 12-lead ECG database and extracted features using discrete wavelet transforms, empirical mode decomposition, and discrete cosine transform. Combined with the nearest neighbour algorithm for classification, they obtained classification accuracies, sensitivities, and specificities of 98.50%, 99.70%, and 98.50%, respectively. Mohebbanaaz et al. 9 utilised ECG signals to extract seven temporal features and seventeen morphological features, and combined decision trees, optimised decision trees, and adaptive enhanced optimised decision trees to distinguish six types of heartbeats. The experimental results verified that the adaptively enhanced optimised decision tree performed better than the other two methods, achieving a classification accuracy of 98.77%. These studies conducted tedious calculations on the fixed waveform features of the ECG signals, resulting in good classification effects. In traditional machine-learning methods, the impact of early signal analysis and complicated feature extraction on the results is crucial. However, these methods rely on the professional knowledge of special groups and have certain limitations. 10
With the rapid development of artificial intelligence, deep learning has gradually become a popular research topic in cardiovascular disease diagnosis both at home and abroad. Common algorithms include convolutional neural networks (CNN), 11 long short-term memory network (LSTM), 12 recurrent neural networks, 13 and regularized autoencoders. 14 Ribeiro et al. 15 constructed a deep neural network model trained on a large number of labelled signals and used it to classify arrhythmia in 12 lead electrocardiograms. The results showed that it was useful to cardiologists in identifying six types of abnormal heart rhythms, with the F1 score exceeding 80% and specificity exceeding 99%. Zhang et al. 16 proposed a novel wavelet multiresolution convolutional neural network, which avoids the complex process of extracting features of the target signal; an average recognition rate of 93.5% was achieved for classifying the presence or absence of severe heart disease on eight ECG datasets. Kiranyaz et al. 17 proposed an adaptive one-dimensional CNN that integrates the feature extraction and classification of ECGs into a single learning body. A targeted CNN model is trained using individual patient data and is suitable for most ECGs owing to its simplicity and parameter invariance. Yildirim et al. 18 proposed a novel deep learning method for detecting cardiac arrhythmias based on long-term ECG signal analysis, achieving an overall recognition rate of 91.33% for classifying 17 types of cardiac arrhythmias using 10 s ECG signals. Warrick et al. 19 combined CNN and LSTM models and adopted aggregation, elimination, and normalisation techniques to improve the accuracy, achieving an accuracy rate of 82%. Yildirim et al. 20 proposed a nonlinear compression structure based on a convolutional autoencoder that utilises electrocardiogram features to automatically identify arrhythmias and deeply encodes these features with a convolutional autoencoder network. It was verified that using an LSTM network for data analysis could significantly reduce the calculation time of the model and achieve an accuracy of 99.0%. In addition, there were studies that have specifically designed to symbolise ECG signals for processing beat classification in different patients. By jointly representing the shape and rhythm of the beats and combining with baseline correction, the differences in beats between different patients are alleviated. A multiview convolutional neural network is used to classify five arrhythmias in the Massachusetts Institute of Technology Beth Israel Hospital (MIT-BIH) database, with an overall accuracy of 96.40%. 21 These studies indicate that the use of deep-learning technology has significant social value in electrocardiogram diagnosis. However, in existing research, there are few enhancement methods for imbalanced public data, and there are generally problems such as low waveform restoration and loss of denoising information, resulting in poor generalisation ability of the model. Additionally, inappropriate segmentation can easily change the original meaning of the signal.
In this study, one-dimensional ECG signals were converted into two-dimensional images and combined with an improved deep learning model to accurately identify six arrhythmias and assist clinicians in efficiently diagnosing patients with arrhythmias. The main content and research framework of this study are shown in Figure 1.
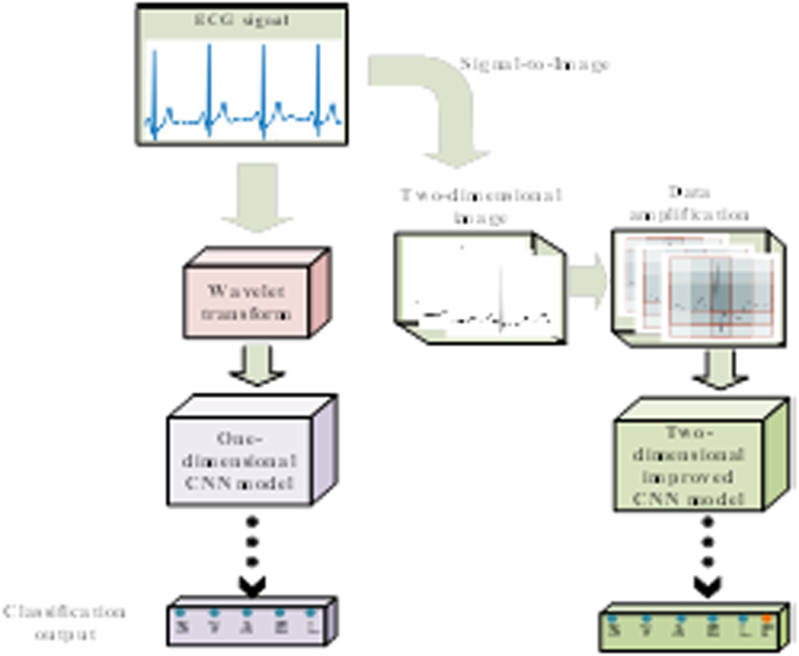
Research framework.
The main work of this study is summarized as follows:
The validity of classification of five arrhythmias using the wavelet transform combined with a one-dimensional CNN model was verified. The effect of wavelet transform pre-treatment on the five arrhythmia classifications was investigated, and the classification accuracies of the model before and after signal pre-treatment were 81.08% and 99.43%, respectively. The effectiveness of converting one-dimensional ECG signals into two-dimensional grayscale images was confirmed. A data enhancement method was proposed to overcome the problem of loss of useful information in the original denoised signal and better reflect the potential feature pattern in the original one-dimensional time series to mine the characteristics of cardiac abnormalities in patients with cardiovascular disease from multiple angles. An improved two-dimensional CNN model combined with the ECG grayscale image method was proposed to classify six types of cardiovascular diseases, effectively solving the problem of heartbeat segmentation. A classification accuracy of 90.49% was achieved using the MIT-BIH database.
The remainder of this paper is organised as follows: Section 2 introduces the data and methods used in this study. Section 3 reports the experimental results. Section 4 discusses the results, and the findings of the study are summarised in Section 5.
Data
Data were obtained from the Massachusetts Institute of Technology Beth Israel Hospital (MIT-BIH) Arrhythmia database. 22 This database contains 48 half-hour excerpts of two-channel ambulatory ECG recordings with a sampling rate of 360 Hz. Twenty-three recordings were chosen randomly from a set of 4000 24-h ambulatory ECG recordings. Each record stores ECG data in three different formats, including a header file (. HEA), an ECG data file (. DAT) and an annotation file (.ATR). The ECG signal was clipped by manual annotation of the .ATR file. Using the R wave point as the reference point, 99 and 200 signal points were intercepted before and after the R point, respectively, to form a complete heartbeat. Meanwhile, other relevant personnel in the laboratory who have experience in data interception also conduct data checks to ensure the validity of the data.The average length of the heartbeats after sampling was 300, with a duration of approximately 0.8 s In addition, a backpropagation (BP) neural network was used to locate the ECG waveform and a db1 wavelet was used to decompose the signal. The number of network training iterations was 1000 times, the minimum error of the training target was set to 0.0002, and the learning rate was set to 0.0003.
Table 1 lists the details of the five arrhythmia beats according to the (AAMI) EC57 criteria. ‘N’ is Normal Sinus Rhythm (NOR)’, V’ is Premature Ventricular Contraction (PVC)’, A’ refers to Atrial Premature Contraction (APC)’, R’ refers to the Right Bundle Branch Block (RBBB)’, L’ is the Left Bundle Branch Block (LBBB), and ‘P’ is the Paced Beat (PAB). 23 The number of samples of ‘N’, ‘V’, ‘A’, ‘R’, ‘L’ and ‘P’ types is 75051, 7130, 2545, 7258, 8074, and 7028, respectively.
MIT-BIH arrhythmia beat information.

MIT-BIH arrhythmia beat information.
Wavelet transform is a time–frequency domain multi-resolution analysis method that can be applied to different fields. It is suitable for nonstationary signal denoising and parameter feature extraction and is an ideal method for ECG signal denoising.
24
The mathematical expression is given in Equation (1).

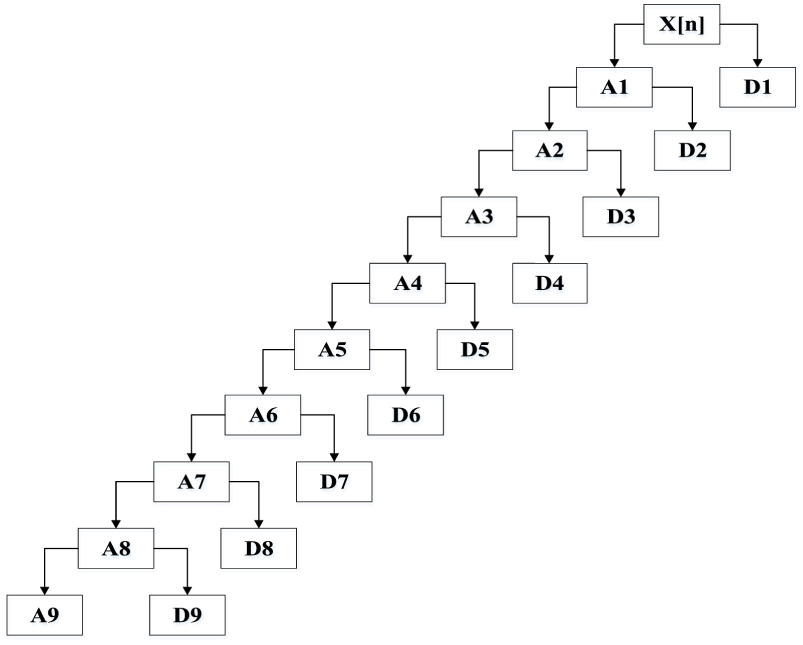
Wavelet transform diagram.
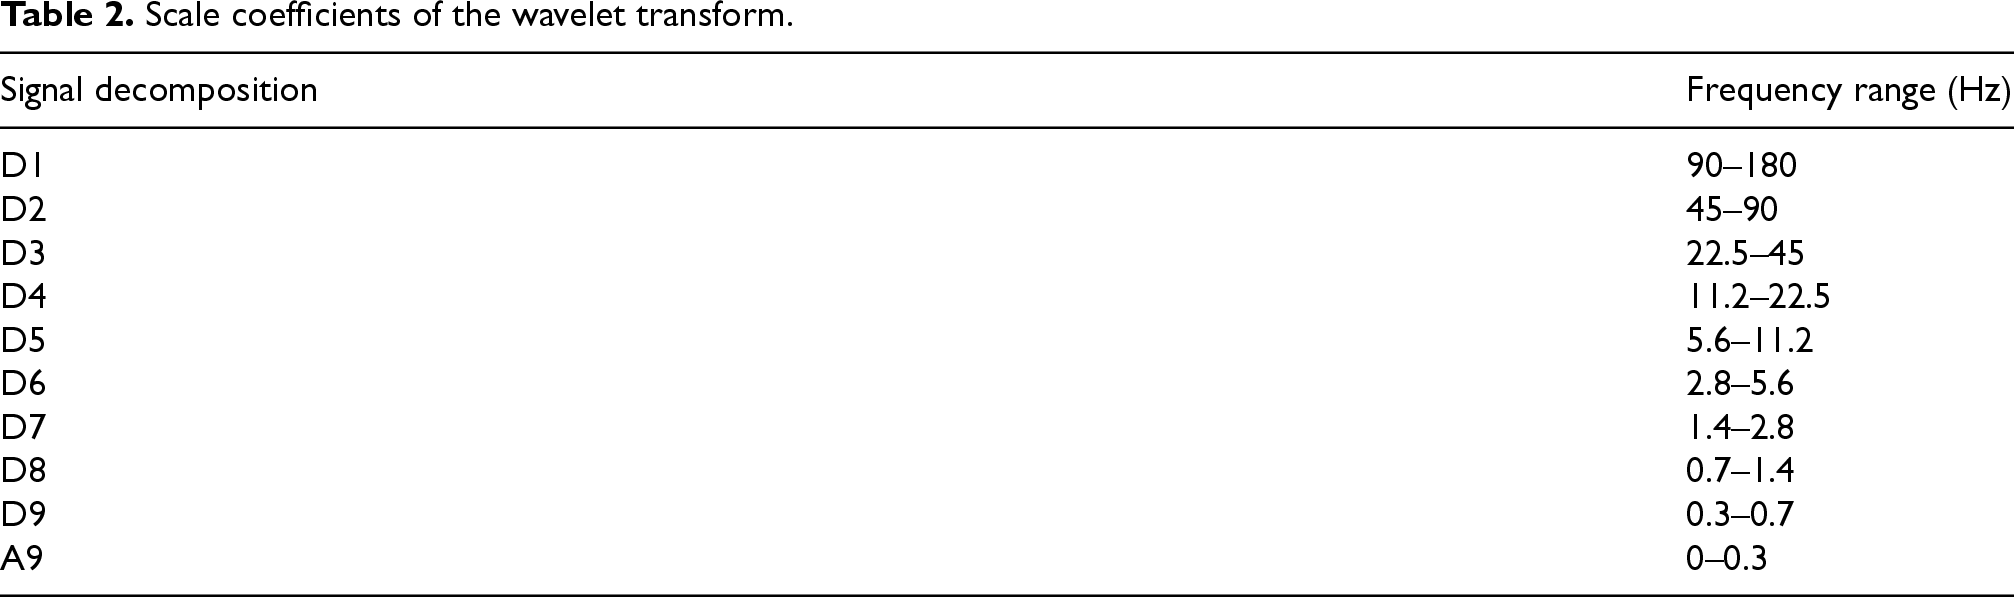
Scale coefficients of the wavelet transform.
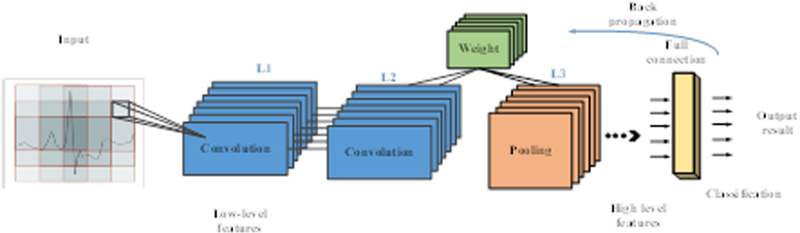
A CNN is a classic deep learning framework mainly used in the fields of computer vision and natural language processing.26–27 During operation, the CNN learns features through the convolutional and pooling layers and then inputs the features into the fully connected layer. After calculating the loss function, the model itself is adjusted through backpropagation of the features to ensure that the model reaches the most accurate state. A typical CNN framework, which includes a convolutional layer, an undersampling layer, and a fully connected layer, is shown in Figure 3. The convolution layer extracts the higher features from the image, and the convolution operation enhances the original signal and reduces noise. In addition, the weights of all the convolution kernels are shared, which significantly reduces the free parameters of the neural network. The subsampling layer extracts features from the feature map output of the convolution layer and then converts the extracted features into a one-dimensional vector as the input to the classifier. The loss function gradient of each weight is calculated using the chain rule and backpropagation algorithm, and the weight is then updated according to the gradient descent formula until the optimal weight and bias are obtained.
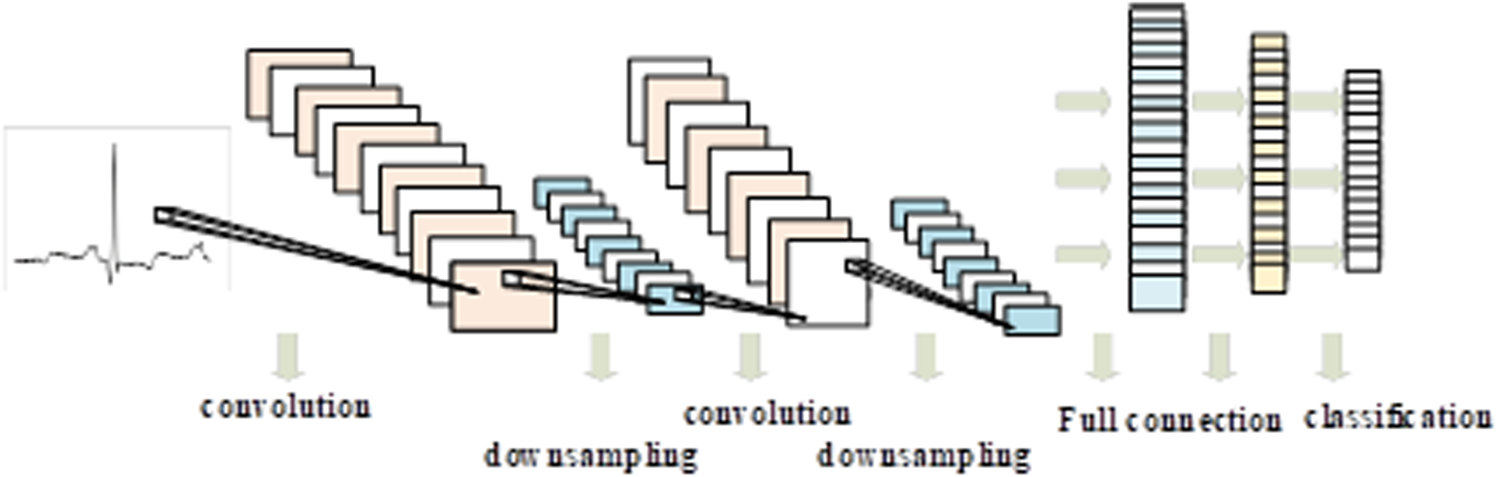
Typical CNN structure.
In this study, a one-dimensional CNN model was used to learn and process the features of the one-dimensional ECG signals. The four convolution kernels and fully connected layer structures consisting of a one-dimensional convolution layer and a pooling layer are sequentially connected. A structural diagram of the model is shown in Figure 4.
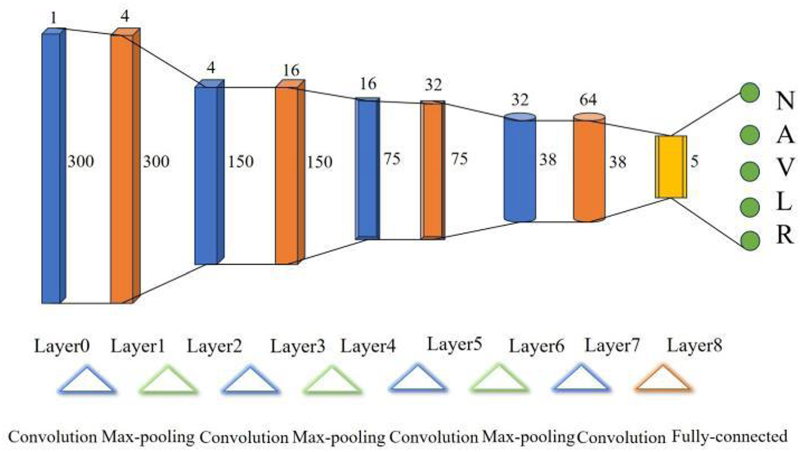
Structure of one-dimensional CNN model.
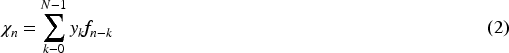
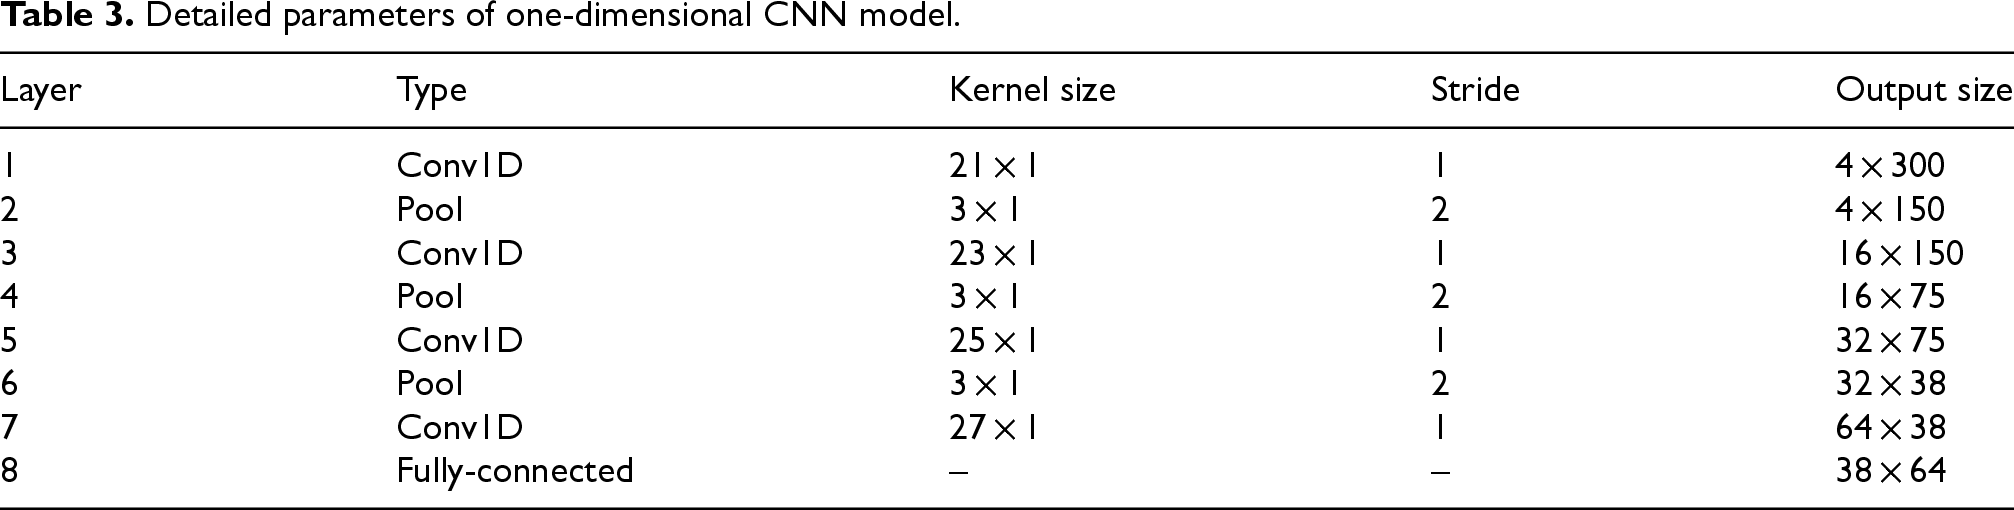
The ECG data are fed into the construction model, the convolution operation with a step size of 1 is carried out through a 21 × 1 convolution kernel, and a 4 × 300 convolution feature map is obtained. After the convolution operation, the generated feature map is fed into a pooling layer with a kernel size of 3 × 1, and a feature map of 4 × 150 is obtained. Subsequently, the feature map, obtained after the four-layer convolutional block operation, is input into the fully connected layer for expansion, and the model is continuously optimised and adjusted by backpropagation. For the selection of the CNN model parameters, the batch size is set to 128, and the learning rate is set to 0.001. The model underwent 30 iterations, and the loss value was calculated using the loss function at each iteration. The detailed parameters of the CNN model are listed in Table 3. The formula for convolution is given by Equation (2).
Detailed parameters of one-dimensional CNN model.
In one-dimensional CNN network training, all the heartbeat signals were read into two one-dimensional lists of the CNN model. Each element label in the array corresponded to a 200-point ECG heartbeat. Abnormal data were excluded. Two one-dimensional lists were combined, out-of-order processing was performed while maintaining the original correspondence, and an initial dataset of 92193 heartbeats to be used for training was generated.
Among the evaluation indicators, the accuracy (Acc), sensitivity (Sen), specificity (Spe), precision (Pre), and F1 were used to evaluate the effectiveness of the model. The formulas for calculating each indicator are given in Equations 3–7.


To further improve the performance of the model, this study proposes method for converting a one-dimensional raw signal to a two-dimensional image which is combined with a two-dimensional CNN model to classify six types of arrhythmias. The research framework is illustrated in Figure 5.
One-dimensional signal to two-dimensional image method
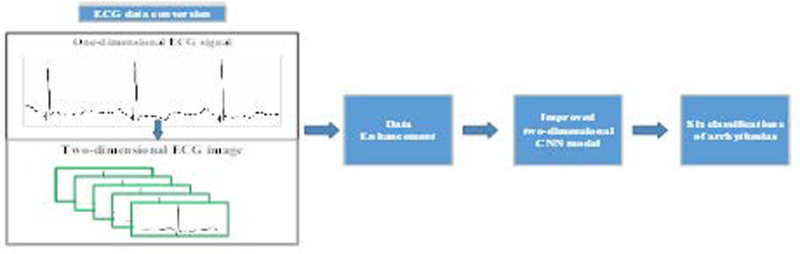
Block diagram of two-dimensional CNN model.
When converting one-dimensional ECG signals into two-dimensional images, Matlab and Python3.8 are used for visual conversion. The image is constructed with time as the X-axis variable and the amplitude corresponding to a given time as the Y-axis variable. When one-dimensional ECG signal data are converted into a two-dimensional matrix, the x-direction is arranged according to the original one-dimensional sampling points. The corresponding amplitude of the sampling point is obtained and the two-dimensional matrix is filled with the corresponding position 1 in the y-direction and 0 in the remaining positions. Thus, the conversion of one-dimensional signal to a two-dimensional image is completed.
To ensure the integrity of each cardiac image, the manually labelled R peaks in the MIT-BIH database are used as reference points for cropping, and 20 data points before and after the middle point of the two R peaks are discarded. The remaining data points were ECG cardiogram images. To expand the data set, six types of heartbeats, including ‘N’, ‘V’, ‘A’, ‘R’, ‘L’, and ‘P’ types, are selected. The paced beat (PAB) type is added. Using the above cutting method, 105,923 128 × 128 single-cardiogram images were obtained.
Data enhancement
In the MIT-BIH database, the number of heartbeats for different disease types is unbalanced. To avoid the influence of this imbalance on classification, except for ‘N’ type, the other types of beat images were clipped in a specific way to achieve the purpose of data amplification. The original 128 × 128 size image was divided nine times according to the 96 × 96 size format, and the heartbeat images of the nine parts were obtained: top left, top middle, top right, middle left, middle right, bottom left, bottom middle, and bottom right. It was then scaled to 128 × 128 pixels to achieve data amplification and maximum feature retention.
After converting the signal into a two-dimensional image and amplifying the heartbeats, the heartbeats in each category were divided into training and testing sets in a 7:3 ratio by stratified sampling, resulting in 108332 image data points for the deep learning network.
Construction of two-dimensional CNN model
The improved two-dimensional CNN model used in this study is shown in Figure 6. The original one-layer convolutional kernel is transformed into three convolutional kernel modules. Each convolution kernel is promoted from a single convolution layer and a pooled layer to a structure of two two-dimensional convolution layers and pooled layers. The fully connected layer structure at the end of the model is unchanged, the features extracted after three two-dimensional convolution layers are fully connected at the end, and the effect of model operation is adjusted by feedback.
Improved CNN model.
In the convolution operation, the two-dimensional graph is regarded as a numerical matrix, and the whole image is scanned by the two-dimensional convolution kernel and the interpretable features are explored. When the input image is square and the size is n × n, the output matrix 
The pooling layers reduce the overall size of the model by pooling, while retaining important features. The internal feature maps of the pooling and convolutional layers are connected, and the number of feature maps for both layers is the same. When the input matrix size of the pooling layer is 
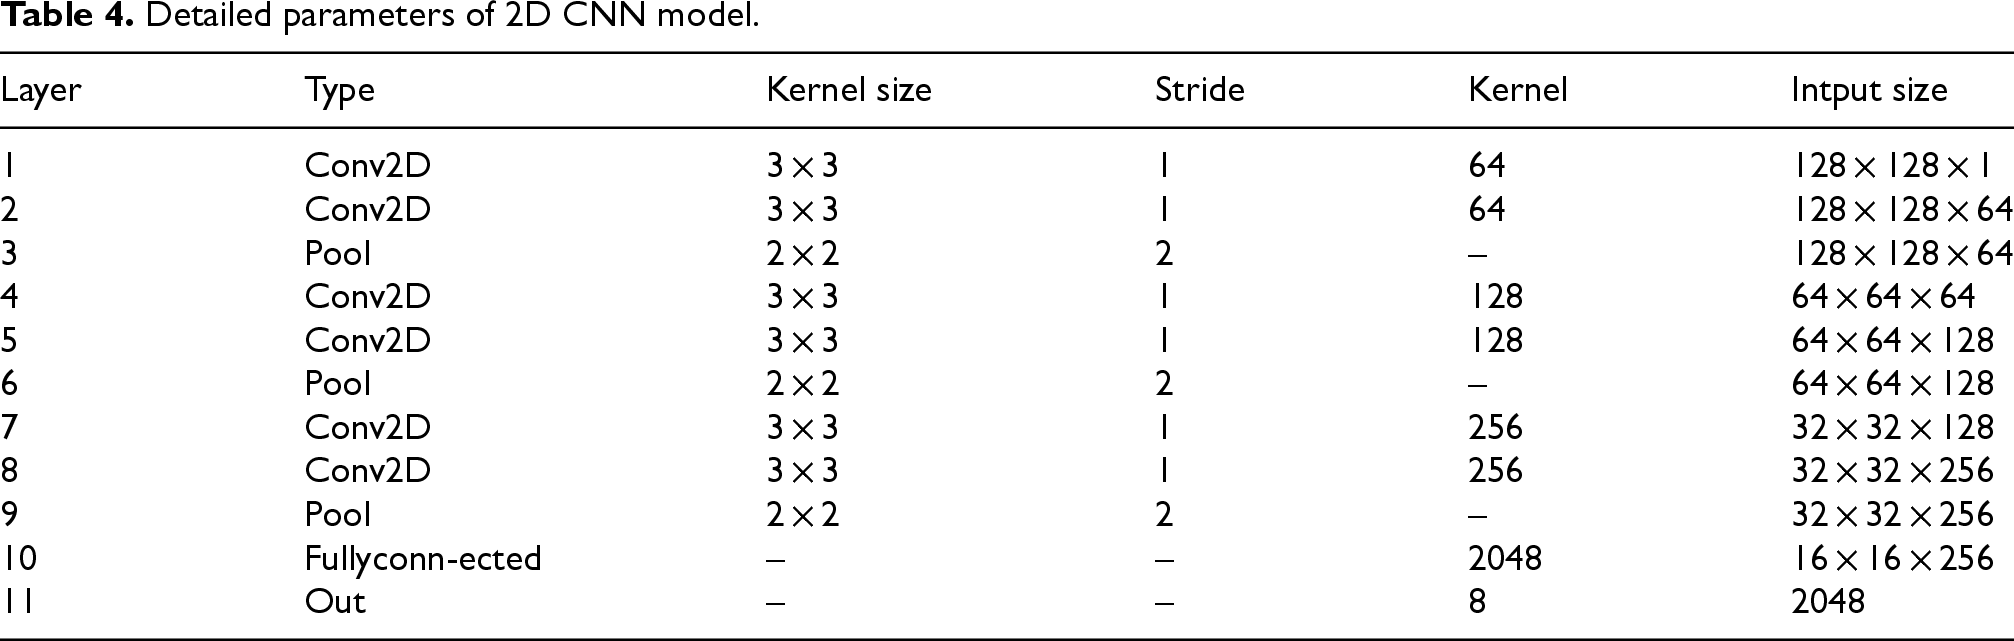
In this study, ECG images with dimensions of 128 pixels × 128 pixels are fed into a 2D CNN model. In the first layer of the convolution block, 3 × 3 convolution checks were performed for the convolution operation of the 2D ECG images, and the pool layer convolution kernel size was set to 2 × 2. The steps of the 2D convolution and pooling layers are set to 1 and 2, respectively. The CNN network was selected with 10 iterations, the model learning speed was accelerated by the GPU operation, and the model learning rate was set to 0.001. The convolution and pooling layers together constitute the feature extractor of the 2D CNN. The detailed parameters of the 2D CNN used are listed in Table 4.
Detailed parameters of 2D CNN model.
This study was conducted using a TensorFlow framework based on deep learning. The working environment of the neural network was the high-level packaged interface Keras software in Python 3.8, Tensorflow 2 installed under Windows 10, and the front-end operation was in Pycharm software. The computer CPU used in this experiment was an Intel Core i9 CPU with a main frequency of 3.6 GHz, 64 GB of memory, and two NVIDIA GTX 1080Ti GPU graphics cards.
Pretreatment results
The first 1500 signal points intercepted before and after the pretreatment were compared, and the results are shown in Figure 7. Compared with the original ECG signal, the preprocessed signal was smooth and free of burrs. It can be seen that wavelet threshold method can effectively remove noise in the ECG signal and obtain pure physiological signal.
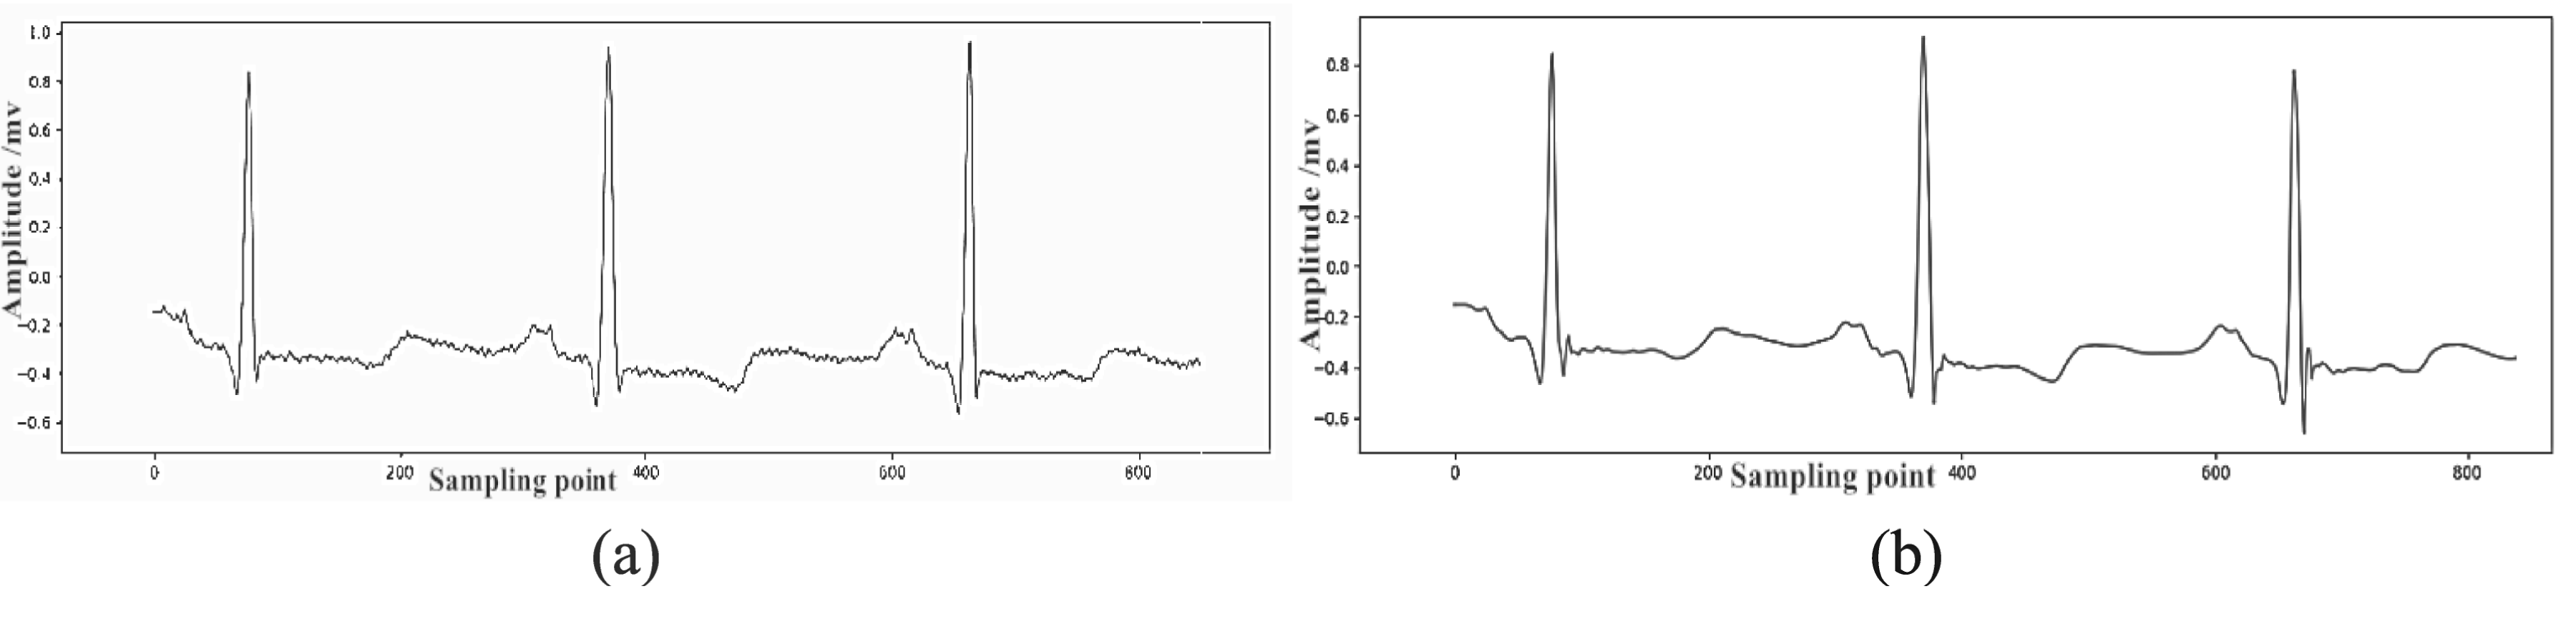
Signal comparison before and after pretreatment. (a) The original ECG signal; (b) Pre-processed ECG signals.
Classification results based on one-dimensional CNN model
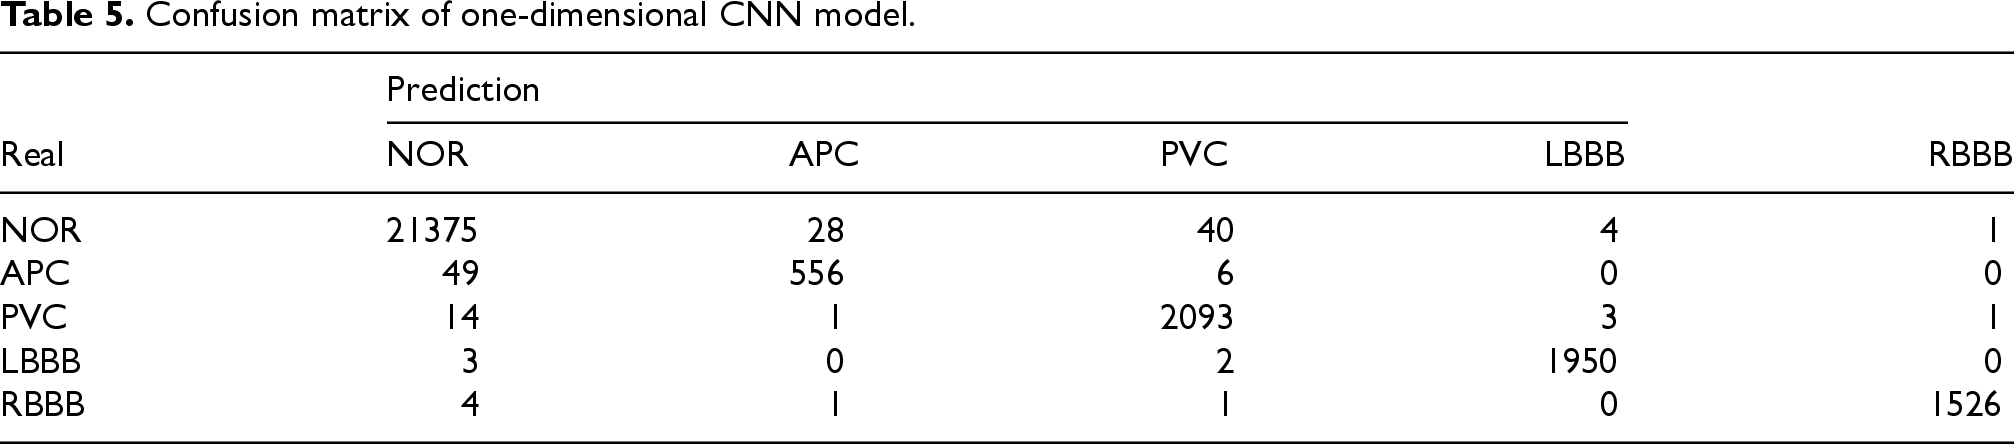
In the experiment, 92193 pieces of data were divided into training and test sets in the ratio of 7:3. The training accuracy and loss rate of the model are shown in Figure 8. The classification confusion matrix of the proposed method for the five types of arrhythmias is presented in Table 5, and the classification results are listed in Table 6.
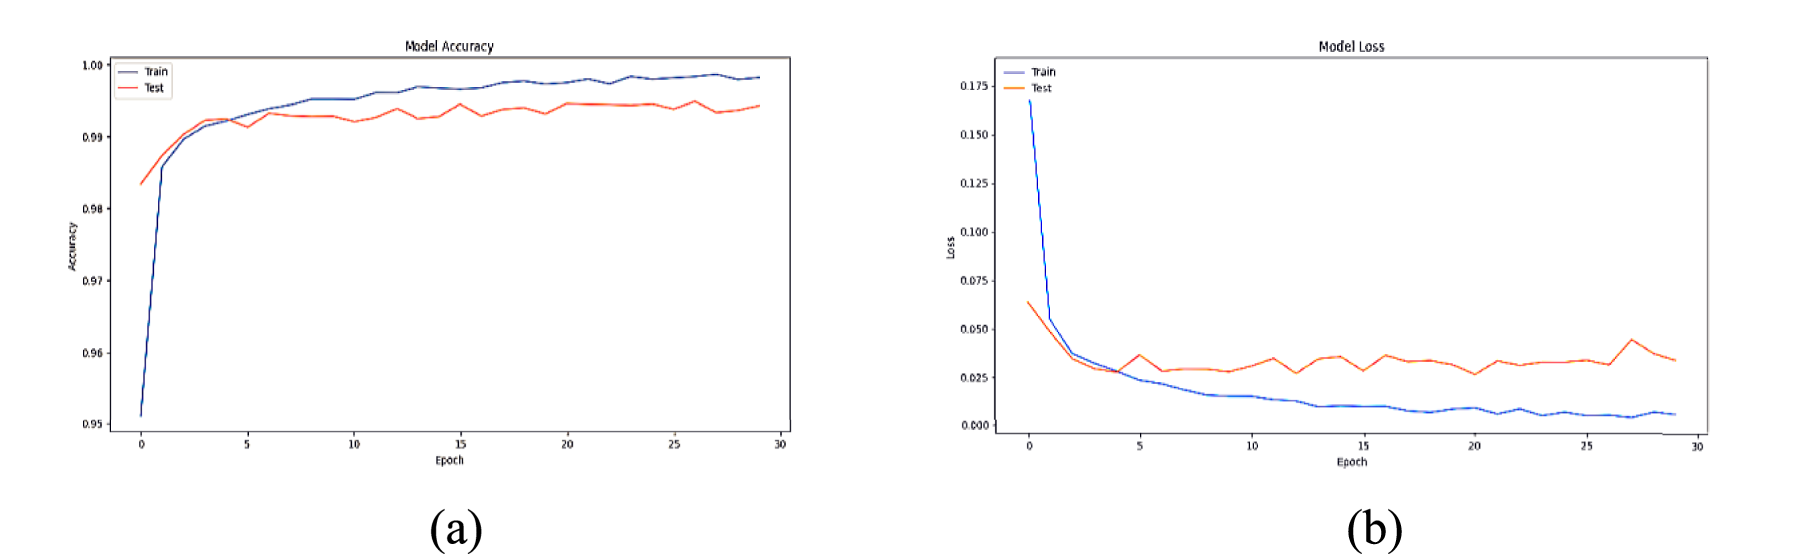
Accuracy and loss rate curves of the model. (a) Accuracy curve of the model; (b) Loss rate curve of the model.
Confusion matrix of one-dimensional CNN model.
Classification results of one-dimensional CNN model.

In the experimental results, wavelet transform denoising combined with QRS group recognition was used to classify the heartbeats. The classification accuracy, sensitivity, and specificity of the one-dimensional CNN model were 99.43%, 97.82% and 99.71%, respectively.
To verify the effect of wavelet transform denoising on the accuracy of the CNN model in recognising multiclass arrhythmias, the original 92193 heartbeat signals were input into the CNN model; the classification accuracy was 81.08%, and the model loss was approximately 0.7505. The experimental results showed that the classification accuracy of the five types of arrhythmias improved by 18.35% using wavelet transforms in combination with a CNN model. The experiment showed that the classification accuracy of the five types of arrhythmias improved by 18.35% using the wavelet transform in combination with the CNN model. The results indicate that the proposed model can significantly improve the classification of five types of arrhythmia.
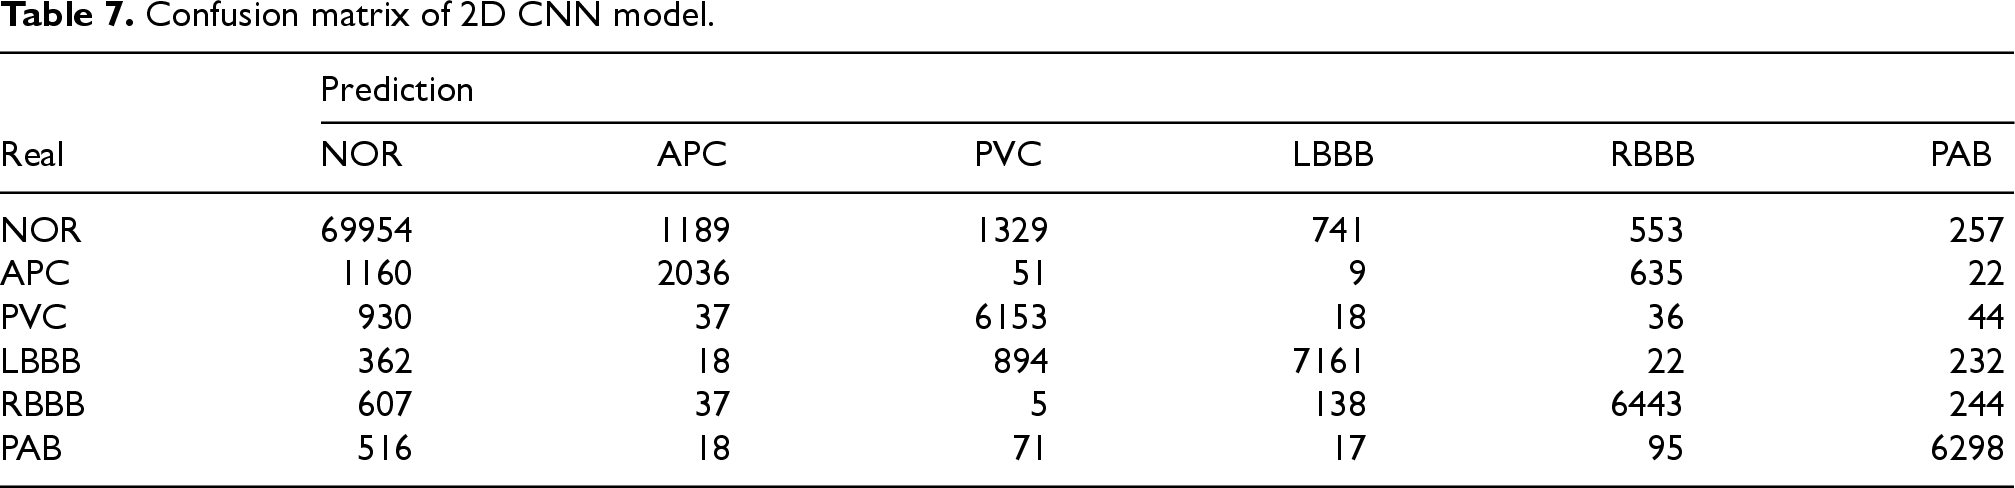
Because of the large sample size of the dataset, the model was selected for 10 iterations, and the training time was 6 h. The classification accuracy, specificity, and sensitivity of the 2D model were 90.50%, 91.01%, and 89.96%, respectively. The results showed that the six types of arrhythmias could be effectively be classified using the constructed two-dimensional ECG image combined with the improved 2D CNN model. Tables 7 and 8 list the confusion matrix and classification accuracy of the 2D CNN model, respectively.
Confusion matrix of 2D CNN model.
Confusion matrix of 2D CNN model.
Classification results of 2D CNN model.

In this study, one-dimensional ECG signals were converted into two-dimensional images and the data were amplified. After the dataset was input into the constructed 2D CNN model, classification accuracy, specificity, and sensitivity of 90.50%, 97.16% and 81.70%, respectively, were obtained. It was proven that the proposed ECG signal transformation method combined with the 2D CNN model has a good effect on the recognition of the six types of arrhythmias. The data are not subjected to noise removal or manual marking operations before conversion, which simplifies the calculation process of ECG signal analysis and processing, reduces the possibility of the one-dimensional ECG data losing some information owing to filtering operations, and ensures the integrity of the ECG data when entering deep learning networks to the greatest extent. The training time of the constructed two-dimensional CNN model was reduced to 6 h, which improved the efficiency of the system. The results show that the proposed method can improve the recognition of the six types of arrhythmias.
Because input image to the 2D CNN model is converted from the original ECG signal, to reduce variables, it is necessary to determine whether the direct conversion of the ECG signal to a two-dimensional ECG image is helpful in improving the classification. Therefore, the calculation results of two-dimensional ECG image combined with the 2D CNN model (six-classification accuracy of 90.50%) and original one-dimensional ECG signal combined with the CNN model (five-classification accuracy of 81.08%) were compared. The results showed that the classification accuracy of the improved 2D CNN model increased by 9.42%, whereas the classification types increased after the ECG signals were graphed, which proved that the method of converting one-dimensional ECG signals into two-dimensional images combined with the improved CNN model in this study was helpful in improving the recognition results of six types of arrhythmias.
It can be seen from Table 8 that the 2D CNN model used in this study achieved good classification results for most heartbeat signals. However, APC has a high confusion rate and yields poor classification results. This may be owing to the small number of APC data samples in the original dataset; the more unbalanced the dataset, the smaller the probability that the network model will correctly classify the beat with a small number of samples. 28 Simultaneously, it is also possible that the waveforms are highly similar to the NOR, which leads to classification errors in the model. Table 5 also shows that 8.1% (49) of the heartbeats were mistaken for the NOR type. The objective of this study was to explore the classification results of the original heartbeat type under near-actual medical conditions. To improve the classification performance of the model, it is necessary to further enhance the data and add different data samples.
The results of this study were compared with those of other relevant studies based on the MIT-BIH database, and the comparison is presented in Table 9. All experimental data in the table were obtained from the MIT-BIH arrhythmia database. In related studies, Murat et al. 29 identified five types of arrhythmias by constructing a CNN and LSTM using 10,022 cardiac beat signals in the arrhythmia database with an accuracy rate of 99.26%. In this study, the normalisation method was used for processing, and the ability of the model to identify the original data was still weak. Hui et al. 30 proposed using the 7-layer mixed model of a CNN kernel to extract local features of the beat and combined it with an extreme learning machine to perform 10-fold cross-validation classification of four types of arrhythmias, achieving a classification accuracy of 99.16%. There were relatively few arrhythmia types in this study, and there is a possibility that the model could learn the data in advance in the ten-fold cross-validation. Liang et al. 3 used a wavelet transform to decompose ECG signals and them combined with recursive maps to convert them into two-dimensional texture images. They adjusted the weight coefficients of the visual converter to identify five types of arrhythmias with an accuracy rate of 97.38%. Zhou et al. 31 proposed a dual-threshold design for the detection of the QRS complex, combined with the CNN method to extract features, and used an extreme learning machine to classify ECG signals, which not only achieved high accuracy but also had good computational efficiency. However, the feature extraction ability of the network is limited; thus, the generalisation ability of the model is not strong. Compared with the above studies, this study uses the CNN model combined with the wavelet transform to classify and identify five types of arrhythmias, and the classification accuracy can reach 99.43%, which is significantly better than that of existing methods. Simultaneously, the one-dimensional signal was transformed into a two-dimensional image to improve the model performance and enhance the model recognition ability, and six types of arrhythmias were identified by the improved CNN model, with a classification accuracy of 90.50%. Using experiments the methods proposed in this study have been compared with several mainstream algorithms, which demonstrates the effectiveness of the proposed methods and can provide practical reference values for clinicians and researchers.
Comparison with existing models.

Comparison with existing models.
This study has several limitations. First, the classification accuracy of the proposed method can be further improved, and the factors affecting the accuracy of the model should be further studied and analysed to reduce the degree of classification confusion for different types of heartbeats. In this study, the classification of heartbeat types was based only on manual identification in the database, and unsupervised learning technology can be applied to the model in subsequent research. Second, the MIT-BIH database should be used to further explore the situation within and between the patient groups. In addition, the database is old and the information is limited; therefore, more information of subjects in different processes, from health to cardiovascular disease, is needed to verify the effectiveness of this method and to analyse the influence of different patients’ diseases and medication histories on the study results.
Under the premise of imbalanced data, this study designed a combination of wavelet transform and a CNN model to achieve efficient classification of five types of arrhythmias, with classification accuracy, sensitivity, and specificity of 99.43%, 97.82%, and 99.71%, respectively. To maximise the preservation of effective information in the original data and improve the classification performance of the model, a method for converting a one-dimensional raw ECG signal to two-dimensional grayscale image conversion method was proposed. Simultaneously, six arrhythmias were classified using the improved 2D CNN model, with a classification accuracy, sensitivity, and specificity of 90.50%, 89.96%, and 91.01%, respectively. The problems of single recognition type, inconsistent data beat scale, and low classification accuracy were effectively solved. Compared to algorithms in the mainstream literature in recent years, the effectiveness of the proposed method has been proven, indicating that it has potential application value in assisting doctors in the diagnosis of cardiovascular diseases.
Footnotes
Acknowledgment
We would like to thank all volunteers and researchers who participated in this study.
Authorship contribution statement
Ethical statement
The data of this study are from the public database and conducted in accordance with the Declaration of Helsinki.
Funding
The authors disclosed receipt of the following financial support for the research, authorship, and/or publication of this article: This work was supported by the Natural Science Foundation of Shandong Province (Nos.ZR2023QF146); and the Traditional Chinese Medicine Science and Technology Foundation of Shandong Province (Q2022052).
Declaration of conflicting interests
The authors declared no potential conflicts of interest with respect to the research, authorship, and/or publication of this article.
Data availability
All data generated or analysed during this study are included in this article. Further enquiries can be directed to the corresponding author.