
Abstract
BACKGROUND:
Lung cancer is the most common type of cancer, accounting for 12.8% of cancer cases worldwide. As initially non-specific symptoms occur, it is difficult to diagnose in the early stages.
OBJECTIVE:
Image processing techniques developed using machine learning methods have played a crucial role in the development of decision support systems. This study aimed to classify benign and malignant lung lesions with a deep learning approach and convolutional neural networks (CNNs).
METHODS:
The image dataset includes 4459 Computed tomography (CT) scans (benign, 2242; malignant, 2217). The research type was retrospective; the case-control analysis. A method based on GoogLeNet architecture, which is one of the deep learning approaches, was used to make maximum inference on images and minimize manual control.
RESULTS:
The dataset used to develop the CNNs model is included in the training (3567) and testing (892) datasets. The model’s highest accuracy rate in the training phase was estimated as 0.98. According to accuracy, sensitivity, specificity, positive predictive value, and negative predictive values of testing data, the highest classification performance ratio was positive predictive value with 0.984.
CONCLUSION:
The deep learning methods are beneficial in the diagnosis and classification of lung cancer through computed tomography images.
Introduction
Lung cancer
Lung cancer is the most common type of cancer, accounting for 12.8% of cancer cases and 17.8% of cancer deaths worldwide [1]. Since lung cancers initially show non-specific symptoms such as fatigue and cough, it is difficult to diagnose in the early stages and only 10% of the patients can be diagnosed at this stage. Since most patients can be diagnosed at stages III and IV, the 5-year survival is
Diagnostic methods in lung cancer are divided into invasive and noninvasive. In noninvasive diagnostic methods, sputum cytology is the most easily available examination for diagnosis in a patient with suspected lung cancer; however, its sensitivity in the diagnosis of lung cancer was 58% and its specificity was 98% [7]. Among the imaging methods, chest radiography is the first method of choice. Computed thoracic tomography (CT) for further examination is a crucial method in the staging and diagnosis of lung cancer. It shows the metastases of the tumor to the mediastinum and other organs. Its use in combination with positron emission tomography increases the rate of tumor detection and the success rate in distinguishing tumors from atelectasis or consolidation [8]. Positron emission tomography-computed tomography (PET-CT) is a method based on the uptake of radioactive 18F-labeled fluoro-deoxy-glucose by tumor cells. Its relevance in detecting lung cancer and its sensitivity to distant metastasis foci are high [9]. In invasive diagnostic methods, in patients with lung cancer, the extent, localization, and staging of the tumor can be determined by bronchoscopy. The pathology studied from the samples taken determines the tumor histology and subtypes. In patients who cannot be diagnosed through bronchoscopy, the diagnosis is made by endobronchial ultrasonography, endoscopic ultrasonography, transthoracic needle biopsy, mediastinoscopy, or surgical biopsy, depending on the lesion site.
In lung cancer, the histopathological type of the tumor; the patient’s age, gender, medical history, and comorbid diseases, pulmonary functions, imaging, and laboratory evaluation are the conditions that guide the treatment. Apart from these conditions, the most crucial step to consider is staging. As the stage increases, the prognosis worsens. CT is a noninvasive method used in the detection and diagnosis of lung cancer [10]. Thus, rapid and accurate interpretation of thorax CT is serious as regards early diagnosis of the disease, directing the detected patients to biopsy, and determining the biopsy site.
Image processing techniques developed using machine learning methods have played a critical role in the development of medical decision support systems. Computer-aided diagnostic methods (CADx) help clinicians make decisions in the healthcare field [11, 12, 13, 14, 15, 16]. Deep learning, which is a machine learning method, is an effective and fast method that involves feature selection, pattern recognition, classification, and regression in big data as a whole [12, 17, 18].
This study aimed to classify benign and malignant lung lesion from CT images with high accuracy with a deep learning approach using the Keras library and convolutional neural networks (CNNs).
Materials and methods
This research is for observational research within the scope of quantitative research. The research was retrospective; the case-control analysis research method was used. This study is within the scope of big data analysis. Modeling will be based on artificial intelligence and statistical significance will not be checked; hence, power analysis is not required. R Studio (version 1.1.453) was used for the classification of thorax CT lesion in this study [19]. The Keras library allows users to easily develop CNN models and frees users from the complexity of these low-level libraries. NVIDIA DGX™ Systems, developed to meet CUDA-supported artificial intelligence and analytics demands, were used as GPU hardware. The steps of the proposed method are indicated in Fig. 1.
The steps of the proposed method.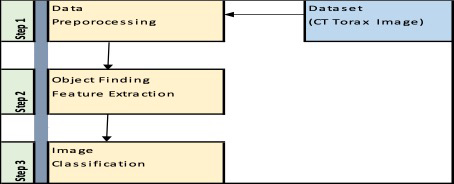
The image dataset includes 4459 CT scans (benign, 2242; malignant, 2217) taken from 40 patients. In the dataset, lung cancer classification was performed based on different patient groups, including treatment history, smoking habits, age, etc., and thoracic CT screening protocol was applied. To provide high-quality images for screening, a high-resolution and powerful CT scanner was used. CT scans of the patients included in the study were performed with a 16-slice multidetector scanner (Toshiba Alexion™/Advance, Toshiba Medical Systems Corporation Nashu, Japan). The thoracic scan included a broad area covering the lungs and mediastinum, from the lower cervical spine to the upper diaphragm. Typically, thin sections ranging from 1 to 3 mm were used to obtain higher-resolution images. Low-dose CT protocols were employed to minimize patient exposure. The sample dataset is shown in Fig. 2. Relevant scans were obtained from the Chest Diseases Department of Recep Tayyip Erdogan University Training and Research Hospital.
Benign and malignant sampling images.
The process of assigning labels to CT images to determine whether they are cancerous or non-cancerous was carried out under the supervision of specialist doctors in the chest diseases department. The quality, clarity and other features of the images were evaluated and the labelling process was carried out. The selected CT images were divided into two groups, cancerous and non-cancerous. After the control process, cancerous images were labeled “1” and non-cancerous images were labeled “0”.
Data split
Before the data split process, the class imbalance issue was checked to ensure a balanced distribution. The data was then divided into two subsets for training and testing. The dataset was split into 80% for training and 20% for testing. During the training process, model learning and weight updates are performed, while in the testing process, performance measurements on previously unseen data, hyperparameter tuning, and overfitting control of the model are examined.
Data preprocessing
The original resolution of each image is 1920
The flowchart of Pseudo-code of moving average filtering [21].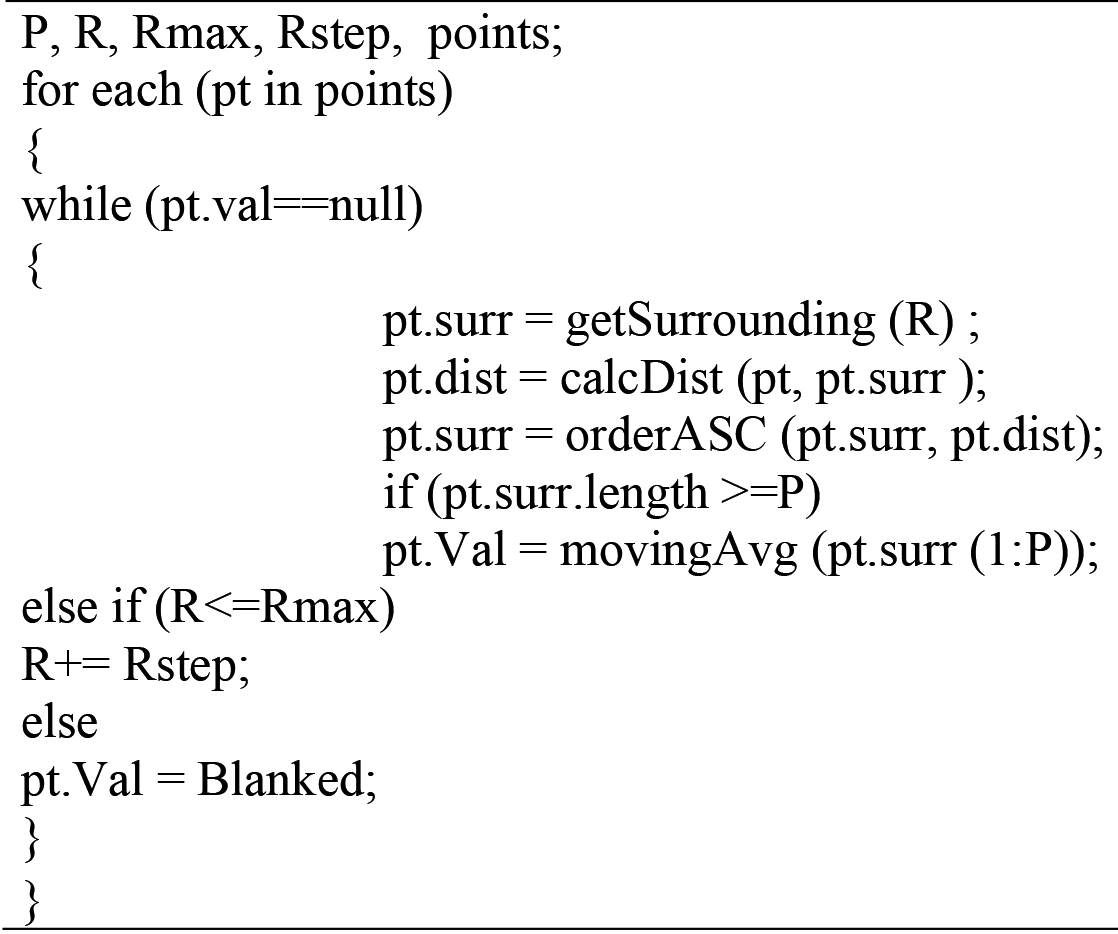
In the dataset, segmentation has not been performed. Instead of directly performing segmentation on the given images, lung cancer detection and classification were carried out by processing the labeled full-sized input images.
This study was approved by the Non-Interventional Clinical Research Ethics Committee of Recep Tayyip Erdogan University Faculty of Medicine, Rize, Turkey (approval date: August 18, 2022, number: 438) and carried out in accord with the Declaration of Helsinki.
Object finding/feature extraction
Transfer learning means using a deep learning model that has been pre-trained in another domain in the target domain (lung cancer detection). The pre-trained model is usually trained on a large dataset and has learnt general features. This model can be adjusted or fine-tuned appropriately for lung cancer detection. In this way, it may be possible to successfully extract features of lung lesions with less data.
In this study, GoogLeNet from deep learning methods were used. It is a multi-layered collection of sensors based on the biological process of the human brain [22]. GoogLeNet is a classic deep learning framework proposed by Szegedy et al. [23, 24]. Unlike the deeper of the network, it will bring negative effects, such as overfitting, gradient vanishing, and gradient burst, to achieve better training performance. GoogLeNet improves training results by using computing resources more efficiently that is, by extracting more features for the same amount of computation [23, 24]. GoogLeNet model consists of one or more layers of convolution, subsampling, and feedforward [25]. In the study, a pre-trained model of GoogleNet (TensorFlow and Keras) was loaded into the system and appropriate hyperparameters were used. The learning rate of the model was set as 0.001, the batch size value for the pre-trained GoogleNet model was set as 32 and the number of epochs was set as 50. Relu and softmax activation functions are implemented in convolution and dense layers, respectively. Adamax optimizer was used as the optimization function [26]. The model hyperparameters chosen for the Adamax algorithm are given as learning rate (0.001), beta_1 (0.9), and beta_2 (0.999). The pooling layers used in GoogleNet were used for average pooling. The GoogleNet system architecture used in the study is indicated in Fig. 4.
Detailed summary representation of the GoogLeNet architecture.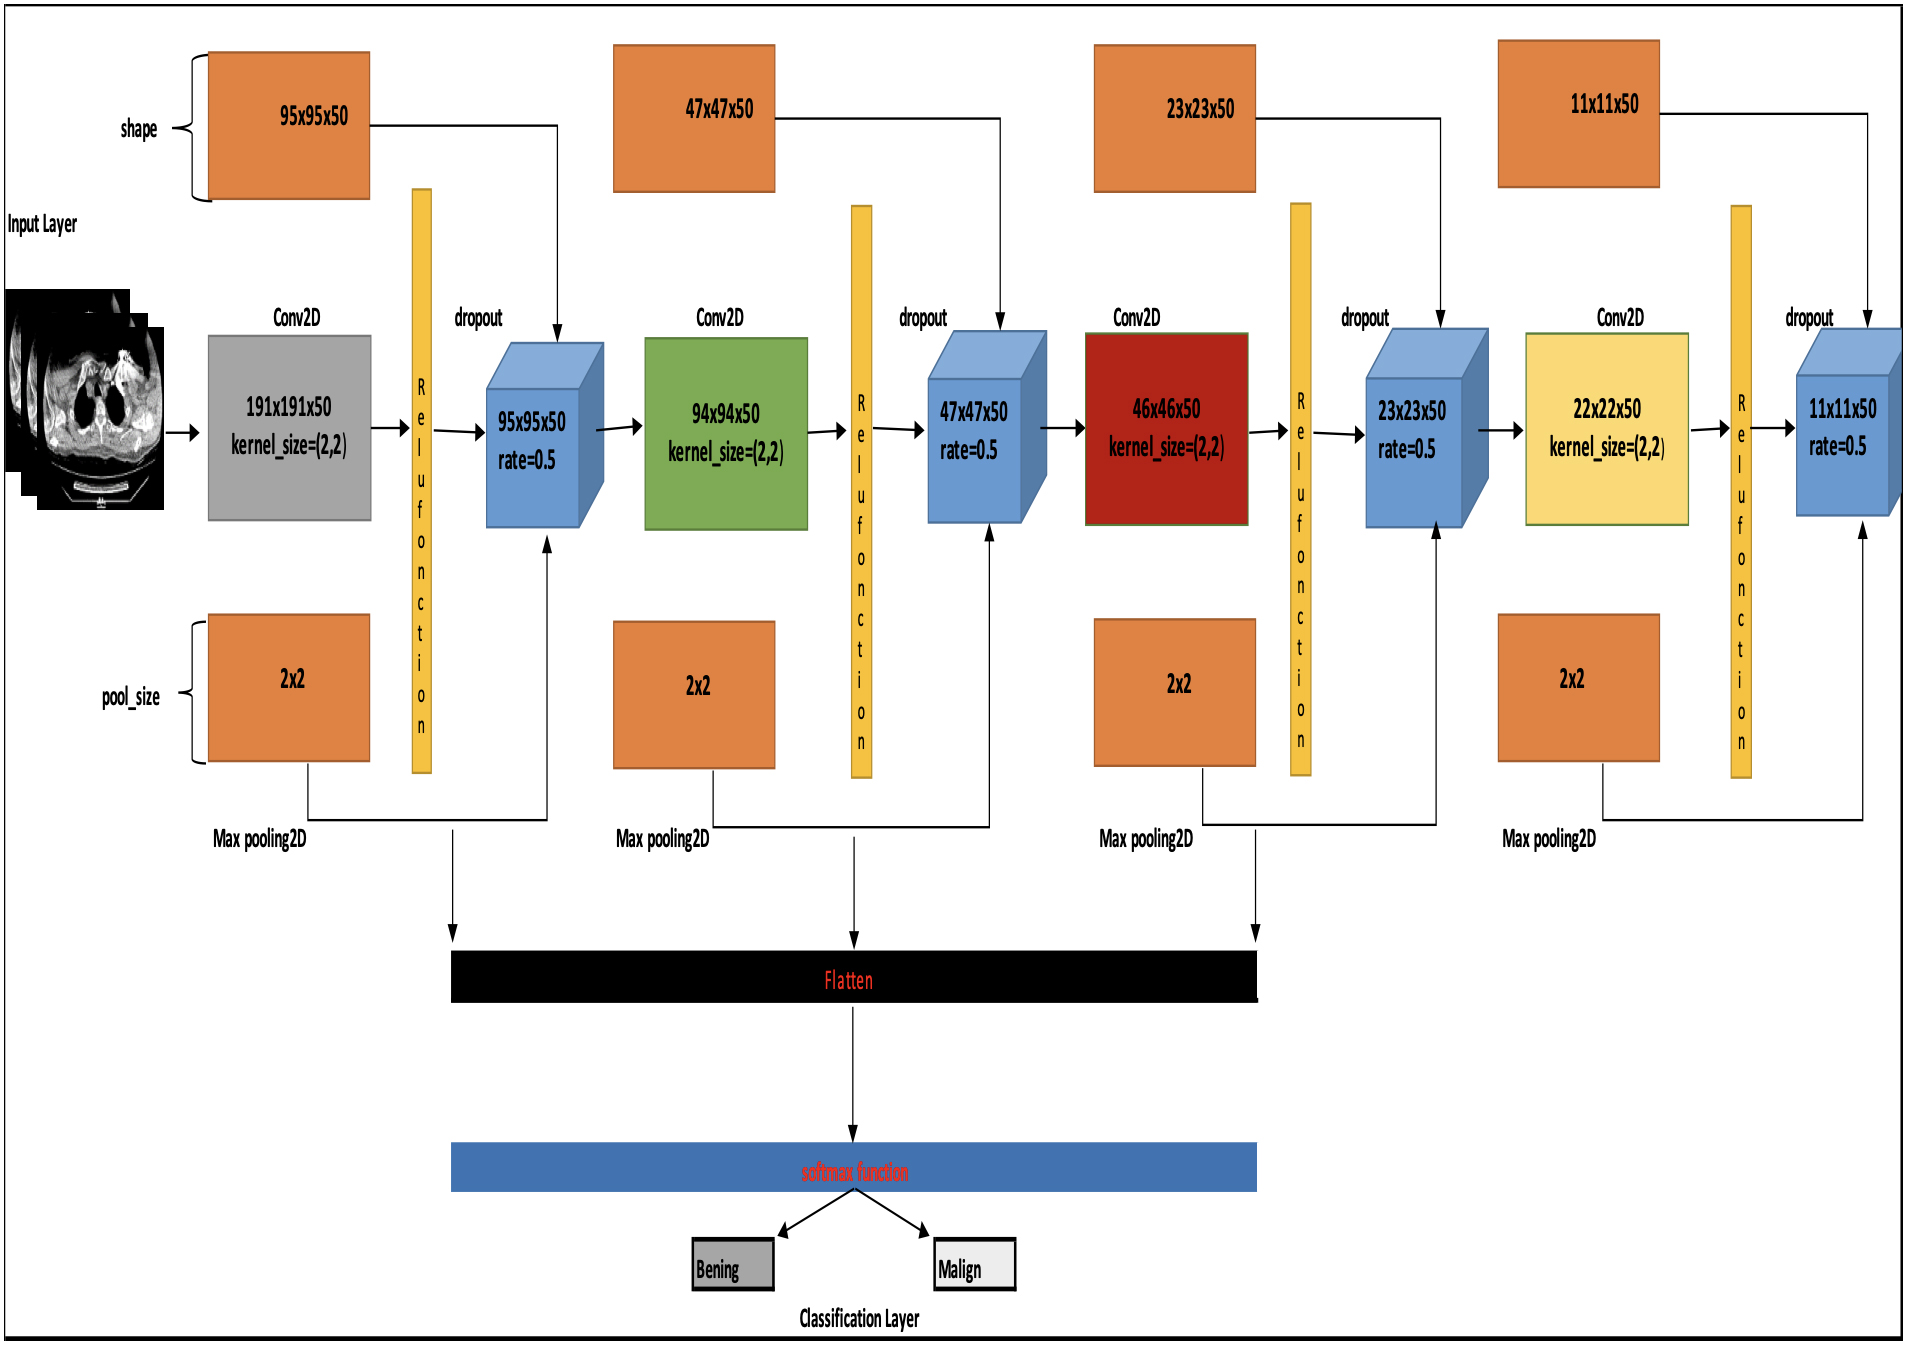
Convolutional Neural Network (CNN) is a class of artificial neural networks that uses convolutional layers to filter inputs for extracting useful information. The convolution operation involves combining input data (feature maps) with a convolution to create a transformed feature map. The filters (kernels) in the convolutional layers are adjusted based on learned parameters to extract the most useful information for a specific task, resulting in a transformed feature map. Convolutional networks are automatically adjusted to find the best features for the task at hand. Applications of Convolutional Neural Networks include various image processing tasks such as image recognition, image classification, video tagging, and text analysis, as well as speech processing tasks like speech recognition, natural language processing, and text classification. They are also utilized in state-of-the-art artificial intelligence systems. Convolutional Neural Networks (CNNs) consist of an input layer, an output layer, and one or more hidden layers. CNNs are a subclass of neural networks that leverage the spatial structure of inputs. They have a standard structure composed of alternating convolutional layers and pooling layers (usually each pooling layer is placed after a convolutional layer) [27]. The architecture of the CNN is shown in Fig. 5 [28].
The architecture of the CNN.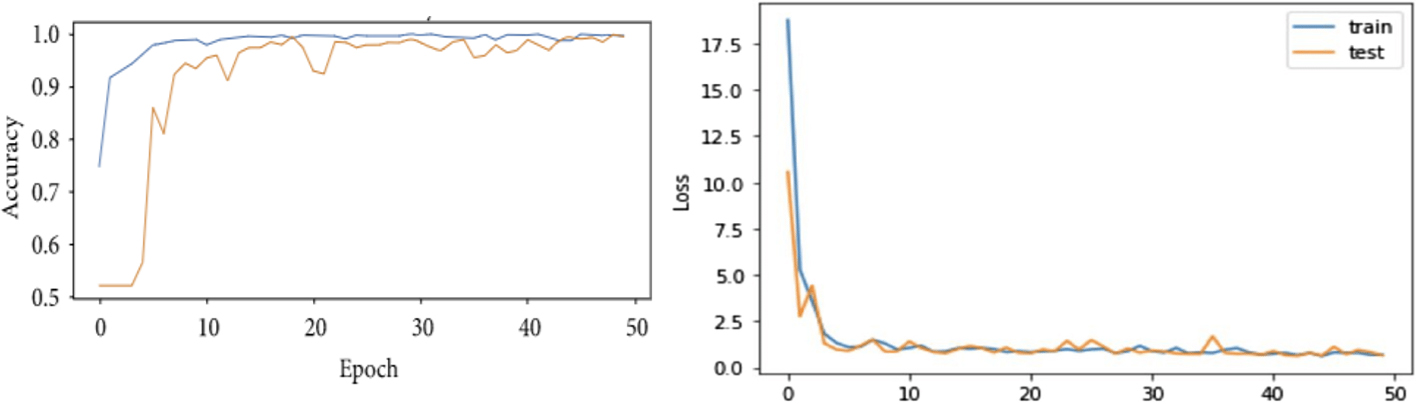
Correct, the convolutional layer consists of a series of learnable kernels or filters that aim to extract local features from the input. Each kernel is used to compute a feature map. The units of the feature maps are only connected to a small region of the input, referred to as the receptive field. A new feature map is typically created by sliding a filter over the input and computing the dot product (similar to the convolution operation), followed by the addition of a non-linear activation function to introduce non-linearity to the model. All units share the same weights (filters) among each feature map. The advantage of weight sharing is the reduced number of parameters and the ability to detect the same feature independently of its location in the inputs [29]. There are several nonlinear activation functions available, such as Sigmoid, tanh, and Relu. The size of the output feature map depends on the filter size and the stride, given an input image of size (H x H), when convolving it with a filter of size (F x F) and a stride (S), the output size (W x W) is given by [30];
Pooling or downsampling layer reduces the resolution of the previous feature maps. Pooling provides invariance for small transformations and distortions. It divides the inputs into disjoint regions of size (R x R) to produce one output from each region. Pooling can be max-based or average-based. If a specific input is fed into a pooling layer of size (W x W), the output size is obtained as follows [31];
Correct, the top layers of CNNs are one or more fully connected layers similar to a feedforward neural network that aim to extract high-level features from the inputs. The units in these layers are connected to all the hidden units in the previous layer. The last layer is a softmax classifier that predicts the posterior probabilities of each class label over the K classes, as shown in Equation [30, 32];
The detailed workflow diagram of the study architecture.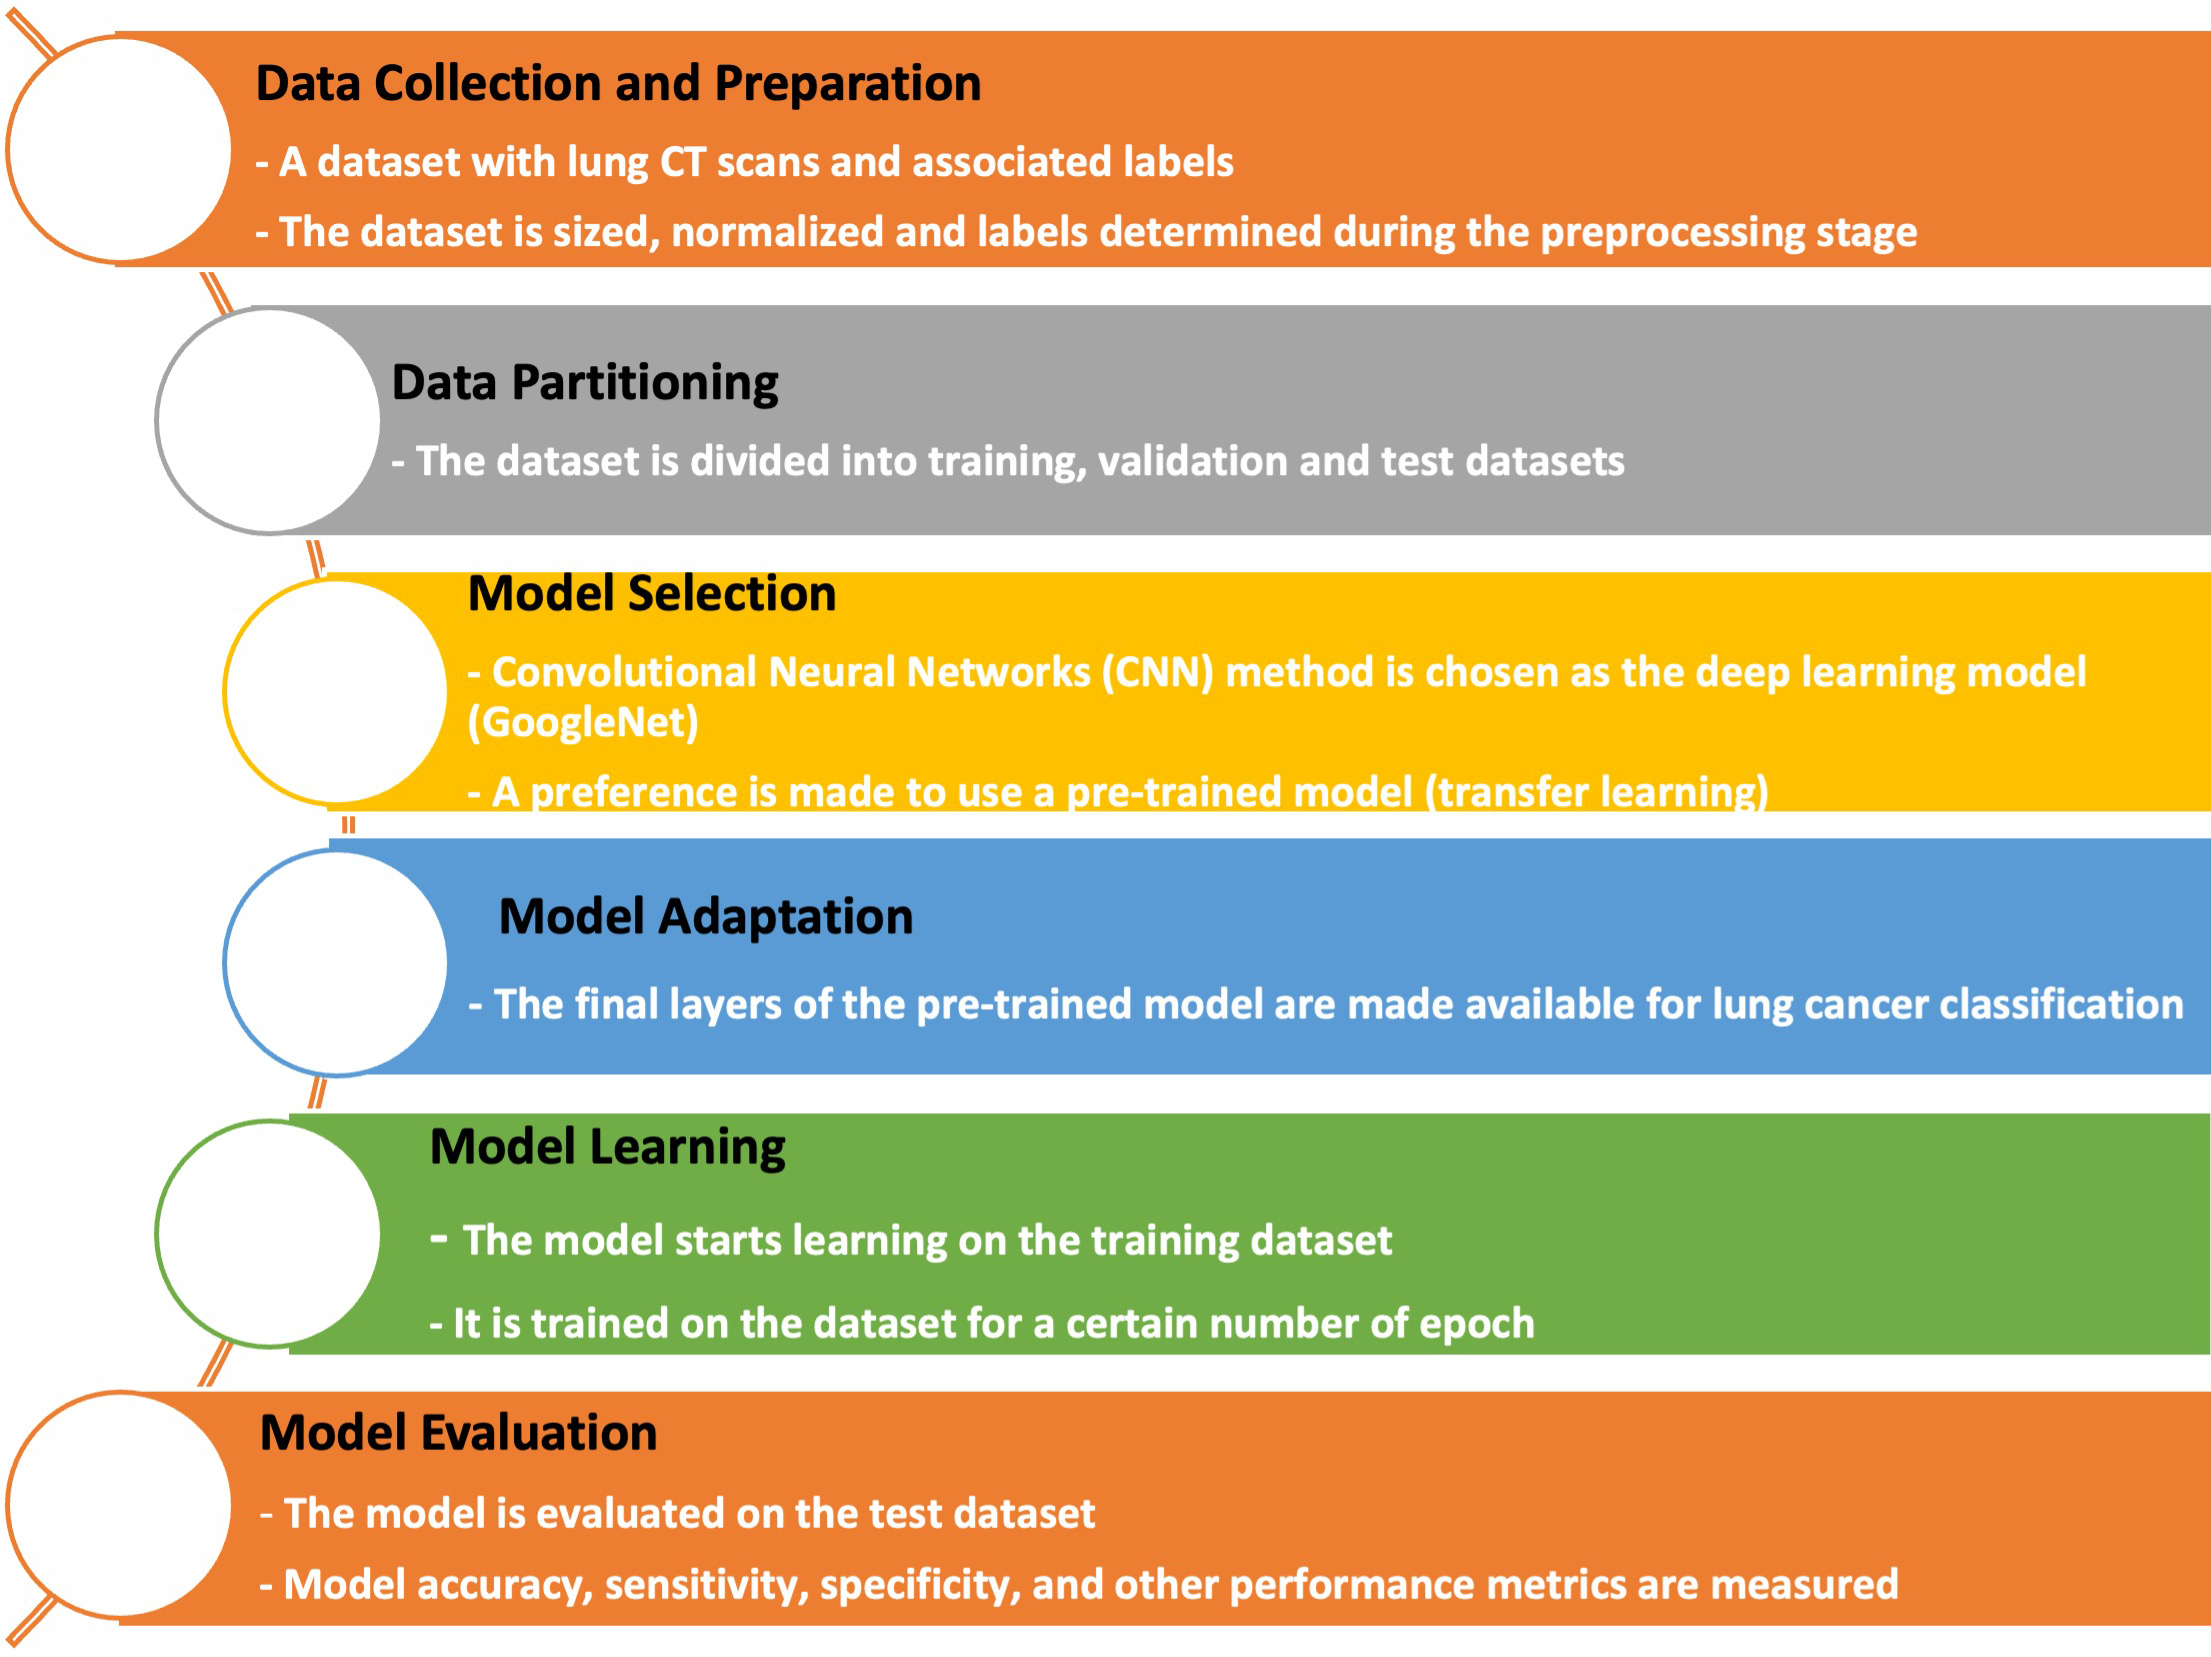
Classification performance of patient images during the training and testing phases and 95% confidence interval values will be given with accuracy, sensitivity, reliability, and positive and negative prediction metrics. The following formulation is used to calculate performance metrics. Accuracy
Results
The dataset used to develop the GoogLeNet model included the training (3567) and testing (892) datasets. The classification accuracy and loss performance graphs for each epoch created during the training phase of the model with the GoogLeNet algorithm are shown in Fig. 7. The highest accuracy rate of the model in the training phase was estimated as 0.98.
The classification accuracy and loss performance graphs for each epoch.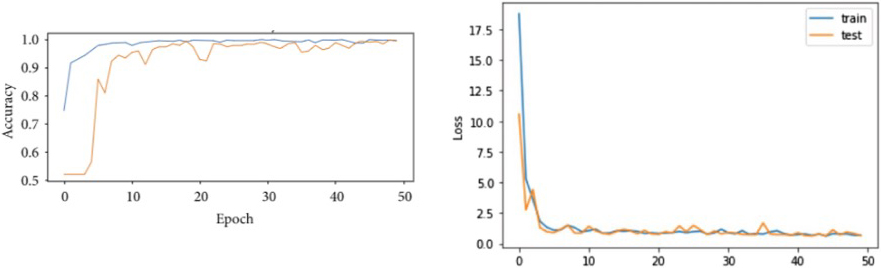
Confusion matrix and performance metrics of model.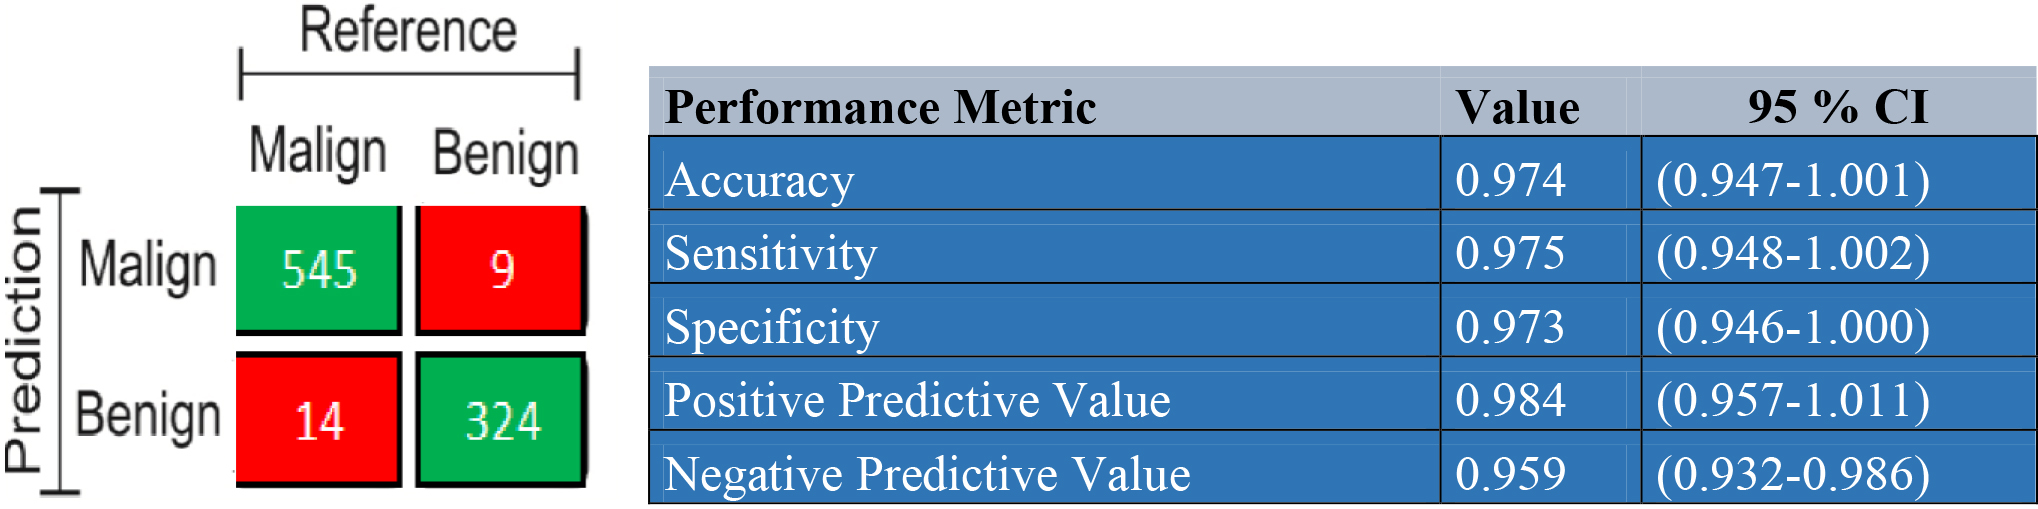
The confusion matrix and performance metrics of the classification obtained by the test data and the GoogLeNet model are given in Fig. 8. According to accuracy, sensitivity, specificity, positive predictive value, and negative predictive values, the highest classification performance ratio was positive predictive value with 0.984.
This study aimed to classify lung lesions as benign and malignant with high accuracy using a structured GoogLeNet model based on thorax CT images. The use of machine learning methods and image processing techniques in the healthcare field has been gradually increasing. These methods should be continuously developed and updated because large amounts of data significantly affect classification performance. Deep learning approaches such as multi-layer neural networks provide higher classification performance from large data sizes and give better results than classical machine learning methods.
Considering the recent studies obtained from thorax CT images with deep learning methods, in Tao et al.’s prediction of future images of lung lesions as growth modeling by follow-up computed tomography scans using deep learning: a retrospective cohort, performance in distinguishing lesions by applying a CNNs to 246 images of 313 lung lesions with at least one follow-up CT scan. In the area under the ROC curve, they obtained values of 0.857 and 0.843 [33]. In another study from Zhu et al. a different method used by authors. As a result of that study the super-pixels and the level set segmentation methods show that the proposed algorithm has a high accuracy for lung cancer detection in CT images [15].
Rustam et al. developed a classification with a CNNs model from 400 scanned images of 150 healthy and 250 patients. The model produced accurate results with a classification performance of 98.5% [34].
Anthimopoulos et al. used the CNNs model for the classification of interstitial lung diseases in their study; 85.5% classification performance was achieved using a dataset of 14696 image patches from 120 CT scans from different scanners and hospitals [35].
Dansana et al. used VGG on a dataset of 360 images, 295 of which are images, X-ray, and CT scan images. They used the CNNs method for binary classification pneumonia based on conversion of VGG-19, Inception_V2, and Decision tree model and achieved 91% classification performance [36].
In this study, the classification of thorax CT images is a crucial difference, thanks to the GoogLeNet architecture. The results of the GoogLeNet algorithm used in the study showed that the classification performance of benign and malignant lung lesions based on thorax CT images is high. Therefore, the algorithm is recommended to be used in the classification of benign and malignant lung lesions. Additionally, a system was created in which the model can be trained with more patient images and evaluation can be made with various performance metrics.
Conclusion
In the study of lung cancer diagnosis and classification based on computed tomography images, we performed analyses using CNNs, one of the deep learning approaches. We passed the dataset of 2242 benign and 2217 malignant tumors of 40 patients from the Recep Tayyip Erdogan University Chest Disease clinic through the layers in the CNNs algorithm. Relu and softmax activation functions are implemented in convolution and dense layers, respectively. Adamax optimizer was used as the optimization function. We used the moving average method, which is one of the liner smoothing filtering methods. Experimental results showed 0.974 accuracy rate, 0.975 sensitivity, 0.973 Specificity, 0.984 positive predictive value, and 0.959 negative predictive values with our proposed method. The results indicate that deep learning methods are beneficial in the diagnosis and classification of lung cancer through computed tomography images and that similar studies can be conducted in the future.
As a result, it is recommended to use these systems in clinical decision support processes by obtaining successful results with the CNNs algorithm in the detection of lung lesions (benign/malignant) based on thorax CT images.
Footnotes
Acknowledgments
The authors have no acknowledgments.
Conflict of interest
The authors have no competing interests to declare.
Funding
None to report.