



Abstract
Measuring public service effectiveness has become a central issue for public authorities worldwide, often driven by governmental pressures to ensure value for money. In this context, social media data represent a potential powerful tool in the hands of public authorities to support the evaluation of public service performance. By relying on an action research project in the higher education field, this study explores how social media data can contribute to measure service effectiveness by focusing specifically on Twitter in the higher education field. The final aim of the paper is to develop a set of measures, derived from Twitter data, to quantify the effectiveness of higher education services. This investigation supports a broader discussion about the extent to which social media data can contribute to performance measurement in the public sector.
Keywords
Introduction
Measuring performance in the public sector was a central issue of the new public management (NPM) reforms dating back to 1990s (Hood, 1991, 1995) and is still a challenge for governments and academics (e.g. Matthews, 2016; Stejskal and Hájek, 2015). Among the various performance measures that can be analysed, effectiveness plays a central role, since it indicates whether a given public service meets user expectations (Boland and Fowler, 2000; Boyne, 2003). From the content of public sector reforms and number of academic papers debating these matters, it is clear that performance measurement and service effectiveness are of topical interest (e.g. Agasisti and Bonomi, 2014; Arena et al., 2010; Cutler, 2011; Johnsen, 2005; Matthews, 2016; Pettersen, 2015; Talbot, 1999). Although measuring performance is not new in the literature covering the public sector, its importance has revived with the potential offered by big data (Gandomi and Haider, 2015; George et al., 2014; Lavertu, 2016). The key features of big data are high volumes of data, the high speed with which data are generated and the great variety of data formats, including, alongside traditional excel spreadsheets, data from sensors, mobile phones and social media (Gandomi and Haider, 2015; McAfee and Brynjolfsson, 2012).
Social media data are a particular category of big data and are defined as a set of online tools centred on social interactions that generate a huge amount of user data (Kaplan and Haenlein, 2010). Among the main characteristics of social media are a more democratic access to communication channels, the generation of data in real time and the high level of interactivity, creating the conditions for establishing communities of users (Arnaboldi and Coget, 2016; Gao et al., 2011; Kaplan and Haenlein, 2010). Public authorities worldwide are endorsing these social tools, largely because they are free. Although the literature on how public authorities are implementing and using social media is expanding (e.g. Agostino and Arnaboldi, 2016; Kim et al., 2014; Lev-On and Steinfeld, 2015; Waters and Williams, 2011), there are still few contributions on the potential of social media data in terms of measuring how effective a given service is. The reason for this is because of the overriding interest in technical issues about how data are collected and analysed (e.g. Agostino and Sidorova, 2016; Archak et al., 2011; Bhardwaj et al., 2014; Netzer et al., 2012; Nguyen et al., 2014; Thelwall et al., 2010), rather than on how this data can be used for management purposes to measure performance. The importance of extracting value from these new types of data has been widely acknowledged: ‘categorizing big data, assessing its quality, and identifying its impact is radically new in social sciences’ (George et al., 2014: 324)
Starting from this premise, the aim of this paper is to gain an understanding of how social media data can contribute towards measuring the effectiveness of public sector services, focusing specifically on Twitter in the field of higher education. The ultimate objective of the paper is to develop a set of measures, based on data obtained from Twitter, to quantify the effectiveness of services provided within the domain of higher education. This investigation can support a broader discussion concerning the extent to which social media data can contribute towards measuring performance in the public sector.
This factor is significant at two different levels. First, while there is widespread recognition about the importance of exploiting social media data and finding value in the conversations taking place on social media (Criado et al., 2013; Gandomi and Haider, 2015; George et al., 2014), most extant literature is concerned with how well public authorities use these tools, rather than on how social media data can help to measure performance in the public sector. Second, studies on social media in the field of higher education are mainly interested in looking at the benefits of these tools, and how widely used they are for the purposes of advancing teaching and learning, and for improving library services, recruitment processes, marketing and student enrolment (e.g. Bélanger et al., 2013; Constantinides and Stagno, 2011; Manca and Ranieri, 2016; Palmer, 2013). The possibility of using social media to gain information about the effectiveness of the services on offer, bypassing the need for student and staff surveys, is in general much neglected.
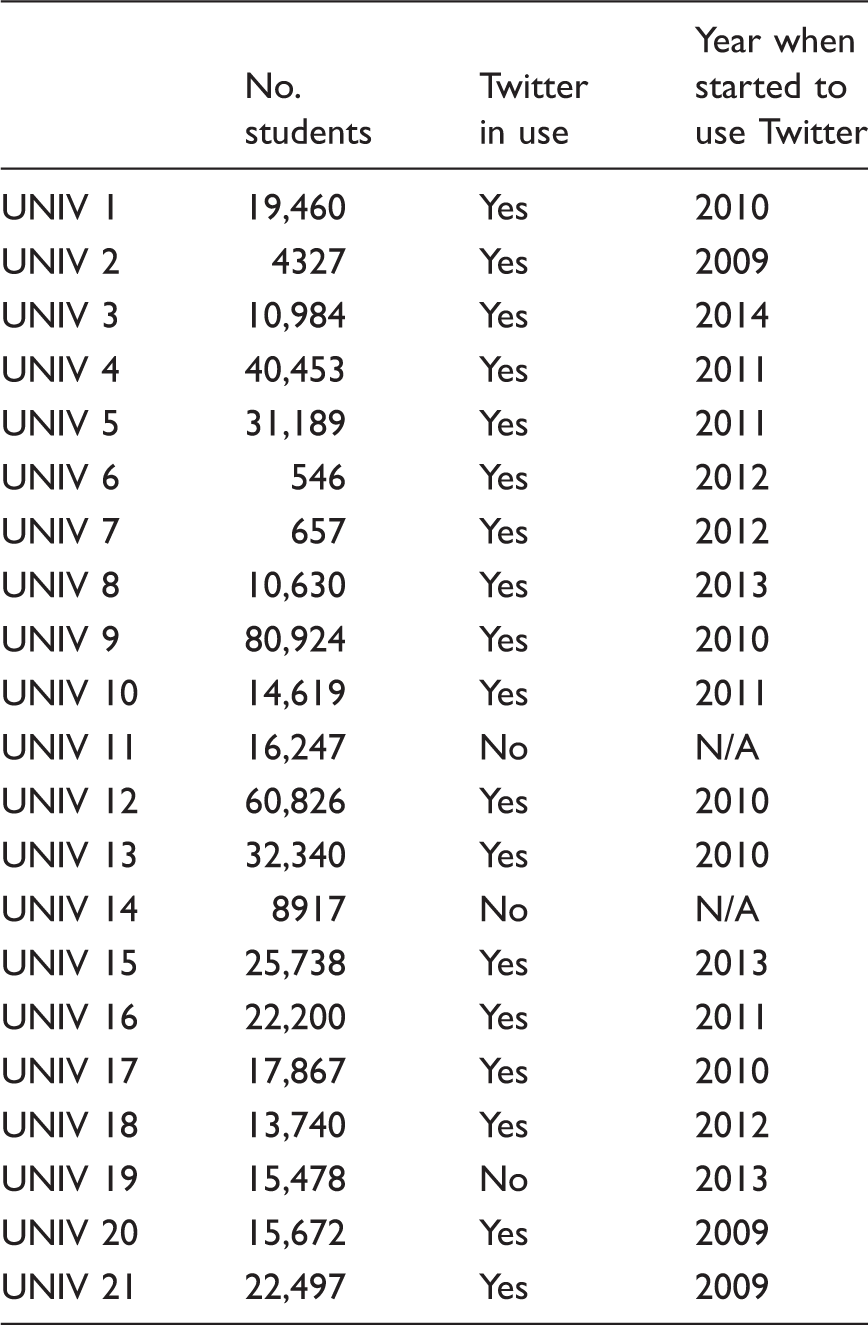
From a methodological point of view, we set up an action research project, with the involvement of 21 Italian universities. A literature review was first carried out, together with interviews and other forms of interaction with university administrative staff and governance officials, which provide the basis for establishing a set of Twitter-based measures for quantifying service effectiveness. The framework was then applied to the universities taking part in the project, a process that involved downloading their Twitter dataset, computing the proposed measures and actively discussing the potential and limitations with the participants.
From the results, we can propose a framework composed of four different measures (i.e. discriminant ratio, non-official account ratio, temporal ratio and polarity ratio), whereby Twitter data are used to quantify the effectiveness of university services. The benefits and limitations of this framework are also discussed in connection with its application to Italian universities.
The rest of the paper is articulated as follows. The next section contains a review of extant literature concerned with the role of social media in supporting performance measurement. The action research methodology is then described, followed by the results of the project. The main contributions of this paper are discussed in the concluding section of the article.
Social media and performance measurement in the public sector: Linking two streams of analysis
This section contains a review of extant studies on social media within the public sector, with particular attention to contributions relating to the interconnection between measuring performance in the public sector and measuring social media. This section is divided into two parts, the former focusing on the measurement of performance in the public sector, and the latter on the type of measures that can be derived from social media.
Performance measurement in the public sector
Measuring performance has become of primary concern to public sector scholars in several European, American and Eastern countries (Blackman et al., 2006; Matthews, 2016; Moynihan and Pandey, 2010; Van Helden et al., 2008) because of the requirement to ensure value for money. NPM theory and the more recent new public governance (Hood, 1991; Osborne, 2006) have prompted public administrations at all governmental levels to use their resources more effectively and provide services of value to the community. This, in turn, has led to performance measurement and performance management systems becoming adopted widely, and they have become recurrent topics of investigation in public sector literature (e.g. Arena et al., 2010; Cutler, 2011; Johnsen, 2005; Matthews, 2016; Pettersen, 2015; Talbot, 1999). The input–output model, with its focus on measures of efficiency, effectiveness and economy, has become a common reference framework for classifying and analysing performance measures for public services (Jackson and Palmer, 1992; Pollanen, 2005). Efficiency measures compare the output of the service provided with the resources used to produce the service. Effectiveness measures evaluate the output of the service provided, and economy measures are related to the inputs used. Among these measures, effectiveness has attracted most academic attention, giving rise to a lively debate on how public service effectiveness can be measured and managed (e.g. Arena et al., 2010; Boyne, 2003; Dužević and Čeh Časni, 2015; Evans, 2013; Forbes and Lynn, 2005; Hodgson et al., 2007; Lægreid et al., 2006; Mansour et al., 2015; Osborne et al., 2015). One of the more recent contributions by Osborne et al. (2015), in particular, highlights that, for public bodies, it is of primary concern to rely on measures of effectiveness (rather than on measures of efficiency only), since they can be used to create value for users and ensure long-term sustainability. Despite the importance of measuring service effectiveness, there is still a level of criticism with regards to the complexity of quantifying this measure: ‘this is because a public service is without material substance and is therefore difficult to convert into units of performance’ (Stejskal and Hájek, 2015: 145). Given this limitation, most studies that try to measure service effectiveness do so through surveys sent to service users, and so evaluate the users’ perception about the public service being delivered (e.g. Arena et al., 2010; Brochado, 2009; Sarrico and Rosa, 2014).
Several contributions focus specifically on measuring performance in the field of higher education; these recognise the importance of measuring service effectiveness with reference both to the primary activity of teaching and research (e.g. Agasisti and Bonomi, 2014; Evans, 2013; Pettersen, 2015) and to support services (e.g. Arena et al., 2010; Craig, 2014; Dužević and Čeh Časni, 2015). In current studies, ‘traditional’ organisational data is used as the main source of information for performance measurement purposes, neglecting by and large the potential of social media data. On the contrary, social media have become an emergent field of investigation in terms of how this new technology can support teaching and learning, library services, recruitment, marketing and the students’ enrolment process (e.g. Bélanger et al., 2013; Constantinides and Stagno, 2011; Manca and Ranieri, 2016; Palmer, 2013).
In this paper, we tackle social media from a different perspective, by considering the contribution of social media data towards the measurement of performance, with particular reference to the effectiveness of higher education services.
Social media measurement in public administration
Social media data are a particular category of big data and are defined as a set of online tools centred on social interaction that generate a huge amount of user data (Kaplan and Haenlein, 2010). They comprise a variety of platforms, which range from social networks such as Facebook and Twitter, to video and photo sharing platforms such as YouTube or Pinterest, and wikis like Wikipedia or blogs. Despite the wide variety of tools known under the umbrella term of social media, they all share the common feature of users actively generating content in real time (Chun and Luna-Reyes, 2012).
The diffusion of social media is a worldwide phenomenon and has prompted several investigations into how these tools can be exploited and how value can be created from these new types of data (Criado et al., 2013; Gandomi and Haider, 2015; George et al., 2014). When specifically looking at social media in the public sector, more and more literature is emerging. These works are mainly explorative and based on case studies, providing preliminary evidence on how local authorities and other public sector institutions are exploiting the new social tools (e.g. Bertot et al., 2012; Bonsón et al., 2012; Grimmelikhuijsen and Meijer, 2015; Mergel and Bretschneider, 2013; Waters and Williams, 2011). Their findings are basically twofold. First, public authorities tend to use social media as traditional communication tools, rather than exploiting their interactive features (Bonsón et al., 2012; Campbell et al., 2014), and, conversely, the general public exploits social media with intentions connected to political mobilisation and/or legitimation, calling public authorities to account for their actions (Bekkers et al., 2011; Grimmelikhuijsen and Meijer, 2015). Second, it is possible to identify several phases and steps within the process of adopting and implementing social media (Mergel and Bretschneider, 2013), as well as policies concerning the use of social media at local administration level (Bertot et al., 2012).
Alongside this increasing use of social media by the public sector, there is an emerging stream of literature concerned with measuring social media. In this respect, several studies propose a set of measures that can evaluate the public sector’s capacity in using social media (e.g. Agostino and Arnaboldi, 2016; Bonsón et al., 2012; Campbell et al., 2014; Grimmelikhuijsen and Meijer, 2015; Lev-On and Steinfeld, 2015). For example, in the study by Bonsón et al. (2012), the authors developed a sophistication index to evaluate how extensively public authorities use social media. In a similar vein, Agostino and Arnaboldi (2016) developed a popularity and commitment indicator for evaluating the ability of municipalities to engage with the general public through social media. These studies are concerned with examining how well public bodies use social media, providing several specific measures for the purpose. While, however, these measures show how effectively social media are used, they do not evaluate the performance of public services.
The aim of our paper is to address this gap by connecting the two streams of literature relating to social media and to performance measurement in the public sector. More specifically, we aim to understand how social media data can contribute towards measuring the effectiveness of public services, by analysing Twitter posts within the field of higher education.
We decided to focus on service effectiveness because of the inherent feature of social media, that of being a tool in the hands of users. It is, therefore, highly probable that the users’ perceptions about a given service can be gleaned from social media data, potentially helping to measure that service’s effectiveness. Three distinctive features of social media come into play when measuring service effectiveness: democratic access to communication channels, real-time generation of data and interactivity. First, social media ensure that users have democratic access to communication channels, thereby rebalancing the power between those who broadcast and those who receive information (Arnaboldi and Coget, 2016). This means that users have a voice and can comment and offer their opinion, and even, in some exacerbated outbursts, encourage mass mobilisation on political topics (Bekkers et al., 2011).
Second, social media data are generated in real time, so users can give their comments and opinions 24/7. This has increased ‘the speed with which information about events is created, circulated and commented upon’ (Arnaboldi and Coget, 2016: 2). Due to this increasing rapidity, social media managers must monitor social platforms continuously, not only during office hours. On the other hand, social media have shown themselves to be priceless in the management of disasters, such as earthquakes and hurricanes (Freberg et al., 2013; Gao et al., 2011). Third, social media, being based on Web 2.0 technology, ensure interactivity, allowing public bodies to dialogue with and involve a participating public (Bonsón et al., 2012). Because of these three features, social media are particularly suited to collecting users’ opinions, a fact favouring the measurement of public service effectiveness.
Finally, our specific focus on the field of higher education is driven by the spreading of social media among young people, above all, and the general recognition that digital technologies are an ‘expected part of the routines of academic study and wider campus life’ (Henderson et al., 2015: 308). For this reason, we considered the higher education field as a representative public sector field to be investigated in connection with exploiting social media data for the purposes of performance measurement.
Methodology
In exploring how social media data can contribute towards measuring service effectiveness, we based our work on action research. The distinctive feature of this methodological approach is that action research ‘seeks to bring together action and reflection, theory and practice, in participation with others, in the pursuit of practical solutions to issues of pressing concern to people, and more generally the flourishing of individual persons and their communities’ (Reason and Bradbury, 2001: 1). It follows that action research can be used to address a practitioner problem that is also of interest to academics. The practitioner problem in our specific setting is the need felt by universities about whether data obtained from Twitter have the potential to evaluate the performance of their services. This problem is linked to the academic urgency of ‘categorizing big data, assessing its quality, and identifying its impact’ (George et al., 2014: 324).
List of participant universities
Phases of analysis
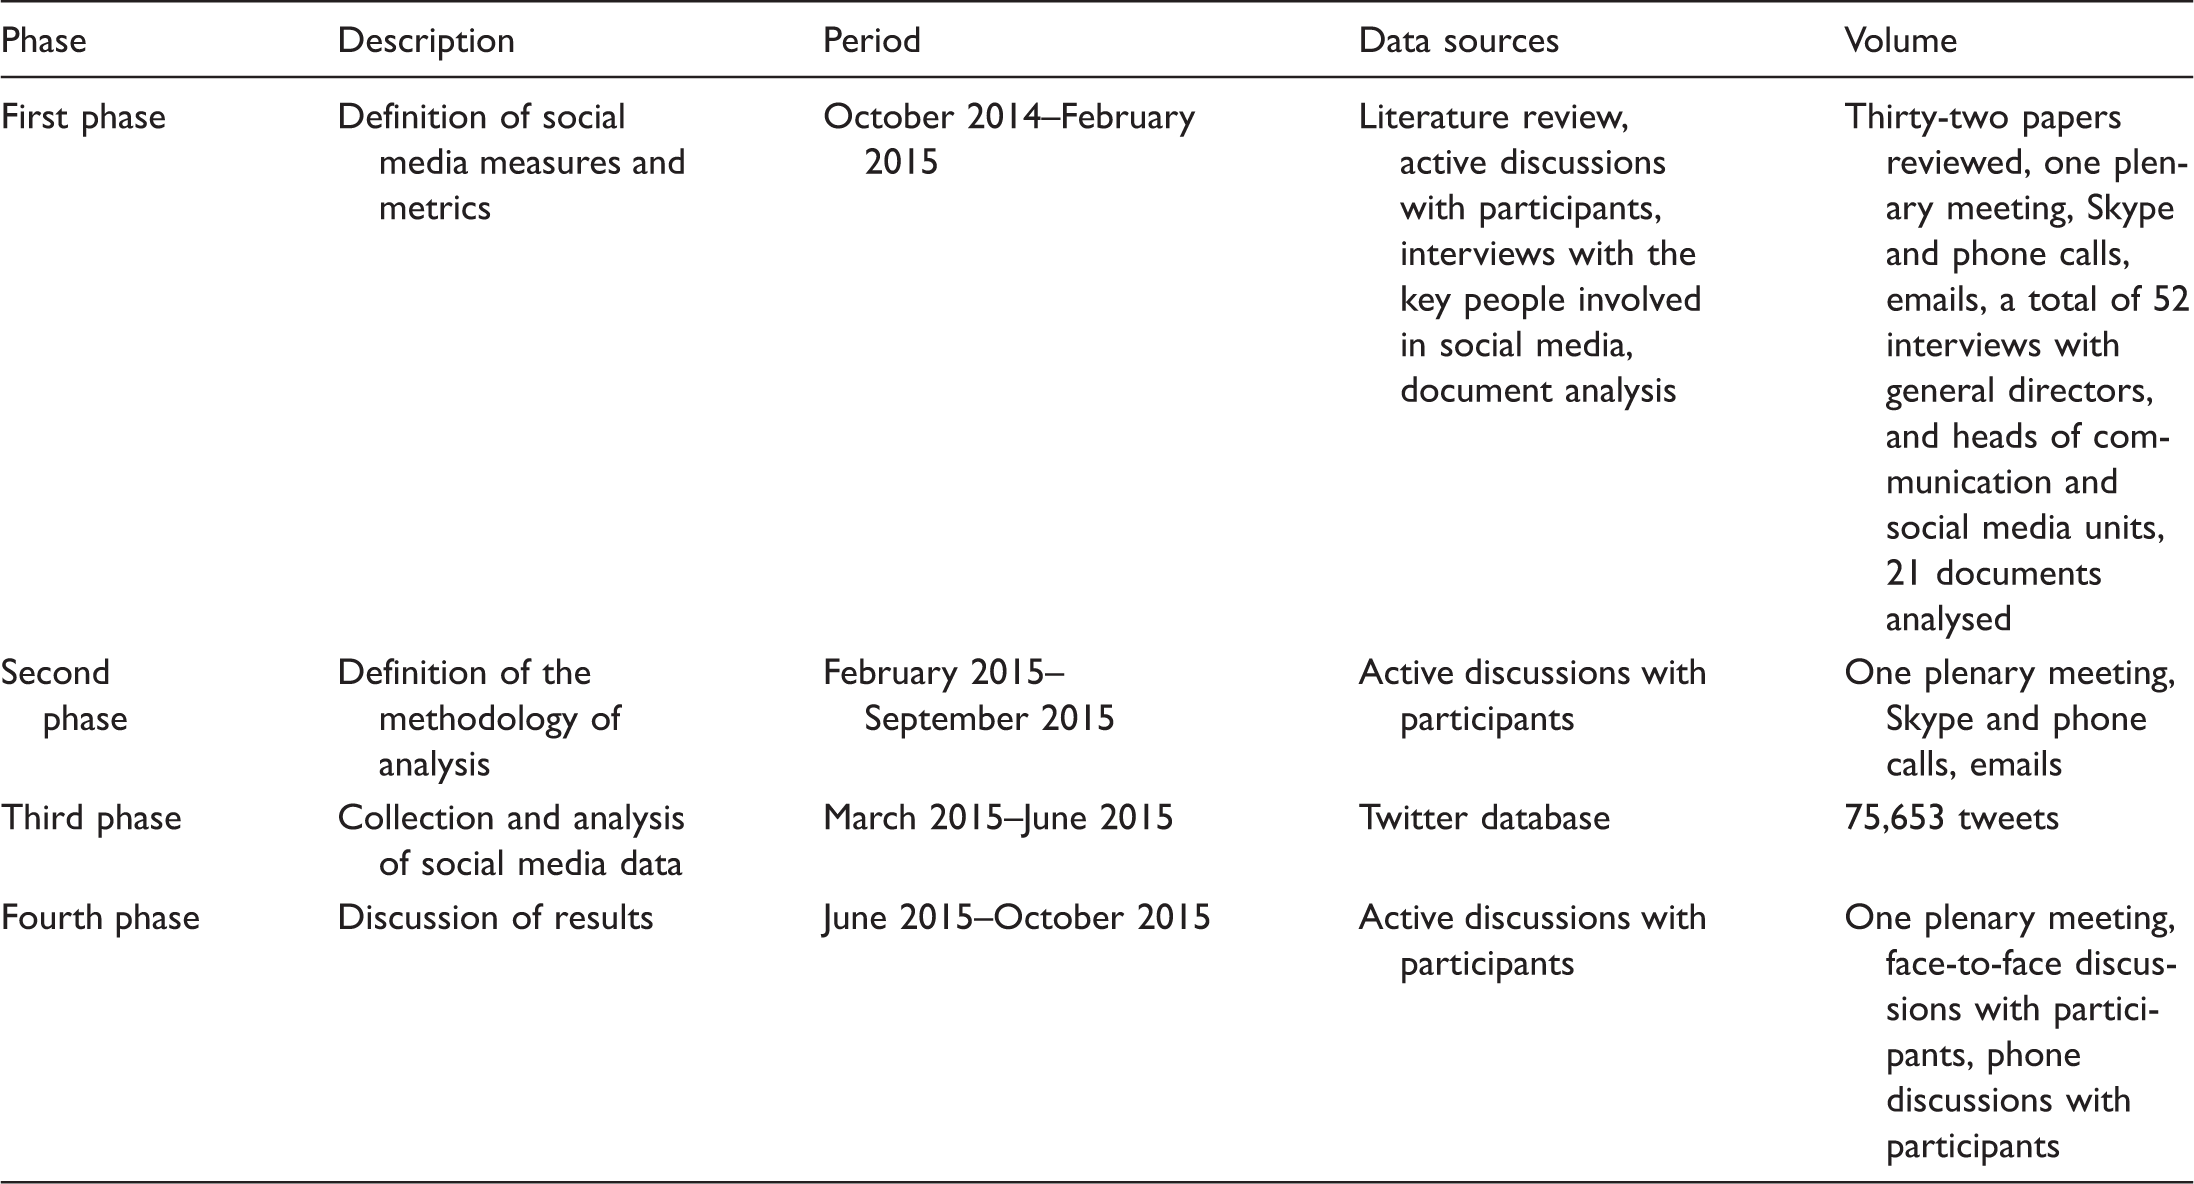
In the first phase, the objective was to develop a set of measures, derived from social media, to quantify how social media data contribute towards measuring services. The process started with a literature review, where we specifically looked for papers discussing social media measures or the type of data that can be obtained from social media. This research was carried out in Scopus, looking at the areas of business, management, public sector, public policy and social science, and generated 32 relevant papers. In addition, 52 interviews were conducted to gain information about the start of the art in social media within the participating universities and the informants’ information needs concerning social media. In each university, we interviewed the general director, the person heading the office managing social media (usually the communication office) and staff with the specific responsibility of managing social media. Lastly, we analysed the documents concerned with how each university measures social media, and the findings were shared through a plenary meeting, skype calls and emails. This first phase led to a preliminary model of the social media measures that can help in evaluating the effectiveness of higher education services.
The analysis methodology was clarified in the second phase, with the measures derived being framed within the context of the 21 universities. The boundaries of our analysis were set at the end of this phase, and were to concentrate on Twitter, to collect Twitter data over a period of five months (from February to June 2015) and to gather tweets posted by both the university and by third parties. With respect to this last point, each university provided us with its Twitter dataset, and we downloaded Twitter data from third parties by running the universities’ names as keywords through the public Twitter API. We chose Twitter because of two main reasons. First, Twitter is the only social media, among the many available, that allows users to set queries and download tweets for free; in Facebook, for example, due to privacy issues, free text downloads are not allowed unless you are a ‘friend’ of the relative account holder. Second, in this phase of the project, we investigated the distribution of social media within all universities in Italy and Twitter was the clear winner. Moreover, some other studies underlined that Twitter is among the three most commonly used social networks in Italy (Cosenza, 2014).
The third operative phase involved collecting Twitter data and cleaning and analysing the data. In this process, the Twitter dataset was extracted using pre-defined keywords and cleaned, starting with a manual tagging. The downloaded tweets (a total of 75,653) were grouped into discussion topics and, for each of the topics, a sentiment analysis was carried out to assign a polarity to each tweet. Each operation was followed by the data being cleaned manually and the initial data were further revised to ensure the validity of the analysis. In this phase, we used different statistic software. We used R software to download and manage Twitter data, CLUTO to build clusters around the discussion topics, and TreeTagger for the sentiment analysis part.
The final phase involved discussing the results with the 21 universities in the client system to share the results from the operative phase and validate the set of Twitter-derived measures. The benefits and potential problems associated with the proposed set of measures were highlighted during this phase.
Results
The results from the literature review and the action research project are presented in this section, making the distinction between the set of social media measures developed for the purpose of measuring public service performance, and how these measures are applied to the context of Italian universities to identify the relative benefits and limitations.
Framing a set of social media measures for public service performance measurement
Proposed performance measures

The first area relates to what service is being discussed. Studies on the usage of social media data have shown that it is possible to analyse word frequency in social media conversations and find topics of discussion on social media channels (Herring, 2010). On this point, a set of content analysis techniques have been proposed for downloading and identifying the discussion topics of users on social media (e.g. Agostino and Sidorova, 2016; Bhardwaj et al., 2014; Netzer et al., 2012). The distinctive feature of these techniques is that, rather than being a top-down driven process, the topics of discussion are derived bottom up from the most recurring words. It also means that the topics of discussion are not defined a priori. This picture led us to propose a discriminant ratio and so identify the type of service object of the social media conversation; therefore, answering the question about what services are users talking about. This measure quantifies in percentage terms the importance, on Twitter, of a given topic relating to the university, compared to the overall set of discussions, meaning that it is possible to identify which university services are being talked about on Twitter and their relative importance.
This measure is elaborated by dividing the total number of tweets where a certain topic is mentioned by the total number of tweets relating to the university. The discussion topics are identified in an intermediate step, involving statistical techniques based on word count: the words that recur most are ranked into descriptive item sets and then grouped together into clusters on the basis of a similarity index, where similar words are joined and those loosely linked separated.
The second area concerns who is talking about the service, which is connected with the feature of dialogue being intrinsic to social media. Users are at the centre of social media (Waters et al., 2009), and the fact that they are given a voice is widely acknowledged in the public sector, with several authors underlying that public authorities use social media to involve the public (i.e. social media users) in decision-making processes (Lev-On and Steinfeld, 2015). At the same time, the manager of the social media page, here the public body itself, also provides material on social media. Since dialogue is a major feature of social media (Chun and Luna-Reyes, 2012; Waters et al., 2009), this implies that the conversations on social media are the output of both the public authority that is posting and providing content, and also of the users who comment on the public body’s posts and offer their own comments. Since it is, therefore, also necessary to distinguish, among those talking about the public service, between the public authority itself and the service users, we have developed a non-official account ratio for this purpose.
This non-official account ratio can be calculated when the available social media dataset consists of tweets published by the public sector’s official account as well as those published by members of the general public talking about the public body. By distinguishing between these two categories of tweets, this non-official account ratio provides an insight into who is most interested in a specific topic; for example, the public sector mainly publishes posts on certain subjects, while it was found that users comment on other services. This indicator is elaborated by taking the number of tweets in which the public body is mentioned published by accounts other than the public body, and dividing it by the total number of downloaded tweets mentioning the public body. Results provide, in percentage terms, the incidence of comments made by non-official accounts.
This distinction between official and non-official tweets is relevant given that, for effectiveness to be elaborated, the users’ perception on a certain topic emerges in the non-official tweets.
The third area concerns when the service is evaluated. A distinctive feature of social media is that, by working in real time, users can leave their comments and material at all times (Kaplan and Haenlein, 2010). It follows that knowing when a conversation takes place is part of the information that can be extracted from social media data and, potentially, this can be at any moment of the day or week. Since social media can be accessed at all times, we decided to include an indicator of temporal distribution, to learn when the user is discussing the service. This time-linked distribution ratio is computed by summing the number of daily tweets, distinguishing between official and non-official accounts. This ratio, therefore, provides information about when users are talking about the public body, which means that it is possible to find out whether the users’ perception of the services is connected to any contingent situation.
Lastly, the last area of analysis focuses on how users talk about the service. On this point, a set of sentiment and opinion mining techniques are proposed in several social media contributions, and these can be used to explore the opinion of social media users (e.g. Archak et al., 2011; Nguyen et al., 2014; Thelwall et al., 2010). Given this context, we have included a polarity ratio within our framework to measure user opinion about the service. This polarity ratio provides information about how users perceive the public sector services previously identified through the discriminant ratio. The polarity ratio gives a score to each tweet, ranging from −6 (negative) to +6 (positive), and is computed by means of a weighted lexicon that contains a list of words and their associated scores in a [−6; +6] scale. A weight is given to every word in the tweet and the average of the scores of the words gives the polarity ratio of the tweet. The metric for the polarity ratio is the following
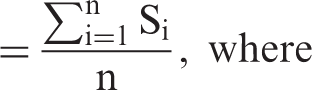
n is the number of words in a tweet
The model applied to Italian universities
Starting from the set of measures developed from literature, the research team, assisted by the university staff in charge of managing social media platforms, calculated the above Twitter-derived performance measures and discussed the potential and limitations of these measures with the universities involved. The validation of these measures implies first downloading the tweets and then calculating the proposed measures.
Discriminant ratio
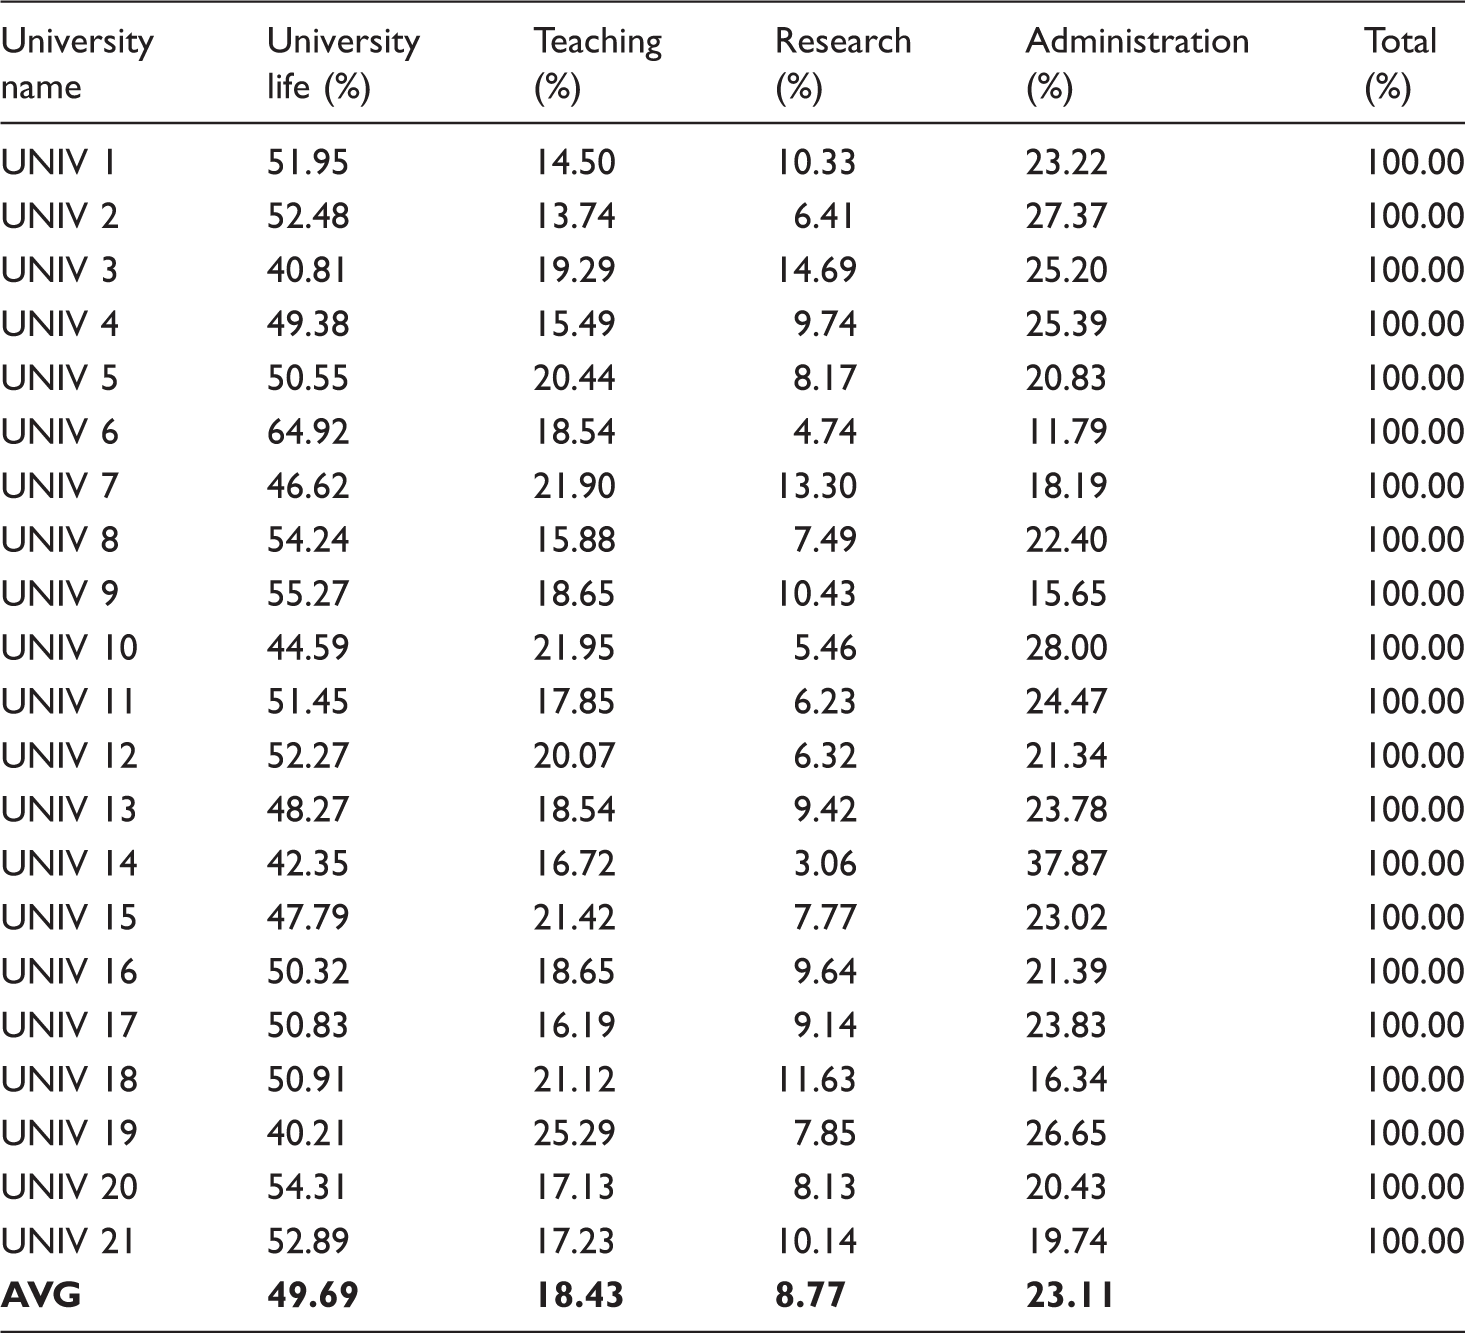
The university life cluster refers to university operations other than teaching and research, including taking part in university events, university news and episodes in the students’ and staff’s everyday life (for example, students going to the library to study, events organised by student associations and student meetings in the university campus). The recurring words in this cluster include ‘events’, ‘life’, ‘pictures’, ‘news’ and ‘students’. Examples of tweets in this cluster are: A meeting at the #UNIV20 to learn how to write a powerful cv. Suggest a place where we can celebrate the end of exams, #UNIV14. I feel sorry for those UNIV2 students walking back and forth on bridges with gigantic scale models. An entire night lost in organising pdf documents uploaded by the professor after class #UNIV10 #study #nervous. I’ve just finished my English class with a very good professor. I still have trust in human nature! #UNIV4. New research at #UNIV6: we may be wrong when interpreting other people’s feelings, but our brain corrects our interpretation.
Lastly, the administration cluster refers to comments about the support services offered by the university, such as job vacancies, recruitment matters, general services and enrolment procedures. An example of tweet in this cluster is the following: Someone stole my university badge and I have to pay 30€ for a new one. UNIV12 is this fair?
The discriminant ratio was found to vary university by university, with some universities scoring more than 60% in the topic of university life and, indeed, seems to be the predominant topic in most universities, although in other cases, tweets are more balanced among the four categories. It is also important to underline that these four clusters are not expected to be general reference categories for universities analysis about Twitter. On the contrary, clusters in the discriminant ratio are expected to be data driven: it is the value of the similarity ratio that suggests topics of discussion and their connections. The identification of the final set of clusters is a managerial choice. For example, in our analysis we initially had 30 clusters, but participant universities found them being too many and not useful. Through discussions, cross-referenced with the value of the similarity ratio, we ended up with four categories.
Non-official account ratio
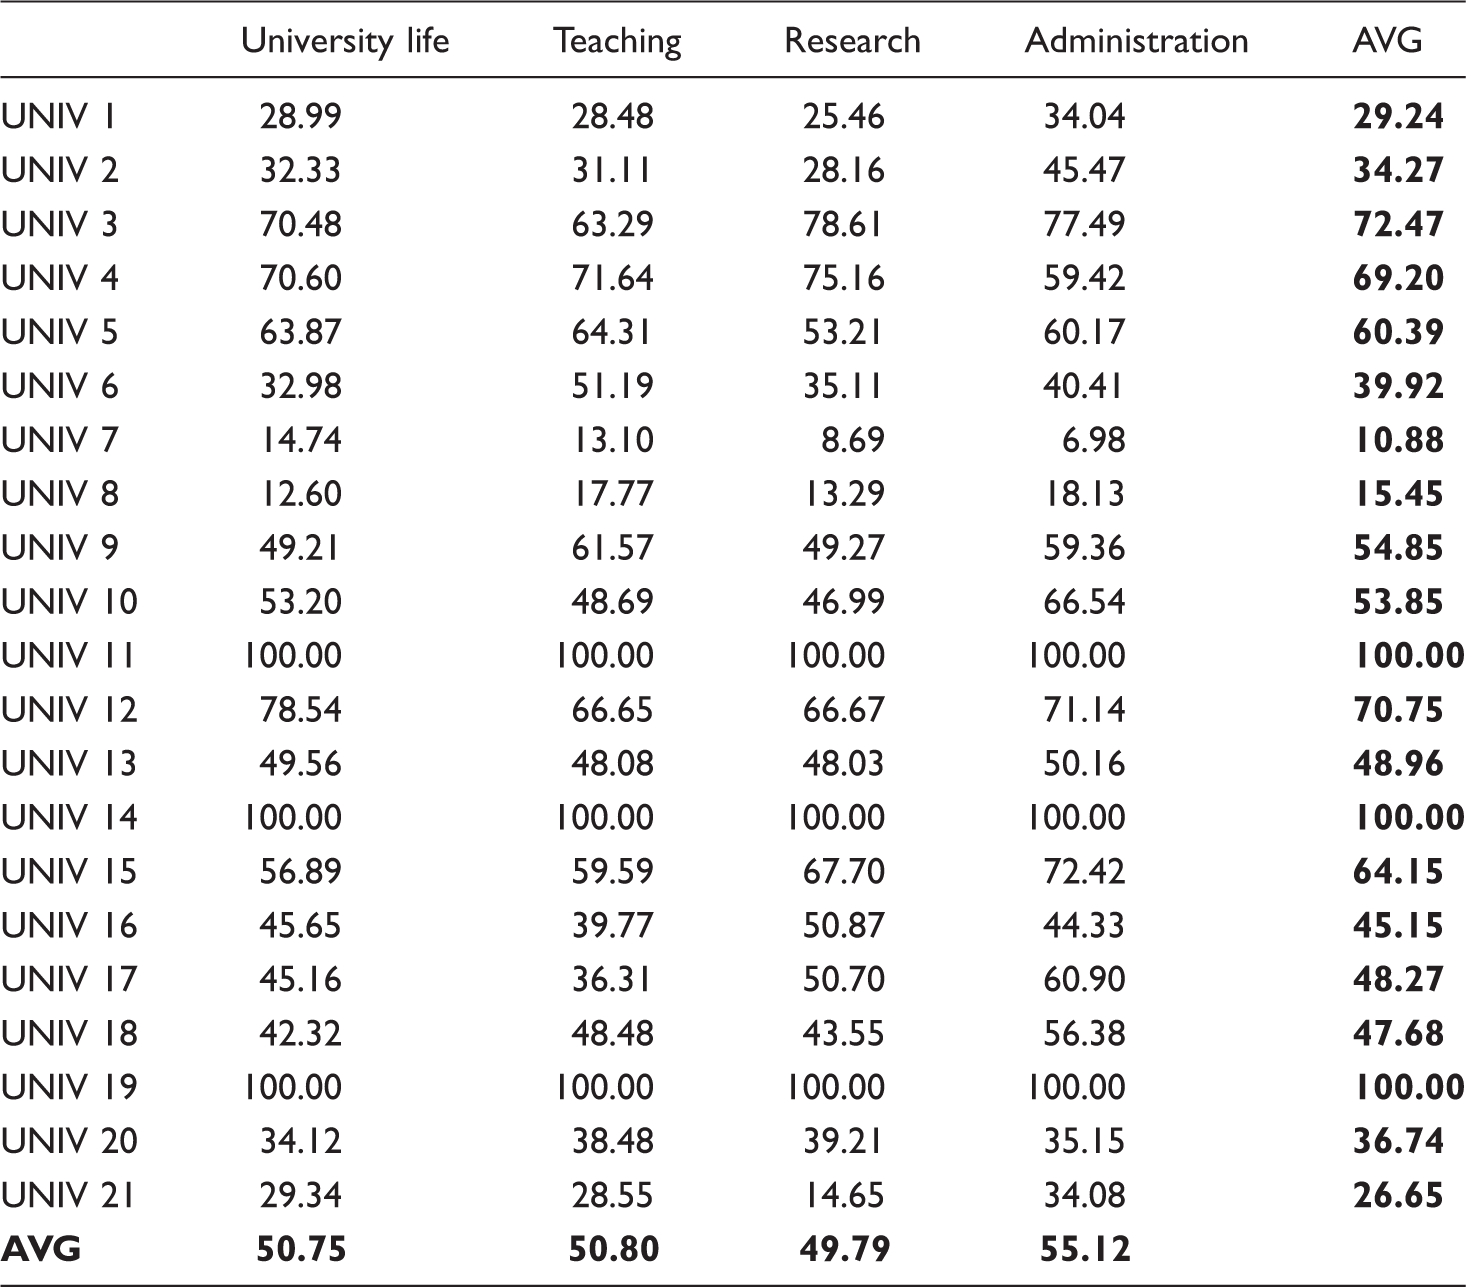
Looking at the table, the first observation is that, taking the average for all the universities, the number of tweets published by official accounts is almost the same as that of those published by third parties, since the average value of the non-official account ratio is very close to 50%. When looking at the individual universities, the situation is different: in some universities, there are many more tweets posted by official accounts (e.g. UNIV 1 and UNIV 2) because the non-official account ratio is very small. This is the most common situation. In other universities, for certain topics, more posts are published by third parties than by the official accounts (i.e. UNIV 3, UNIV 4 and UNIV 5). Lastly, the universities with a non-official account ratio of 100% have no Twitter account. Although they are not on Twitter, users still talk about the university services and, therefore, it is possible to gain insights into the effectiveness of the universities’ services.
The third measure proposed is the temporal distribution ratio, which assesses the distribution of tweets over time.
We applied this indicator to our sample of universities (Figure 1), finding that the tweets have a cyclical distribution. First, for both official and non-official accounts, the tweets follow the same pattern, although the number of tweets is different. Second, we can identify ‘peak times’, corresponding to week days. Weekends and holidays are ‘non-peak times’. This is an interesting result, since Twitter is known to be a 24/7 relationship tool and is advertised as such by several university communication offices. However, despite the instrument potentially allowing users to communicate at every moment of every day and week, in practice, users talk mainly during week days.
Temporal distribution ratio.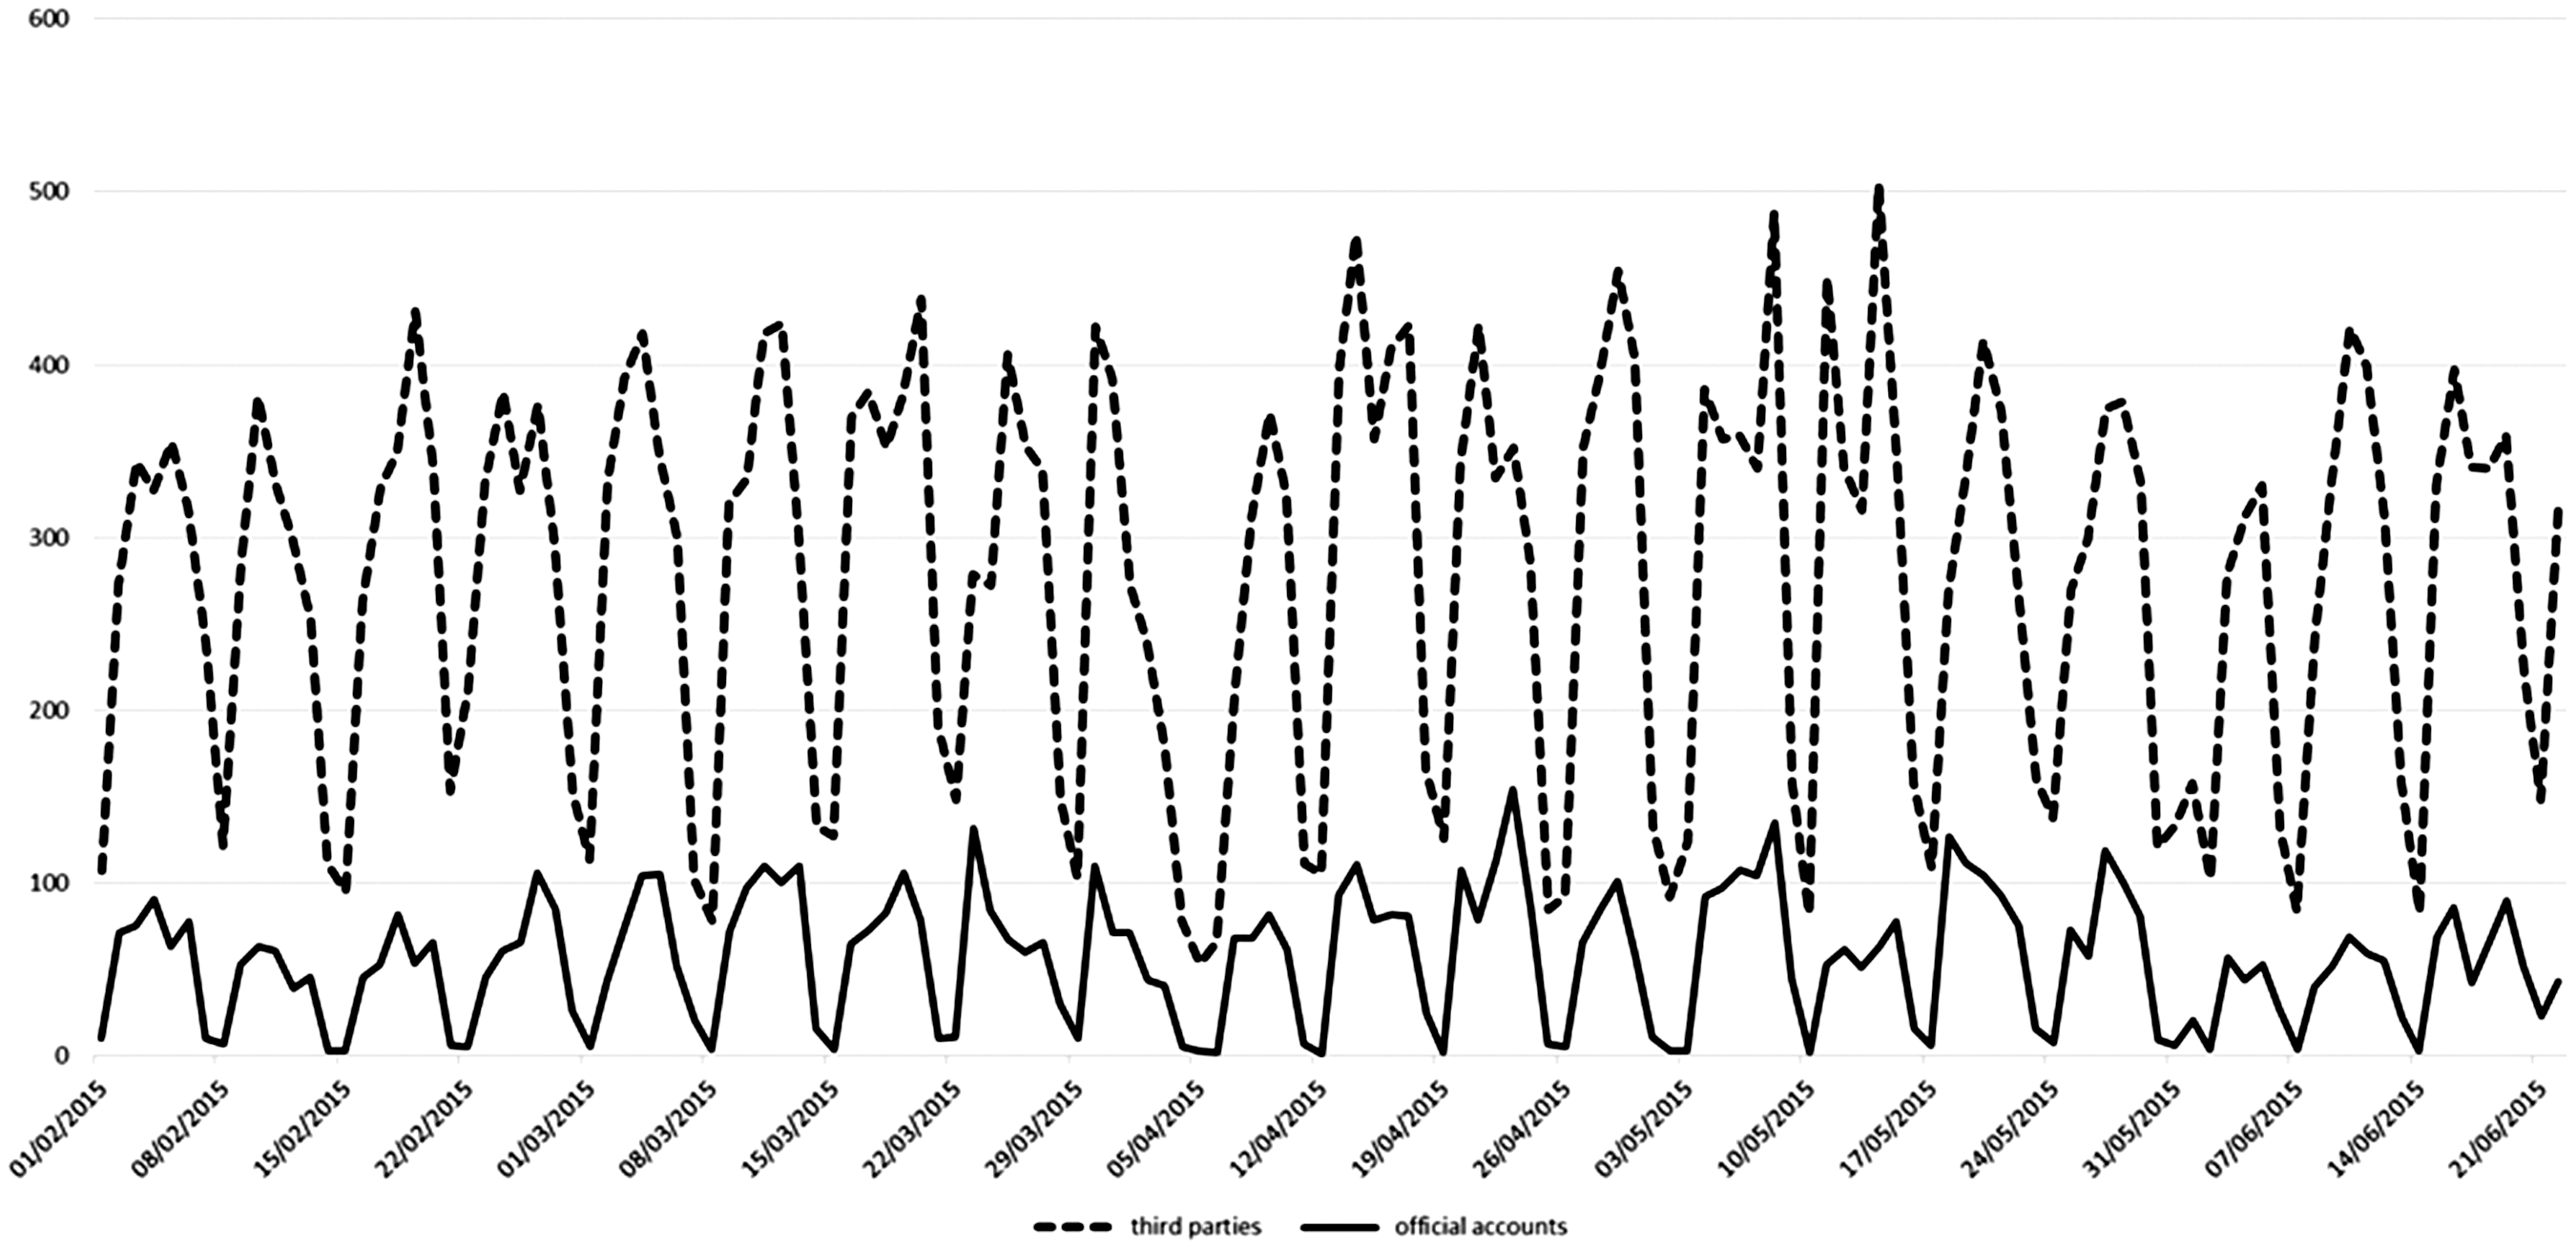
Polarity ratio
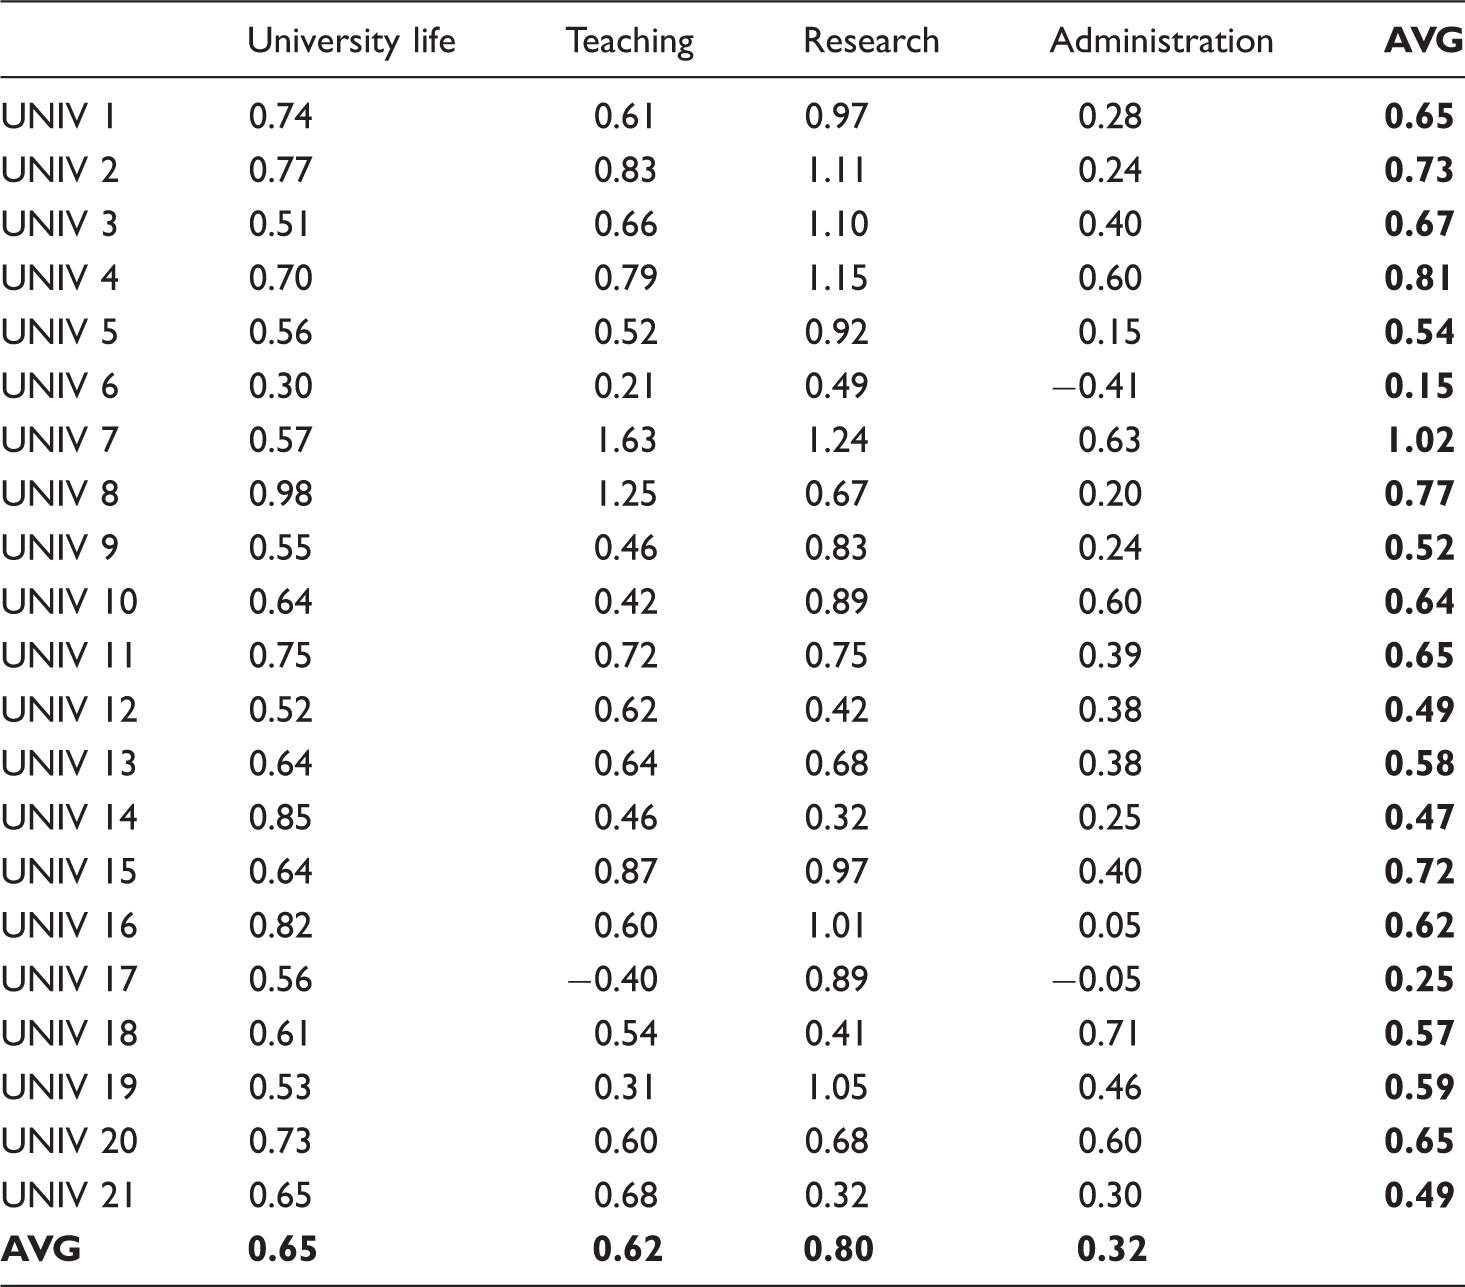
Negative scores correspond to negative perceptions about the service, while positive scores relate to positive opinions about the service. Values close to zero correspond to a neutral perception (i.e. neither negative nor positive). Looking at the values, on average the users’ perception about each service is close to zero (i.e. neutral). This is mainly because, when there are both positive and negative comments about a certain topic, when computing the average per cluster they cancel each other out.
There are a few exceptions, where the score is less than zero for some universities, mainly with reference to the administrative clusters. We specifically searched for tweets offering a negative perception about this cluster and found several examples: I’m ill because the university heating system is not working @UNIV11. How is this possible? Study room in the medicine faculty. Notice: unsafe furniture. @UNIV8 can you do something? UNIV5 what about all the problems you don’t want to know about? What do you do all day? Play cards? Lazy office.
Discussion of the model with universities
The final phase of the action research project involved discussing the calculated Twitter-based measures with the participant universities. Both benefits and limitations of the four measures were highlighted.
With regards to the difficulties, university staff in charge of managing social media highlighted the importance of being able to analyse the data and of having the appropriate information technology and some degree of statistical competence to compute these measures. I like these measures and found them very useful, but right now I cannot implement them without further support. I’m managing social media within the university. I have a background in communications and I would find it impossible to implement those measures without IT and maths support. We have to download Twitter data and this is a first problem. I can’t push a button and get the results automatically. I need to calculate them and I cannot do it by myself. (Social Media Manager, UNIV 7) We check the Twitter dashboard regularly, usually on a weekly basis, to see if we are able to manage the tool. We are particularly interested in the hours of the day where interaction is highest and in the trend of number of followers. We have no structured system in place, we just check data on the Twitter dashboard. (Head of Communication Office, UNIV 1)
A second limitation, in part connected to the previous one, relates to the lack of resources to manage social media. The administrative staff of all the universities underlined that social media were introduced in the university without investing in additional personnel, relying instead on existing resources, mainly in the communication offices. Several participants underlined that some financial resources have been used to send communications staff on social media courses and improve their skills in this area. While this aspect is generally related to the difficult financial situation many Italian universities find themselves in, with their reduced spending power, in several universities this lack of resources was found to be connected to the negative perception of social media held by the administrative and political officials: We introduced social media by ourselves. We saw what was happening in the outside world and in other universities: we could not miss out on these key tools to interact with our students. But we have to learn how to deal with social media on our own; when we present our work here at our general administrative meetings, we are told that it is a waste of time. (Head of Communications, UNIV 19)
With regards to the benefits of the model, discussion with the universities on the four indicators has shown that Twitter has the potential to help in measuring service effectiveness, providing insight into university services without the university having to ask the service users for their views directly. This is an aspect of particular importance, as highlighted by the controller of UNIV 1: Students are continuously receiving requests to fill in questionnaires: we have the teaching evaluation survey, the internal support service questionnaire, the final exam survey, the international survey. Students are complaining about these continuous demands; the less we ask, the better it is, otherwise we run the risk of getting a low response rate.
The polarity ratio is positioned on the horizontal axis of the matrix, while the non-official account ratio is on the vertical axis. These axes are centred on the average value of the non-official account ratio and on the zero value for the polarity ratio. Each dot represents a topic of discussion (derived from the discriminant ratio). Four quadrants can be identified following this approach, and these correspond to four priorities for intervention: high performing area, risk area, indifferent area and unsafe area (Figure 2).
Service effectiveness matrix.
The High performing area contains services with a high polarity ratio and a high non-official account ratio, corresponding to topics that are perceived positively by users (polarity ratio higher than zero) and where a number of users are talking about the service. These are the strongest areas for the university.
The Risk area includes services with a low polarity ratio but a high non-official account ratio. These have been defined as areas of risk since user perception is negative (polarity ratio lower than zero) and lots of people talk about the service. These areas require immediate intervention to avoid the negative trend increasing.
The Indifferent area has a high polarity ratio and a low-non official account ratio. It identifies services rated positively by users, but where there are only a few user comments, shown by the low value of the non-official account ratio.
Lastly, the Unsafe area corresponds to services perceived negatively, with a polarity ratio less than zero, and of scarce interest to users, as indicated by the low value of the non-official ratio. These services need to be monitored, since they are not perceived positively by users and the number of people talking about them could increase rapidly.
Figure 2 shows an example of this matrix for UNIV 18. Although the services are close to the axis, teaching services are positioned in a risk area, while university life is perceived positively by users. Administration services are neutral, since the polarity ratio is very close to zero, while research services are in the indifferent area because the related tweets are mainly posted by the university’s official account.
To sum up, this service effectiveness matrix can help staff visualise the effectiveness of a service from a Twitter perspective. Also limitations of this matrix need to be highlighted; the main limitation is related to positioning the axis of the polarity ratio in the average value of observations. This choice is affected by the universities included in the sample and does not provide a reference target value that is always valid. The same analysis performed in another context would have provided a different matrix. However, this opens up further research on how to define a reference value for the non-official account ratio, which is not dependent on the sample of observations.
Conclusion
The aim of this paper is to investigate how Twitter data can help measure the effectiveness of services offered by public bodies, with particular reference to the field of higher education. We carried out an action research project with the participation of a group of 21 Italian universities, and developed a set of Twitter-derived measures that have been applied to and discussed with our sample of universities. These measures comprise a discriminant ratio, a non-official account ratio, a temporal distribution ratio and a polarity ratio, which are used, respectively, to decide what higher education service is being talking about, who is talking about it, when it is being talked about and how it is being talked about.
Applying our model to the participant universities has highlighted two main benefits. These are the possibility of gaining insights into how higher education services are perceived without having to rely on surveys completed by students and staff, which often suffer from a low response rate; and that of identifying the priorities for action, by plotting the measures in a service effectiveness matrix. The limitations have also been highlighted; these mainly refer to the fact that statistical and mathematical skills are needed to elaborate the proposed measures, and that administrative and political officials can have a negative view of social media, associated in turn to the scarce resources available for social media measurement purposes. The key point is that Twitter-derived measures can complement these traditional customer satisfaction surveys filled in by students, professors and academic staff. While traditional surveys usually focus on teaching and support services, Twitter-derived measures mainly provide indications about university life. Further studies could investigate the correlation between how a service is perceived according to traditional surveys and according to social media data.
These results can serve both the academic and practitioner domains.
From an academic perspective, this study provides three main contributions. First, it contributes to extant literature on performance measurement in the public sector. While measuring performance in public administration is a long-standing issue (e.g. Hood, 1991, 1995), the available contributions to date propose performance measures that are based on traditional organisational data. We, instead, underlined the possibility of measuring public service performance using the newer social media data, providing evidence about a set of measures that can be derived from Twitter to quantify the effectiveness of public services, together with a discussion about their benefits and limitations.
Second, this study expands the literature on use of social media in the field of higher education. Current studies on social media in higher education focus on how to use social media to enhance the areas of learning, teaching, enrolment, marketing and library services (e.g. Bélanger et al., 2013; Constantinides and Stagno, 2011; Manca and Ranieri, 2016; Palmer, 2013), emphasising the fact that social media data are interactive and based on dialogue among users. The present study underlines the potential of social media data in supporting the back office administration work of planning and controlling performance in a university. This, therefore, stresses the importance of social media, not simply because it allows the university to interact with the ‘outside’ (i.e. students) but also in connection with internal management processes.
Third, this study contributes to the more general literature on social media and big data, by emphasising the added value of social media data from a manager’s perspective (e.g. Criado et al., 2013; George et al., 2014). While several investigations concentrate on developing a set of analytics techniques to download and analyse social media data (e.g. Agostino and Sidorova, 2016; Archak et al., 2011; Bhardwaj et al., 2014; Netzer et al., 2012; Nguyen et al., 2014; Thelwall et al., 2010), the management implications of the available set of measures is mainly underexplored. By developing the proposed set of measures, we underline the possibility of mining social media data as a means of supporting the work of managers to measure performance, with particular reference to service effectiveness, thereby answering the recent call for ‘categorizing big data, assessing its quality, and identifying its impact’ (George et al., 2014: 324). Moreover, this study further underlines the indirect power of social media, which is connected with literature on social media. We found that, even if a university does not have a Twitter account, Twitter users will talk about the university anyway. In our analysis, this was visible in universities with a non-official account ratio of 100%. This is a relevant issue given that, even when a university does not want (yet) to take the social media path, its stakeholders will inevitably talk about it, its initiatives, events and organisations.
From a practitioner perspective, and in line with the purposes of action research, we also addressed some practical concerns. The first relates to a benchmark among Italian universities about the uses of social media and the users’ perceptions about university services. While this contribution finds relevance at the Italian level only, at a more general level, this study provides a set of applicable measures that can be exploited by practitioners in the higher education field, as well as in other public sector fields, to compute the effectiveness of their services. In addition, a service effectiveness matrix was provided, which can help serve practitioners, in particular, to identify the risky and safe areas for intervention, on the basis of the measures previously computed.
Finally, we pointed to the issue of generalising the results, which is strictly connected to the action research methodology we adopted. While action research facilitates access to information and ensures continuous interaction with the observed reality, this study was conducted on a sample of Italian universities, leading to the question of whether it is, indeed, possible to generalise these results and apply them to similar institutions. In this respect, it is important to distinguish between what is general in scope and what is case specific. The type of measures that can be derived from Twitter endeavour to be general in scope. While the application and detailed values for each measure relate to our sample of Italian universities, the proposed measures can be applied to other institutions of higher education and public bodies with a Twitter account that want to exploit Twitter data to evaluate the effectiveness of their services. In the same vein, the benefits and limitations of the proposed set of measures also aim to be general in scope since they address several issues, from lack of commitment to lack of resources or competencies, that are found in similar organisations facing the same need to exploit social media data.
Footnotes
Declaration of conflicting interests
The author(s) declared no potential conflicts of interest with respect to the research, authorship, and/or publication of this article.
Funding
The author(s) received no financial support for the research, authorship, and/or publication of this article.