
Abstract
Pyramidal domes are a type of roof covering that can have various numbers of faces. Since most of these domes are constructed from lightweight structures, such as space frames, accurately calculating the wind load the primary lateral load for this structure type is essential. Due to the absence of wind pressure coefficients for this structure type in standard design codes, either numerical modeling or wind tunnel testing must be used to calculate wind loads. This study explores wind tunnel models at four height-to-span ratios (0.25, 0.5, 0.75, and 1) for six-sided and eight-sided domes. Additionally, 6-, 8-, and 12-sided domes are modeled using ANSYS based on the computational fluid dynamics (CFD) method. Results show that, when the protrusions of the sectors are positioned at angles between 60° and 90°, negative pressure coefficients increase locally in these areas. Furthermore, the study presents equations for the pressure coefficients of these domes through modeling of conical domes.
Introduction
The analysis of wind loads on structures, especially those with complex geometric forms such as pyramidal shapes, is one of the key challenges in structural engineering. Pyramidal forms, as a type of roof geometry or overall structural form, have garnered increasing attention in modern architecture and lightweight structures. The importance of accurately calculating lateral loads, particularly wind loads, in these structures, given their spatial configuration and high height-to- height-to-span ratios, is undeniable. Incorrect estimation of the forces acting on these structures can lead to structural instability and irreparable damage.
One of the critical parameters in calculating wind load forces is the wind pressure distribution coefficient (Cp), which depends on the structure’s shape. The intensity and distribution of wind loads on domes are influenced by the height-to-span ratio, the topographical conditions of the site, and the characteristics of the structure and surrounding environment. In Figure 1, examples of the use of pyramidal forms in architectural structures, including both the primary geometry of the structures and their roofs, are shown.
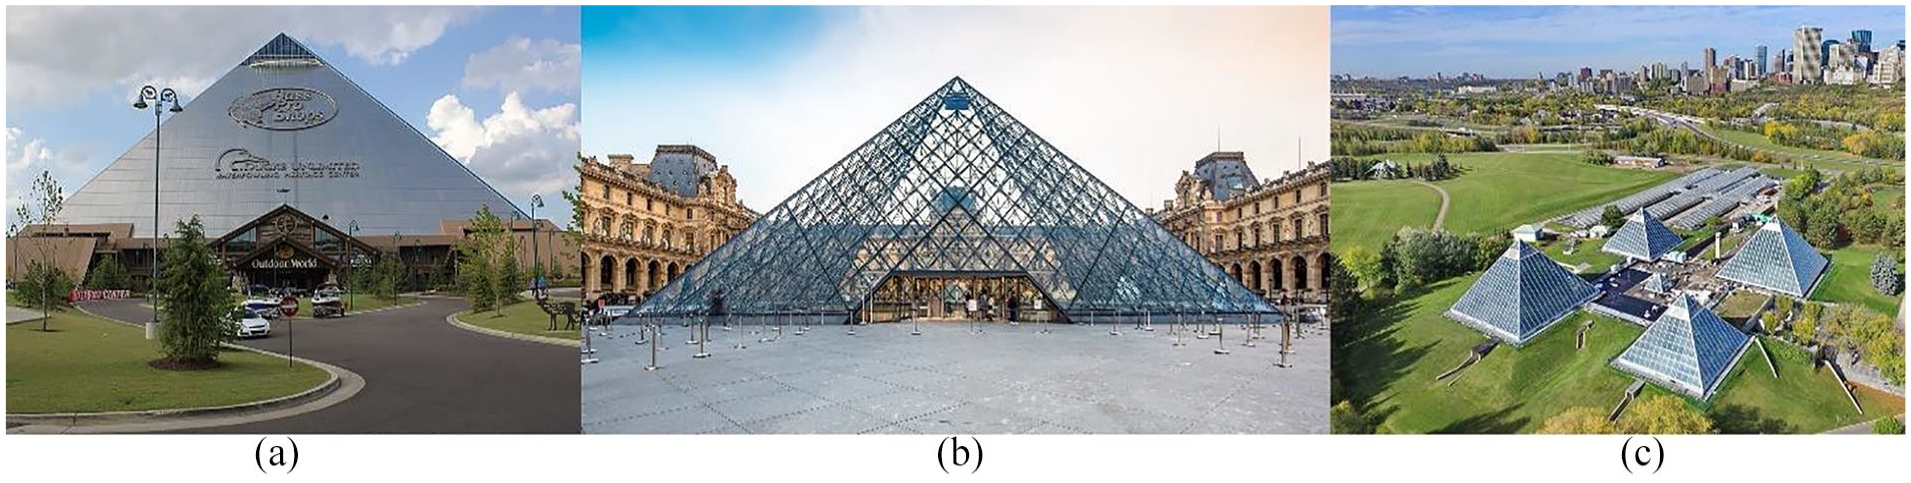
Examples of pyramidal structures: (a) the bass pro shop pyramid in Memphis, Tennessee, (b) the glass pyramid of the Louvre Museum in Paris, and (c) the Muttart Conservatory in Edmonton, Canada.
In recent decades, numerous studies have investigated the effects of wind loads on structures. These studies aim to better understand the behavior of structures under lateral forces induced by wind and to optimize structural design. One of the earliest studies in this field was conducted by Maher, 1 who analyzed the behavior of domes under wind loads using wind tunnel experiments. This research marked a turning point in the study of wind loads and dome structures, paving the way for subsequent research in this area. Dutt 2 investigated wind loads on structures with pyramidal roofs. Using wind tunnel experiments, he calculated the wind pressure distribution on the roof surfaces of a scaled model of St. Michael’s Church in England. The results showed that the highest suction points were observed at 0° and 180°, and this data proved useful for designing pyramidal roofs. Singh and Roy 3 used computational fluid dynamics (CFD) simulations to analyze wind flow around single-story buildings with pentagonal and hexagonal pyramidal roofs. In this study, ANSYS modeling was used to evaluate wind pressure distribution on the roof surfaces. The results indicated that hexagonal pyramidal roofs exhibited greater stability against wind pressures, making them more suitable for storm-prone areas. Khosrowjerdi and Sarkardeh 4 investigated the effect of arch height on wind loads applied to domed structures. This study used numerical methods and CFD simulations to calculate pressure coefficients (Cp), demonstrating that increasing the arch height could reduce the pressure area and increase the minimum and maximum pressure coefficients on domed. Sadeghi et al. 5 conducted a CFD simulation to analyze the effects of wind on hemispherical domes and compared the simulation results with wind tunnel experiments. This study also examined the structural flexibility and wind interference between domes . In another study, Sadeghi et al. 6 examined the wind pressure coefficient on ribbed domes. They numerically analyzed the effect of wind on ribbed domes and observed that creating ribs on spherical domes caused sudden changes in the wind pressure coefficient (Cp) near the ribs. This research formulated and developed equations for the distribution of Cp on the surfaces of spherical and ribbed domes with varying span ratios. In a study by Sun et al. 7 the effect of wind loads on membrane structures with elliptical arch bases was investigated through wind tunnel experiments. This research comprehensively presented the wind pressure distribution on arched membrane structures and examined the effects of parameters such as span increase ratio and wind direction on average pressure distribution, fluctuations, and maximum pressure coefficients. The results of this study serve as a valuable foundation for analyzing geometric influences on wind loads on membrane structures . In similar studies conducted by Ghazal and colleagues, Kim and colleagues, Sum and colleagues, and Kandel and colleagues, the effects of wind loads on structures, as well as changes in pressure coefficients due to geometric variations in domed, spherical, and membrane structures, were analyzed. These studies provided practical and scientific insights in this field, highlighting the importance of geometric changes in designing safer and more stable structures against wind forces.8 –11 Singh and Roy 12 calculated wind pressure coefficients on pyramidal roofs of two-story buildings using CFD simulations. The results indicated that with an increase in roof slope, both positive and negative pressure coefficients increased. This research provided valuable insights into how wind loads affect pyramidal roof structures and compared the obtained pressure coefficient values with various building codes . In another study, Roy et al. 13 investigated wind pressure variations on rectangular and pentagonal pyramidal roofs of low-rise buildings using CFD simulations. The simulations were conducted using the Realizable k − ε model, and wind pressure coefficients and velocity profiles around the buildings were examined. The results showed that pyramidal roofs, due to their geometric shape, experienced lower pressures compared to sloped roofs, with suction forces generated on different parts of the roof. Ikhwan and Ruck 14 analyzed airflow characteristics and wind pressure distribution on pyramidal structures. Using wind tunnel experiments and CFD simulations, they studied the effects of different pyramid base angles and wind directions on wind flow patterns and pressure distribution. The results showed that variations in base angle and wind direction significantly impacted wind loads and airflow around pyramidal structures, playing a key role in the design and stability of such structures. Deqian et al. 15 used large-eddy simulation (LES) to investigate wind interference between tandem hemispherical domes with different center spacings. The simulation results were compared with wind tunnel tests, and wind pressure distribution on the dome surfaces was analyzed. With changes in spacing, wind flow patterns and local pressures varied, leading to increased or decreased flow separation and pressure fluctuations. The interaction between upstream and downstream structures had significant effects on wind loads. In other studies, wind speed near the roof and friction velocity on a gable roof were analyzed using wind tunnel tests and CFD simulations. The wind tunnel used in this research had previously been employed to determine wind pressure coefficients on scallop domes and storage tanks.16,17
Global standards such as ASCE 7-16 (United States), Eurocode 1 (Europe), IS 875 (India), NBCC (National Building Code of Canada), and the Australian/New Zealand Standard AS/NZS 1170.2 have been reviewed to explore methods for calculating wind pressure coefficients on structures. These codes explicitly state that, for irregular structures—particularly those with complex geometric shapes that deviate from established norms—or for structures situated in areas with atypical wind conditions, as well as cases where cladding types and their behaviors require precise estimation of dynamic wind response, the use of numerical and experimental studies is indispensable.18 –22
In such circumstances, wind tunnel tests are recommended to precisely examine and analyze the effects of wind on structures. These tests can be conducted at full scale or on reduced-scale models, depending on available resources, and play a crucial role in realistic modeling and analysis of a structure’s response to wind loads. However, when it is not possible to perform these tests with the required precision, numerical studies must at least be utilized to assess the dynamic behavior of structures under wind influence. These are regarded as a scientific necessity for the design of complex structures.
Given the lack of appropriate methods for calculating wind pressure coefficients for such structures in existing design codes, numerical analyses and wind tunnel tests are essential for evaluating wind loads. This article presents both experimental and numerical analyses of wind loads on pyramidal domes with varying height-to-span ratios and different polygonal shapes. The results of this research can contribute to safer and more optimized designs for these structures, allowing for a more precise evaluation of their dynamic responses to wind.
The objective of this study is to examine wind pressure coefficients on pyramidal domes using wind tunnel tests and numerical simulations based on computational fluid dynamics (CFD). The following sections of the article provide a detailed examination of key variables, such as the structure’s height, the number of faces, and wind angles in relation to the domes, to offer effective strategies for formulating wind load calculations in the design of similar structures.
Methodology
Wind tunnel test
All experiments were conducted in an open-circuit wind tunnel. The wind tunnel used in this study is an open-circuit blow type, approximately 18 m in length, with a test chamber measuring 80 cm in width, 80 cm in height, and 200 cm in length. This wind tunnel is equipped with a centrifugal fan and a 45 KW, three-phase motor. The maximum speed of the tunnel is 35 m/s. The turbulence intensity of the free-stream flow at the tunnel’s maximum speed is 0.05%, and this value increases as the wind tunnel speed decreases, reaching 0.2% at the tunnel’s minimum speed of approximately 2 m/s. The turbulence intensity profile as a function of speed at the center of the test chamber, the wind flow pattern analysis at different heights in the wind tunnel, and the schematic of the wind tunnel components are presented in Figure 2.
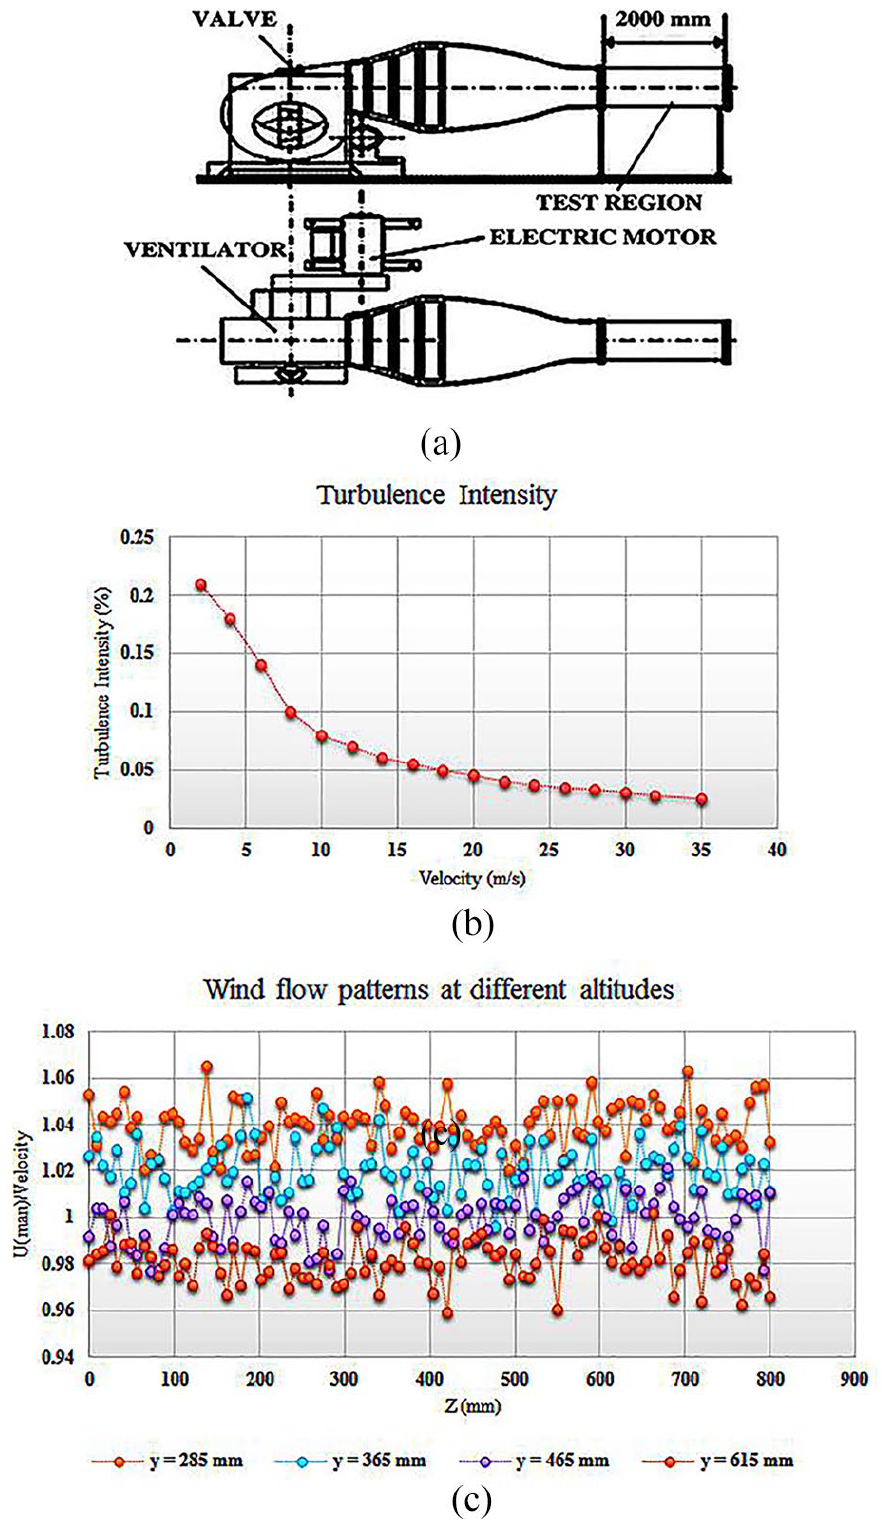
(a) Schematic of the wind tunnel components, (b) profile of turbulence intensity percentage based on velocity at the center of the test section, and (c) wind flow patterns at different heights in the wind tunnel.
Figure 2(b) shows the variation in turbulence intensity as a function of wind speed. At lower speeds, the turbulence intensity is high, but it decreases significantly as the speed increases, particularly beyond 10 m/s. At speeds above 25 m/s, the turbulence intensity approaches a constant value. This behavior indicates that as wind speed increases, the airflow becomes more stable and experiences fewer fluctuations, which is of great importance in aerodynamic studies.
Additionally, Figure 2(c) illustrates wind flow patterns at four different heights (285, 365, 465, and 615 mm). At lower heights, greater fluctuations in the ratio of U(man)/Velocity are observed, indicating a higher degree of turbulence near the surface. As the height increases, these fluctuations decrease, and the airflow becomes more stable. At 615 mm, the wind flow is almost uniform with minimal fluctuations. These results emphasize the importance of height in reducing airflow turbulence and achieving greater stability at higher speeds.
Wind pressure coefficient
The pressure coefficient (Cp) is a dimensionless parameter used to describe relative pressures throughout a flow field in fluid dynamics. This coefficient is widely applied in the fields of aerodynamics and hydrodynamics. Each point in a fluid flow field has its own unique pressure coefficient. In many aerodynamic and hydrodynamic applications, the pressure coefficient near a surface is independent of the surface’s size. As a result, engineering models can be tested in wind tunnels, and the pressure coefficients at critical points around the model can be measured. These pressure coefficients can then be reliably used to predict fluid pressure at similar critical points. The pressure coefficient (Cp) is a tool for studying incompressible fluids, such as air, and can be calculated using an equation that includes parameters like fluid density.
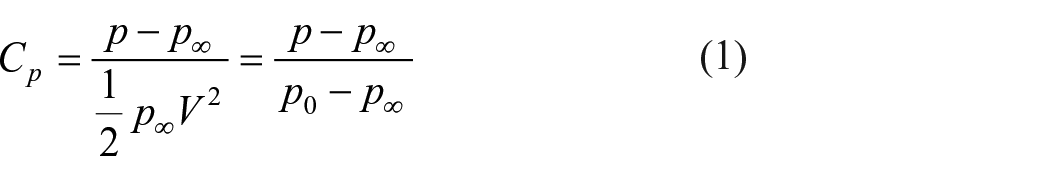
Here, p − p∞) represents the instantaneous pressure difference between the dome surface pressure and a reference pressure in the wind tunnel. ρ and V denote the air density and velocity, respectively. 23
Experimental model
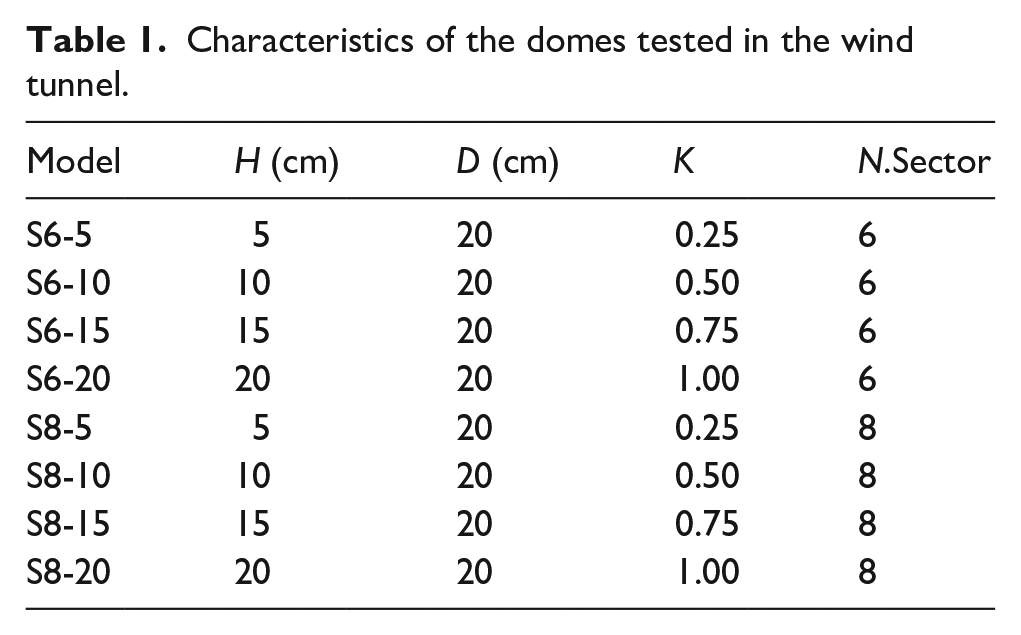
Eight experimental models, comprising four hexagonal and four octagonal models, were investigated using wind tunnel tests. The specifications of these models are provided in Table 1. The parameter K represents the height-to-span ratios. The diameter of the circular base of the pyramidal polygons in all samples is 20 cm, and their heights are 5, 10, 15, and 20 cm, respectively. Figure 3 illustrates the arrangement of these domes in the wind tunnel. Due to the limited number of sensors available for measuring wind pressure coefficients, 16 holes were created on one of the faces of the model, as depicted in Figure 4, to obtain the pressure coefficients at these points. To determine the pressure coefficients for all points on the model, it was mounted on a circular plate and rotated from 0° to 180° in 5° increments.
Characteristics of the domes tested in the wind tunnel.
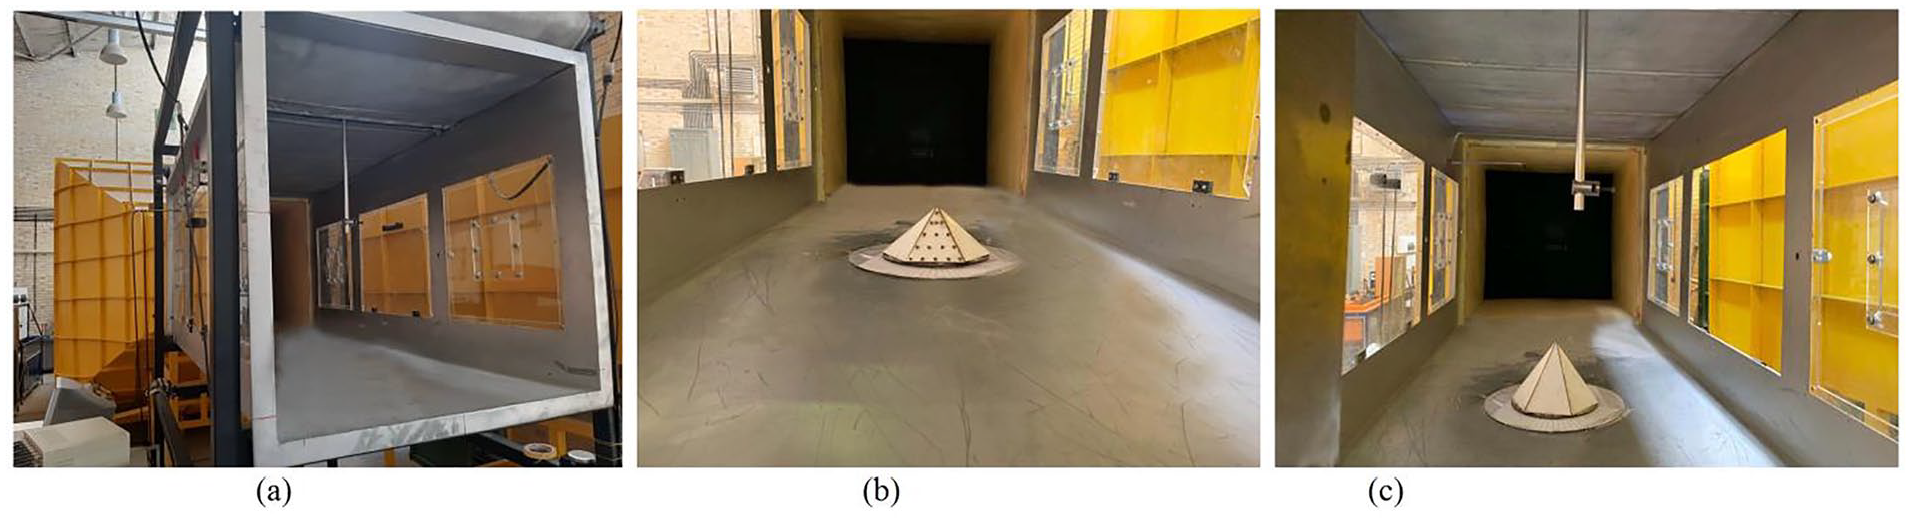
(a) Wind tunnel used, (b) placement of the hexagonal dome model with a height of 10 cm, (c) placement of the hexagonal dome model with a height of 15 cm in the wind tunnel.

Image of pyramidal domes with hexagonal and octagonal bases, and the placement of sensors.
Results and discussion
Analysis of wind tunnel test results
After conducting the sample tests in the wind tunnel, the results were extracted and presented in various charts. In Figure 5, the wind pressure coefficients on the hexagonal dome obtained from the wind tunnel tests are plotted at measurement points for different wind directions. The maximum negative pressure (suction) at point 1, corresponding to the dome with K = 1, is equal to with −2.2. The maximum positive pressure coefficient at K = 1 is equal to with +1. As the dome height ratio decreases, the maximum positive pressure also decreases.
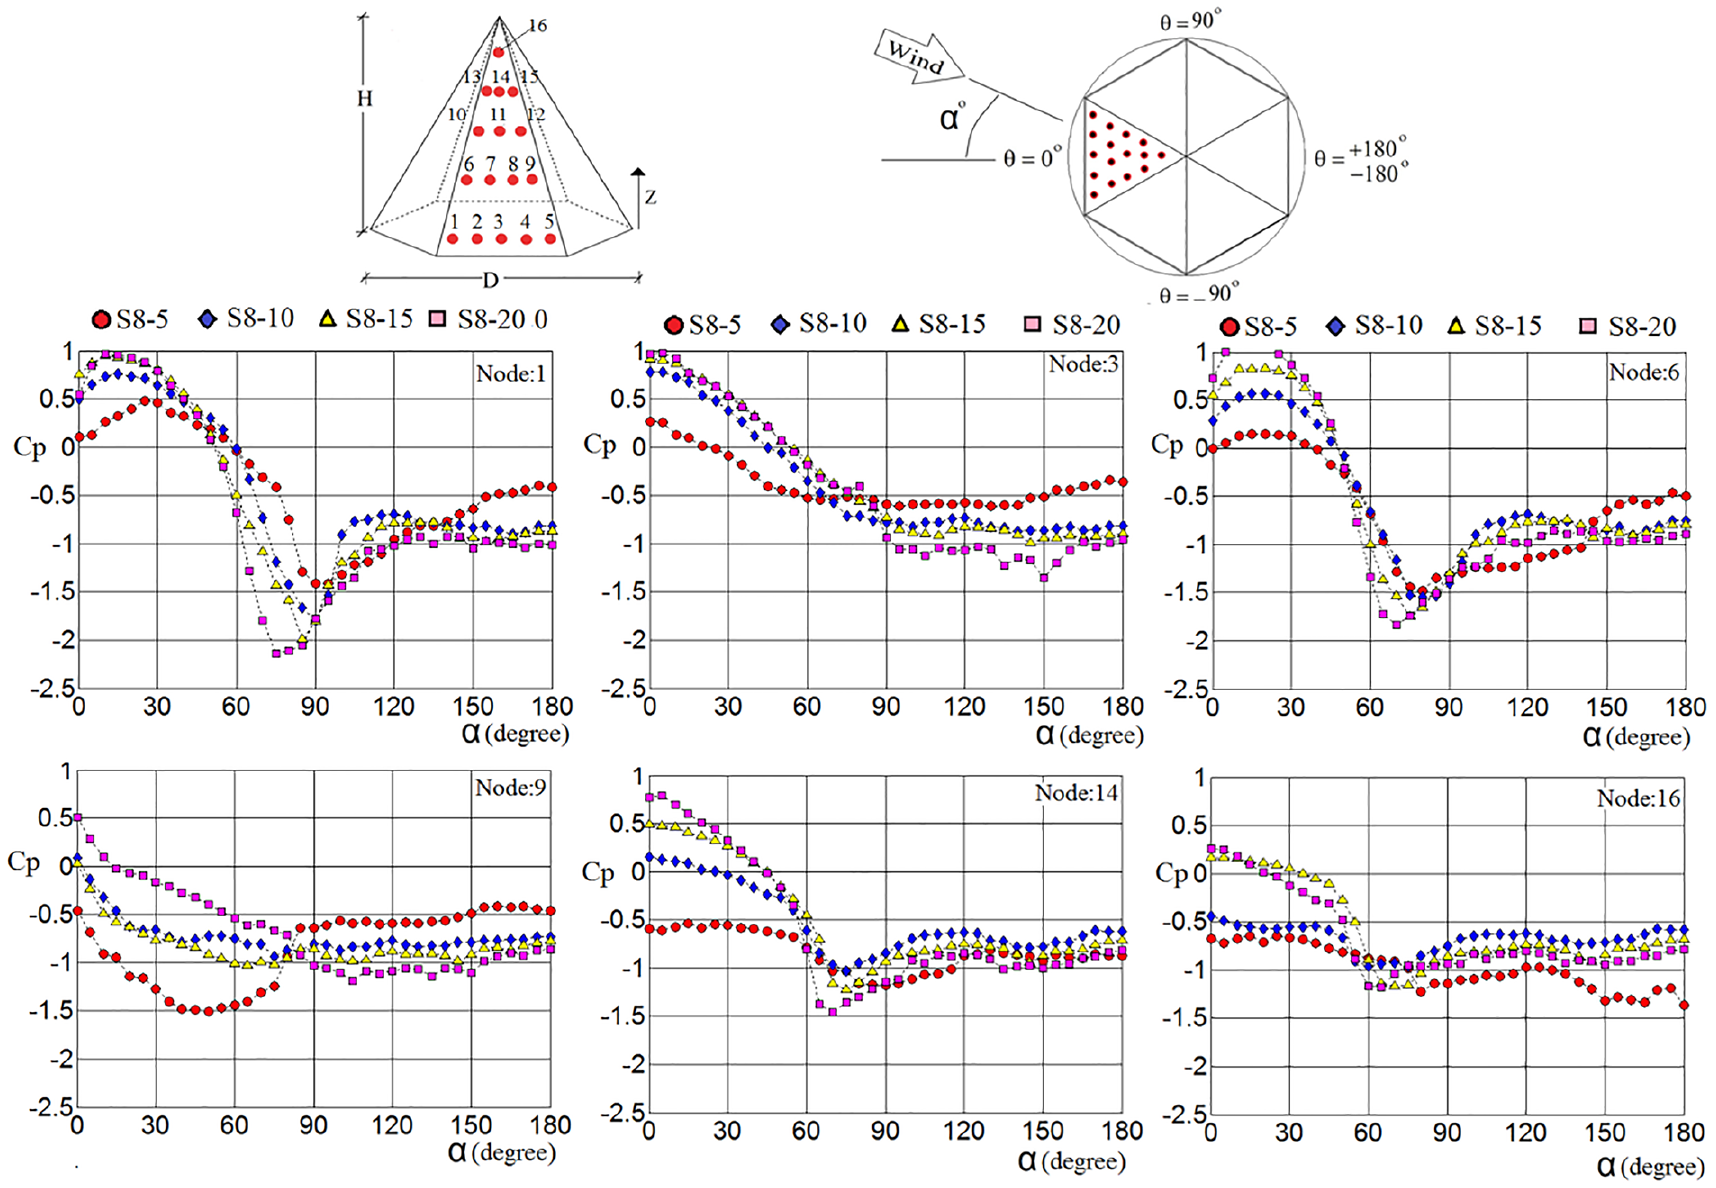
Distribution of wind pressure coefficients for hexagonal pyramids obtained from wind tunnel tests.
In Figure 6, the wind pressure coefficients on the eight-sided domes obtained from the wind tunnel tests are illustrated. In this figure, the red circular markers correspond to the model with a height of 5 cm (K = 0.25), the blue diamonds represent the dome with a height of 10 cm (K = 0.5), the yellow triangles correspond to the dome with a height of 15 cm (K = 0.75), and the pink squares denote the dome with a height of 20 cm (K = 1).
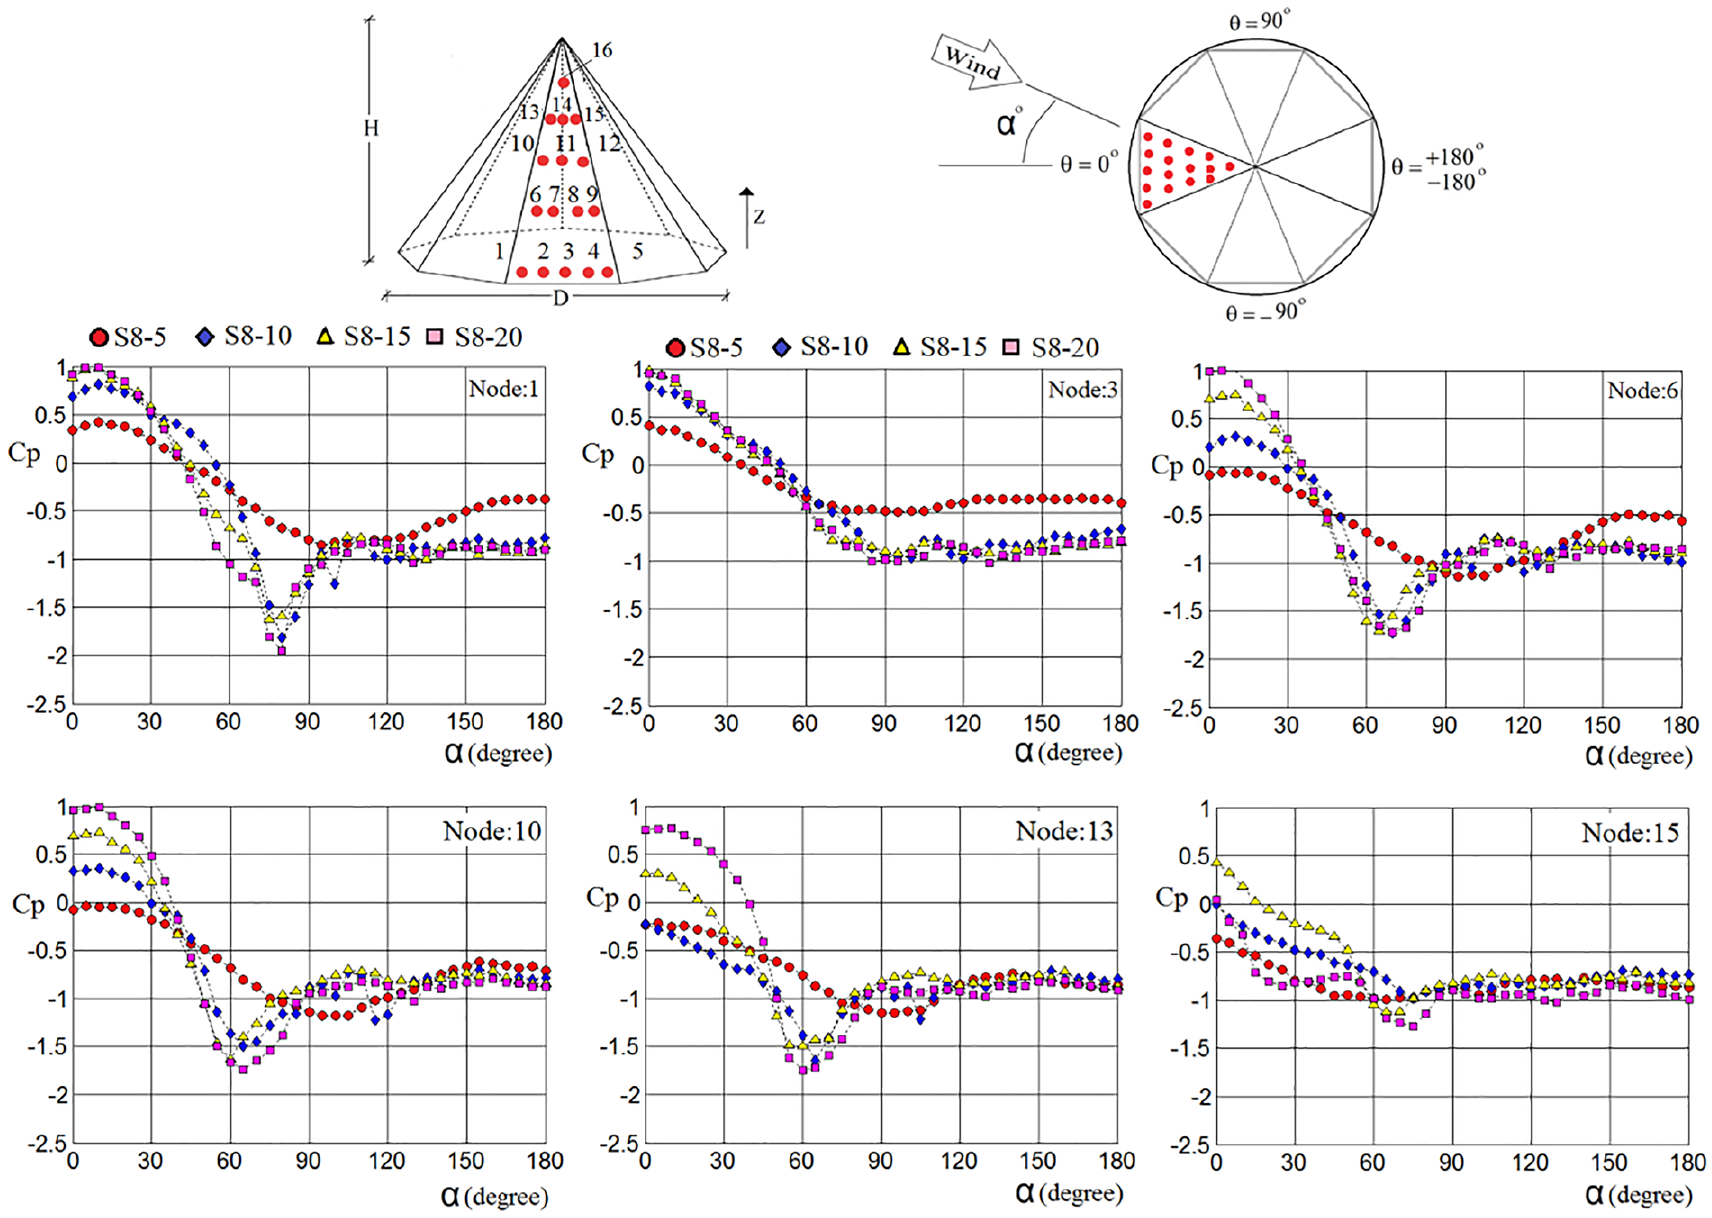
Distribution of wind pressure coefficients for Octagonal Pyramids obtained from wind tunnel tests.
As explained, the dome in the wind tunnel is rotated from 0° to 180° in 5° increments. The maximum negative pressure at α = 80°α = 80° for point 1 at K = 1 is −2. Changes in the wind pressure coefficients with varying angles αα are clearly visible; as long as the points are on the windward side, the pressure coefficient values are positive (indicating pressure), and they gradually shift to negative (indicating suction) as the angle α changes.
The positive pressure coefficient increases with the height-to-span ratios, with the maximum positive pressures at point 1 for K = 0.25, K = 0.5, K = 0.75, and K = 1 being 0.4, 0.65, +1, and +1, respectively. It is evident that points near the protrusions, such as points 1, 6, 10, and 13, exhibit jumps in the pressure coefficients. For example, at point 1, when αα ranges from 60° to 90°, there is a noticeable jump in the pressure coefficients toward negative values.
In contrast, at points farther from the protrusion, such as point 3, no jump in the pressure coefficients is observed. Generally, these jumps distinguish this type of dome from equivalent conical and spherical domes. If the measurement holes were placed directly on the protrusions, higher suction values would be recorded. However, placing a measuring hole on the protrusion is unfeasible, as it would compromise the sharpness of the protrusion, resulting in inaccurate pressure readings.
Numerical modeling
In the following sections, several numerical models are analyzed using ANSYS software with the Computational Fluid Dynamics (CFD) method to identify the appropriate loading pattern and advance the research. In this study, to determine the optimal mesh dimensions, the “Diff” coefficient is introduced, ensuring that the results are independent of mesh size. By progressively refining the mesh, the difference in the pressure coefficient (Cp) at each point is measured with respect to a very fine mesh. As a result, the dimensions of the optimal mesh are determined. The mean value of “Diff” is defined in equation (2), where the parameters Cpk and Cp0k represent the pressure coefficients obtained from two models with the desired mesh size and with a very fine mesh, respectively. In equation (2), n denotes the number of reference points where wind pressures are measured or calculated and compared.
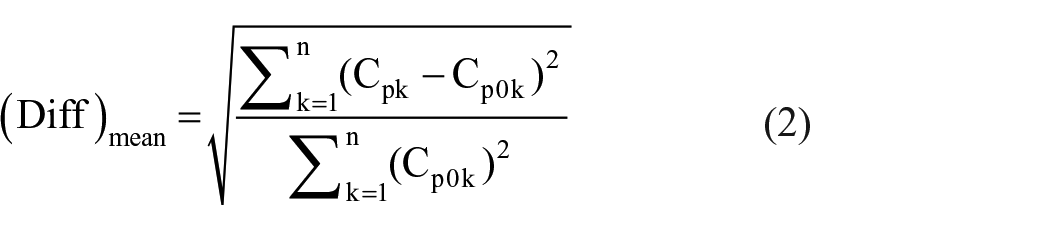
Figure 7(a) shows a Pyramidal dome, inside a wind domain of dimensions 4 m × 1.2 m × 1.2 m. Figure 7(b) evaluates the effect of size of the mesh over the accuracy of the CFD results. Figure 7(c) compares the results related to the smallest mesh size with the experimental results for S8-5 model, All the CFD analyses of this paper are carried out with the smallest mesh size of Figure 7(b), which gives the relatively higher accurate results.
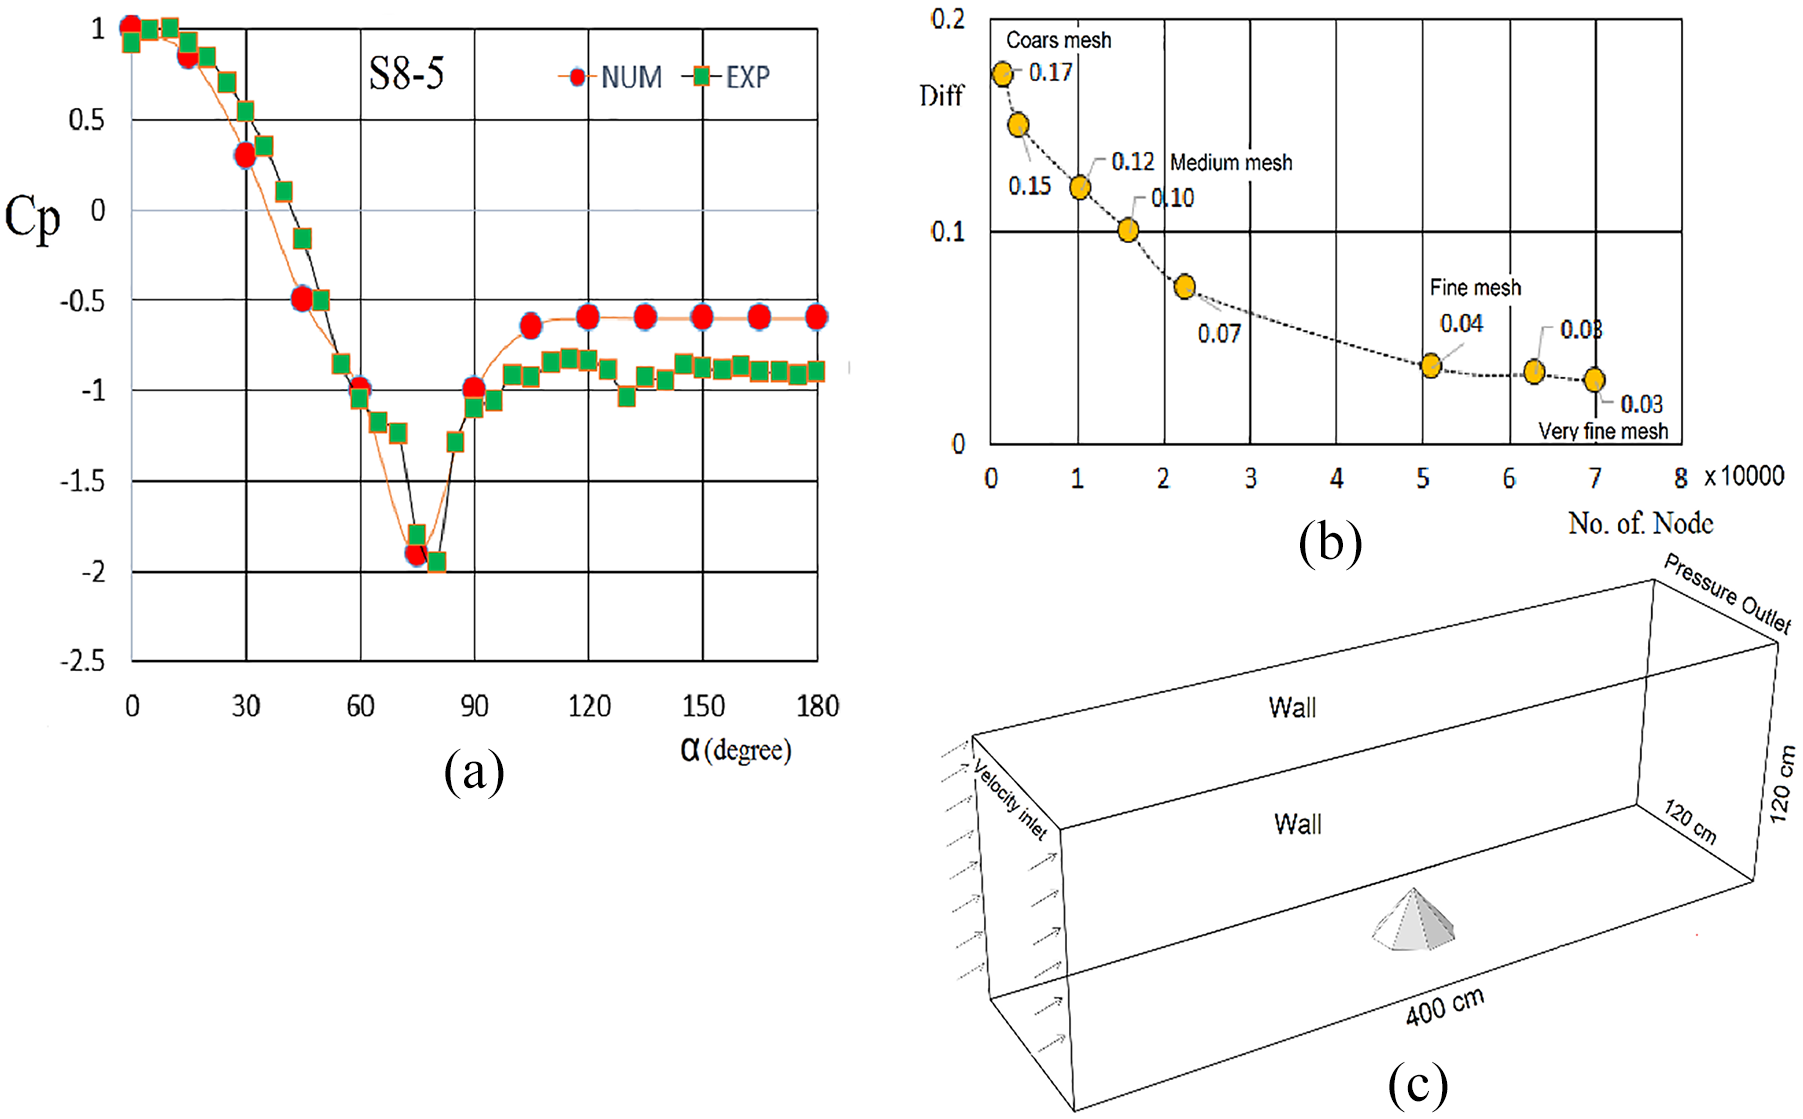
(a) Comparing the results of numerical analysis and wind tunnel test of S8-5, (b) mesh sensitivity analysis for numerical modeling, and (c) characteristics of boundary conditions.
In Figure 8, the wind pressure coefficient results on the six-sided Pyramids (hexagonal Pyramids) are represented as contour plots. The numerical values of these coefficients at different height levels are provided in both polar and Cartesian coordinates. Given that the loading is applied at α = 0, the contours and graphs are symmetrical. The maximum negative pressure (suction) in the S6-5 dome (K = 0.25) at an angle of 90° is −2, while for hexagonal domes with height-to-span ratios of K = 0.5and K = 0.75, the maximum suction is −1. A clear jump in negative pressure values is observed at the locations of the projections. The projection at 90° in the dome with K = 0.25 produces the highest negative pressure, whereas the jump at the 30° projection is relatively small. As the dome height increases, the magnitude of the jump at 30° increases, while the jump at 90° decreases. For the dome with K = 1, the jump at 30° is −1, and the suction at 90° is −0.65.

Contours of wind pressure coefficients on hexagonal Pyramids, along with the corresponding values of wind pressure coefficients in Cartesian and polar coordinates.
In Figure 9, the wind pressure coefficients related to eight-sided Pyramids (Octagonal Pyramids) are plotted. These graphs reveal that with the increase in the ratio of height-to-span, the value of the pressure coefficient on the opposite side of the wind (θ = 0) increases. According to the placement of the ridges at the angles of 22.5, 67.5, 112.5, and 157.5°, in the S8-5 dome (K = 0.25) jumps in negative values are observed at the angles of 67.50 and 112.50, which shows the maximum value at the angle of 67.5 times at −1.75. By increasing the ratio of K, the pressure coefficient at the location (θ = 67.50) increases and reaches the value of −2.5 in three models with K = 0.5, 0.75, and 1. With the increase of the mentioned ratio, the jump in other locations disappears. The graphs indicate the values of pressure coefficients in the red, blue, and pink lines respectively at Z = 0, Z = 0.5H, and Z = H levels.
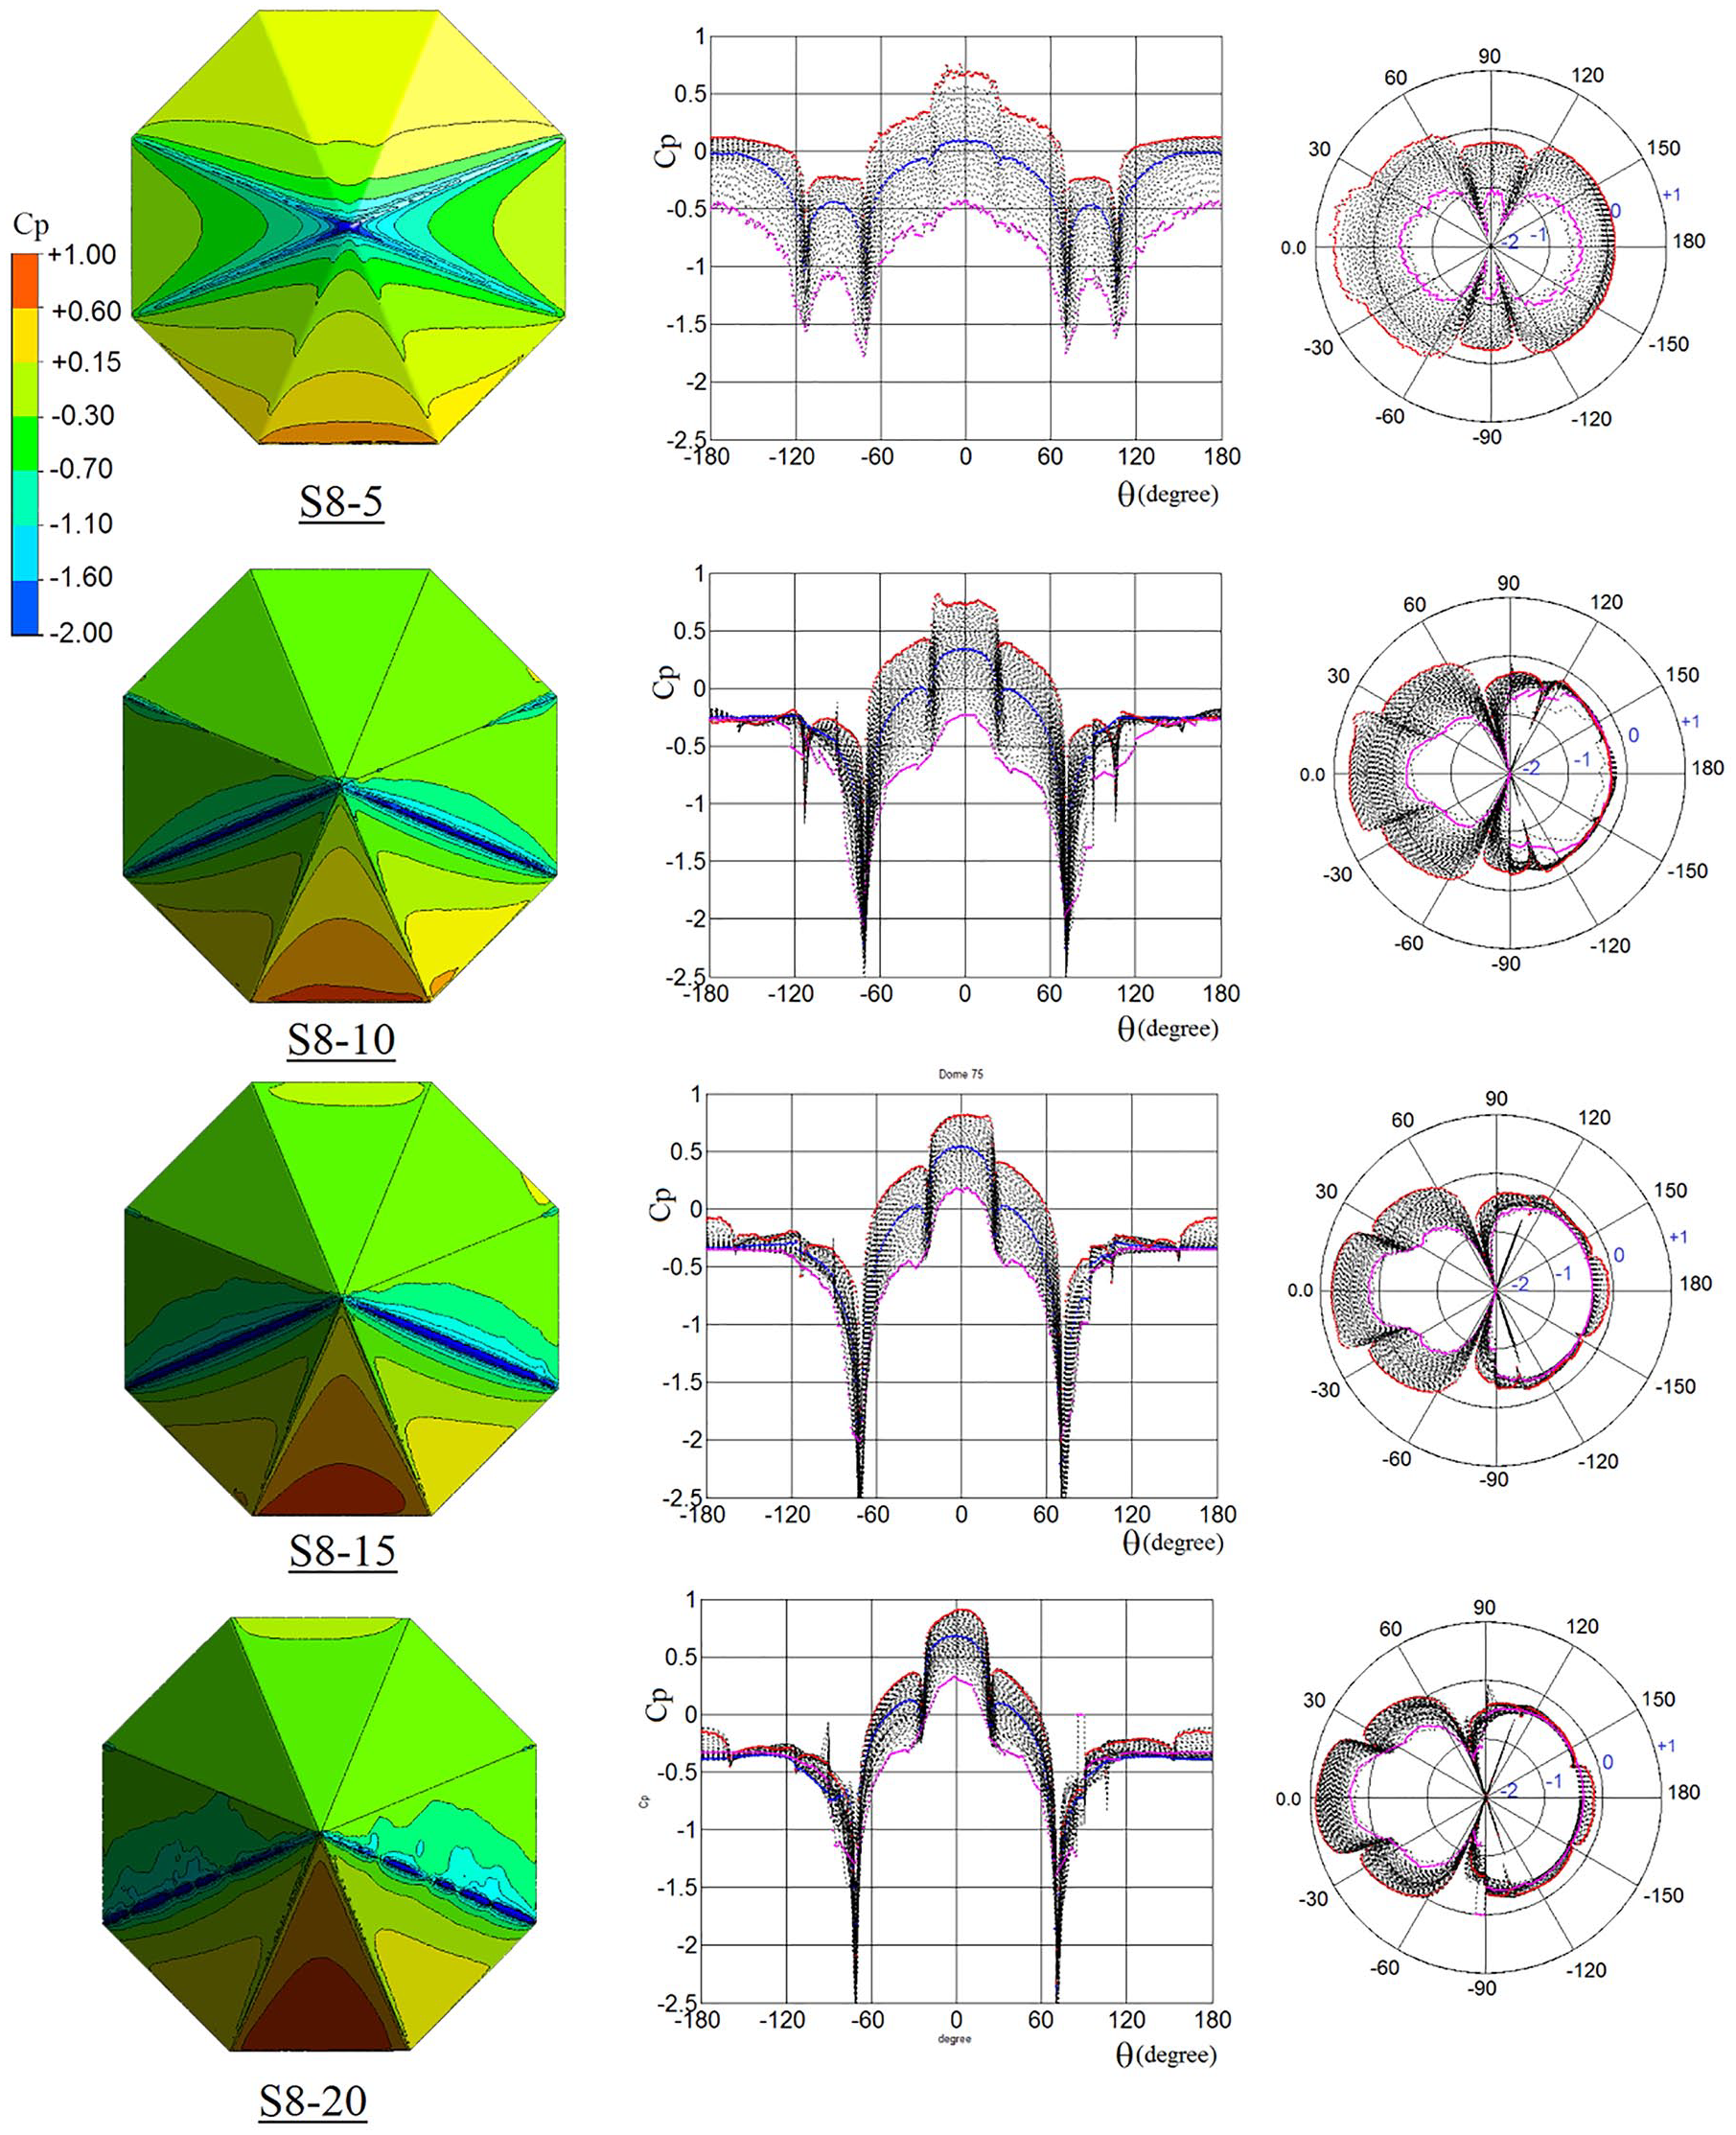
Contours of wind pressure coefficients on Octagonal Pyramids, along with the corresponding values of wind pressure coefficients in Cartesian and polar coordinates.
The focus of this research on hexagonal and octagonal pyramids. As the number of faces on the pyramids increases, the shape of the domes gradually approaches a conical form. To further explore this phenomenon, we have included a 12-sided pyramid in our analysis. Figure 10 presents the results of numerical modeling on 12-sided domes. In these domes, the protrusions of the sections are positioned at angles of 15°, 45°, 75°, 105°, 135°, and 165°.
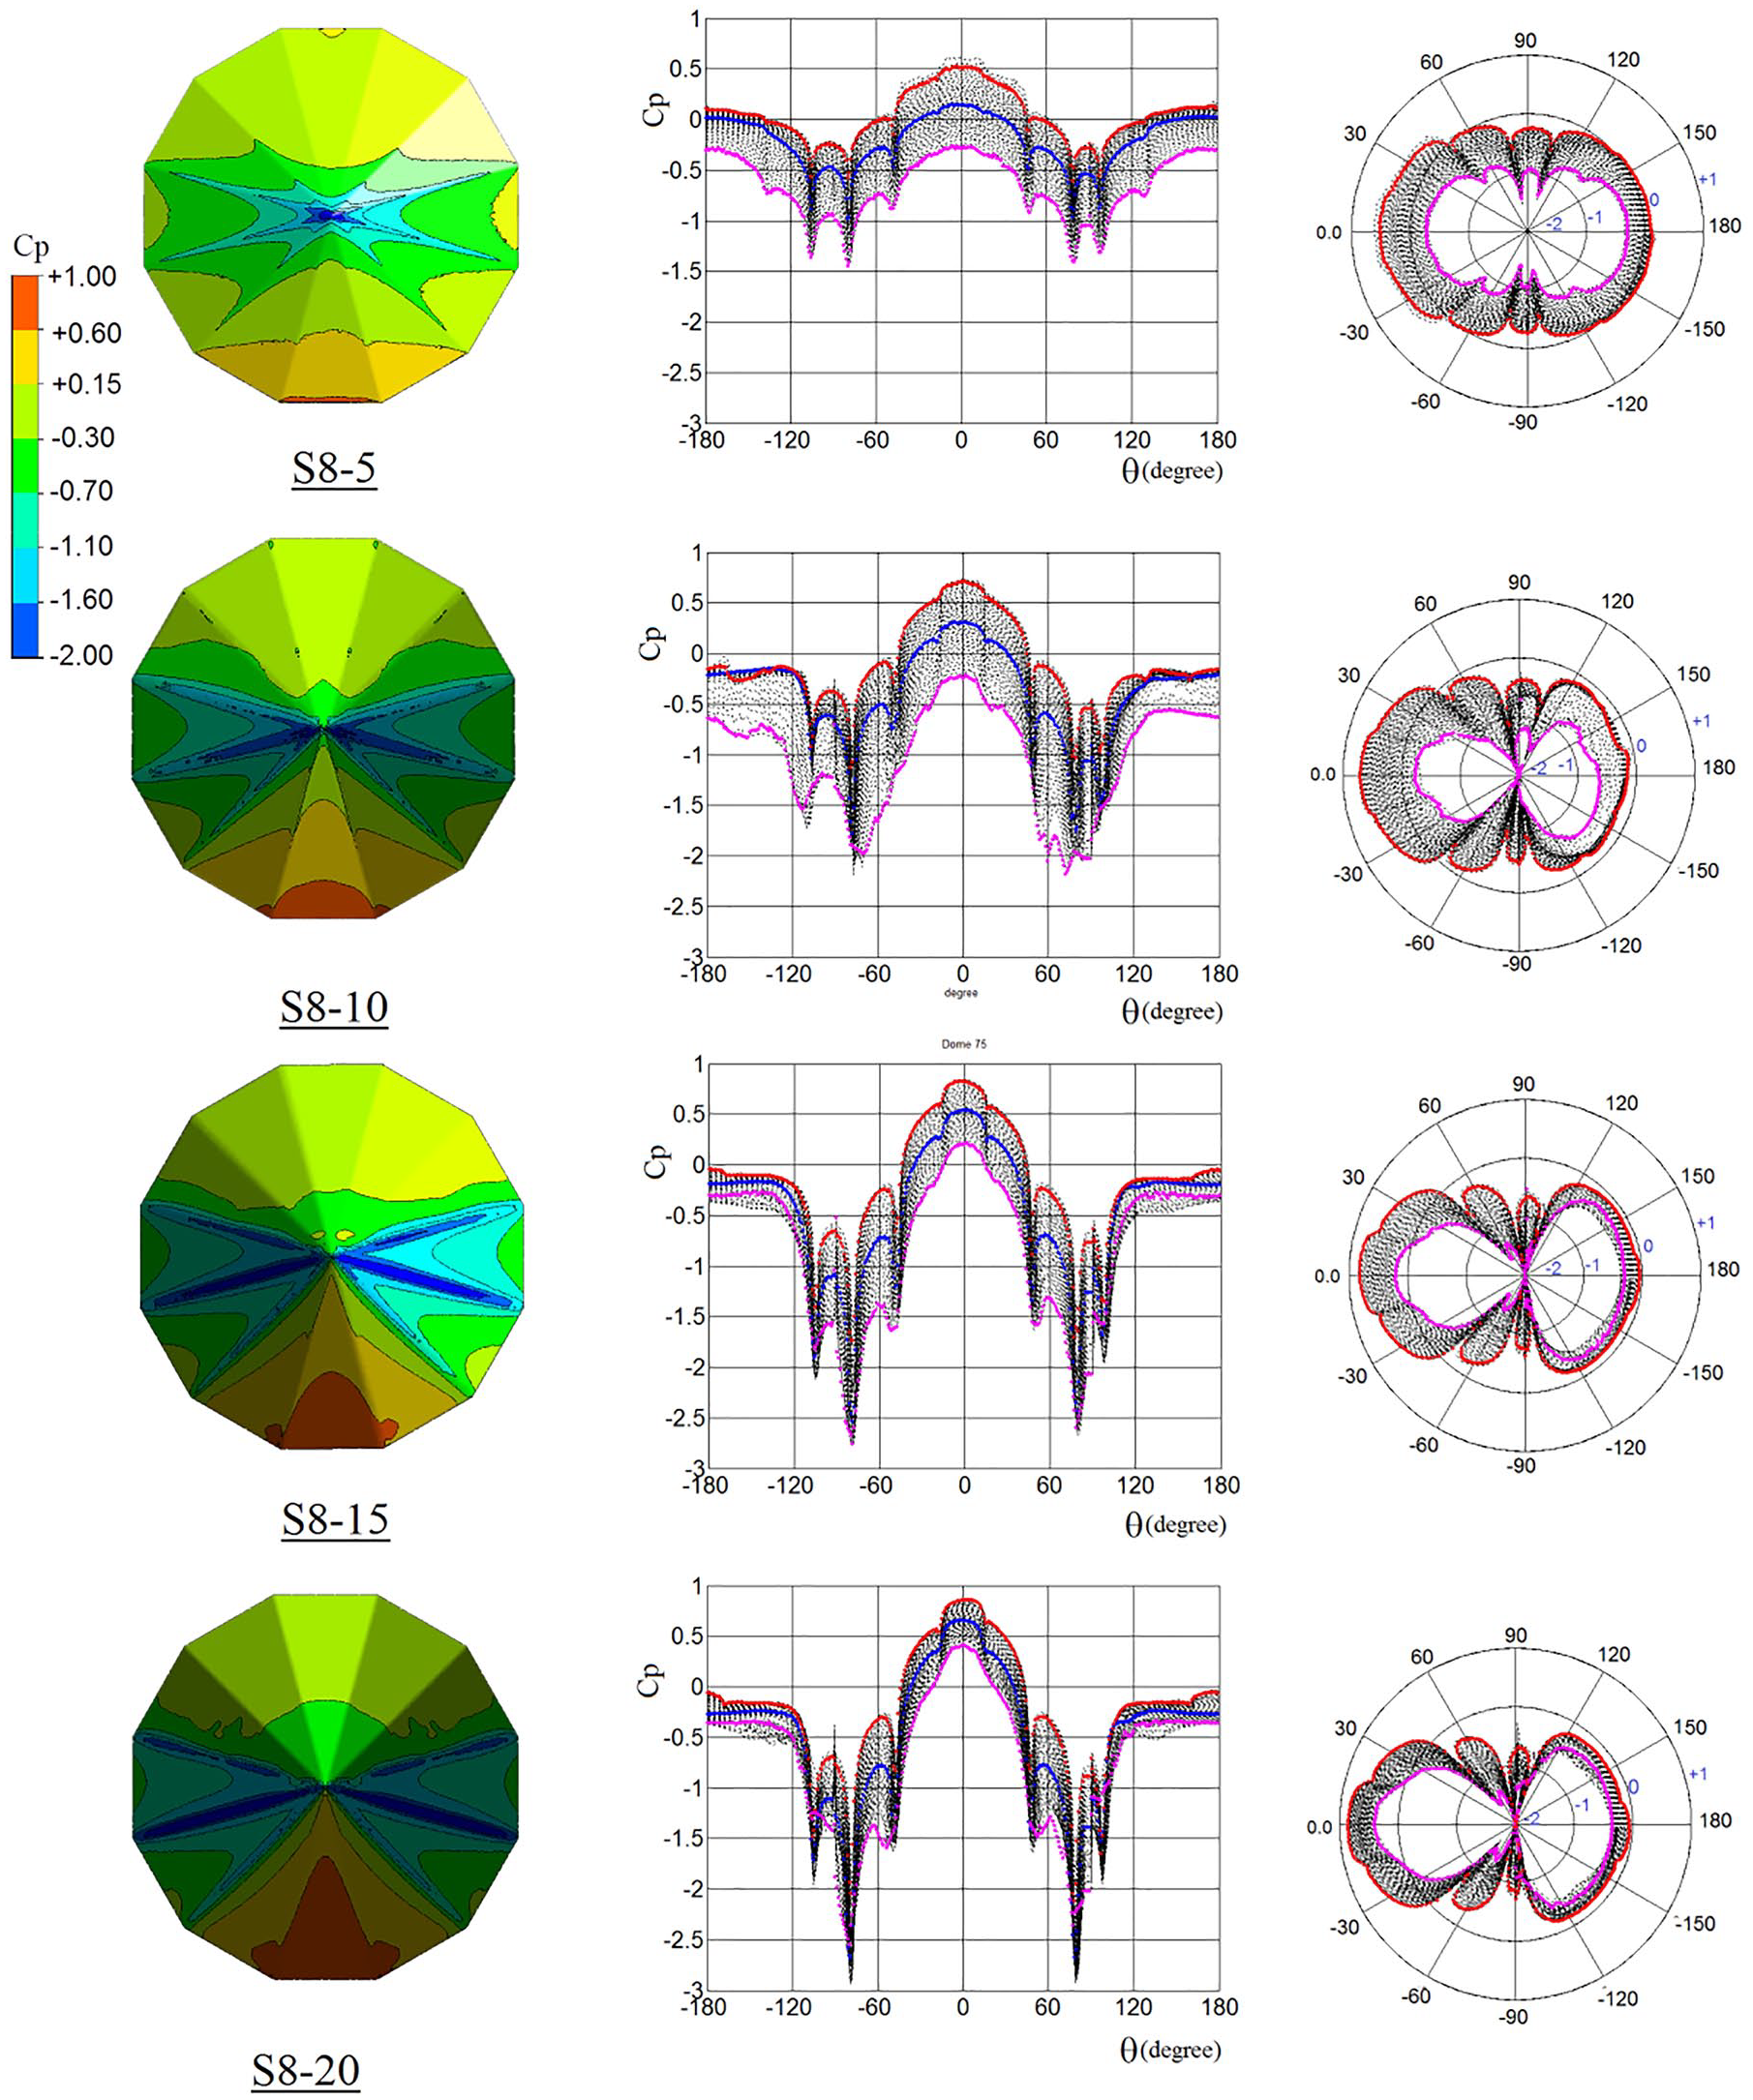
Contours of wind pressure coefficients on 12-sided Pyramids, along with the corresponding values of wind pressure coefficients in Cartesian and polar coordinates.
With an increase in the height-to-span ratios (K), the amount of negative pressure (suction) also increases. Specifically, at the projection located at 75°, the suction values in domes with a height-to-span ratios ranging from K = 0.25 to K = 1 are −1.5, −2, −2.75, and −3, respectively. Distinct jumps in the pressure coefficients are observed at angles of 45°, 75°, and 105°, indicating significant variations in the pressure distribution around these projections.
Figures 11 and 12 depict the behavior of fluid flow around domes with varying Reynolds numbers and height-to-span ratios. These images are derived from Computational Fluid Dynamics (CFD) analysis and illustrate the effects of flow separation and vortex formation as the fluid passes over the domes.
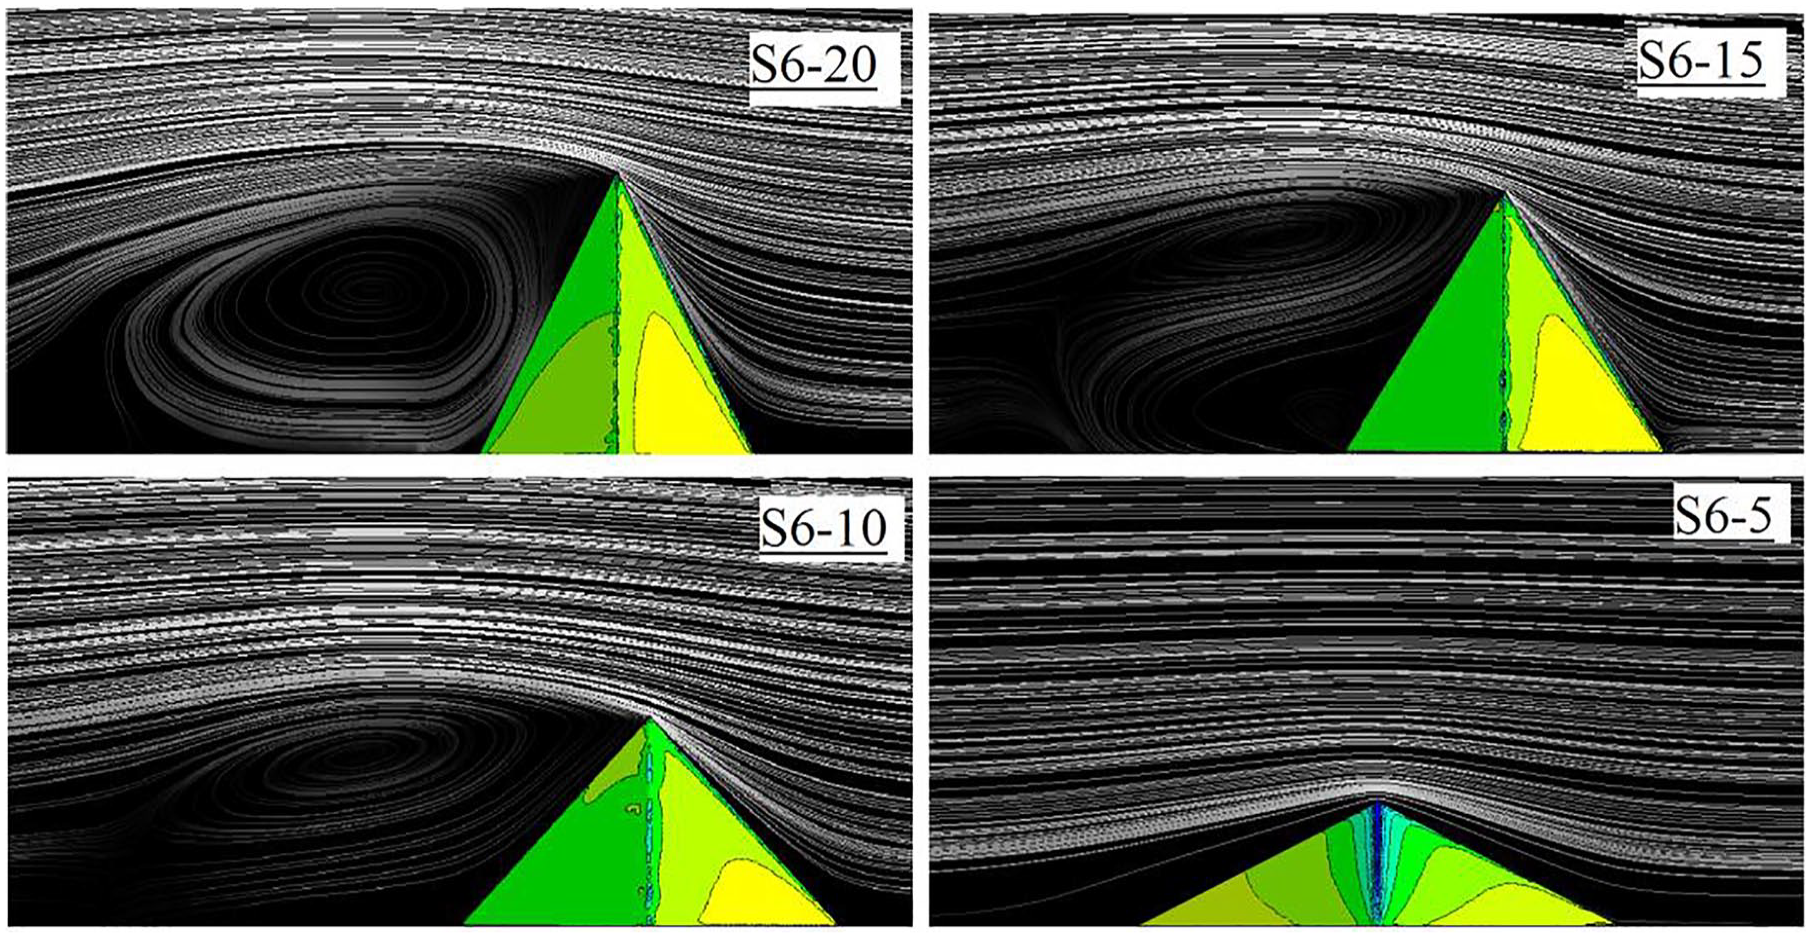
Streamlines in the vicinity of hexagonal pyramids.
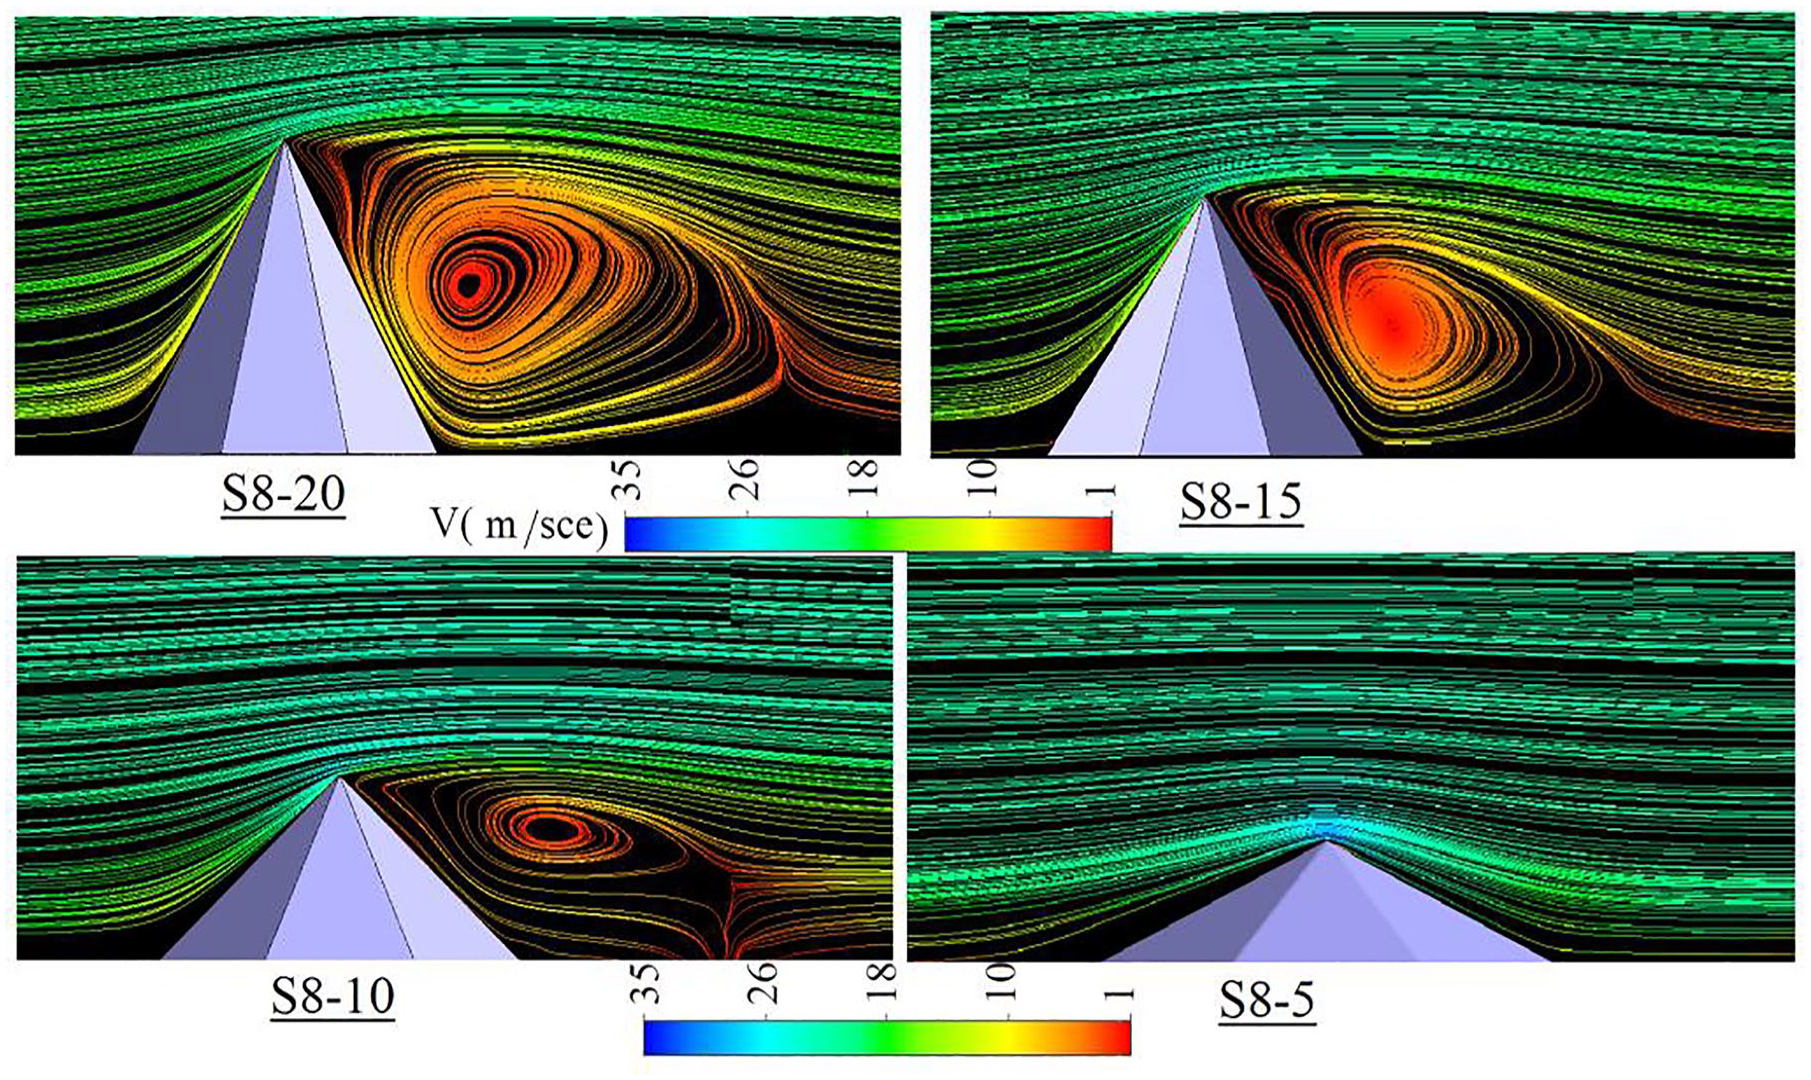
Streamlines in the vicinity of octagonal pyramids.
Reynolds number and viscosity effects
As fluid flows over the dome, the Reynolds number, a dimensionless quantity representing the ratio of inertial forces to viscous forces, dictates the flow behavior. At higher Reynolds numbers, the effects of viscosity are reduced, and the flow becomes more influenced by inertia. This results in a thinner boundary layer on the dome’s surface and leads to flow separation in the downstream region.
Flow separation and vortex formation
With an increase in the Reynolds number, the flow is unable to remain fully attached to the curved surface of the dome, particularly on the leeward side, leading to flow separation. This separation creates vortices or wake regions behind the dome, as demonstrated in the images. The formation of these vortices becomes more pronounced as the height of the dome increases (e.g. in S8-20 and S6-20). The color gradient in the images represents changes in velocity, and the wake region, characterized by swirling motion, forms downstream of the dome.
Pressure coefficients and vortex size
The size of the vortex behind the dome increases with higher Reynolds numbers, which in turn leads to an increase in negative pressure coefficients in this region. The images clearly show that as the dome height increases, the regions of negative pressure behind the dome also expand.
Boundary layer and velocity gradient
The flow outside the boundary layer behaves similarly to an inviscid flow (non-viscous), while the boundary layer itself exhibits a high velocity gradient. This gradient leads to significant shear stresses in regions where the fluid is close to the dome’s surface, ultimately causing flow separation and vortex formation.
In conclusion, in Figures 11 and 12, demonstrate the effects of increasing Reynolds number and height-to-span ratios on fluid flow around domes. Taller domes (S8-20 and S6-20) display larger vortex regions and more negative pressure coefficients, while shorter domes (S8-5 and S6-5) exhibit less flow separation and smaller wake regions. 23
Numerical modeling of conical domes
Given the similarity between conical domes and pyramidal domes, this section models four pyramidal domes with height-to-span ratios of 0.25, 0.5, 0.75, and 1. The diameter of each dome is 20 cm. The results of this modeling are presented in Figure 13. In these domes, the wind pressure coefficients are generally uniform. The main difference between pyramidal domes and conical domes is the presence of a “jump” in the pressure coefficients. As the height-to-span ratios (K) increases, the positive pressure coefficients on the windward side (θ = 0) also increase. Specifically, at K = 0.25, the value of Cp is 0.5, while at K = 1, Cp rises to 0.85.
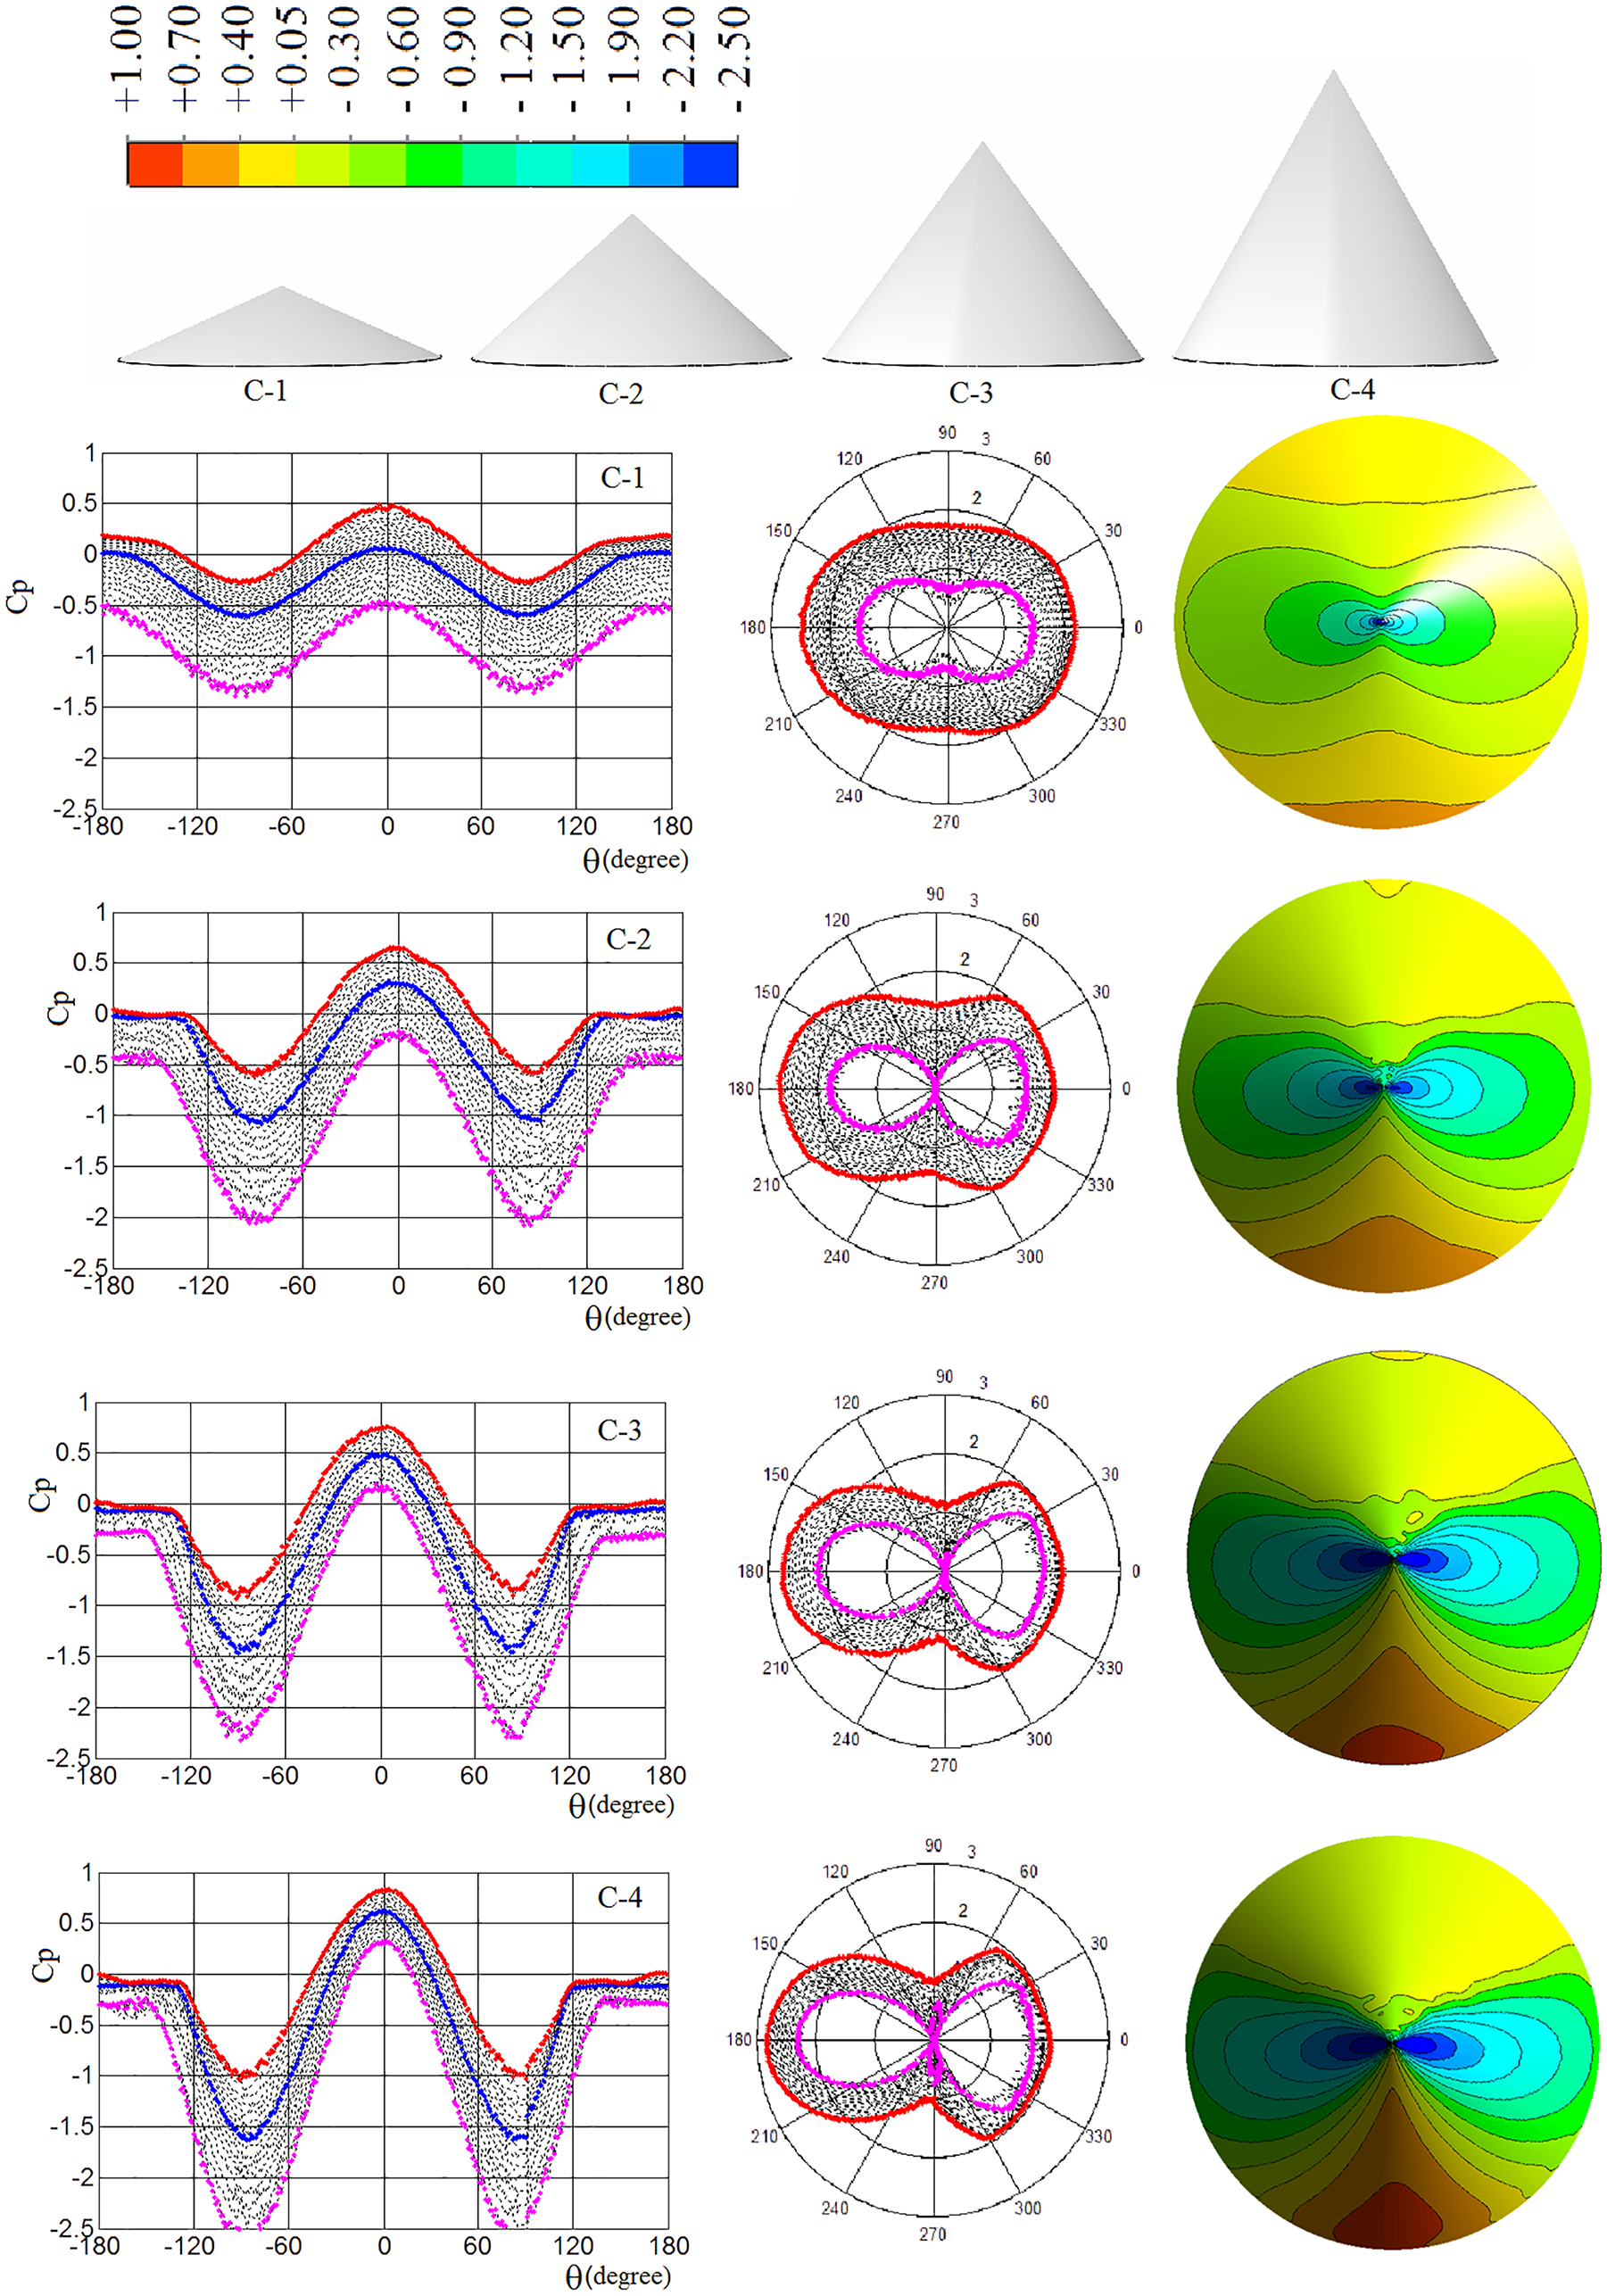
Contours of wind pressure coefficients on conical domes with wind pressure values represented in Cartesian and polar coordinates.
Additionally, the maximum negative pressure coefficient (suction) at an angle of 90° increases as the K ratio rises, with values of −1.35, −2, −2.2, and −2.65 for K = 0.25 to K = 1, respectively. On the leeward side, wind pressure coefficients remain constant around an angle of 120°–140°.
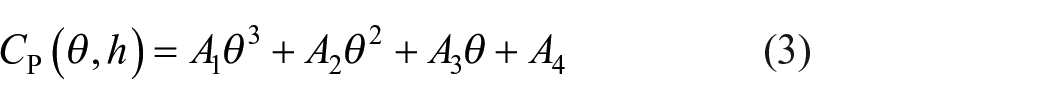
Equation for wind pressure coefficients in conical domes
Equations 2 through 5 present the wind pressure coefficient equations for conical domes at different height levels (H). This equation is divided into two regions, designated as Region 1 and Region 2. In Region 2, the pressure coefficients are equal to the value at θ0 and remain constant. Figure 14 provides a comparison of the pressure coefficients obtained from numerical modeling with those derived from the presented equation, demonstrating the consistency between these results. Tables 2 and 3 list the constant coefficients used in these equations.
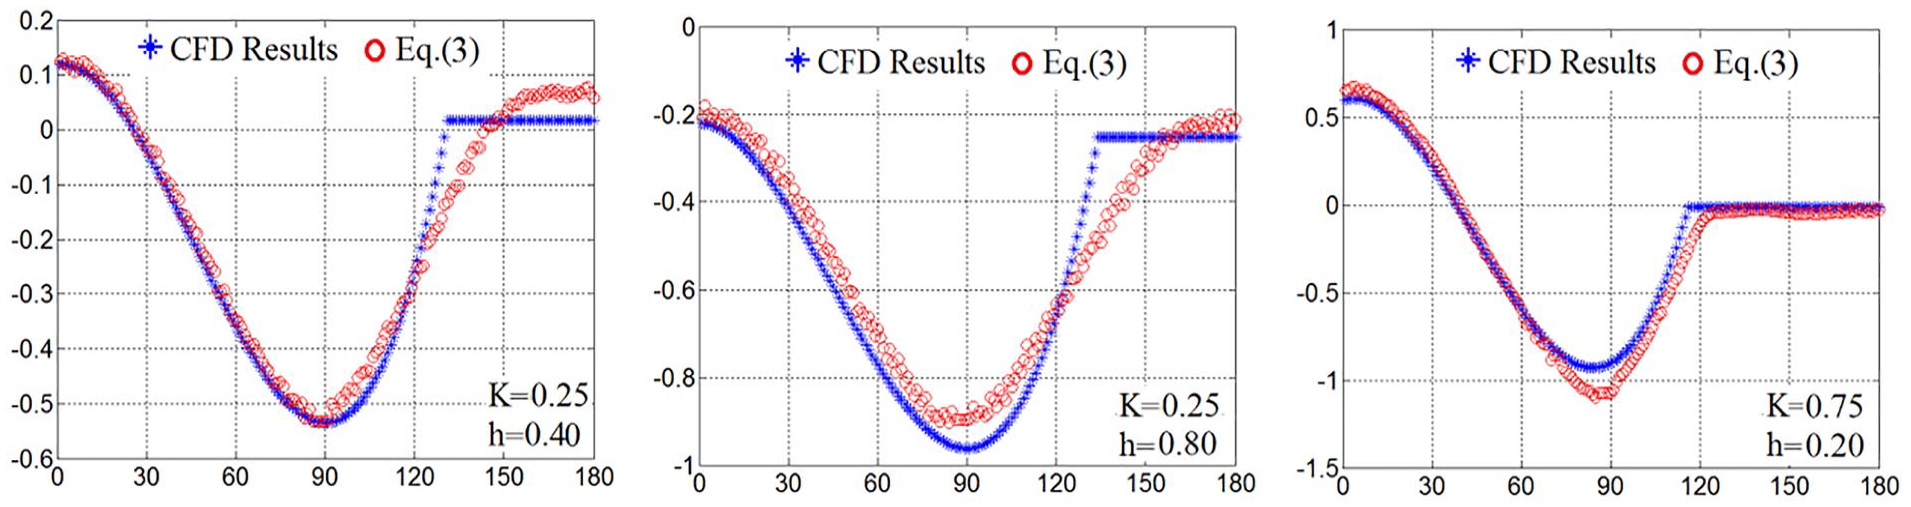
Comparison of wind pressure coefficients from numerical modeling with the proposed equation for conical domes.
Coefficients for the equation of wind pressure coefficients on conical domes.

Constant coefficients used in equation (6) to determine the wind pressure coefficients on conical domes.

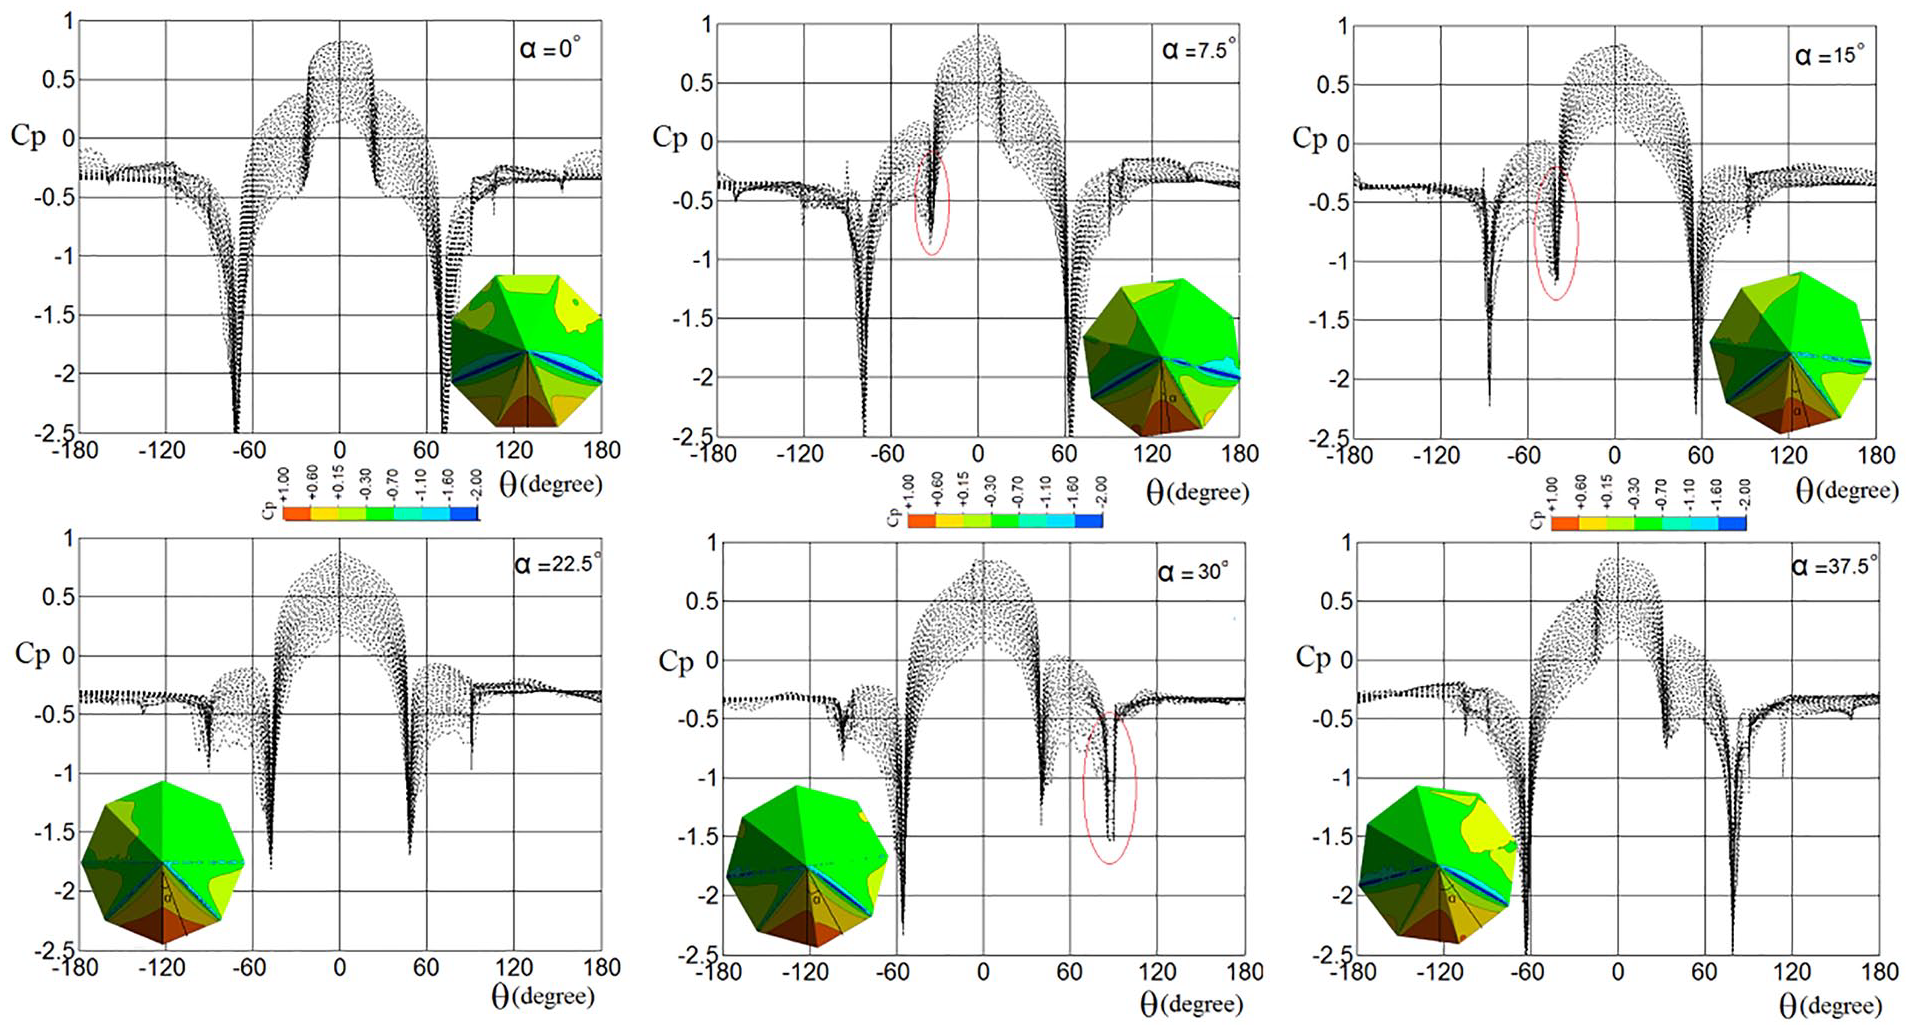
To enhance accuracy in assessing the effect of sector protrusions on variations in wind pressure coefficients, a conical dome with a height of 15 cm (K = 0.75) is modeled with two sectors, each at a 45° angle. This dome was rotated in 15° increments relative to the wind direction to examine the impact of pressure jumps caused by the dome’s protrusions.


In the figure corresponding to α = 0, there is no change in the wind pressure coefficients on the cone. This indicates that the protrusions placed at angles of 0° and 45° are not effective. At α = 30, due to the positioning of the protrusions at the angles of 30° and 75°, the effect of these protrusions on the changes in the wind pressure coefficients is quite evident. Similarly, for α = 60, α = 75, and α = 45, changes in the wind pressure coefficients can be observed. It can be concluded that the ridge located at angles of 45°–90° exhibits the maximum variations in the wind pressure coefficients (Figure 15).

Contour of wind pressure coefficients on a dome with two sectors, including wind pressure coefficient values.
In Figure 16, the changes in the force applied to the dome due to wind at an angle αα are plotted relative to the force at α = 0. The minimum value occurs at an angle of 75°, with a value of 0.88, indicating that, in this case, the force is 12% lower than at α = 0α = 0. Based on this graph, it can be concluded that the pressure coefficients in pyramidal domes are lower than those in conical domes.
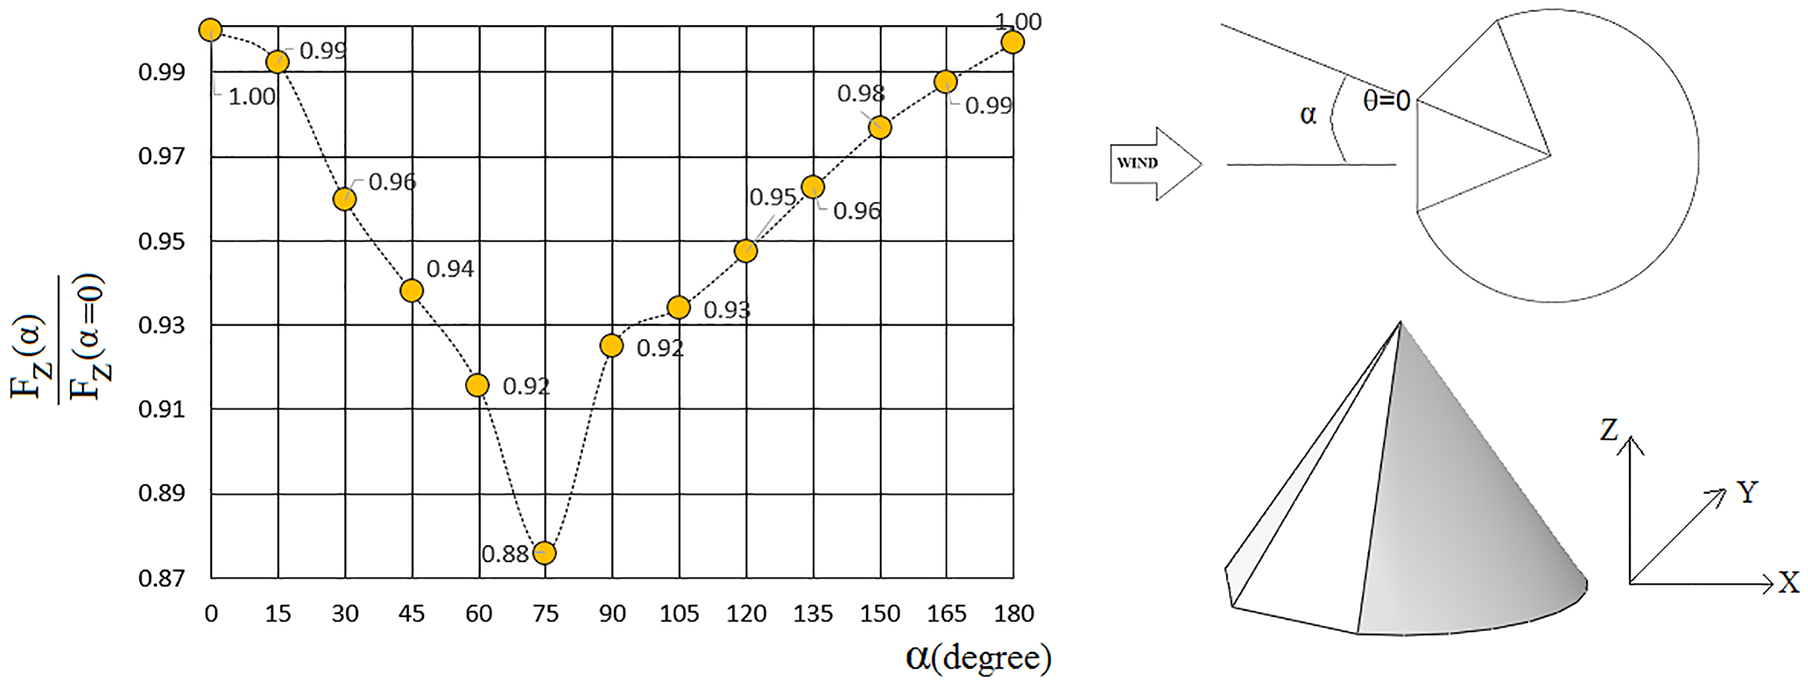
Changes in the reaction of the dome support relative to variations in angle αα compared to the state at α = 0.
In Figure 17, the changes in wind pressure coefficients in response to variations in the wind application angle (αα) are plotted for the eight-sided dome with a height of 15 cm. At this stage of the research, the dome is rotated in increments of 7.5°. At α = 0, only the jump at the protrusion located at θ = −67.5° is observed. When the structure is rotated relative to the wind flow at α = 22.5°, two jumps are observed: one at θ = 90° and the other at θ = −45θ = −45°. This indicates that the protrusion of the sector located at angles between 45° and 90° causes variations in the pressure coefficient.
Changes in wind pressure coefficients in response to variations in wind angle (α\alphaα) in an octagonal dome with a height of 15 cm.
In Figure 18, the pressure coefficients of two types of hexagonal pyramidal domes are compared with those of conical domes for four values of K. The red lines correspond to the pyramidal domes, while the black lines represent the pressure coefficients of the conical domes at different height levels. The difference between the pressure coefficients in the pyramidal and conical domes lies in the jumps occurring at the sector protrusions. It can be observed that the Cp values for the pyramidal domes with K ratios of 0.25, 0.50, and 0.75 are lower than those of the conical domes.

Comparison of wind pressure coefficients in hexagonal domes and conical domes.
In Figure 19, the Cp values in octagonal domes are compared with those in conical domes. It can be seen that the pressure coefficients of the pyramidal dome with a 8 side are nearly similar to those of the conical dome

Comparison of wind pressure coefficients in octagonal domes and conical domes.
Considering the differences between pyramidal domes and conical domes, the equation for wind pressure coefficients in the area of the sector bulge is presented. This equation is illustrated in Figure 20.
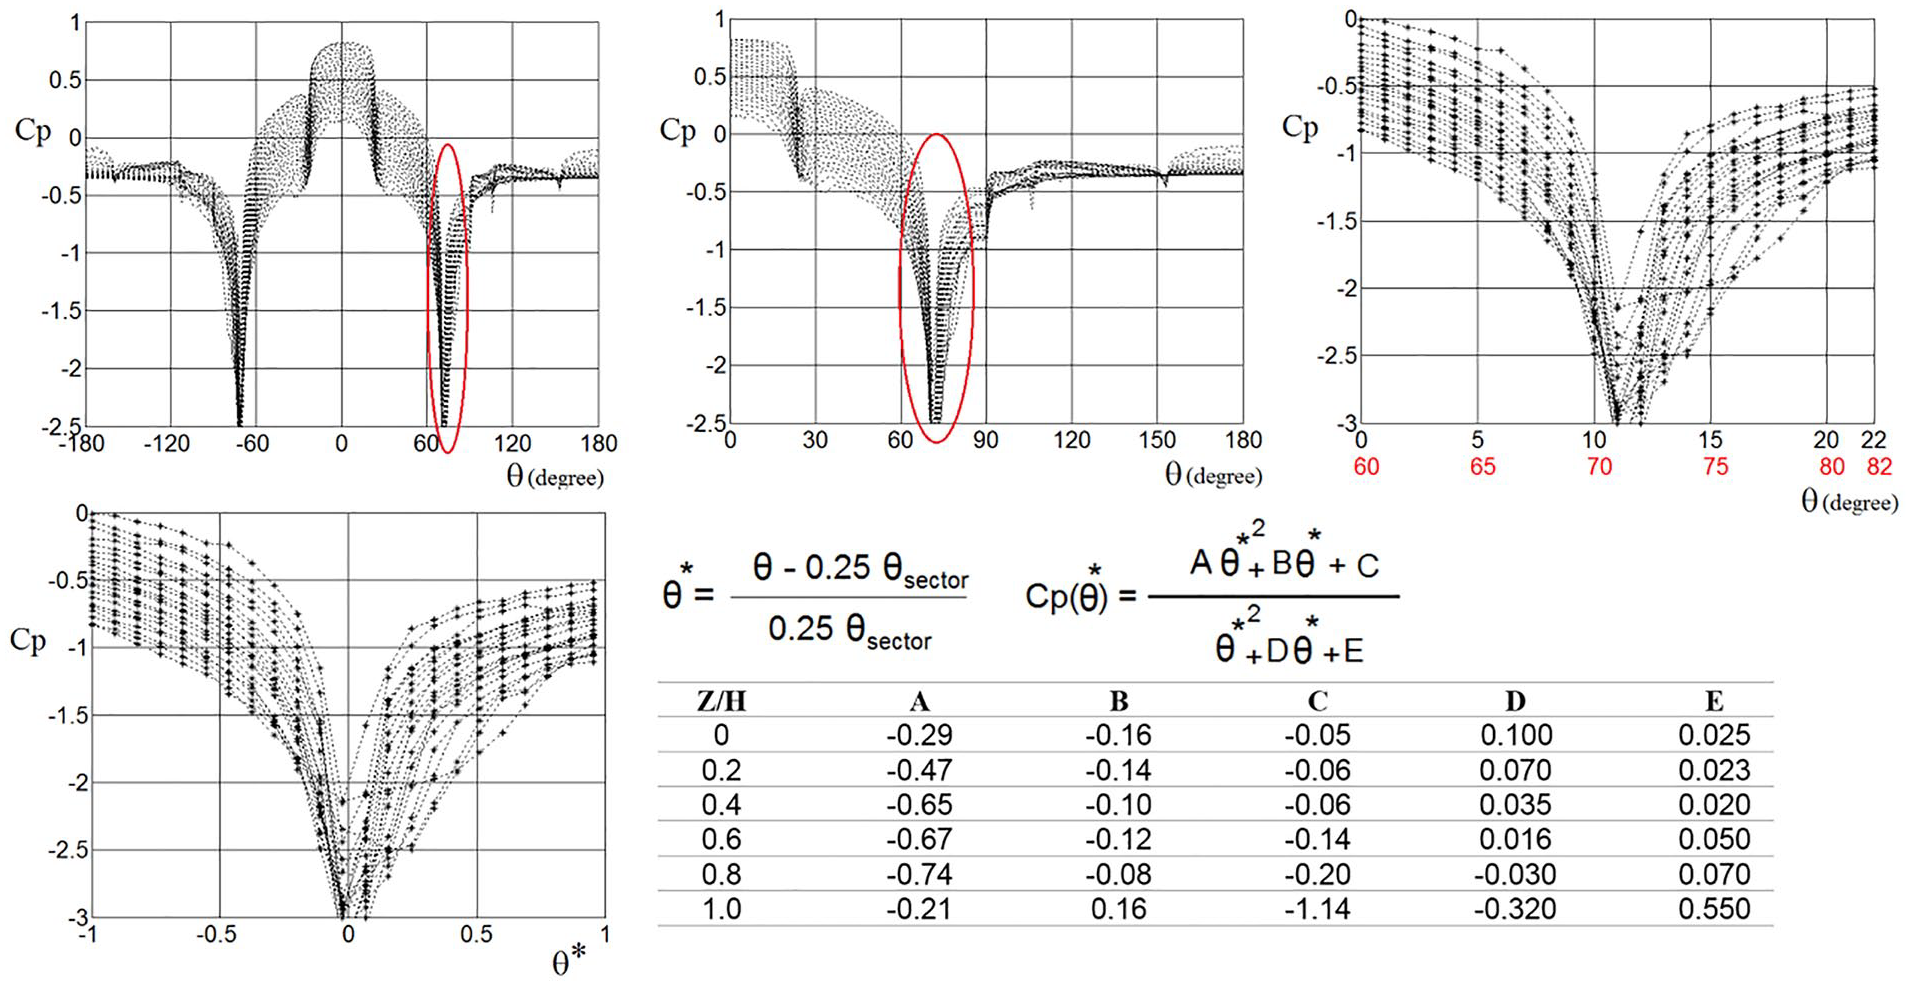
Equation for wind pressure coefficients in the sector of pyramidal domes.
Conclusion
The results indicated that the height-to-span K ratio (H/D) plays a significant role in the distribution of wind pressure coefficients; as K increases, positive wind pressure coefficients on the windward side of pyramidal domes also increase. In these domes, due to the presence of localized protrusions at specific angles, protrusions of the sectors in pressure coefficients are observed. This characteristic was not found in conical domes, where pressure coefficients remained more uniform across the surface, indicating a greater sensitivity of pyramidal domes to geometric features. This distinction is particularly important in designing pyramidal structures in areas with high wind exposure.
Additionally, as dome height increases, vortex flow behind the structures intensifies, resulting in an increase in negative pressure (suction) in the leeward area. This effect is especially evident in taller domes due to thinner boundary layers and increased flow separation, creating wider wake regions behind the structures. The pressure coefficients in conical domes were higher than those in hexagonal pyramidal domes; thus, using conical dome pressure coefficients for the design of hexagonal pyramidal domes would lead to an uneconomical structure.
This study, by introducing validated numerical models and developing equations related to pressure coefficients, contributes to a better understanding of aerodynamic behaviors in complex dome structures. The findings can assist structural designers in achieving safer and more economical designs, especially for modern and lightweight structures exposed to lateral wind loads. These insights provide valuable guidance for structural engineers in designing domes with enhanced stability against dynamic wind conditions.
Additional findings
Pressure Coefficients on the Leeward Side: Positive pressure coefficients on the side opposite the wind increased with dome height. In the studied domes, the maximum positive pressure coefficient (Cp) at the angle θ = 0 reached +1, consistent across both wind tunnel tests and numerical modeling.
Wind-Facing Area: On the wind-facing side, at an approximate angle of 120°–140°, wind pressure coefficients remained negative and constant. In conical domes, this angle is represented by the parameter θ = 0 in Equation 4, with its exact value provided in that equation.
Sector Protrusion Effect: The protrusion located at an angle from θ = 45 to θ = 120 caused variations in pressure coefficients, while protrusions outside this range did not affect pressure coefficient fluctuations.
Increased Vortex Flow with Height: As dome height increased, vortex flow behind the structure intensified, leading to increased negative pressure (suction).
Sector Quantity Influence: With an increase in the number of sectors, the pressure coefficients of pyramidal domes approached those of conical domes, suggesting that the presence of individual sectors may be less critical.
Economics of Pressure Coefficients: The pressure coefficients in conical domes were higher than those in hexagonal pyramidal domes. Using these higher coefficients for the design of hexagonal pyramidal domes would result in an unnecessarily conservative and uneconomical design.
Footnotes
Declaration of conflicting interests
The author(s) declared no potential conflicts of interest with respect to the research, authorship, and/or publication of this article.
Funding
The author(s) received no financial support for the research, authorship, and/or publication of this article.