
Abstract
Sexual partner homophily is the tendency of individuals to choose partners similar to themselves. The extent and nature of partner homophily influences the structure of sexual networks and hence the spread of sexually transmitted infections (STIs). In this paper, we compare homophily by ethnicity, age and educational status in representative populations from five African cities in Benin (Cotonou), Cameroon (Yaounde), Kenya (Kisumu), Zambia (Ndola) and South Africa (Carletonville). We find low rates of homophily by age and high rates for educational status throughout the region. There is a large variation in homophily by ethnicity between these five cities, with rates lowest in Ndola. In Carletonville, there is a gendered difference in homophily by ethnicity. We discuss the possible implications these variations in the extent and type of homophily may have for STI transmission in the region.
Introduction
The homophily principle, that similarity encourages connection, structures network connections of multiple varieties. These include friendship, sexual relations and marriage. 1 Laumann et al., made a thorough evaluation of the extent to which this phenomenon affects sexual partnering in the USA. Utilizing the National Health and Social Life Survey (NHSLS), they found that the vast majority of sexual relationships occurred within certain ‘master-status’ categories such as race/ethnicity, education, age and religion 2 (see Table 1).
Homophily for ethnicity, age and educational outcome by short-term and long-term relationships in the four African cities (Four Cities Study) and the USA National Health and Social Life Survey (NHSLS)
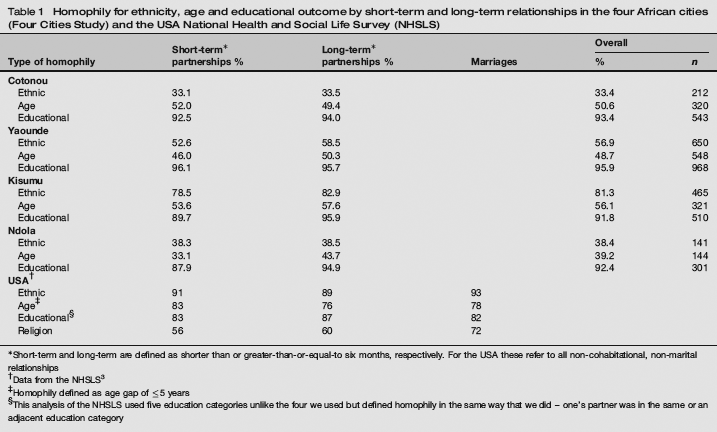
Short-term and long-term are defined as shorter than or greater-than-or-equal-to six months, respectively. For the USA these refer to all non-cohabitational, non-marital relationships
Data from the NHSLS 3
Homophily defined as age gap of ≤5 years
This analysis of the NHSLS used five education categories unlike the four we used but defined homophily in the same way that we did – one's partner was in the same or an adjacent education category
Given the socially embedded nature of the sexual partnering process these homophilous outcomes should not come as a surprise. It is however likely that the degree and nature of sexual partner homophily would vary between different communities. We could find no literature reporting the extent of homophily by race/ethnicity or education for sub-Saharan Africa. The details of how a sexual network is structured are an important determinant of STI spread across that network. As a result, STI epidemiology would be enriched by describing the various social forces which influence this network structure. Homophily is one such force. Using data from a number of surveys including the NHSLS, a number of studies have demonstrated that differences in network structure explain a significant proportion of the differing STI rates by race/ethnicity in the USA.4,5 For these differences in racial/ethnic network structure to have this effect on STI spread, these networks need to be significantly segregated – or exhibit homophily by ethnicity. 4 At least one study in sub-Saharan Africa has found that similar differences in network structure may underpin racial differences in STIs in sub-Saharan Africa. 6 Unlike the NHSLS, these studies have had to assume a high degree of ethnic homophily since few sexual behaviour surveys have asked what ethnic group (s) the partners of the respondent belonged to. So too the various models depicting the HIV epidemic in South Africa have had to assume, in the absence of any published evidence on this topic, a high degree of homophily by ethnicity. 7 In this study, we describe the extent of ethnic, educational and age homophily in sexual partnering in the four cities surveyed in the Four Cities Study (FCS) and the Carletonville Youth Survey (CYS).
Methodology
Four Cities Study
The FCS was a cross-sectional population-based study conducted in two high and two low HIV prevalence African cities in 1997/1998. Full details of the methodology are presented by Buvé et al. 8 It was designed to explain differences in the rate of HIV spread in Africa. Representative samples of around 1000 men and 1000 women 15–49-year-olds were obtained in each city. Response rates were generally good -the only groups falling below 82% were men in Yaounde (76%) and Ndola (75%). 8 Respondents had detailed demographic and sexual histories taken. The demographic questions included questions about the respondents’ educational qualifications, self-defined ethnicity and age. The sexual history started with questions about their spouses and then any non-spousal sexual partners the respondent had had in the previous 12 months. Details were collected on up to eight non-spousal partners in the past year. These questions included asking about the partner's age, education, ethnicity and how many possible other sex partners the partner had had in the previous 12 months. Unfortunately, these homophily questions were only asked about the non-spousal partners and not the spouses. We used these questions to compare the percentages of in-choice for three variables in each of the cities between the respondent and their most recent non-spousal sex partner. The three variables were highest educational qualification, age gap and ethnic group. The respondent provided the answers to all these questions.
Education level attained: The highest education level attained by the respondent and their partner were both divided into four categories: no schooling or less than primary school completed, primary school completed, secondary school completed or more than secondary school completed. A relationship was defined as homophilous for education if they were both in the same education category, or they were separated by no more than one education category.
Age: A relationship was regarded as exhibiting homophily by age if there was less than five years age gap between the two individuals.
Ethnicity: Ethnic-homophily was defined as both individuals belonging to the same ethnic group (as defined by the respondent). Only ethnic groups which comprised 2% or more of the populations were evaluated.
Homophily for these three characteristics were stratified by the length of the relationship. Relationships that had lasted less than six months were defined as short-term and those that lasted six months or longer as long-term.
Carletonville Youth Survey
The CYS consisted of a representative sample of 723 men and 784 women between the ages of 14 and 24 living in a township to the northwest of Carletonville. The sampling scheme was arranged so as to be self-weighting. The occupants of 89% of the selected houses were located and 11.3% of potential participants declined to participate. They were questioned about background characteristics as well as sexual partnerships – both spousal and up to five non-spousal partners in the previous year. Respondents defined what ethnic group they and these partners belonged to. The ethnicity of the spouses was not assessed. The respondent was also asked about the age but not the educational level of their partners. For a more detailed description of the survey methodology see Auvert et al. 9 We compared in-choice homophily rates by ethnic group for the most recent five non-spousal partners in the past year. We defined homophily for these categories in the same way as defined for the FCS.
In-choice homophily rates will be higher in more numerous ethnic groups simply by virtue of its larger size. To compensate for this we compute a measure (termed the homophily bias) that captures the probability that an individual in one ethnic group will choose an individual from the same group over and above the chance of doing so based on the size of the group alone. 3 This measure πi is calculated for each group via the following formula:

δi is the observed proportion of within-group selections of group i. Ni is the number of persons in group i, and N is the number of persons in the whole population. 3
Since the CYS and FCS were representative samples of the local cities (14–24-year-olds in the CYS and 15–49 in the FCS), the proportional size of each ethnic group in each city was assumed to be the same as its proportion in the FCS or CYS survey.
To calculate the maximal racial homophily rates in Carletonville, we assessed what proportion of non-spousal relationships were with a partner whose ethnic group was labelled as ‘Unknown’ or ‘Other’.
NHSLS
The National Health and Social Life Survey (NHSLS), conducted in 1992, was a nationally representative probability sample of 1511 men and 1921 women between the ages of 18 and 59 years from the United States of America (USA). The response rate was 79%. We used the homophily rates for ethnic group, age, education and religious group as published by Laumann et al. 2
Results
Percentage homophily rates for education were found to be high in all four cities, with little difference between cities and between short- and long-term relations. By way of contrast, only approximately half of relationships were found to be homophilous for age (and only 39% of relationships in Ndola) with little difference between short- and long-term relationships.
The proportions of relationships that were homophilous for ethnicity varied widely between and within different regions. In almost all ethnic groups the respondent's most recent sexual partner was more likely to have been a member of their ethnic group than expected if they had chosen their partner randomly. This is reflected in the positive values of the homophily bias indicator. The homophily figures from Ndola were noticeably lower than other regions – including the only three negative homophily bias scores encountered. Within each region there was considerable heterogeneity in homophily bias with no clear relation to the relative size of the ethnic group. This variation in homophily bias may be due to the artificial way that it considers all ethnic groups as equally distinct from one another. The ethnic groups in Carletonville are defined in terms of language spoken and these languages can be grouped in a number of different ways. One well-established way (justified in part by phylolin-guistics) is grouping together the Nguni languages (isiXhosa, isiZulu, siSwati and Ndebele), and the Sesotho languages (Sesotho and Setswana). 10 To test if individuals are more likely to have sexual partners from within these language groups we compared in-choice and homophily bias within the Nguni and Sesotho language groups. As shown in Table 2, the homophily bias increased considerably in the Sesotho and Setswana, but only slightly in the isiXhosa and it decreased in the isiZulu. To further explore this phenomenon we compared within- and between-ethnic group choice by gender as in Table 3. It is apparent from this table that much of this increase in homophily bias in the Sesotho language group is due to the high rates of Sesotho men partnering with Setswana women. A further noticeable feature revealed in Table 3 is that in-choice percentages are higher for women than men in all the ethnic groups excluding the Setswana.
In-choice rates and homophily-bias among all non-spousal relationships, by ethnic group (Four Cities Study, Carletonville Youth Survey and National Health and Social Life Survey)
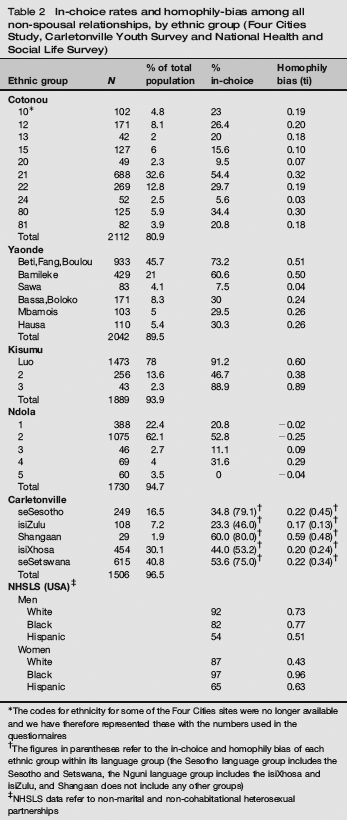
The codes for ethnicity for some of the Four Cities sites were no longer available and we have therefore represented these with the numbers used in the questionnaires
The figures in parentheses refer to the in-choice and homophily bias of each ethnic group within its language group (the Sesotho language group includes the Sesotho and Setswana, the Nguni language group includes the isiXhosa and isiZulu, and Shangaan does not include any other groups)
NHSLS data refer to non-marital and non-cohabitational heterosexual partnerships
Ethnicity of respondents (rows) and their partners (columns), by gender (row percentages) (CYS)
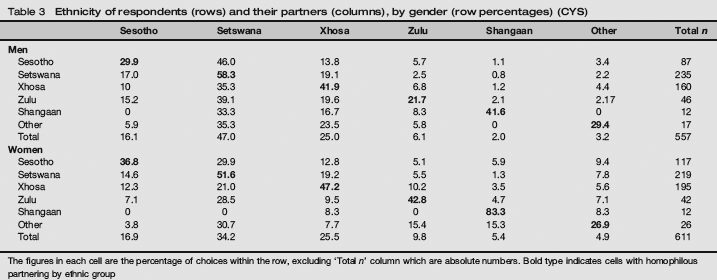
The figures in each cell are the percentage of choices within the row, excluding ‘Total n’ column which are absolute numbers. Bold type indicates cells with homophilous partnering by ethnic group
When the respondents from the township in Carletonville, who were themselves all black Africans, were asked what ethnic group their partner belonged to, their answer was coded into 12 categories. One to 10 were various black African ethnic groups, 11 was ‘Don't know’ and 12 was ‘Other’. Forty-four of 2972 relationships (1.8%) were categorized as ‘Other’ or ‘Unknown’. This figure of 1.8% could be regarded as the upper limit of the proportion of non-spousal partnerships that could be with individuals of other racial groups.
Homophily rates were not higher in longer duration relationships as postulated in some literature on the topic. 3
Discussion
There is a need to focus more investigations on the structure of sexual networks in populations with generalized HIV epidemics. 3 There is little published on the patterns of within-and between-group partnering in sub-Saharan Africa. Much of the literature on this topic is from developed countries such as the USA where research has found that most sexual relationships occurred within the ‘master-status’ categories of race/ethnicity, education, age and religion. Our analysis of five city populations in Africa finds that while this is true for education, homophily rates are considerably lower for age and ethnicity. There are a number of possible reasons for this. Firstly, there are a number of problems with comparing the various surveys, including the differences in ages and the fact that the NHSLS was a nationally representative survey whereas the African surveys are representative of particular urban communities. Urban communities tend to be more cosmopolitan and libertarian in terms of sexuality. 11 This may have the effect of lowering the homophily bias. Secondly, there is a greater racial heterogeneity in the USA than in the populations surveyed in the Four Cities Study. It could be argued that one is comparing racial homophily in the USA with ethnic homophily in Africa. The low degree of interracial mixing found in Carletonville (where there is a more heterogenous racial population in the town at large) suggests that racial homophily rates in this part of Africa may be even higher than the USA. An important limitation of our analysis is that it did not consider homophily by class. This was due to the fact that none of the surveys used in the study collected data on the socioeconomic status of the partners. In a setting such as Carletonville (South Africa), where class and race still overlap to a significant extent, high racial homophily rates may to large extent be determined by class rather than racial homophily. 12
The nature and strength of homophily have important consequences for the structure of sexual networks and hence STI transmission. 3 Low homophily rates for age are indicative of higher rates of intergenerational sex – which has been implicated in HIV transmission.5,13 High homophily rates by ethnicity tend to concentrate STIs in particular communities. 4 The low rates found in this study could thus facilitate a STI epidemic becoming generalized in the population. There are considerable variations in HIV prevalence between different ethnic groups in Southern and Eastern Africa, not all of which can be explained by differential circumcision rates. 7 Differences in factors which structure sexual networks (such as homophily) may be important determinants.
Future research that maps the multiplexity of sexual and social networks, their interactions and their correlation with STI transmission in a prospective fashion in local African contexts could contribute important insights into HIV epidemiology.
Footnotes
Acknowledgements
We would like to thank the Bertran Auvert, Catherine Campbell and Brian Williams for making the data from the Carletonville Youth Survey available to us and all the authors of the Four Cities study for proving their dataset to us. Special thanks are due to Anne Buve for comments on this paper.