



Abstract
General intelligence (g) and virtually all other behavioral traits are heritable. Associations between g and specific single-nucleotide polymorphisms (SNPs) in several candidate genes involved in brain function have been reported. We sought to replicate published associations between g and 12 specific genetic variants (in the genes DTNBP1, CTSD, DRD2, ANKK1, CHRM2, SSADH, COMT, BDNF, CHRNA4, DISC1, APOE, and SNAP25) using data sets from three independent, well-characterized longitudinal studies with samples of 5,571, 1,759, and 2,441 individuals. Of 32 independent tests across all three data sets, only 1 was nominally significant. By contrast, power analyses showed that we should have expected 10 to 15 significant associations, given reasonable assumptions for genotype effect sizes. For positive controls, we confirmed accepted genetic associations for Alzheimer’s disease and body mass index, and we used SNP-based calculations of genetic relatedness to replicate previous estimates that about half of the variance in g is accounted for by common genetic variation among individuals. We conclude that the molecular genetics of psychology and social science requires approaches that go beyond the examination of candidate genes.
Genetics has great potential to contribute to psychology and the social sciences for at least two reasons. First, because human behavior involves the operation of the brain, understanding the genes whose expression affects the development and physiology of the brain can further our understanding of the causal chains connecting evolution, brain, and behavior. Second, because genetic differences can potentially account for some individual differences in cognitive function, behavior, and outcomes, any effort to characterize the structure of human differences that does not incorporate genetics will be incomplete and possibly misleading.
Within psychology, the genetics of behavior has been explored since the earliest twin studies (for an overview, see Plomin, McClearn, McGuffin, & DeFries, 2008). Studies on behavioral genetics have shown that nearly all human behavioral traits are heritable (Turkheimer, 2000). If a trait is heritable in the general population, then in principle it should be possible—with sufficiently large samples—to identify molecular genetic variants that are associated with the trait.
General cognitive ability, or g (Neisser et al., 1996; Plomin et al., 2008; Spearman, 1904), is one of the most heritable behavioral traits. Estimates of broad heritability as high as 0.80 have been reported for adult IQ in modern Western populations (Bouchard, 1998). Although such heritability estimates have been the topic of much debate, the claim that IQ is at least moderately heritable is widely accepted. The heritability of IQ may in fact be similar to that of height (Weedon & Frayling, 2008). Both IQ and height are genetically “complex” because these traits are not determined by single genetic variants but rather are influenced by many genes that act in concert with environmental factors. Finding genes associated with g could yield many potential benefits, including new insights into the biology of cognition and its disorders. Such discoveries might suggest new therapeutic targets or pathways for treatments to improve cognition. Uncovering the molecular genetics of other traits and abilities, such as personality traits, time and risk preferences (e.g., impatience, risk aversion), and social skills, could have similarly beneficial consequences (Benjamin et al., 2007).
There is currently a large body of candidate-gene studies that have shown associations between many single-nucleotide polymorphisms (SNPs) and g. 1 Payton (2009) produced a comprehensive review of these studies. (For additional details, see Previous Replication Attempts for SNPs Under Study in the Supplemental Material available online.) In this article, we report the results of a series of attempts to replicate as many reported SNP-g associations as possible, using data from three large, independent, well-characterized longitudinal samples. We began, in Study 1, with data from the Wisconsin Longitudinal Study (WLS; www.ssc.wisc.edu/wlsresearch), which includes genotypes for 13 of the SNPs reported by Payton (2009) to have published associations with g. These 13 SNPs are located in or near 10 different genes. In follow-up studies, we tested 10 of the original 13 SNPs that were available in two other samples. We examined these SNPs’ associations with g using data from the Framingham Heart Study (FHS; www.framinghamheartstudy.org) in Study 2 and using data from the Swedish Twin Registry (STR; ki.se/ki/jsp/polopoly.jsp?d=9610&l=en) in Study 3. Although we analyzed them separately, the combined sample of these data sets comprised almost 10,000 individuals, which gave us considerable statistical power.
If the published SNP-g associations we examined were accurate reflections of true correlations in the general population, then we would expect many of them to replicate at the 5% significance level in our much larger data sets. However, if reported SNP-g associations are mostly false positives, we would expect few replications in our data. Such a result would not likely be due to differences in the methods used to estimate g in the various data sets of our three studies, given that g can be reliably measured by a wide variety of tests (Ree & Earles, 1991).
Study 1
Method
The original WLS sample comprised one third of the high school students in Wisconsin who graduated in the spring of 1957 (N = 10,317). A randomly selected sibling of each graduate in a subsample of these subjects was enrolled in the study in 1977, and a randomly selected sibling of each remaining graduate was enrolled in the study in 1993 (N = 5,219). As our measure of g for both graduate and sibling subjects, we used their scores on the Henmon-Nelson Test of Mental Ability (Lamke & Nelson, 1957), taken when the subjects were in the 11th grade; these scores were obtained from administrative records. Percentile scores were rescaled to the conventional IQ metric, with a mean of 100 and a standard deviation of 15.
Of the 90 SNPs genotyped in the WLS, we studied all 13 that had been previously associated with g according to Payton’s (2009) review. These were rs429358 and rs7412 in the apolipoprotein E (APOE) gene (these SNPs define the e2/e3/e4 haplotype associated with Alzheimer’s disease); rs6265 in the brain-derived neurotrophic factor (BDNF) gene; rs2061174 in the cholinergic receptor, muscarinic 2 (CHRM2) gene; rs8191992 in the CHRM2 and cholinergic receptor, nicotinic, alpha 4 (CHRNA4) genes; rs4680 in the catechol-O-methyltransferase (COMT) gene; rs17571 in the cathepsin D (CTSD) gene; rs821616 in the disrupted in schizophrenia 1 (DISC1) gene; rs1800497 in the dopamine receptor D2 (DRD2) and ankyrin repeat and kinase domain containing 1 (ANKK1) genes; rs1018381 and rs760761 in the dysbindin (DTNBP1) gene; rs363050 in the synaptosomal-associated protein 25 (SNAP25); and rs2760118 in the succinic semialdehyde dehydrogenase (SSADH) gene (also known as the aldehyde dehydrogenase 5 family, member A1 gene, or ALDH5A1).
Of the 6,908 WLS respondents with adequate covariate and genotype data, 5,571 had data for g and for all 13 SNPs previously associated with g. All 13 SNP genotypes were in Hardy-Weinberg equilibrium, and their frequencies matched those reported in the literature for European samples.
As positive controls to check for global problems in genotyping or data quality, we also tested two established genotype- phenotype associations: associations between the APOE gene and Alzheimer’s disease and between the fat mass and obesity associated (FTO) gene and body mass index. We tested the two SNPs in APOE that define the common haplotype known to be associated with Alzheimer’s disease (e2/e3/e4). As expected, subjects with at least one e4 allele were more likely to report having a parent with Alzheimer’s disease than were subjects with no e4 alleles (p < .0001). Likewise, the previously reported and replicated association between the number of C alleles of SNP rs1421085 in FTO and body mass index (Tung & Yeo, 2011) was observed (self-reported body mass indexes of 27.5, 27.9, and 28.3 for 0, 1, and 2 C alleles, respectively; p < .001).
For each SNP, we used a standard linear model to determine the effects of allele dosage. We regressed Henmon-Nelson IQ on the number of minor (i.e., less frequent) alleles. However, for the two APOE SNPs (rs429358 and rs7412), we instead analyzed a dummy variable indicating the presence of at least one e4 allele, because this allele is defined by a haplotype of the two SNPs and has been previously studied in conjunction with g (and Alzheimer’s disease). All of our analyses controlled for graduate/sibling status, age, gender, and the interactions of these variables, as well as the first three principal components of the genetic data from the full set of 90 genotyped SNPs (to account for possible population stratification). For additional details, see Additional Methods for Study 1 in the Supplemental Material.
Results
Table 1 displays the results of this analysis. None of the 12 genotypes (11 SNPs and the APOE e4 variable defined by two SNPs) were significantly associated with g (p ≥ .10 in all cases). We conducted an omnibus F test in which all 11 SNPs and the APOE dummy variable were combined in a single regression; on the basis of results from this analysis, we could not reject the null hypothesis that all of the SNPs jointly had no effect on g, F = 0.88, p = .56. We calculated the statistical power associated with this omnibus test and found that if, in aggregate, our 12 genotypic predictors jointly explained at least 0.52% of the variance in g in the WLS sample, the F test should reject the null hypothesis at least 99% of the time. The thresholds associated with 80% and 95% rejection were 0.26% and 0.39% of the variance, respectively.
Characteristics of Single-Nucleotide Polymorphisms and Results of Tests for Genetic Associations With g in Study 1

Note: For each single-nucleotide polymorphism (SNP), the table presents the results of a linear regression of general intelligence, or g (Henmon-Nelson IQ), on minor-allele dosage (0, 1, or 2 copies), controlling for age, sex, graduate/sibling status, and the interactions of these factors, as well as the first three principal components of the 90-SNP genotype correlation matrix available in the Wisconsin Longitudinal Study data set. The slight variations in sample size across SNPs are due to missing data. The R2 column shows the percentage of variance explained by a univariate regression of g on minor-allele dosage for each SNP. DTNBP1 = dysbindin gene; CTSD = cathepsin D gene; DRD2 = dopamine receptor D2 gene; ANKK1 = ankyrin repeat and kinase domain containing 1 gene; CHRM2 = cholinergic receptor, muscarinic 2 gene; SSADH = succinic semialdehyde dehydrogenase gene; ALDH5A1 = aldehyde dehydrogenase 5 family, member A1 gene; COMT = catechol-O-methyltransferase gene; BDNF = brain-derived neurotrophic factor gene; CHRNA4 = cholinergic receptor, nicotinic, alpha 4 gene; DISC1 = disrupted in schizophrenia 1 gene; APOE = apolipoprotein E gene; SNAP25 = synaptosomal-associated protein 25 gene.
A recent meta-analysis (Barnett, Scoriels, & Munafò, 2008) suggested that the well-researched Val158Met polymorphism in COMT (rs4680) may explain around 0.10% of the variance in g. This estimate is likely biased upward, given that it assumes that no publication bias or winner’s curse has affected the literature on this association. If we make the reasonable assumption that the SNPs we investigated, which are mostly distributed across several chromosomes, are independent, then our results imply that the average effect size of the 12 genotypic predictors (which include rs4680) must be even smaller than 0.05% of the variance (because 0.52%/12 = 0.043%), although we cannot rule out the possibility that the effect sizes of most of the predictors are 0.00% and a few exceed 0.10%. These effect sizes are small—for example, for a SNP whose minor-allele frequency is close to 50%, such as rs4680, 0.05% of variance in IQ would amount to a difference of about 0.45 IQ points—and much lower than the effect sizes reported for the SNPs in the initial studies of their associations with g. From these calculations, we conclude that our analysis had considerable statistical power to detect effect sizes of meaningful magnitude.
Study 2
Method
In Study 2, we attempted to repeat our analysis from Study 1 as closely as possible using data from the initial and offspring cohorts of the Framingham Heart Study (FHS), which has tracked residents of Framingham, Massachusetts, and their descendants since the 1940s. (For more details about these two cohorts of the FHS, see Dawber, Meadors, & Moore, 1951, and Feinleib, Kannel, Garrison, McNamara, & Castelli, 1975.)
Our data set was based on a sample of 1,759 individuals (45.4% male, 54.6% female). Subjects from 40 to 100 years of age completed a battery of cognitive tests as part of a neuropsychological component of the FHS. These tests included the Trail Making Test Parts A and B, the Reading subtest of the Wide Range Achievement Test–Revised, the Boston Naming Test, the Similarities subtest of the Wechsler Adult Intelligence Scale, the Hooper Visual Organization Test, and the Wechsler Memory Scale Visual Reproduction and Logical Memory tests (for more information about the FHS neuropsychological tests, see Seshadri et al., 2007).
To estimate g, we first conducted a principal component analysis on the cognitive test data (controlling for sex, birth year, and cohort); the first component accounted for 45.6% of the variance in test performance, a result consistent with the normal pattern in studies of general intelligence (Chabris, 2007). We used each subject’s score on the first principal component as our measure of g. Finally, the scores were normalized to have a mean of 100 and a standard deviation of 15.
Ten of the 13 WLS SNPs were available in a set of genotypes previously imputed in the FHS. (The 2 SNPs in APOE, rs7412 and rs429358, and 1 in SNAP25, rs363050, were not available.) For additional details, see Additional Methods for Study 2 in the Supplemental Material.
Results
Tests of associations between g and each SNP were conducted using the standard linear allele-dosage model we used with the WLS data, with the standard errors clustered by extended family. Table 2 displays the results of these analyses. Nine of the 10 SNPs were not significantly associated with g (p ≥ .10 in all cases). We also conducted an omnibus F test in which all 10 SNPs were combined in a single regression; results from this test did not contradict the null hypothesis that all of the SNPs jointly had zero joint effect on g, F = 0.85, p = .58.
Characteristics of Single-Nucleotide Polymorphisms and Results of Tests for Genetic Associations With g in Study 2
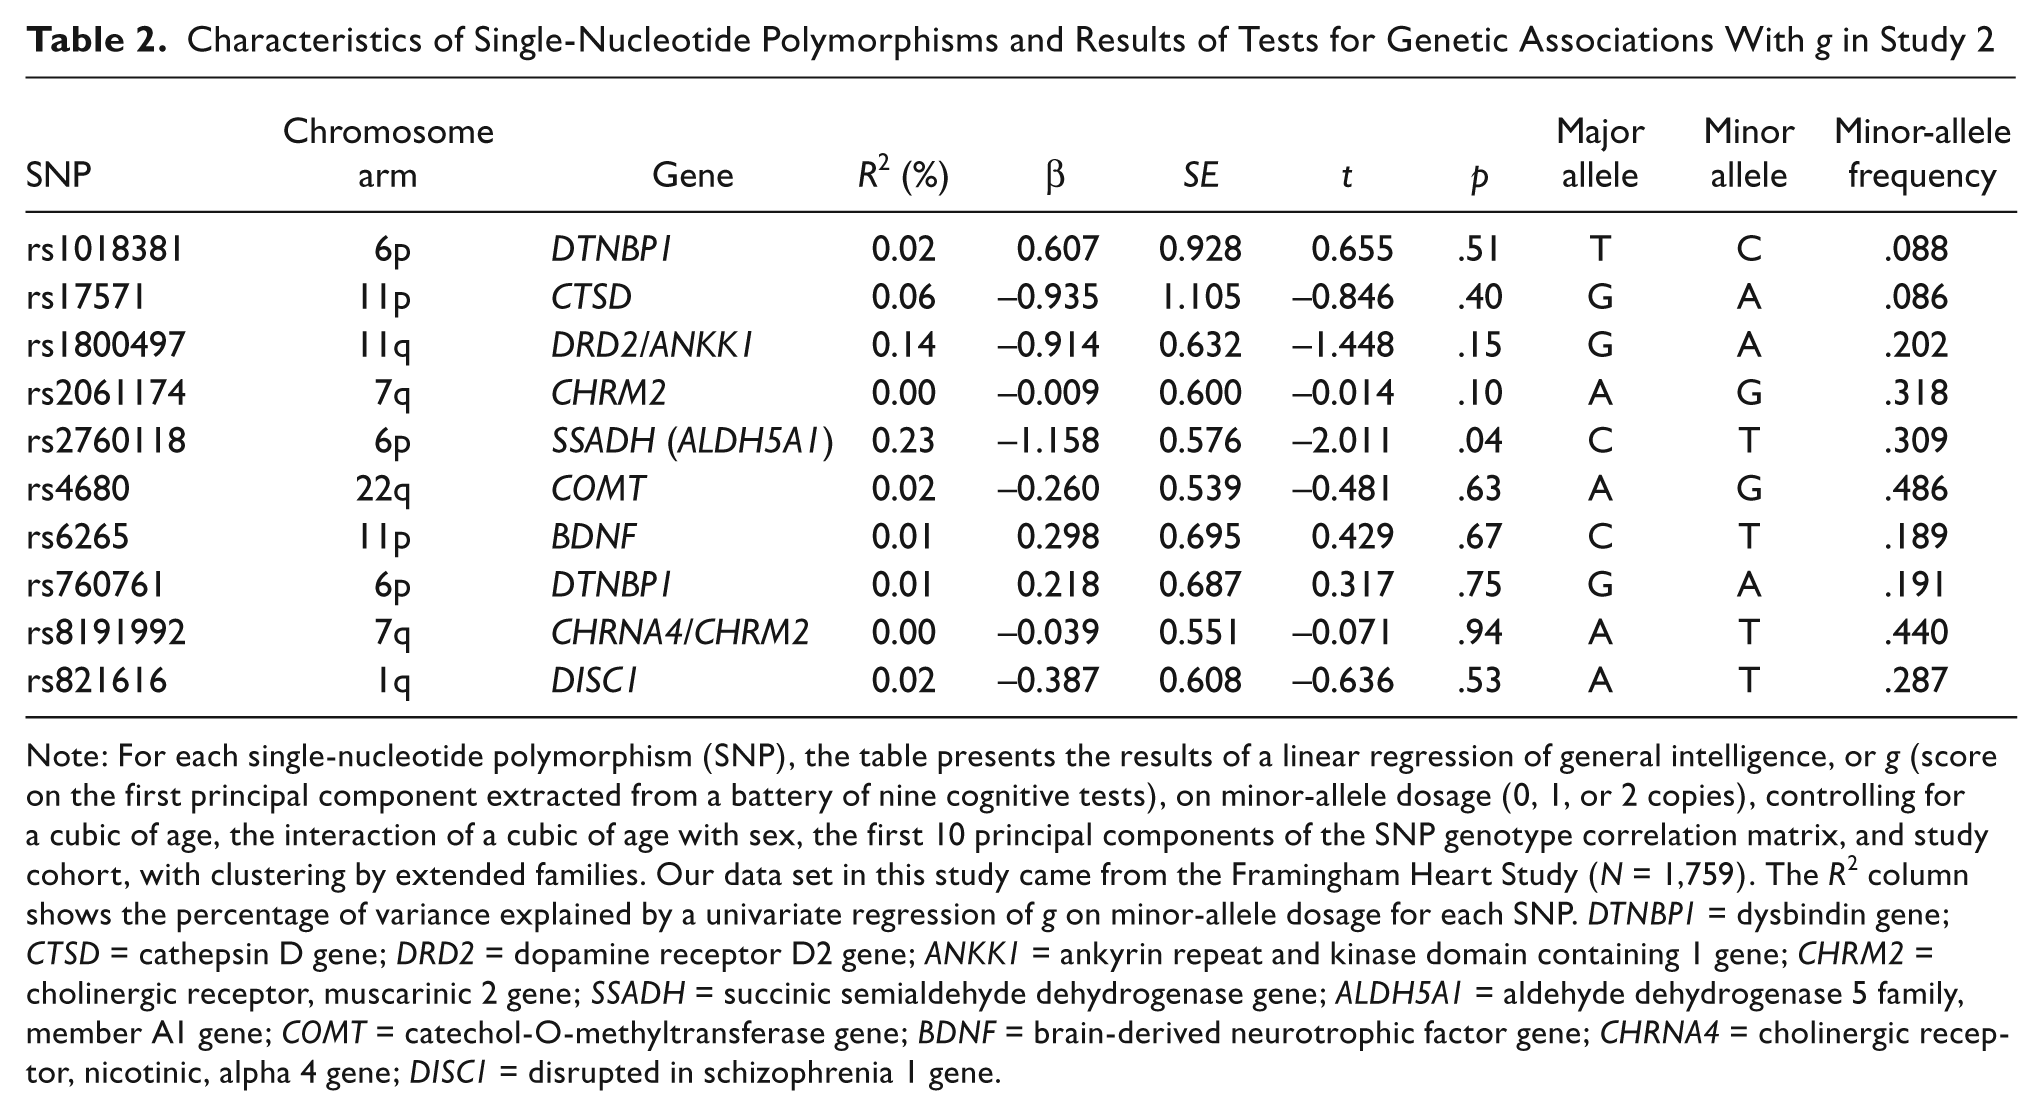
Note: For each single-nucleotide polymorphism (SNP), the table presents the results of a linear regression of general intelligence, or g (score on the first principal component extracted from a battery of nine cognitive tests), on minor-allele dosage (0, 1, or 2 copies), controlling for a cubic of age, the interaction of a cubic of age with sex, the first 10 principal components of the SNP genotype correlation matrix, and study cohort, with clustering by extended families. Our data set in this study came from the Framingham Heart Study (N = 1,759). The R2 column shows the percentage of variance explained by a univariate regression of g on minor-allele dosage for each SNP. DTNBP1 = dysbindin gene; CTSD = cathepsin D gene; DRD2 = dopamine receptor D2 gene; ANKK1 = ankyrin repeat and kinase domain containing 1 gene; CHRM2 = cholinergic receptor, muscarinic 2 gene; SSADH = succinic semialdehyde dehydrogenase gene; ALDH5A1 = aldehyde dehydrogenase 5 family, member A1 gene; COMT = catechol-O-methyltransferase gene; BDNF = brain-derived neurotrophic factor gene; CHRNA4 = cholinergic receptor, nicotinic, alpha 4 gene; DISC1 = disrupted in schizophrenia 1 gene.
One SNP, rs2760118 in SSADH, exhibited a nominally significant association with g, t = 2.01, p = .04, but this association was not significant after a Bonferroni correction. The mean g values (transformed to the IQ scale) for this SNP were 98.3 for the T/T genotype, 99.7 for the T/C genotype, and 100.6 for the C/C genotype. This SSADH polymorphism was first reported to be associated with g by Plomin et al. (2004), and the directionality of this association was the same as that observed in our FHS data. Some rare SSADH mutations are robustly associated with mental retardation and seizures via a well-known biological pathway involving the metabolism of the inhibitory neurotransmitter gamma-aminobutyric acid (Pearl et al., 2009).
Benjamin et al. (2012) reported that SSADH rs2760118 was associated with educational attainment in an Icelandic sample; this association was replicated in a second Icelandic sample and appeared to be partially mediated by an association between SSADH and cognitive function in both samples. However, in that study, the association between rs2760118 and education did not replicate in three other data sets (from the WLS, the FHS, and a control group from the NIMH Swedish Schizophrenia Study). It is possible that this SSADH SNP has a true, but small, effect on g that is observed only in certain studies or under certain environmental conditions.
Study 3
Method
To verify that the results of Study 1 and Study 2 were not artifacts of any factors specific to the WLS and FHS data sets, we repeated the analysis using data from a sample of recently genotyped Swedish twins born between 1936 and 1958. The subjects were all participants in the STR (see Lichtenstein et al., 2002, for a description of the sample); 10,946 of the STR subjects have been genotyped.
Until recently, military conscription was mandatory for Swedish men at or around the age of 18, and a test of cognitive ability was part of the screening process. Because each recruit’s performance on the test influenced his ultimate position in the military, incentives to perform well on the test were strong. The recruits took either four or five cognitive tests, depending on cohort; the tests included measures of problem solving, concept discrimination, technical comprehension, multiplication, and mechanical or spatial ability. Carlstedt (2000) described the batteries in more detail and reported evidence that they provide good measures of g. Because there are minor variations across years in the specific questions asked, we conducted a separate principal component analysis of the subtests for each birth-year cohort. For each individual in the full sample, g was then defined as the subject’s score on the first principal component. As in Studies 2 and 3, we normalized the scores to have a mean of 100 and a standard deviation of 15.
Ten of the original 12 WLS genotypes were available in the imputed data, exactly the same SNPs as in the FHS data. We used linear regressions to test associations between g and each SNP. The sample was exclusively male, g was estimated separately for each birth-year cohort, and there was no meaningful variation in the ages at which the men completed the tests (because conscription nearly always occurred around the age of 18); therefore, age and sex were not included as covariates, but the first 10 principal components of genetic data were. The final sample included 2,441 individuals for whom genetic and IQ test data were available: 811 twins without a co-twin in the sample, 418 complete monozygotic pairs, and 397 complete dizygotic pairs. For additional details, see Additional Methods for Study 3 in the Supplemental Material.
Results
Tests of association between g and each SNP were conducted using the same approach we used to analyze the WLS and FHS data; Table 3 displays the results. The SNP whose association with g came closest to being statistically significant was SSADH rs2760118, t = 1.58, p = .11, the same SNP whose association with g was nominally significant in the FHS sample. However, the direction of this association in the STR sample was the opposite of what was observed in the FHS sample. In the STR sample, the mean IQ scores were 99.2 for the C/C genotype, 100.4 for the T/C genotype, and 100.9 for the T/T genotype. The omnibus F test in which all 10 SNPs were combined in a single regression failed to contradict the null hypothesis that the SNPs jointly had zero effect on g, F = 0.89, p = .55.
Characteristics of Single-Nucleotide Polymorphisms and Results of Tests for Genetic Associations With g in Study 3

Note: For each single-nucleotide polymorphism (SNP), the table presents the results of a linear regression of general intelligence, or g (score on the first principal component extracted from a battery of four or five cognitive tests), on minor-allele dosage (0, 1, or 2 copies), controlling for the first 10 principal components of the SNP genotype correlation matrix and study cohort, with clustering by family. Our data set in this study came from the Swedish Twin Registry; the sample was composed exclusively of male Swedish twins born between 1936 and 1958 (N = 2,441), all of whom took the tests when they were approximately 18 years old. The R2 column shows the percentage of variance explained by a univariate regression of g on minor-allele dosage for each SNP. DTNBP1 = dysbindin gene; CTSD = cathepsin D gene; DRD2 = dopamine receptor D2 gene; ANKK1 = ankyrin repeat and kinase domain containing 1 gene; CHRM2 = cholinergic receptor, muscarinic 2 gene; SSADH = succinic semialdehyde dehydrogenase gene; ALDH5A1 = aldehyde dehydrogenase 5 family, member A1 gene; COMT = catechol-O-methyltransferase gene; BDNF = brain-derived neurotrophic factor gene; CHRNA4 = cholinergic receptor, nicotinic, alpha 4 gene; DISC1 = disrupted in schizophrenia 1 gene.
Discussion
We attempted to replicate published associations of 12 specific genotypes with measures of g in three large, well-characterized longitudinal data sets. In the WLS sample, none of the 12 genotypes were significantly associated with g. In the FHS sample, 9 of the 10 SNPs we tested were also not associated with g. The only SNP whose association with g was nominally significant was rs27660118. In the STR sample, none of the 10 available SNPs were significantly associated with g. The association between rs27660118 and IQ approached significance (before correction for multiple-hypothesis testing), but the effect was opposite to that observed in the FHS sample.
There have been previous failures to replicate results from studies showing associations between specific genes and g (e.g., Houlihan et al., 2009). Our research is distinguished by the fact that we used a large combined sample of almost 10,000 individuals from three independent studies and attempted to replicate all published associations for which we had available data in the three data sets. The contrast between the outcome expected on the basis of findings reported in the literature and the outcome we actually observed in our investigation is striking. Assuming that the SNPs are independently distributed, on the basis of the null hypothesis that every genotype we examined was unrelated to g, the expected number of significant (p < .05) associations yielded by our 32 tests is 1.6. We observed exactly one nominally significant association, slightly less than would be expected by chance alone.
This result is not likely due to a lack of statistical power. Figure 1 shows the number of significant associations predicted by a range of alternative hypothetical effect sizes (ranging from 0% to 1% of variance) for each genotype. For example, had all of the associations we tested been true positives in the population, each accounting for 0.1% of the variance in g—the effect size that Barnett et al.’s (2008) meta-analysis found for COMT (R2 = 0.1%)—then the expected number of significant (p < .05) associations would have been approximately 14.7 in our 32 tests (8.7 associations in our 12 tests of the WLS data, 2.6 associations in our 10 tests of the FHS data, and 3.4 associations in our 10 tests of the STR data). 2 Even after accounting conservatively for the genetic relatedness of some subjects (siblings in the WLS, family members in the FHS, and twins in the STR), we would expect 10.6 total associations—10 times more than we found. And an effect size of 0.1% of the phenotypic variance is tiny; as Figure 1 shows, assuming anything larger increases the power of our studies, and thus the divergence between the number of associations expected and the number we observed.
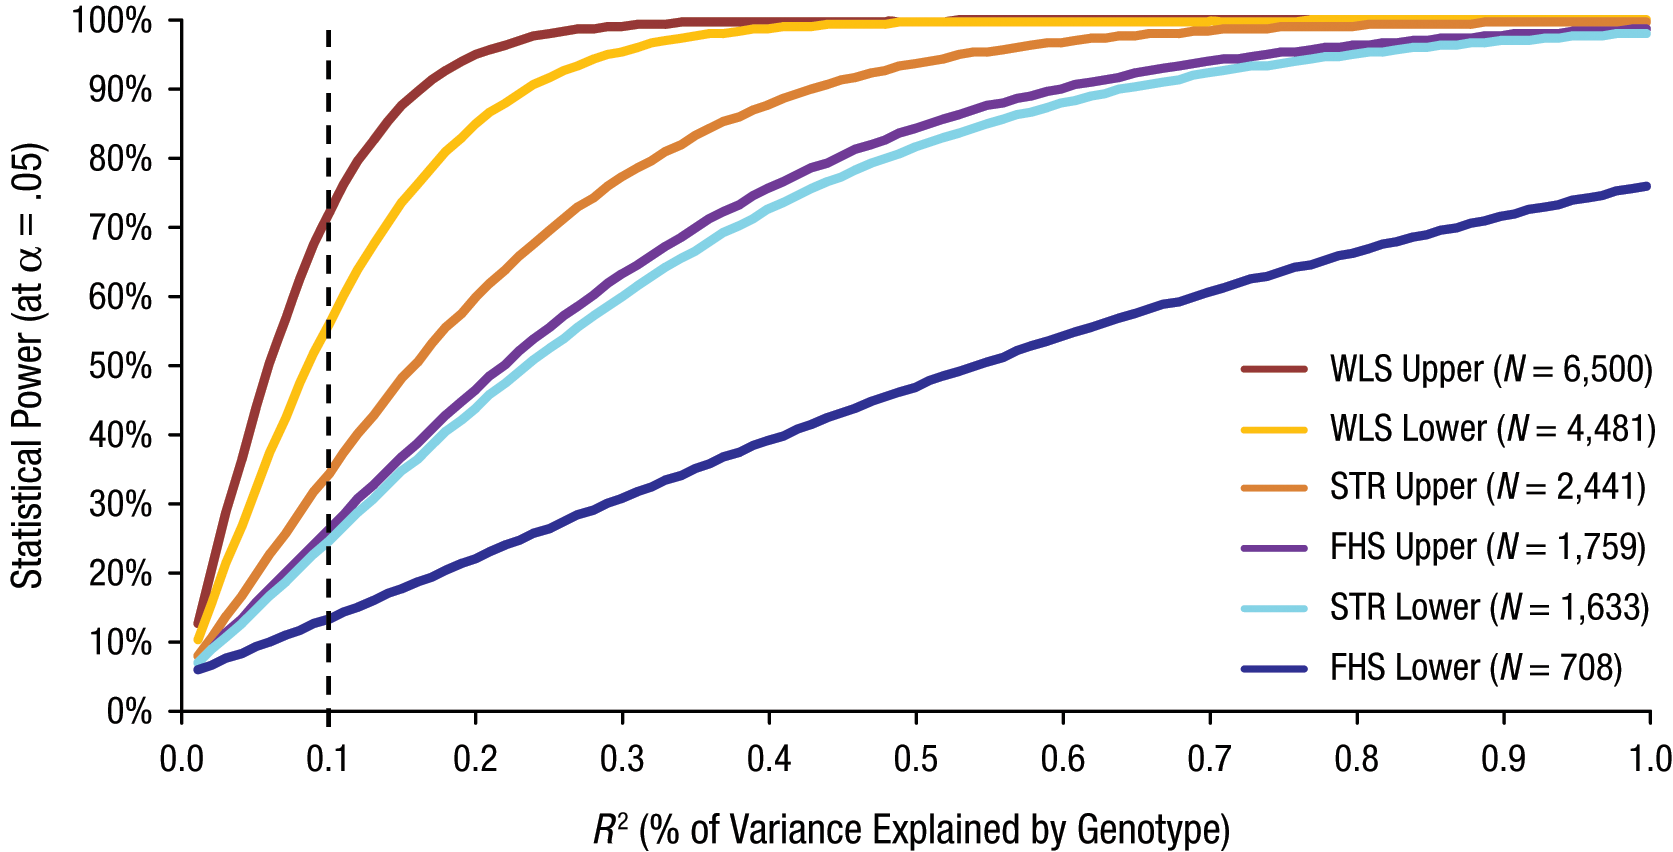
Statistical power of Studies 1 through 3 to detect significant associations between single-nucleotide polymorphisms (SNPs) and g as a function of the percentage of variance in g explained by the SNP (or by the genotype, in the case of apolipoprotein E, APOE, e4). Our data set in Study 1 came from the Wisconsin Longitudinal Study (WLS), our data set in Study 2 came from the Framingham Heart Study (FHS), and our data set in Study 3 came from the Swedish Twin Registry (STR). Because the x-axis runs from 0% to 1% out of a total of 100% variance in g, 0.1 corresponds to 1/1,000 of the total trait variance. For the three studies, power was estimated using both the full sample size (the “upper” bounds on power) and the number of unrelated subjects only (the “lower” bounds on power). The dashed line indicates the expected level of statistical power if the studied SNPs account for 0.1% of the genetic variance in each sample. Calculations were performed using the tool created by Purcell, Cherny, and Sham (2003); see pngu.mgh.harvard.edu/~purcell/gpc/qtlassoc.html).
To assess the potential size of any effects of the examined genotypes on g, we conducted a meta-analysis of the results from our three studies. As Figure 2 shows, the pooled estimates are sufficiently precise to rule out anything but very small effects. Even the widest 95% confidence interval excludes effect sizes larger than 1.3 IQ points, which is less than 1/10 of a standard deviation. Most of the effects are estimated with considerably greater precision.
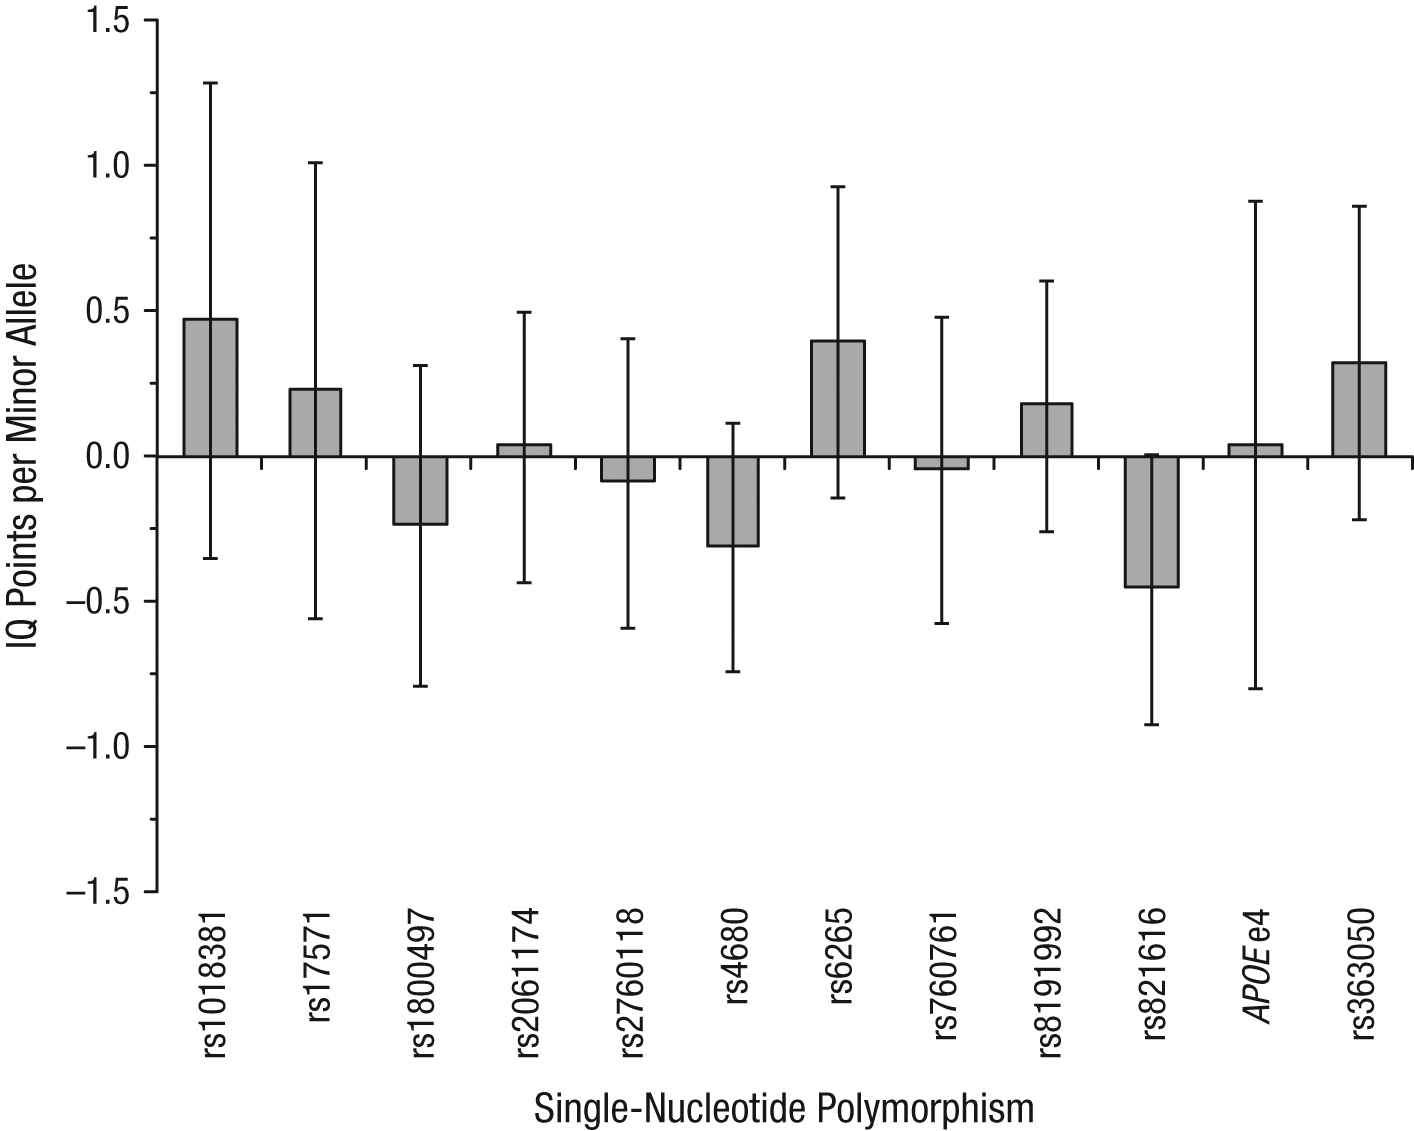
Regression coefficients for the effect of the studied genotypes on g (i.e., the difference in number of IQ points associated with each copy of the minor allele), pooled across Studies 1 through 3. Error bars represent 95% confidence intervals. For apolipoprotein E (APOE), the figure shows the number of IQ points associated with the presence of at least one e4 allele.
The fact that research has failed thus far to find genes associated with g does not mean that g has no genetic component. Davies et al. (2011) used data from five different genome-wide association studies and failed to identify any individual markers that were robustly associated with crystalized or fluid intelligence. The researchers then applied a recently developed method (Visscher, Yang, & Goddard, 2010; Yang et al., 2010) for testing the cumulative effects of all the genotyped SNPs. In essence, this method entails calculating the overall genetic similarity between each pair of individuals in a sample and then correlating this genetic similarity with phenotypic similarity across all pairs.
Following Yang et al. (2010), we dropped 1 twin per pair and then estimated all pairwise genetic relationships in the resulting sample. Following Davies et al. (2011), we then dropped individuals whose relatedness exceeded .025. Davies et al. reported that the approximately 550,000 SNPs in their data could jointly explain 40% of the variation in crystalized g (N = 3,254) and 51% of the variation in fluid g (N = 3,181). We applied the same procedure in our analysis of data from the STR sample in Study 3 and estimated that the approximately 630,000 SNPs in our data jointly accounted for 47% of the variance in g (p < .02), thus confirming the findings of Davies et al. (2011) in an independent sample. These and our other results, together with the failure to date of whole-genome association studies to find genes associated with g, are consistent with the view that g is a highly polygenic trait on which common genetic variants individually have only small effects.
A consensus is emerging that most published results from candidate-gene studies using small samples fail to replicate (Ioannidis, Tarone, & McLaughlin, 2011; Siontis, Patsopoulos, & Ioannidis, 2010; cf. Ioannidis, 2005). There are several possible reasons, none of them mutually exclusive, for this state of affairs. Failure to replicate can be attributed to lack of statistical power in the replication sample, but our replication samples were much larger than the samples used in the original studies and in most candidate-gene studies. Genetic associations may also fail to replicate when the identified variants are not the ones that cause the trait variation but are instead correlated with the true causal variants, but under different patterns of linkage disequilibrium in different samples. Patterns of failed replication may also arise from differing effects of genes on traits across environments.
By far the most plausible explanation for failures to replicate reported SNP-g associations in our three studies, however, is that the original studies whose findings we sought to replicate did not have sufficient sample sizes—and not because of any error in design or execution. Expectations that the effects of individual SNPs on g might be large, and therefore detectable in small samples, seemed reasonable before genome-wide association studies were possible and when the expense of genotyping was orders of magnitude greater than it is now. But if the true effect sizes of common variants are small, as now seems clear, then the early studies whose results we have failed to replicate were inadvertently underpowered. Bayesian calculations imply that reported results from underpowered studies, even if statistically significant, are likely to be false positives (e.g., Benjamin, 2010; Ioannidis, 2005).
The results reported here illustrate for g the problem of “missing heritability” (Manolio et al., 2009), or the failure to find specific molecular variants that account for the substantial genetic influences identified by twin and family studies of medical and psychiatric phenotypes. For comparison, height is approximately 90% heritable in Western populations, but so far, no common variants contributing more than 0.5 cm per allele have been discovered, and the 180 height-associated SNPs identified by the most comprehensive meta-analysis collectively explain only about 10% of phenotypic variance in the population (Lango Allen et al., 2010). We suspect that the results from our studies of genetic associations with g are not isolated exceptions but are instead illustrative of a larger pattern in the genetics of cognition and social science (Beauchamp et al., 2011; Benjamin et al., 2012). There are several possible explanations for the missing heritability. One is that common variants explain much of the heritable variation but that the individual effects are so small that enormous samples are required to reliably detect them (Visscher, 2008; Visscher, Hill, & Wray, 2008). An alternative explanation is that much of the heritable variation comes from rare, perhaps structural, genetic variants with modest to large effect sizes (Dickson, Wang, Krantz, Hakonarson, & Goldstein, 2010; Yeo, Gangestad, Liu, Calhoun, & Hutchison, 2011).
At the time most of the results we attempted to replicate were obtained, candidate-gene studies of complex traits were commonplace in medical genetics research. Such studies are now rarely published in leading journals. Our results add IQ to the list of phenotypes that must be approached with great caution when considering published molecular genetic associations. In our view, excitement over the value of behavioral and molecular genetic studies in the social sciences should be tempered—as it has been in the medical sciences—by a recognition that, for complex phenotypes, individual common genetic variants of the sort assayed by SNP microarrays are likely to have very small effects.
Associations of candidate genes with psychological traits and other traits studied in the social sciences should be viewed as tentative until they have been replicated in multiple large samples. Failing to exercise such caution may hamper scientific progress by allowing for the proliferation of potentially false results, which may then influence the research agendas of scientists who do not realize that the associations they take as a starting point for their efforts may not be real. And the dissemination of false results to the public may lead to incorrect perceptions about the state of knowledge in the field, especially knowledge concerning genetic variants that have been described as “genes for” traits on the basis of unintentionally inflated estimates of effect size and statistical significance.
We think that social-science researchers investigating molecular genetics may profit by following the lead of medical genetics researchers, who have formed international consortia dedicated to bringing together as many large studies with genomic and (harmonized) phenotypic data as possible. A plausible sample size of 100,000 individuals has statistical power of 80% to discover genetic variants accounting for as little as 0.04% of the variance in a trait at a genome-wide significance level of p < 5 × 10⁻⁸. With sufficient statistical power, it will also be feasible to study gene-gene interactions (e.g., Roetker et al., 2011), which may account for more of the variance in complex phenotypes than do individual SNPs in isolation.
Finally, we emphasize that the negative results reported here should not detract from research into the behavioral and molecular genetics of g and other traits studied in the social sciences; rather, they point the way to study designs that would be more likely to yield robust findings.
Footnotes
Acknowledgements
We thank Paul de Bakker and the Broad Institute for imputing genotypic data from the Framingham Heart Study (FHS) and for making these data available to other FHS researchers. We also thank Emil Rehnberg of the Karolinska Institutet for imputing data and computing the principal components in the Study 3 data set, and Yeon Sik Cho for assistance with research.
Declaration of Conflicting Interests
The authors declared that they had no conflicts of interest with respect to their authorship or the publication of this article.
Funding
This research was supported by National Institute on Aging Grants P01AG005842 and T32-AG000186-23. The Swedish Twin Registry is supported by the Swedish Department of Higher Education, European Commission Grant QLG2-CT-2002-01254, the Swedish Research Council, and the Swedish Foundation for Strategic Research.

Notes
References
Supplementary Material
Please find the following supplemental material available below.
For Open Access articles published under a Creative Commons License, all supplemental material carries the same license as the article it is associated with.
For non-Open Access articles published, all supplemental material carries a non-exclusive license, and permission requests for re-use of supplemental material or any part of supplemental material shall be sent directly to the copyright owner as specified in the copyright notice associated with the article.
