



Abstract
Individual differences in children’s executive functions (EFs) are relevant for a wide range of normal and atypical psychological outcomes across the life span, but the origins of variation in children’s EFs are not well understood. We used data from a racially and socioeconomically diverse sample of 505 third- through eighth-grade twins and triplets from the Texas Twin Project to estimate genetic and environmental influences on a Common EF factor and on variance unique to four core EF domains: inhibition, switching, working memory, and updating. As has been previously demonstrated in young adults, the Common EF factor was 100% heritable, which indicates that correlations among the four EF domains are entirely attributable to shared genetic etiology. Nonshared environmental influences were evident for variance unique to individual domains. General EF may thus serve as an early life marker of genetic propensity for a range of functions and pathologies later in life.
Executive functions (EFs) are supervisory cognitive processes that monitor, coordinate, and control the execution of other cognitive operations necessary for learning and everyday functioning. Across the life span, there exist marked individual differences in EF abilities, which include temporary storage of information simultaneous with cognitive processing (working memory), monitoring of incoming stimuli and replacement of old information with new information (updating), rapid shifting between cognitive operations (switching), and effortful inhibition of prepotent responses (inhibition). The neural bases for EFs are well studied; early research implicated the prefrontal cortex as fundamental to EFs, and more recent research has implicated complex and distributed networks of brain regions (Carpenter, Just, & Reichle, 2000; Collette, Hogge, Salmon, & Van der Linden, 2006). EFs are commonly conceptualized as psychological intermediaries between neurobiology and complex psychological outcomes, including normal-range individual differences (in, e.g., intelligence; Kane & Engle, 2002) and clinical levels of psychopathology (e.g., schizophrenia; Elliott, 2003). Although much of the research on EFs has been based on adult samples, a growing body of developmental research indicates that EFs during childhood are related, both concurrently and prospectively, to a host of normative psychological outcomes, such as academic achievement and externalizing problem behaviors, as well as childhood-onset psychiatric disorders, such as attention-deficit/hyperactivity disorder and autism (Best, Miller, & Naglieri, 2011; Pennington & Ozonoff, 1996; Young et al., 2009; Zelazo, Carter, Reznick, & Frye, 1997).
Among adults, behavioral genetic studies of EFs have highlighted the importance of genetic influences on these abilities. Individual differences in performance on individual EF tasks are moderately heritable (e.g., Ando, Ono, & Wright, 2001; Kremen et al., 2009; T. Lee et al., 2012; Vasilopoulos et al., 2012). When data for individual tasks are combined to measure broader EFs, these abilities—including inhibition, switching, and updating—“are almost entirely genetic in origin” (Friedman et al., 2008). Additionally, the covariation among EF domains, as represented by a single higher-order EF factor, is also nearly 100% heritable. Thus, by adulthood, nongenetic variance in environmental experience accounts for variation in executive processing only narrowly, that is, at the level of performance on specific tasks; at the level of the construct, adult identical twins’ EFs are nearly perfectly correlated. However, it is currently unclear whether the outstandingly high heritability of general executive processing is in place in childhood, or whether genetic influences do not reach a developmental apex until adulthood.
Very few behavioral genetic studies of childhood EFs have been conducted, and those that have been reported have focused on individual EF tasks in isolation, rather than broader EF factors (e.g., Kuntsi et al., 2006; Luciano et al., 2001; Polderman et al., 2006; Schachar, Forget-Dubois, Dionne, Boivin, & Robaey, 2011; M. Wang & Saudino, 2013; Z. Wang, Deater-Deckard, Cutting, Thompson, & Petrill, 2012). Such task-level analyses are unable to differentiate genetic and environmental influences on nonexecutive demands from those specific to the EF in question, nor are they able to test the extent to which genetic and environmental influences are shared across different EFs. Other studies (e.g., Cuevas et al., 2014) have examined parent-child resemblance for more general EF composites but have been unable to distinguish the extent to which such resemblance derives from genetic versus shared environmental factors. We are aware of no studies of children that have both implemented genetically informative designs capable of distinguishing genetic from environmental effects and focused on broader EF factors representing variance common to multiple EF tasks separately from unique, potentially nonexecutive, variance.
The heritability of EFs might be substantially lower in childhood than in adulthood, as developmental increases in genetic influence have been observed for multiple phenotypes. For instance, meta-analyses (Briley & Tucker-Drob, 2013; Haworth et al., 2009) have indicated that the heritability of cognitive ability increases continuously from less than 20% in early childhood to upward of 70% by early adulthood. From middle childhood forward, these increases primarily result from the amplification of the same genetic factors over time (Briley & Tucker-Drob, 2013; Tucker-Drob & Briley, 2014), possibly as a result of dynamic processes whereby children select and evoke cognitively stimulating experiences on the basis of genetically influenced traits (Tucker-Drob, Briley, & Harden, 2013). Should EFs show substantially lower heritability in childhood than has been reported for early adulthood, this may point to the sensitivity of EFs to similar dynamic processes over development.
Alternatively, it is possible that individual differences in EFs are nearly entirely genetic in origin even in childhood. If so, individual differences in EFs may represent genetically influenced aptitudes that are expressed early and serve as foundations onto which higher-order cognitive processes are scaffolded. Should childhood EFs prove to be high in heritability, they may serve as developmental endophenotypes: early-life markers of genetic risk for a cross-cutting range of later-life functions and pathologies (Gottesman & Gould, 2003). Researchers who are interested in understanding the mechanisms of genetic risk for these complex, multidetermined outcomes would thus be able to study variables that are mechanistically more proximal to genotypes and less “diluted” by extraneous influences. Developmental endophenotypes could also be leveraged in applied settings to identify children who are at genetic risk for—but who have not yet expressed—maladaptive outcomes and who might therefore be the best candidates for preventive treatments or interventions.
This article reports the first comprehensive multivariate behavioral genetic analysis of EFs in childhood. Using a population-based sample of third- through eighth-grade twins and a multivariate test battery, we investigated genetic and environmental effects in four EF domains: inhibition, switching, working memory, and updating.
Method
Sample
Data were drawn from 505 third- through eighth-graders who were recruited through the Texas Twin Project (Harden, Tucker-Drob, & Tackett, 2013), a registry of infant, child, and adolescent twins in central Texas. Here, we report 2-year results from a study that stems from the Texas Twin Project and includes in-laboratory assessments of executive function. For the current report, data were available for a total of 272 pairs (233 twin pairs and 39 pairs from triplet sets). Participants ranged in age from 7.89 to 15.25 years (M = 10.97, SD = 1.74); 52.1% were female. Their racial-ethnic distribution was as follows: 64.6% non-Hispanic White, 18.6% Hispanic, 6.7% African American, 2.0% Asian, 1.2% other, and 6.9% multiple races or ethnicities. Of the participating families, 31.2% reported having received a form of means-tested public assistance, such as food stamps. Thus, the current sample is comparable in size to and considerably more diverse than the sample in which Friedman et al. (2008) found nearly 100% heritability of EF factors in young adulthood (N = 293 pairs, approximately 90% non-Hispanic White; for a description of the sample, see Rhea, Gross, Haberstick, & Corley, 2006). As in-lab data collection for the current study is predominantly conducted each summer, with about 100 to 150 pairs assessed per year, we decided to proceed with the current analysis after the second summer of data collection, so that our sample size would approximate that of Friedman et al.
Zygosity of same-sex twins was assessed by a latent-class analysis of parents’ and experimenters’ ratings of physical similarity. Zygosity determinations from latent-class analyses of physical-similarity ratings have been found to be more than 99% accurate, as validated by determinations based on genotyping (Heath et al., 2003). Our final sample consisted of 84 (30.9%) monozygotic pairs, 99 (36.4%) same-sex dizygotic pairs, and 89 (32.7%) opposite-sex dizygotic pairs. Behavioral genetic analyses that excluded the opposite-sex pairs produced a pattern of results very similar to what is reported here.
Measures
Twelve tasks were selected to assess individual differences in the following four EF domains: inhibition, switching, working memory, and updating (see Table 1). As EF tasks are generally known to have poor reliability relative to cognitive-ability measures (Miyake et al., 2000), we placed considerable emphasis on selecting tasks that have been reported to have strong psychometric properties in child samples. Tasks were administered orally, by computer (Windows computers running E-Prime 2.0, Psychology Software Tools, http://www.pstnet.com, and Inquisit 4, Millisecond Software, Seattle, WA), or on paper.
Descriptions of the Tasks and Measured Outcomes
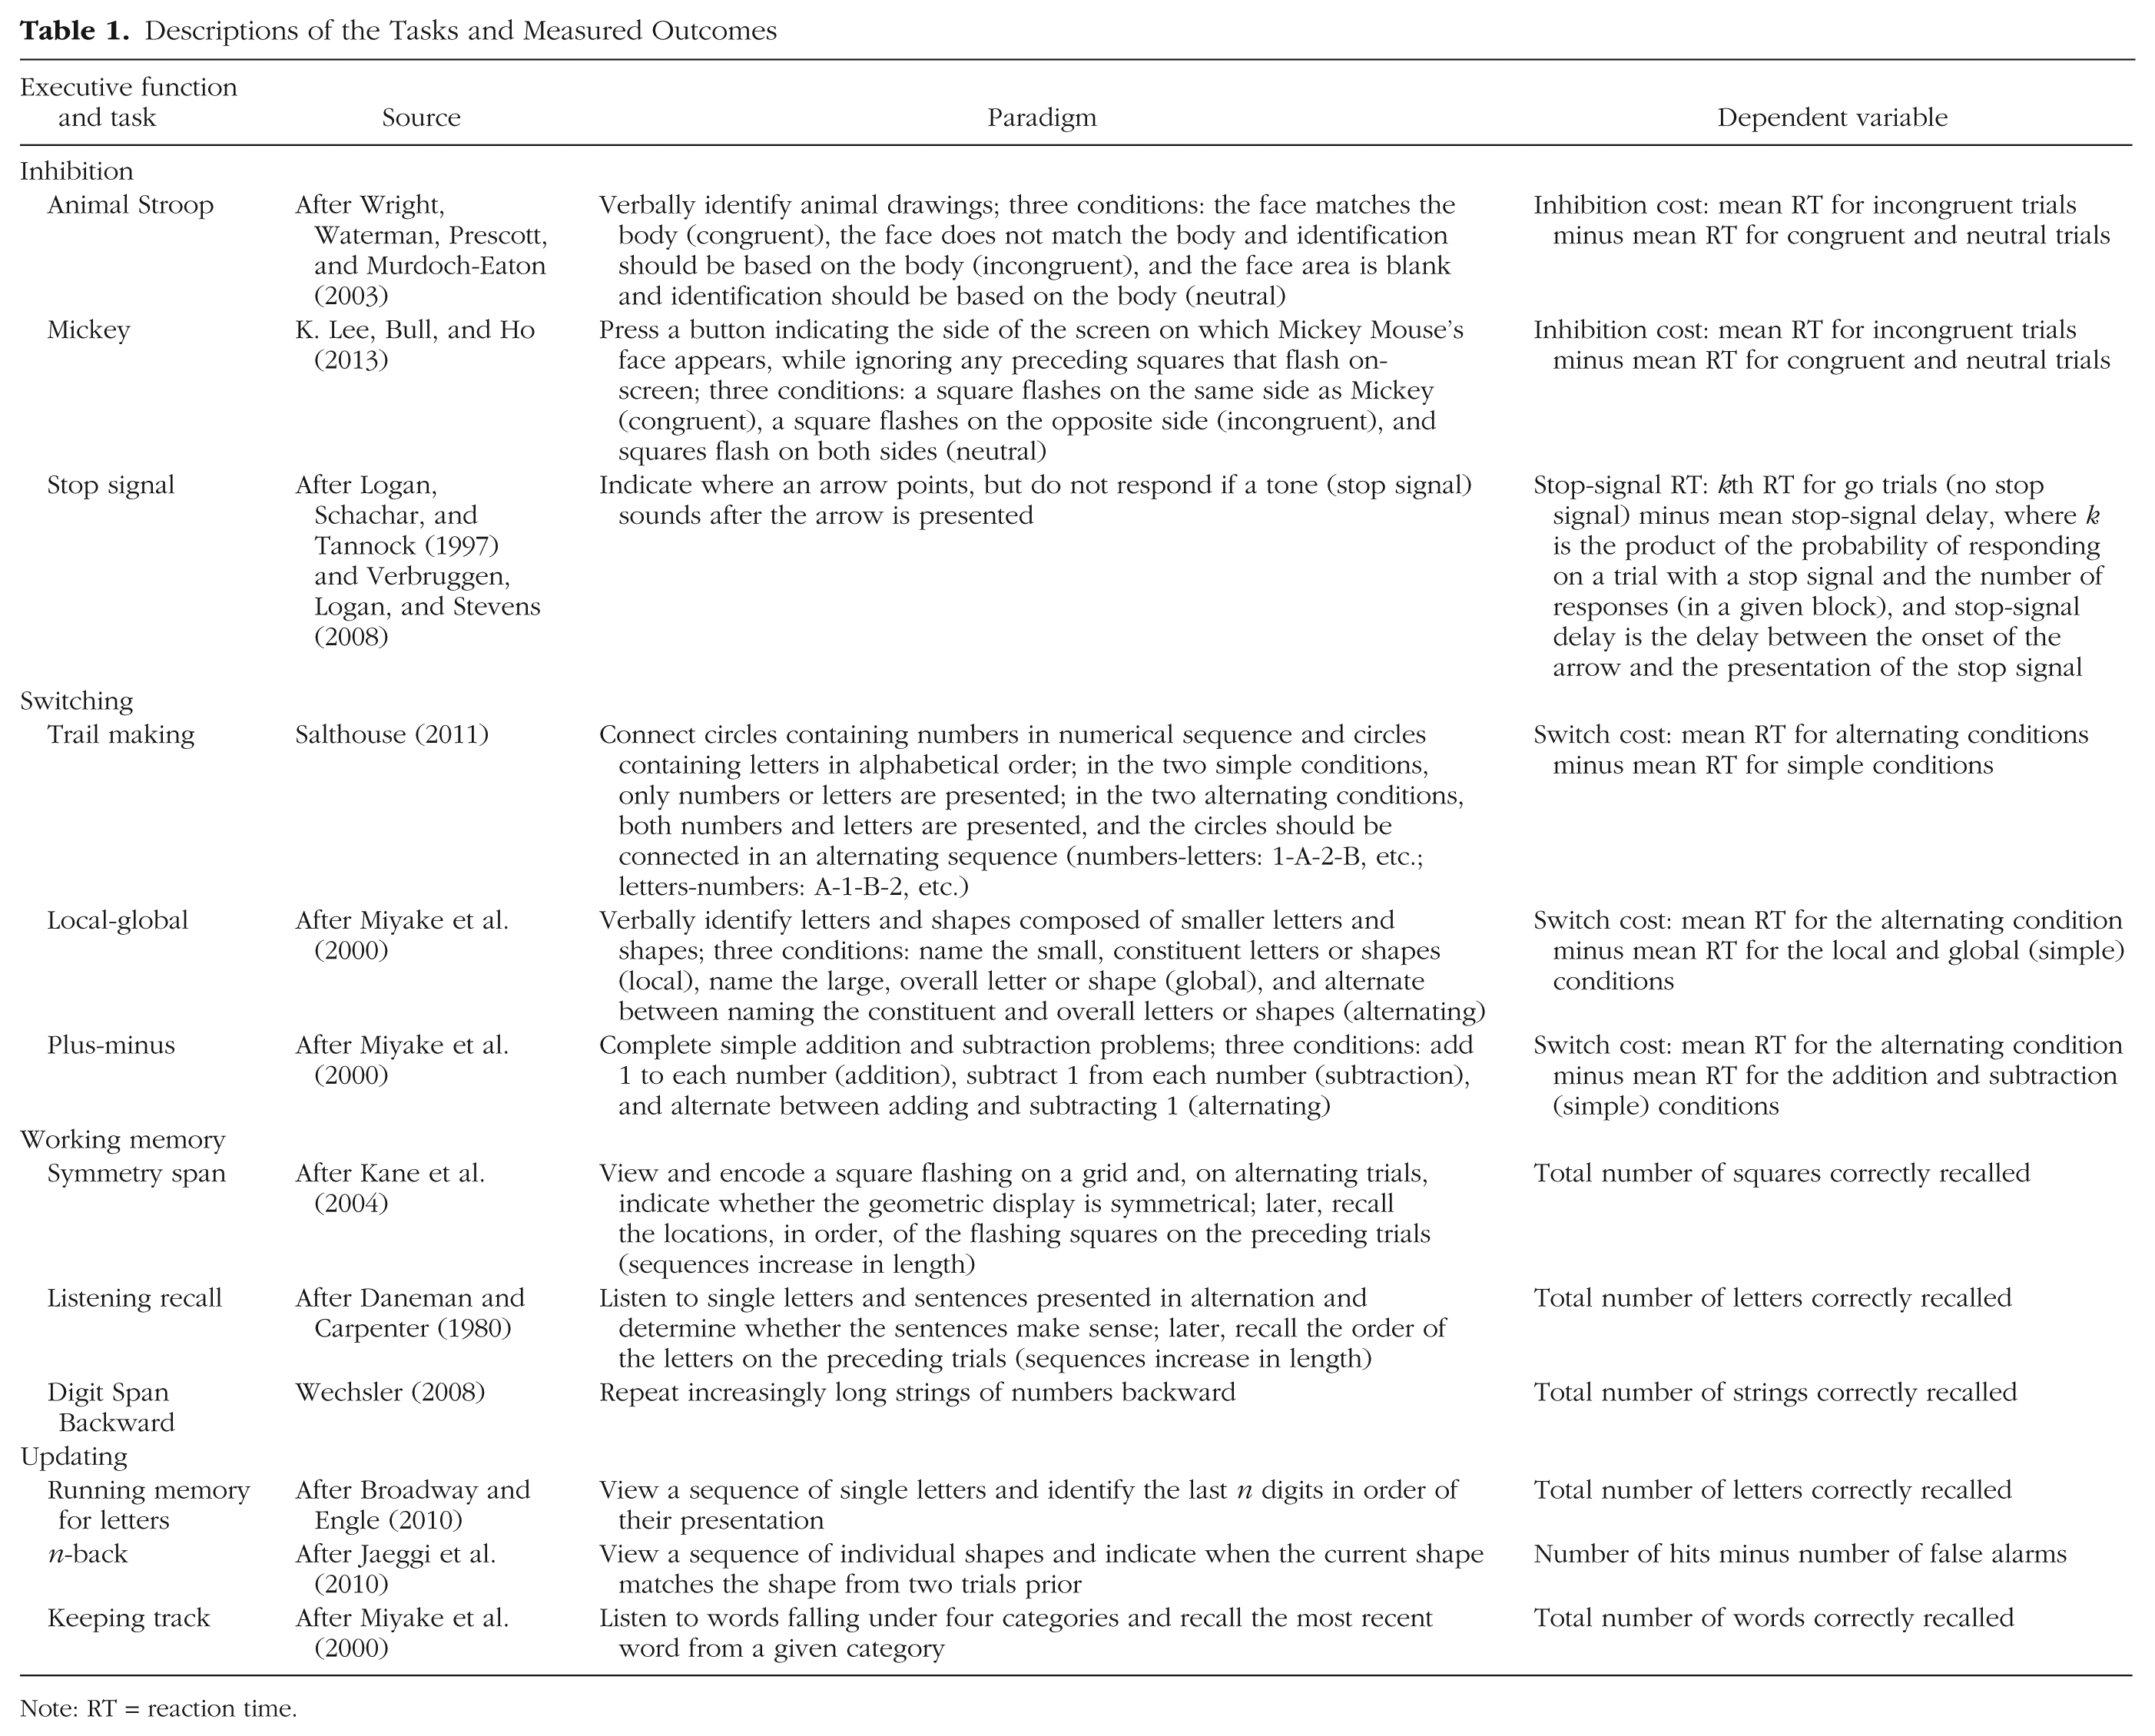
Note: RT = reaction time.
To maintain consistency with the broader EF literature, we converted timed responses to reaction time (RT) metrics. Switch costs and inhibition costs were multiplied by −1 so that higher scores indicated better performance. To correct for positive skew, we log-transformed trail-making and local-global scores and took the square root of n-back and listening-recall scores. All stop-signal scores in a given block were omitted if the participant failed to stop on stop trials less than 25% or more than 75% of the time, failed to respond on go trials more than 60% of the time, responded incorrectly on go trials more than 10% of the time, or had a stop-signal RT less than 50 ms (Congdon et al., 2010). Stop-signal RTs were averaged across blocks for the 91% of participants for whom block-level data remained. Plus-minus scores more than 3 standard deviations from the mean were Winsorized to the next least extreme value. Additional scores were omitted because of errors in task administration. All analyses used standardized scores. We controlled for age-related differences in performance by regressing first-order latent EF factors onto age in all models.
Phenotypic analyses
For all phenotypic analyses, the sample was treated as consisting of individual cases. Analyses were run using Mplus Version 7.11 (Muthén & Muthén, 2012). We used the Complex Survey option in Mplus to correct for the nonindependence of observations that arose from having individuals embedded in the same family. Each of the 12 tasks was specified to load onto one of up to four latent variables representing inhibition, switching, working memory, and updating ability. This latent-variable approach allowed us to extract factors representing variance common across selected tasks separately from task-specific (and potentially nonexecutive) variance.
We fit a series of confirmatory factor models to evaluate possible relationships among the EF tasks: a four-factor model in which four distinct EFs accounted for variation in task performance (Model 1), a three-factor model in which updating and working memory tasks were modeled as indicators of a single latent variable (Model 2), a three-factor model in which inhibition and switching tasks served as indicators of a single latent variable (Model 3), a two-factor model in which updating and working memory were combined into one latent factor and switching and inhibition were combined into a second factor (Model 4), and a one-factor model in which all tasks were regressed onto a single latent variable (Model 5). Models 1 through 4 included a latent, Common EF factor for which all first-order latent factors served as indicators. Model fit was assessed by the chi-square test, which measures badness of fit of the model to the data; by the root-mean-square error of approximation (RMSEA), which indicates the overall degree of discrepancy between the observed covariance matrix and a model-implied covariance matrix; by the comparative fit index (CFI), which compares the model with a baseline model in which no variables are interrelated; and by the Akaike information criterion (AIC), which enables the comparison of nonnested models. To compare the fit of different models, we computed scaled chi-square difference statistics.
Behavioral genetic analyses
Our primary behavioral genetic analyses modeled phenotypic variances as the sum of three factors: additive genetic influences (A), which serve to make individuals who are genetically more related (e.g., monozygotic twins compared with dizygotic twins) more similar on an outcome of interest; shared environmental influences (C), which serve to make children raised in the same family more similar than children raised in different families, regardless of genetic relatedness; and nonshared environmental influences (E), which serve to differentiate children raised in the same family, even when genetically identical. We also fit models in which the C factors were dropped. One of these consisted of only the A and E factors, and the other allowed for contributions from the A and E factors along with a factor representing dominance genetic effects (D), which are nonadditive. Using the best-fitting phenotypic model for guidance, we estimated the relative contributions of the genetic and environmental factors to variance at three levels of measurement: the Common EF factor, the domain-specific factors (independent of Common EF), and the individual tasks (independent of Common EF and domain-specific factors). All behavioral genetic analyses used the Complex Survey option in Mplus to correct for the nonindependence of observations that arose from having multiple “twin” pairs from each set of triplets.
Results
Tables 2 and 3 report descriptive statistics for the 12 EF tasks. For each inhibition and switching task that compared RTs across nonexecutive and executive conditions, there was a mean RT cost associated with the respective executive skill. Reliabilities were generally moderate to high for individual conditions but, as is typical for the literature, were occasionally somewhat lower for difference scores, which represent person-specific switching and inhibition costs. Reliabilities for the updating and working memory tasks were also generally moderate to high. Correlations of task performance with age and within-twin (phenotypic) and cross-twin correlations in task performance are provided in Tables S1, S2, and S3 in the Supplemental Material available online.
Descriptive Statistics for the Task Conditions
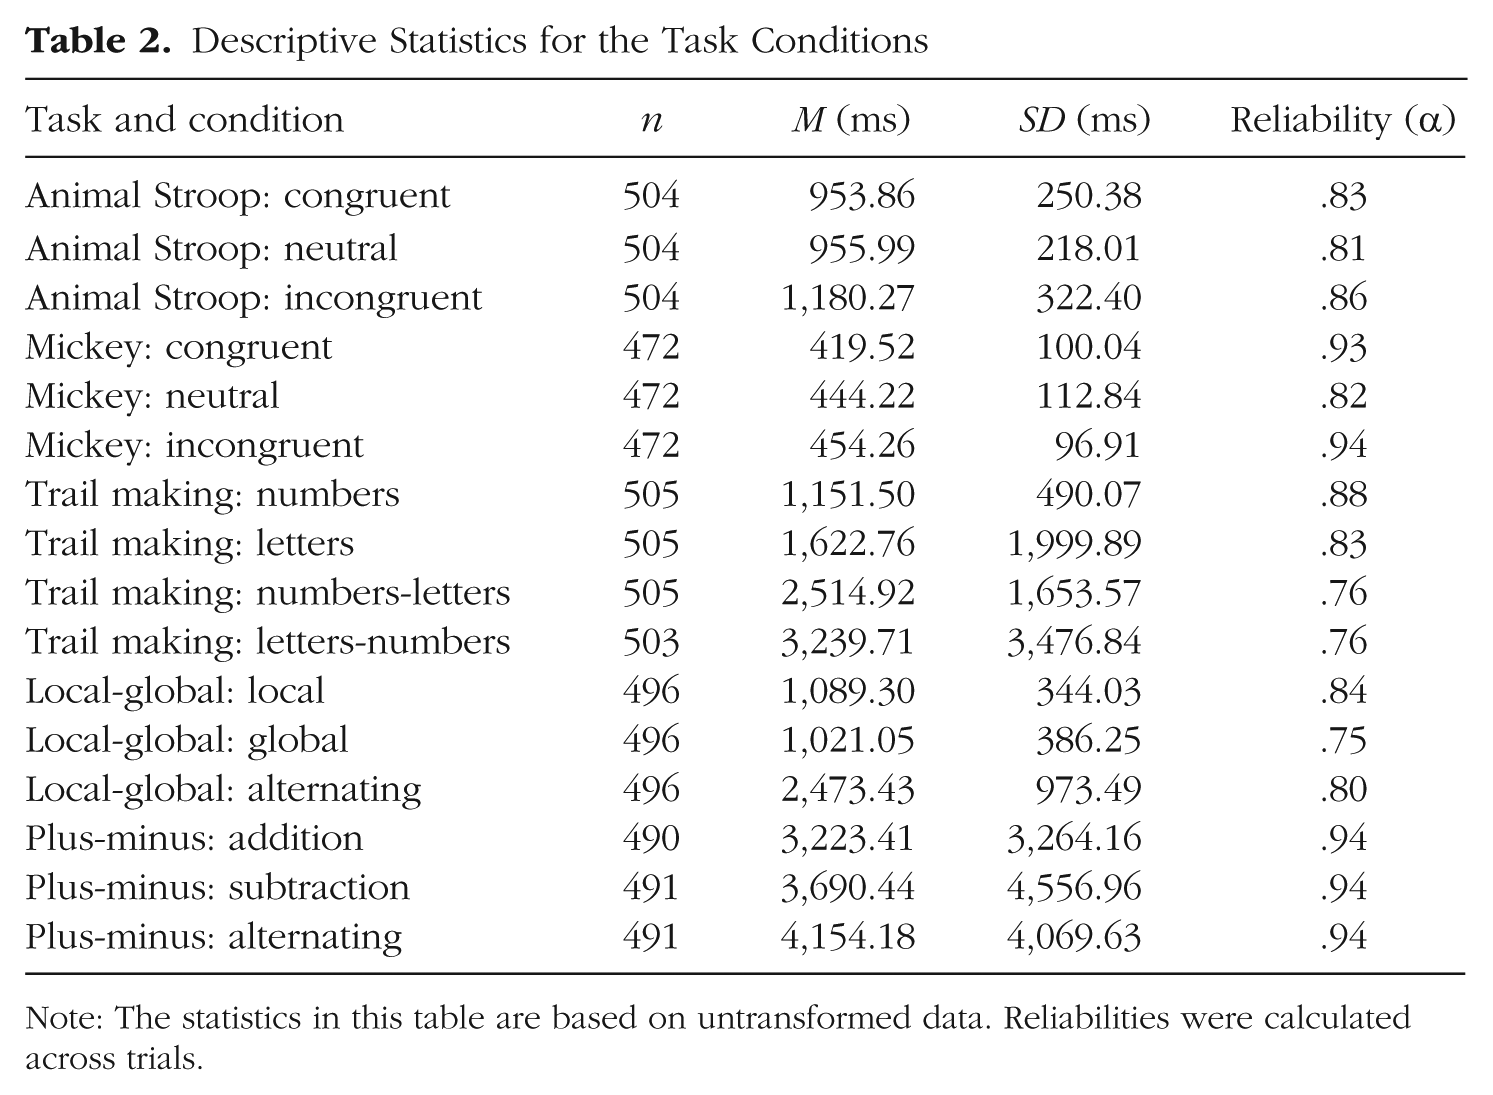
Note: The statistics in this table are based on untransformed data. Reliabilities were calculated across trials.
Descriptive Statistics for the Dependent Variables
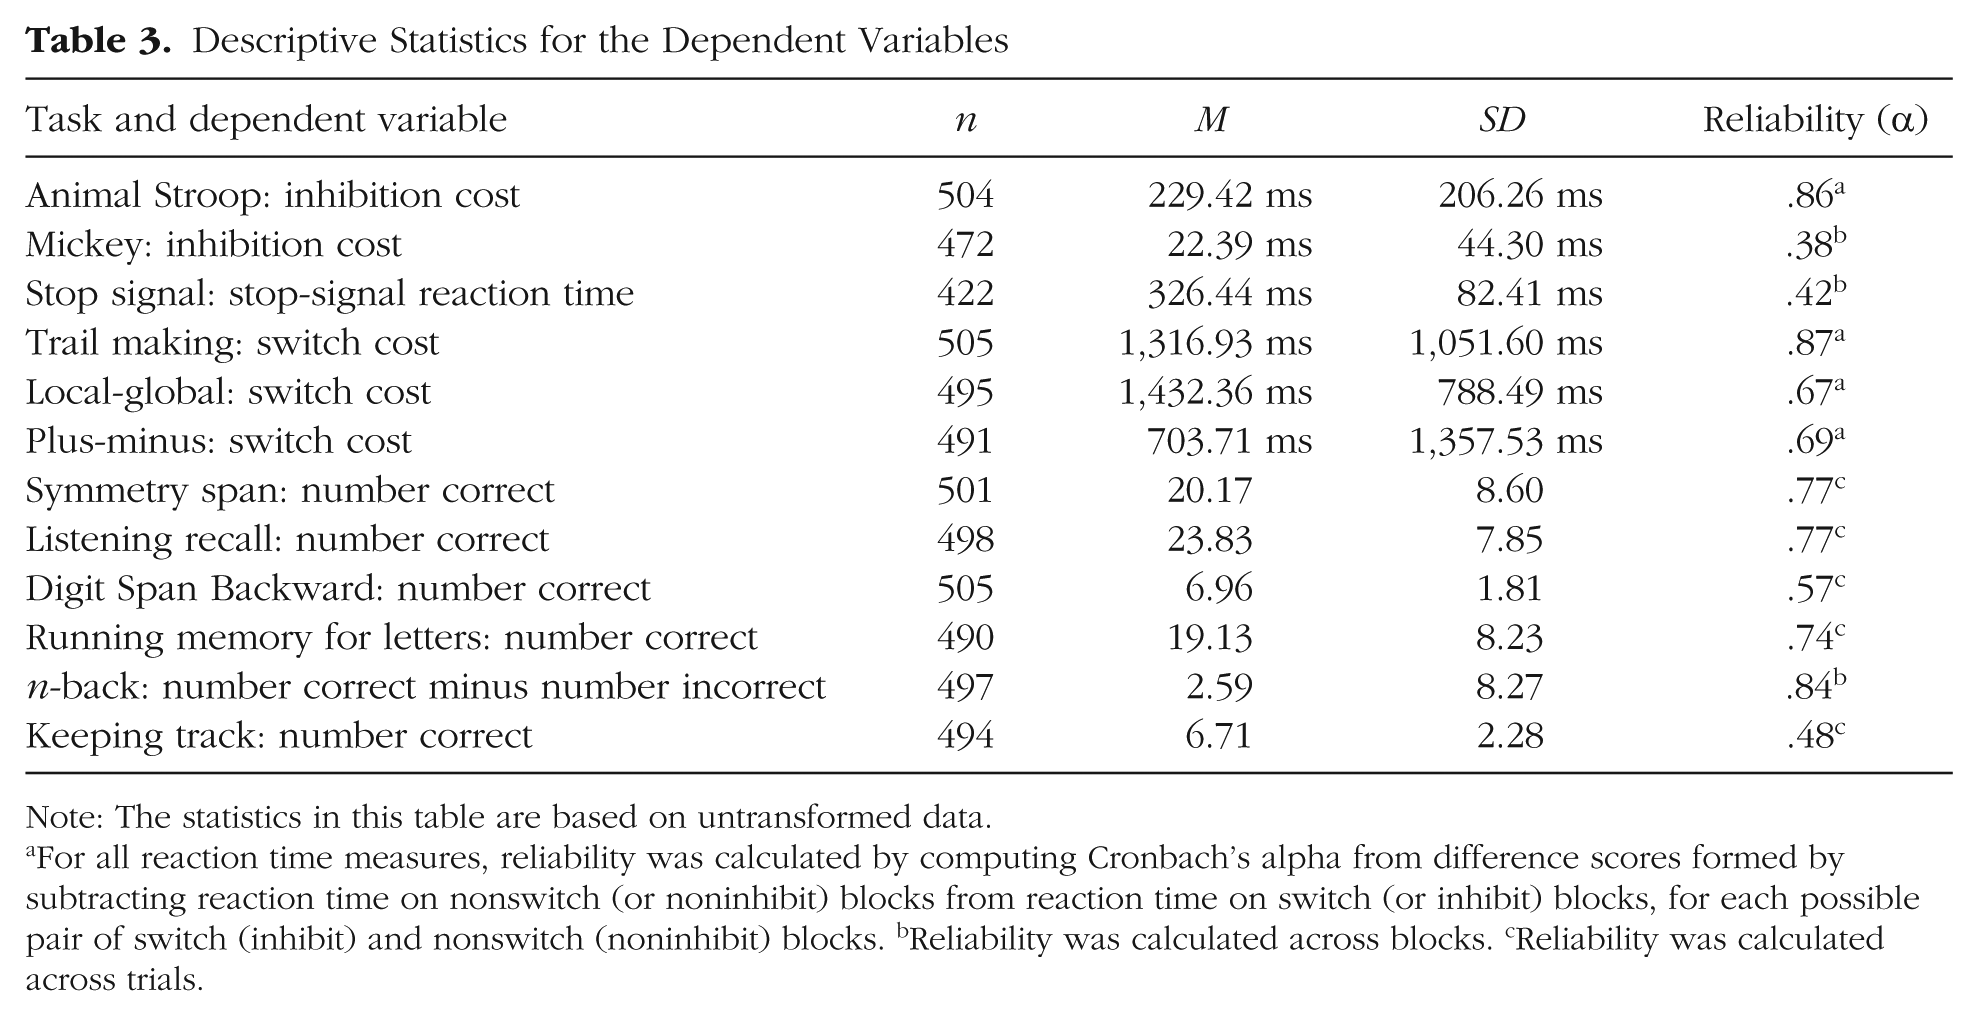
Note: The statistics in this table are based on untransformed data.
For all reaction time measures, reliability was calculated by computing Cronbach’s alpha from difference scores formed by subtracting reaction time on nonswitch (or noninhibit) blocks from reaction time on switch (or inhibit) blocks, for each possible pair of switch (inhibit) and nonswitch (noninhibit) blocks. bReliability was calculated across blocks. cReliability was calculated across trials.
Confirmatory factor models
We compared four factor structures to determine which model to enter into behavioral genetic analyses. Table 4 presents the standardized factor loadings from these competing models. Our primary model was a hierarchical factor model consisting of four first-order EF domains and a higher-order Common EF factor (Model 1). The fit of this full model was excellent, χ2(58) = 62.31, p = .326, RMSEA = .01, CFI = .997 (see Table 5). Factor loadings of individual tasks on the first-order factors were all significant and generally in the moderate range, with the exception of lower—yet still significant—loadings for the Mickey, stop-signal, and plus-minus tasks. This overall pattern of loading magnitudes (Mdn = .62, M = .54) is comparable to that found in previous EF research with adult samples: Miyake et al. (2000) reported a median loading of .60 and a mean loading of .50, and Friedman et al. (2008) reported a median loading of .63 and a mean loading of .59. Loadings of the first-order factors on the higher-order Common EF factor, when standardized relative to the factors’ total variances, were moderate in range (.33, .61, .75, and .78 for Inhibition, Switching, Working Memory, and Updating, respectively). However, because each of the first-order factors was also regressed on age (see Table 4), such loadings are semipartial with respect to age; the loadings are therefore attenuated relative to what they would be in an age-homogeneous sample. When standardized relative to variance in each factor that was independent of age—that is, partial with respect to age and therefore more directly comparable to loadings from an age-homogeneous sample—the loadings of the first-order factors on the Common EF factor were large (.66, .80, 1.00, and .92 for Inhibition, Switching, Working Memory, and Updating, respectively), as has often been found in child samples (e.g., K. Lee, Bull, & Ho, 2013).
Standardized Parameter Estimates From Alternative Factor Models of Executive Functions

Note: The table shows the standardized loadings of the 12 executive-function (EF) tasks on the first-order factors in each model, the standardized loadings of the first-order factors on the higher-order EF factor, and the standardized regression coefficients for age as a predictor of the latent EF scores. Note that the composition of the numbered factors varies across models. Values in brackets are 95% confidence intervals. In = Inhibition; Sw = Switching; WM = Working Memory; Up = Updating.
p < .05. **p < .01. ***p < .001.
Results for the Confirmatory Factor Models of Executive Functions: Fit Indices and Results for Scaled Chi-Square Differences Between Models

Note: Values in brackets are 95% confidence intervals. EF = executive function; In = Inhibition; Sw = Switching; WM = Working Memory; Up = Updating; RMSEA = root-mean-square error of approximation; CFI = comparative fit index; AIC = Akaike information criterion.
Model-implied semipartial correlations among the first-order factors were .20 for Inhibition and Switching, .25 for Inhibition and Working Memory, .26 for Inhibition and Updating, .46 for Switching and Working Memory, .48 for Switching and Updating, and .59 for Working Memory and Updating. Model-implied partial correlations among the first-order factors were .52 for Inhibition and Switching, .65 for Inhibition and Working Memory, .60 for Inhibition and Updating, .79 for Switching and Working Memory, .73 for Switching and Updating, and .91 for Working Memory and Updating.
We tested whether a number of more parsimonious models could account for the data as well as the full hierarchical four-factor model (see Tables 4 and 5). Model 2 was a hierarchical three-factor model in which working memory and updating tasks served as indicators for the same factor. Though model fit was good overall, χ2(60) = 82.19, p = .030, RMSEA = .03, CFI = .984, there was a significant decrease in fit compared with Model 1 (p < .001). In Model 3, inhibition and switching tasks were loaded onto the same factor, and working memory and updating tasks remained independent. The model fit the data well, χ2(60) = 76.86, p = .07, RMSEA = .02, CFI = 9.88, though not as well as Model 1 (p < .001). Model 4 was a two-factor model that consisted of a combined Inhibition and Switching factor and a combined Working Memory and Updating factor. The decrement in model fit, χ2(63) = 97.21, p = .004, RMSEA = .03, CFI = .976, as compared with Model 1, was even more pronounced (p < .001). Finally, we considered the possibility that the commonalities among the tasks and factors could be explained by a unitary dimension (Model 5). Although all factor loadings onto the Common EF factor remained significant and model fit was acceptable, χ2(65) = 127.623, p < .001, RMSEA = .04, CFI = .956, this model fit appreciably worse than all the other models (p < .001). Additional model fit statistics and comparisons are provided in Table 5. On the basis of these comparisons, we accepted Model 1 as the best-fitting model.
Age-invariance models
Age-related differences in the measurement properties of the EF tasks could distort estimates of genetic and environmental influence. To address this concern, we divided the sample into relatively equally sized groups of younger children (< 11 years) and older children and adolescents (≥ 11 years) and tested for measurement invariance. We first fit an invariance model in which each EF task was specified to load onto its corresponding first-order EF domain (as per Model 1), and factor loadings and intercepts were constrained to be invariant across age groups. The invariance model exhibited excellent fit to the data, χ2(112) = 115.44, p = .39, RMSEA = .01, CFI = .996. Next, we fit a noninvariance model in which the intercepts and loadings of the tasks on their respective factors were free to differ across groups. The noninvariance model also resulted in exceptional model fit, χ2(96) = 101.59, p = .33, RMSEA = .02, CFI = .993. A χ2 difference test indicated that the invariance model fit no worse than the noninvariance model (p = .514), an indication of measurement invariance across age groups.
Behavioral genetic models
The best-fitting model (Model 1) from the confirmatory factor analyses specified a hierarchical structure with each task loading onto one of four broad EF domains (Inhibition, Switching, Working Memory, and Updating) that in turn loaded onto a higher-order Common EF factor. This structure served as the basis for our behavioral genetic analyses. We first fit a model that estimated A, C, and E influences operating on the Common EF factor, individual EFs, and specific tasks (see Fig. 1 and Table 6). The standardized a coefficient for the Common EF factor equaled 1.00 (p < .001); this indicated that genetic influences on the Common EF factor mediated 100% of the variance common to the domain-specific factors. Of the domain-specific factors, only Switching showed genetic influence independent of the Common EF factor (a = .59, p < .001). We also observed significant unique nonshared environmental influence on Working Memory (e = .38, p = .003) and Updating (e = .24, p = .028). Significant residual genetic effects were present for 7 of the 12 tasks, and all tasks exhibited significant nonshared environmental effects. The shared environment significantly contributed to residual variance of only one task, stop signal (c = .28, p = .021).
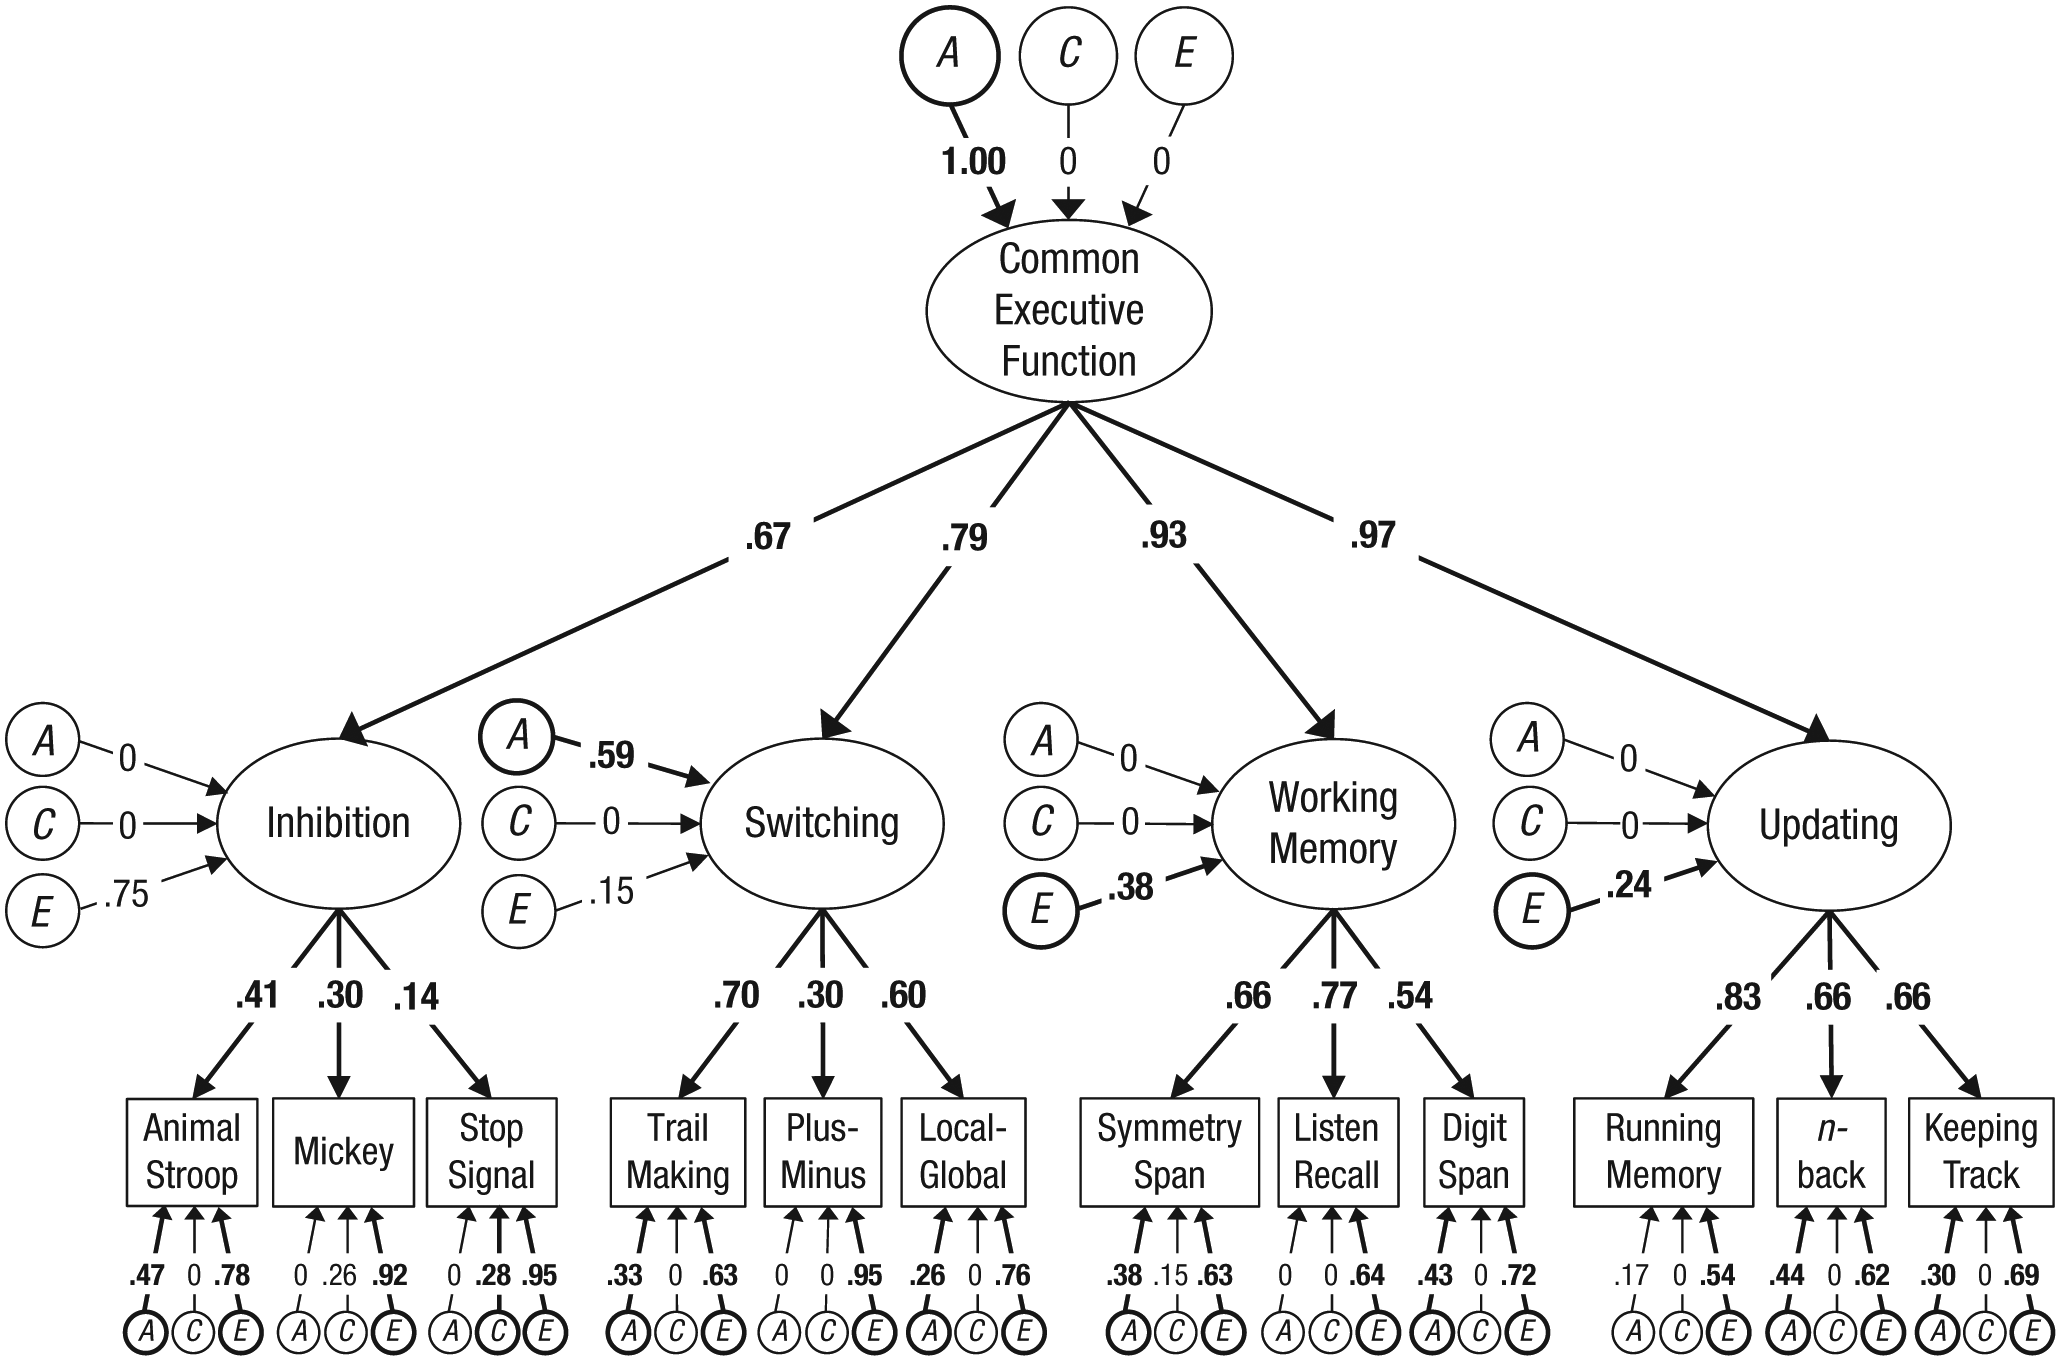
Hierarchical multivariate twin model for additive genetic (A), shared environmental (C), and nonshared environmental (E) contributions to performance on executive-function tasks. The numbers on the arrows represent standardized factor loadings. The model controlled for age effects at the level of the first-order factors (Inhibition, Switching, Working Memory, and Updating). Because the purpose of this analysis was to understand the relative contributions of genetic and environmental influences to individual differences, as distinct from age-related differences, the loadings of the first-order factors have been standardized relative to their age-independent variance. Boldface indicates significant paths, p < .05.
Standardized Factor Loadings From the Behavioral Genetic Models
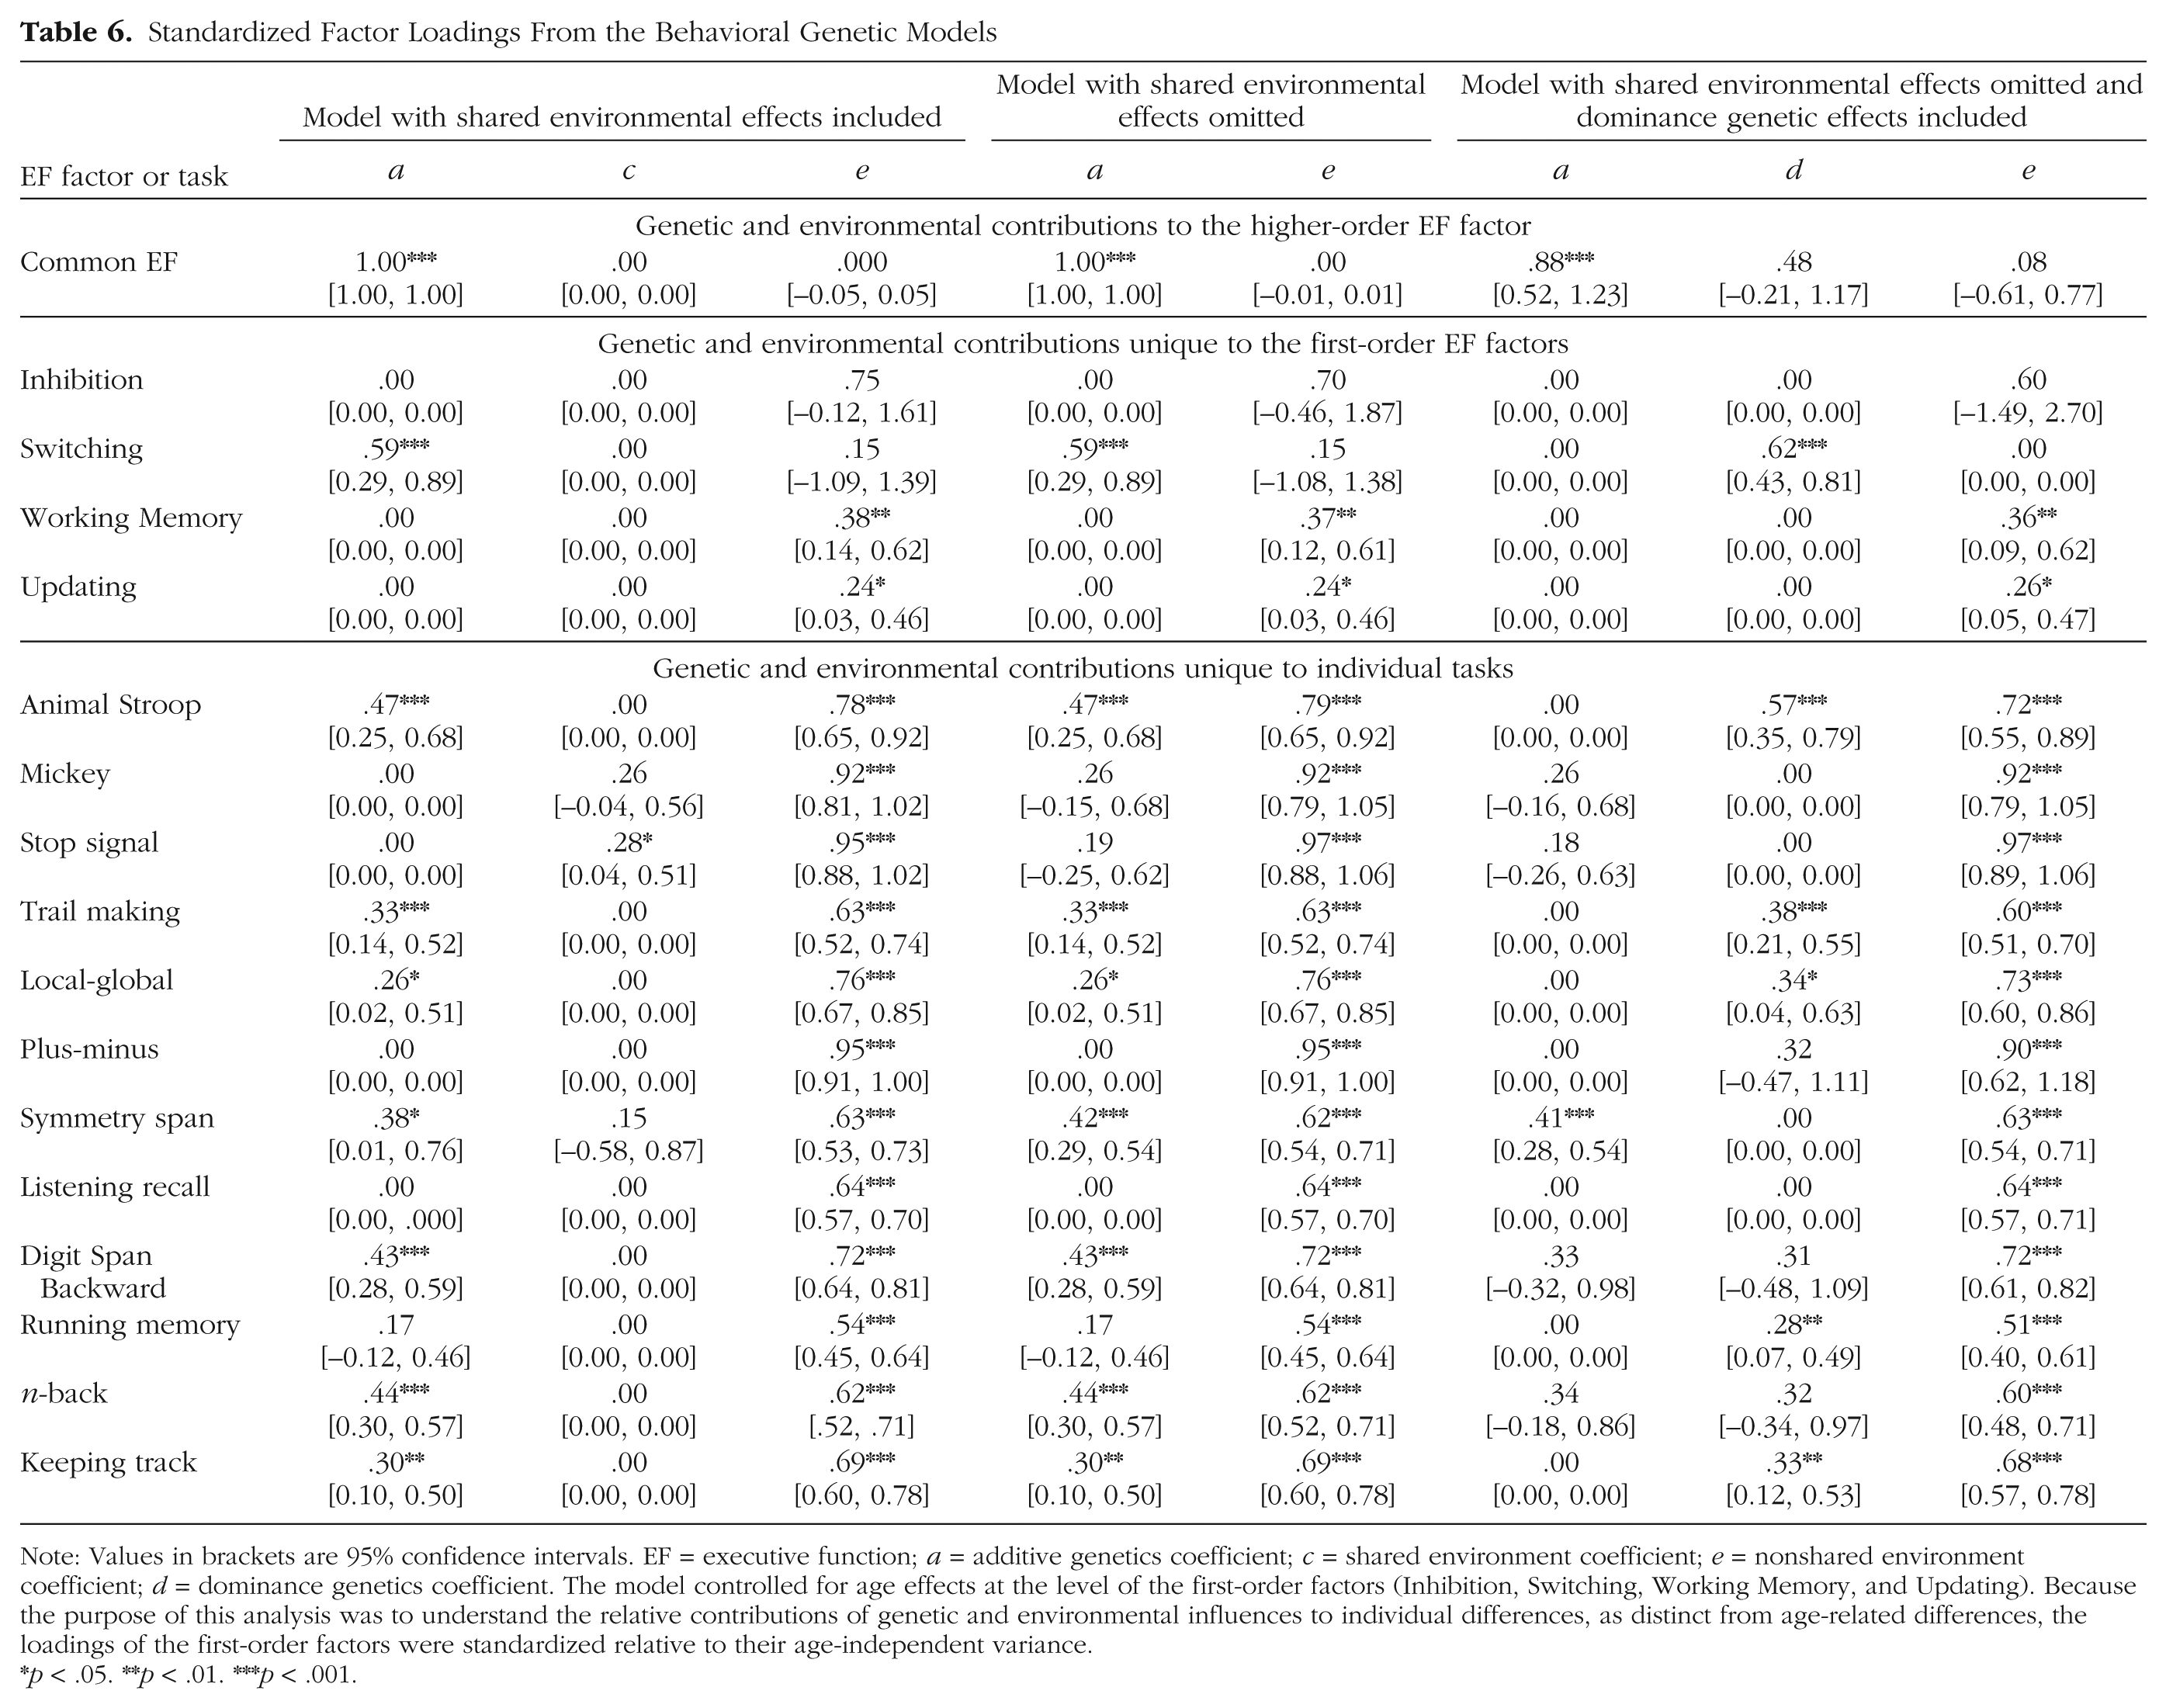
Note: Values in brackets are 95% confidence intervals. EF = executive function; a = additive genetics coefficient; c = shared environment coefficient; e = nonshared environment coefficient; d = dominance genetics coefficient. The model controlled for age effects at the level of the first-order factors (Inhibition, Switching, Working Memory, and Updating). Because the purpose of this analysis was to understand the relative contributions of genetic and environmental influences to individual differences, as distinct from age-related differences, the loadings of the first-order factors were standardized relative to their age-independent variance.
p < .05. **p < .01. ***p < .001.
We next fit an AE model (see Table 6), which yielded a pattern of results very similar to that of the ACE model: 100% additive genetic influence on the Common EF factor, unique genetic influence on the Switching factor and 7 tasks, and unique nonshared environmental influence on Working Memory, Updating, and all 12 tasks. A model fit comparison revealed that the AE and ACE models did not differ significantly in their chi-square values (p = .092); thus, there was no loss in fit to the data when shared environmental parameters were dropped completely.
Finally, we fit an ADE model representing the possibility that dominance genetic effects explained the observed task and factor correlations better than additive genetics alone (see Table 6). Genes continued to explain more than 99% of the variation in Common EF performance; additive genetics contributed 77.4% (p < .001), and dominance genetics contributed the remaining 23.0% (p = .177). The nonshared environment accounted for less than 1% of the variation in the Common EF factor. Dominance genetic effects significantly contributed to unique variance in Switching performance, as well as to residual variance for five tasks. After we accounted for dominance effects, additive genetics contributed significantly to unique variance for only one task. Model fit, as indexed by chi-square, did not differ significantly from that of the AE model (p = .248). The AIC, which takes into account model parsimony, indicated that the AE model was the best of all three models.
Discussion
Despite widespread interest in EFs as explanatory mechanisms for the development of a host of psychological and social outcomes, there has been surprisingly little behavioral genetic work on EFs in childhood. Motivated by provocative findings of substantial heritability of EF factors in young adults (Friedman et al., 2008), in the current study we applied behavioral genetic methods to estimate the magnitude of genetic and environmental influences on individual differences within a hierarchical factor structure of EFs in childhood.
Our results indicate that an exclusively genetic factor mediates 100% of the variance common to all four EF domains that we examined: inhibition, switching, working memory, and updating. That we found this high level of heritability in a sample of children is particularly striking in light of strong evidence that other phenotypes, such as general intelligence, are only modestly heritable in childhood and increase in heritability into adulthood (Haworth et al., 2009). The nonshared environment contributed significantly to variance specific to the Working Memory and Updating factors, as well as to potentially nonexecutive variance specific to each individual task, but not to the Common EF factor. No appreciable effects of the shared environment were apparent at any level of analysis. Together, these results indicate that EFs in childhood are united by shared genetic influences, yet distinguishable as a result of both genetic and nonshared environmental contributions to specific EF domains and task performance.
Although our main findings are consistent with the genetic architecture uncovered for young adults by Friedman et al. (2008), there is one notable difference. In contrast to Friedman et al., we did not detect genetic effects specific to the latent Updating factor above and beyond those mediated by the Common EF factor. This may indicate that the genetic factors that distinguish EFs from one another are not fully expressed until later in development.
The finding that the Common EF factor is entirely heritable in middle childhood has important implications for understanding how EFs develop over time, as well as for understanding the mechanisms through which they are associated with important psychosocial sequelae. In combination with accumulating evidence that childhood EFs predict a cross-cutting range of academic, economic, and mental-health outcomes later in life, our results suggest that childhood EFs may act as developmental endophenotypes—or prodromal markers—for an array of genetically influenced psychological, social, and health outcomes. This suggests not only that EFs have the potential to provide researchers “simpler clues to genetic underpinnings” (Gottesman & Gould, 2003, p. 636) of such outcomes compared with the outcomes themselves, but also that EFs might be used to identify children who are at genetic risk for as-yet-unexpressed maladaptive outcomes and who could therefore be targeted in early interventions.
Our findings also open exciting avenues for future work. First, in light of the strong theoretical and empirical link between EFs and neurobiology, it will be important to test the extent to which the neural bases of EFs are themselves genetically influenced and whether such genetic factors are fully captured by behavioral EF measures. Second, although our findings indicate that there is a strong statistical link between the Common EF factor and genetic variation, it is well known that heritability may encompass variation resulting from Gene × Environment interactions, whereby the magnitude of genetic influence on a phenotype differs as a function of environmental context, in addition to more direct genetic main effects. Future work will be necessary to test for Gene × Environment interactions involving EFs. For instance, do the Gene × Socioeconomic Status interactions observed for intelligence and achievement (Tucker-Drob et al., 2013) act on EFs? Alternatively, are genetic influences on EFs expressed equally across the range of socioeconomic status but differentially related to intelligence and achievement across socioeconomic strata? Third, it will be important to test for gene-environment correlations, whereby the types of environments experienced come to be nonrandomly associated with genetically influenced individual differences in EFs. If dynamic amplification processes involving gene-environment correlations serve as the basis for the strikingly high heritability of EF, as has been postulated to be the case for the heritability of cognitive ability (Tucker-Drob et al., 2013), such processes would need to unfold primarily very early in childhood, as our results indicate that heritability has already approached a maximum by middle childhood. Finally, future research will be necessary to test the extent to which interventions to boost EFs attenuate or magnify genetic variation in EFs. Investigating such questions has the potential to reveal key mechanisms underlying the development of a range of psychological and social outcomes, and such discoveries may better inform interventions and policies that promote psychological and social well-being.
Footnotes
Declaration of Conflicting Interests
The authors declared that they had no conflicts of interest with respect to their authorship or the publication of this article.
Funding
The Population Research Center is supported by National Institutes of Health Grant R24HD042849. L. E. Engelhardt is supported by a National Science Foundation Graduate Research Fellowship.

References
Supplementary Material
Please find the following supplemental material available below.
For Open Access articles published under a Creative Commons License, all supplemental material carries the same license as the article it is associated with.
For non-Open Access articles published, all supplemental material carries a non-exclusive license, and permission requests for re-use of supplemental material or any part of supplemental material shall be sent directly to the copyright owner as specified in the copyright notice associated with the article.
