



Abstract
Purity is commonly regarded as being physically embodied in the color white, with even trivial deviations from whiteness indicating a loss of purity. In three studies, we explored the implications of this “white = pure” association for disgust, an emotion that motivates the detection and avoidance of impurities that threaten purity and cleanliness. We hypothesized that disgust tunes perception to prioritize the light end of the light-dark spectrum, which results in a relative hypersensitivity to changes in lightness in this range. In Studies 1 and 2, greater sensitivity to disgusting stimuli was associated with greater ability to make subtle gray-scale discriminations (e.g., detecting a faint gray stimulus against a white background) at the light end of the spectrum relative to ability to make subtle gray-scale discriminations at the dark end of the spectrum. In Study 3, after viewing disgusting images, disgust-sensitive individuals demonstrated a heightened ability to detect deviations from white. These findings suggest that disgust not only motivates people to avoid impurities, but actually makes them better able to see them.
Procter & Gamble recently launched a guerrilla marketing campaign to advertise their Mr. Clean brand of cleaning products. They found city crosswalks in which the white lines had become dirty and dark over time. In each crosswalk, they picked one line and painted it with several coats of fresh, brilliant white paint. Finally, they added the Mr. Clean logo. The freshly painted line created a dramatic visual effect. Compared with the dirty, off-white lines, it appeared fresh and pristine. The clever use of lightness created the illusion that it had been cleaned. This simple yet powerful visual effect illustrates how readily light colors—especially white—evoke a sense of cleanliness.
This lightness-cleanliness link is found across various cultures (Grieve, 1991; Williams, Morland, & Underwood, 1970) and can be understood by considering that as entities become dirty, they typically darken. Because cleaning often involves lightening (with “pure” white representing perfect cleanliness), concerns with purity may elicit a focus on white. This association is reinforced by the fact that places or objects most vulnerable to disease transmission—such as hospitals and bathrooms—are customarily white. In reviewing the emergence of modern plumbing, Lupton and Miller (1992) noted that “the ‘modern’ bathroom emerged at the turn of the century as an overtly industrial ensemble of porcelain-enameled equipment, with white, washable surfaces that reflected contemporary theories of hygiene” (p. 3) and that “the hard, white porcelain bathroom rendered dust and grime immediately visible” (p. 23). In this framework, preserving purity is often tantamount to protecting pure white from darker contaminants. In the psychology of purity, even the slightest deviation from a pure state (i.e., whiteness) is an unacceptable blemish. Consequently, the ability to distinguish between light shades (especially white) and slightly darker shades may be particularly important for satisfying purity goals.
The centrality of lightness to purity goals may have important implications for the emotion of disgust. Disgust, which likely originated as a food-rejection response, is the experience of revulsion at the prospect of contact with, or ingestion of, contaminating material (Rozin & Fallon, 1987). Disgust promotes a preoccupation with order, cleanliness, and purity (Douglas, 1966). For example, disgust orients early visual attention toward cleanliness-related images (Vogt, Lozo, Koster, & De Houwer, 2011). Disgust-sensitive individuals strive to create pure, clean, and organized environments and are chronically vigilant for even the slightest hint of impure or contaminating material.
If disgust activates purity goals, which then encourage a focus on lightness, then disgust may trigger the prioritization of the light end of the visual spectrum. We hypothesized that disgust tunes perception to the extreme light end of the light-dark spectrum, producing an enhanced ability to discriminate among small deviations in lightness in this range. This proposed perception-altering effect of disgust would facilitate the function of disgust—the detection and avoidance of impurities and contaminants (Rozin & Fallon, 1987).
The hypothesized effect of disgust on perception would be an example of perceptual tuning, a phenomenon in which perceptual sensitivities are modulated to prioritize certain ranges of sensory input (Lewkowicz & Ghazanfar, 2009). Perceptual tuning can be thought of as a type of perceptual trade-off in which sensitivities to less common or less important ranges of sensory input are sacrificed in exchange for heightened sensitivity to more common or more important ranges.
Perceptual tuning is well documented in infants. At first, infants are sensitive to a wide range of sensory inputs, but over time, their perceptual sensitivities become tuned to the ranges of inputs they typically experience (Lewkowicz & Ghazanfar, 2009). For example, infants are first able to discriminate among a wide range of phonemes, including those typical of foreign languages. Exclusive exposure to their native language, however, leads to a progressive narrowing in sensitivity: They become increasingly more sensitive to native phonemes and increasingly less sensitive to nonnative phonemes (Pons, Lewkowicz, Soto-Faraco, & Sebastian-Galles, 2009; Werker & Tees, 1984). Experience-dependent perceptual tuning—which occurs also during the perception of faces (Pascalis, de Haan, & Nelson, 2002) and musical rhythm (Hannon & Trehub, 2005)—is hypothesized to underlie the other-race effect, in which individuals are best able to discriminate among faces of their own race (Kelly et al., 2007). In adulthood, perceptual tuning can occur rapidly. For example, Li, Howard, Parrish, and Gottfried (2008) tested participants’ ability to discriminate between two nearly identical odors that were perceptually indiscriminable at baseline. The experimenters paired one of the odors with an electric shock in a fear-conditioning paradigm. When subsequently retested, participants could discriminate the odors at levels well above chance.
In the context of disgust sensitivity, the perceptual trade-off may involve sacrificing the ability to discriminate among dark shades in return for a heightened ability to discriminate among very light shades. If darkness represents impurity, then discriminating among very dark shades is tantamount to discriminating among degrees of impurity (e.g., very impure vs. extremely impure). For the goal of preserving purity, little is gained from increased sensitivity to subtle differences within this range. Indeed, people are largely insensitive to subtle gradations in impurity (Rozin & Nemeroff, 2002). Consequently, if disgust triggers a functional shift in perceptual sensitivity, this shift would be away from darkness and toward lightness. In this article, we report three studies in which we tested this hypothesis.
Overview of the Studies
In each study, we tested participants’ ability to make subtle gray-scale discriminations in both ends of the light spectrum. End of spectrum was a within-subjects factor; half of the trials were at the light end, and half were at the dark end. In Studies 1 and 2, we examined the hypothesis at the level of individual differences by testing whether trait disgust sensitivity was associated with heightened light-end performance (i.e., whether disgust sensitivity affected performance on light-end stimuli relative to performance on dark-end stimuli). In Study 3, we examined the role of disgust in causing perceptual tuning by testing whether viewing disgusting images improved detection of deviations from white.
In all three studies, we used fear as a comparison emotion. Like disgust, fear is an avoidance-eliciting negative emotion associated with darkness. Although darkness connotes danger and potentiates fear (Grillon, Pellowski, Merikangas, & Davis, 1997), it is unclear whether the ability to make subtle gray-scale discriminations in any part of the light spectrum would facilitate avoidance of predators. If anything, it is the dark end of the spectrum that is most relevant to fear (e.g., detecting a shadowy figure at night). Consequently, if fear has a selective effect on perception, it would likely be in the dark end of the spectrum, opposite to the range of the expected effect of disgust. Alternatively, Phelps, Ling, and Carrasco (2006) found that fear enhances contrast sensitivity, a result that suggests that fear may increase performance at all parts of the spectrum. Either way, fear should not selectively improve perception of very light shades.
Study 1
In Study 1, we assessed participants’ ability to discriminate among shades of light gray and among shades of dark gray. We predicted that disgust-sensitive individuals (compared with individuals low in trait disgust) would have better performance on light-end stimuli relative to performance on dark-end stimuli. We also included a priming manipulation in which we interspersed images of emotional facial expressions (showing disgust, fear, or a neutral emotion) between the perceptual trials (following the procedures used in Phelps et al., 2006).
Method
Participants
Participants were 123 University of Virginia undergraduates (97 female and 26 male) with normal or corrected-to-normal vision. They received partial course credit in return for their participation. One participant, who admitted to not reading the instructions (and answering randomly as a result), was excluded.
Materials and procedure
Participants completed the study at a computer station enclosed by a curtain, with moderate overhead ambient light. In each trial, four gray rectangles appeared on the computer screen, equally spaced in a 2 (row) × 2 (column) design. One rectangle was slightly darker or lighter than the others (by 8, 10, or 12 shades). In the 8-bit gray-scale spectrum, there are 256 shades of gray (where 0 = black and 255 = white). For light-end trials, the background was white; three rectangles were set at shade value 205, and the shade of the fourth rectangle could be set at 193, 195, 197, 213, 215, or 217. For dark-end trials, the background was black; three rectangles were set at shade value 50, and the fourth could be set at 38, 40, 42, 58, 60, or 62. All gray-scale stimuli were created and presented using E-Prime software Version 1.1 (Psychology Software Tools, Inc., Pittsburgh, PA) and a 23-in. LCD Monitor (Dell Model P2310H). 1 Participants pressed a key (“1,” “2,” “3,” or “4”) to indicate the location of the rectangle with the different shade, and responses were coded as correct or incorrect. There was no time limit.
Before each perceptual trial, an emotional prime was presented. The primes were images of actors posing an emotion (disgust, fear, or neutral emotion; Tottenham et al., 2009) and were presented for 1 s each. Participants completed three trial blocks (48 trials each), each divided into two subblocks (order randomized): One subblock contained 24 light-end trials, and the other contained 24 dark-end trials. The three blocks differed only in the type of prime that appeared before each trial. The primes did not influence performance in either Study 1 or Study 2, so in reporting all results, we collapsed the data across the blocks.
Participants then completed the Disgust Scale-Revised (DS-R; Haidt, McCauley, & Rozin, 1994, modified by Olatunji et al., 2007), a 25-item measure (α = .59) of trait disgust. Thirteen items assessed agreement (0 = strongly disagree [very untrue about me], 4 = strongly agree [very true about me]) with specific statements (e.g., “It would bother me to see a rat run across my path in a park”). For the other 12 items, participants indicated how disgusting (0 = not disgusting at all, 4 = very disgusting) they would find various experiences (e.g., “You see maggots on a piece of meat in an outdoor garbage pail”). To assess trait fear, we had participants complete Section 1 of the Fear Questionnaire (Marks & Mathews, 1979), a 15-item scale (α = .81) assessing agoraphobia, blood-injury phobia, and social phobia. Participants indicated how much they would avoid various situations “because of fear or other unpleasant feelings” (0 = would not avoid it, 8 = always avoid it).
Results and discussion
We analyzed the performance data, which were nested (trials nested within individuals), using multilevel modeling (hierarchical linear modeling, HLM; Raudenbush, Bryk, Cheong, & Congdon, 2001). Given the binary outcome for each trial (incorrect = 0, correct = 1), the HLM model was Bernoulli. End of spectrum (−1 = light end, 1 = dark end) was entered at Level 1 (within subjects), and trait disgust and trait fear (both converted to z scores) were entered at Level 2 (between subjects).
There were two significant effects. First, there was a main effect of end of spectrum: Dark-end performance (M = 62% correct) was better than light-end performance (M = 49.8% correct), b = 0.26. SE = 0.02, t(17586) = 16.61, p < .001, odds ratio (OR) = 1.29. Second, the predicted End of Spectrum × Trait Disgust interaction was significant, b = −0.04, SE = 0.02, t(17586) = −2.11, p = .04, OR = 0.96; as trait disgust increased, so did performance at the light end relative to performance at the dark end. 2 This effect was driven primarily by improvements in light-end performance rather than by reductions in dark-end performance: Trait disgust was a marginally significant predictor of light-end performance, b = 0.09, SE = 0.05, t(120) = 1.73, p = .09, OR = 1.09, but was unrelated to dark-end performance, b = 0.01, SE = 0.05, t(120) = 0.21, p = .84, OR = 1.01. This effect was selective to trait disgust—trait fear did not interact with end of spectrum to predict performance (t < 1).
Study 2
In Study 2, we used a different perceptual measure, which required detecting a very faint stimulus presented against a background of a nearly identical shade (white or middle gray). This task was designed to model impurity detection. Because white—but not gray—is regarded as pure, we predicted that disgust-sensitive individuals would be highly sensitive to subtle deviations from a white background, but that disgust sensitivity would not be related to sensitivity to deviations from a gray background.
Method
Participants
Fifty-one University of Virginia undergraduates (20 female and 31 male) with normal or corrected-to-normal vision participated in exchange for partial course credit.
Materials and procedure
The trait measures (disgust: α = .87; fear: α = .85) and procedure were identical to those used in Study 1 except for the content of the perceptual trials. In each of 144 trials, a single digit (1, 2, 3, 4, or 5) was presented against a white (light end, shade value 255) or middle-gray (dark end, shade value 127) background (see Fig. 1 for examples of a light-end trial and a dark-end trial). The digit was one, two, or three shades darker than the background. Participants were instructed that if they saw a number, they should indicate it by pressing the appropriate key (i.e., “1,” “2,” “3,” “4,” or “5”). Responses were coded as correct or incorrect. Participants could also indicate that they did not see a number, and this response was coded as incorrect.
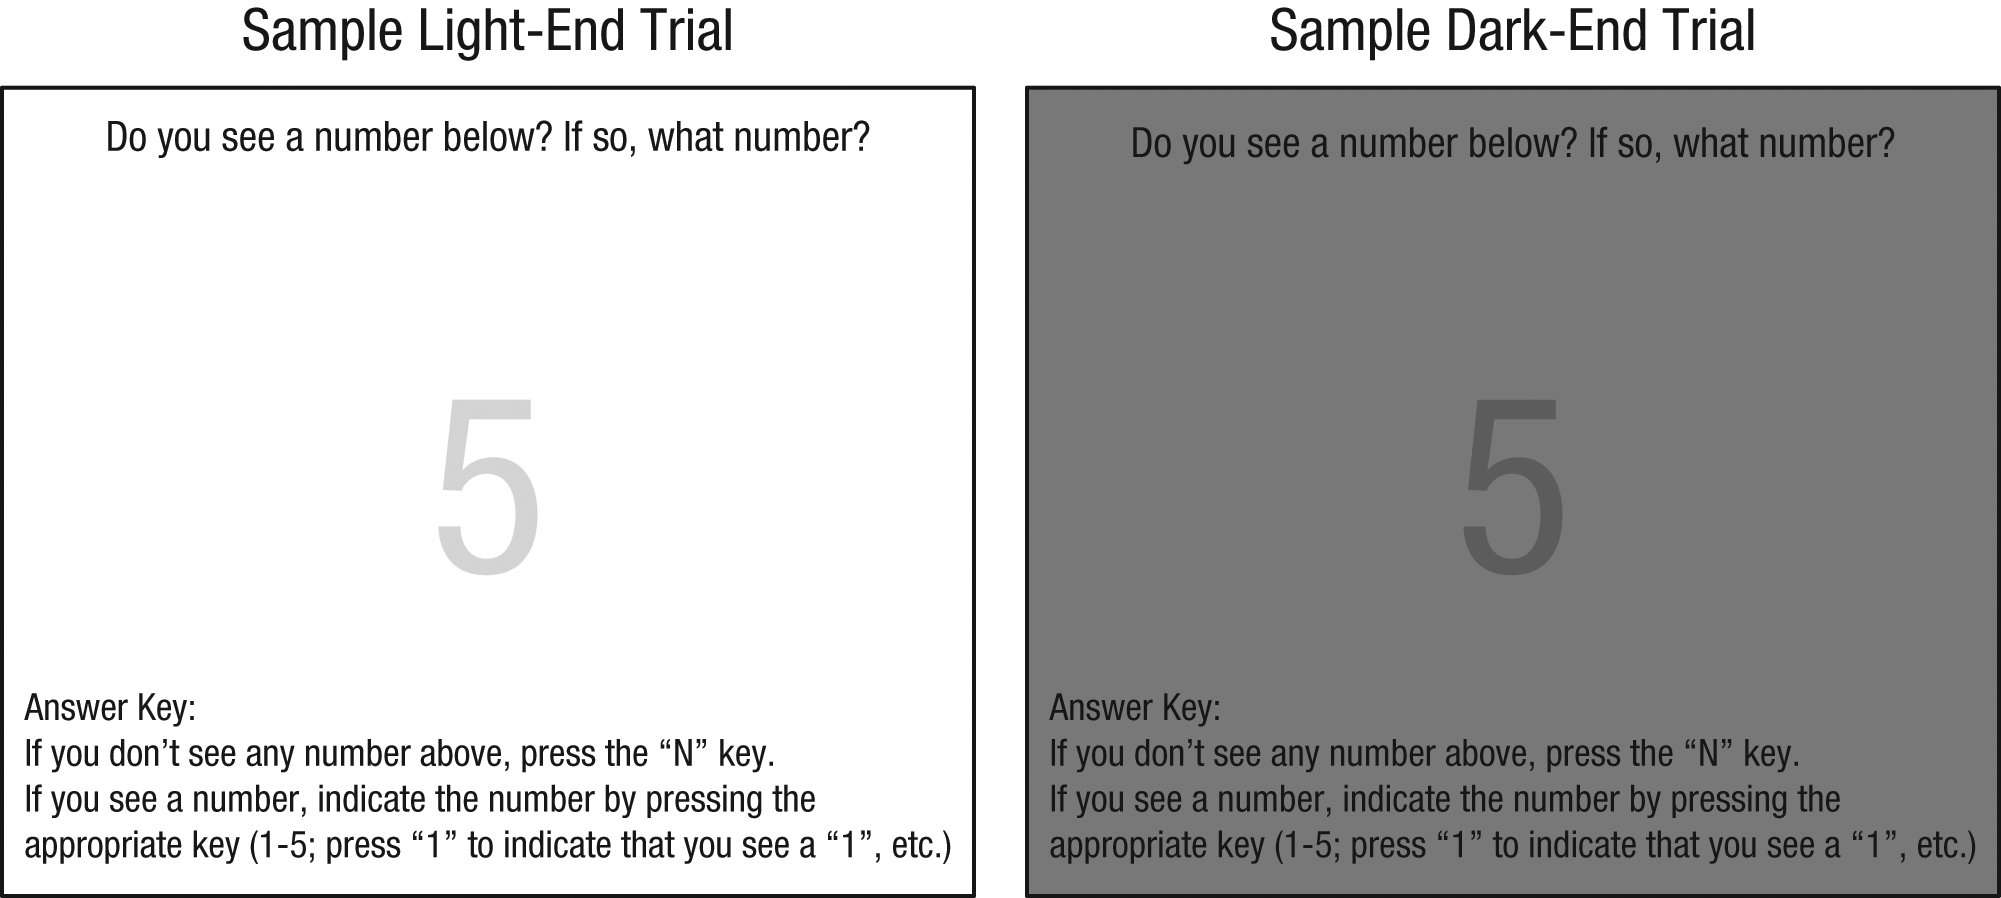
Sample perceptual trials in Study 2. For illustrative purposes, the contrast between the background and stimulus has been exaggerated in this figure (i.e., the actual stimuli were fainter).
Results and discussion
As in Study 1, there was a significant effect of end of spectrum on accuracy, b = 0.73, SE = 0.05, t(7062) = 15.51, p < .001, OR = 2.07, as well as an End of Spectrum × Trait Disgust interaction, b = −0.34, SE = 0.06, t(7062) = −5.83, p < .001, OR = 0.71 (see Fig. 2a). As in Study 1, greater disgust sensitivity was associated with better performance on light-end trials relative to performance on dark-end trials, and the effect was driven by improvements in light-end performance: Trait disgust significantly predicted light-end accuracy, b = 0.64, SE = 0.21, t(48) = 2.29, p < .05, OR = 1.91, but not dark-end accuracy, b = −0.03, SE = 0.29, t(48) = −0.10, p = .92, OR = 0.97. Trait fear was unrelated to perceptual accuracy (ts < 1).
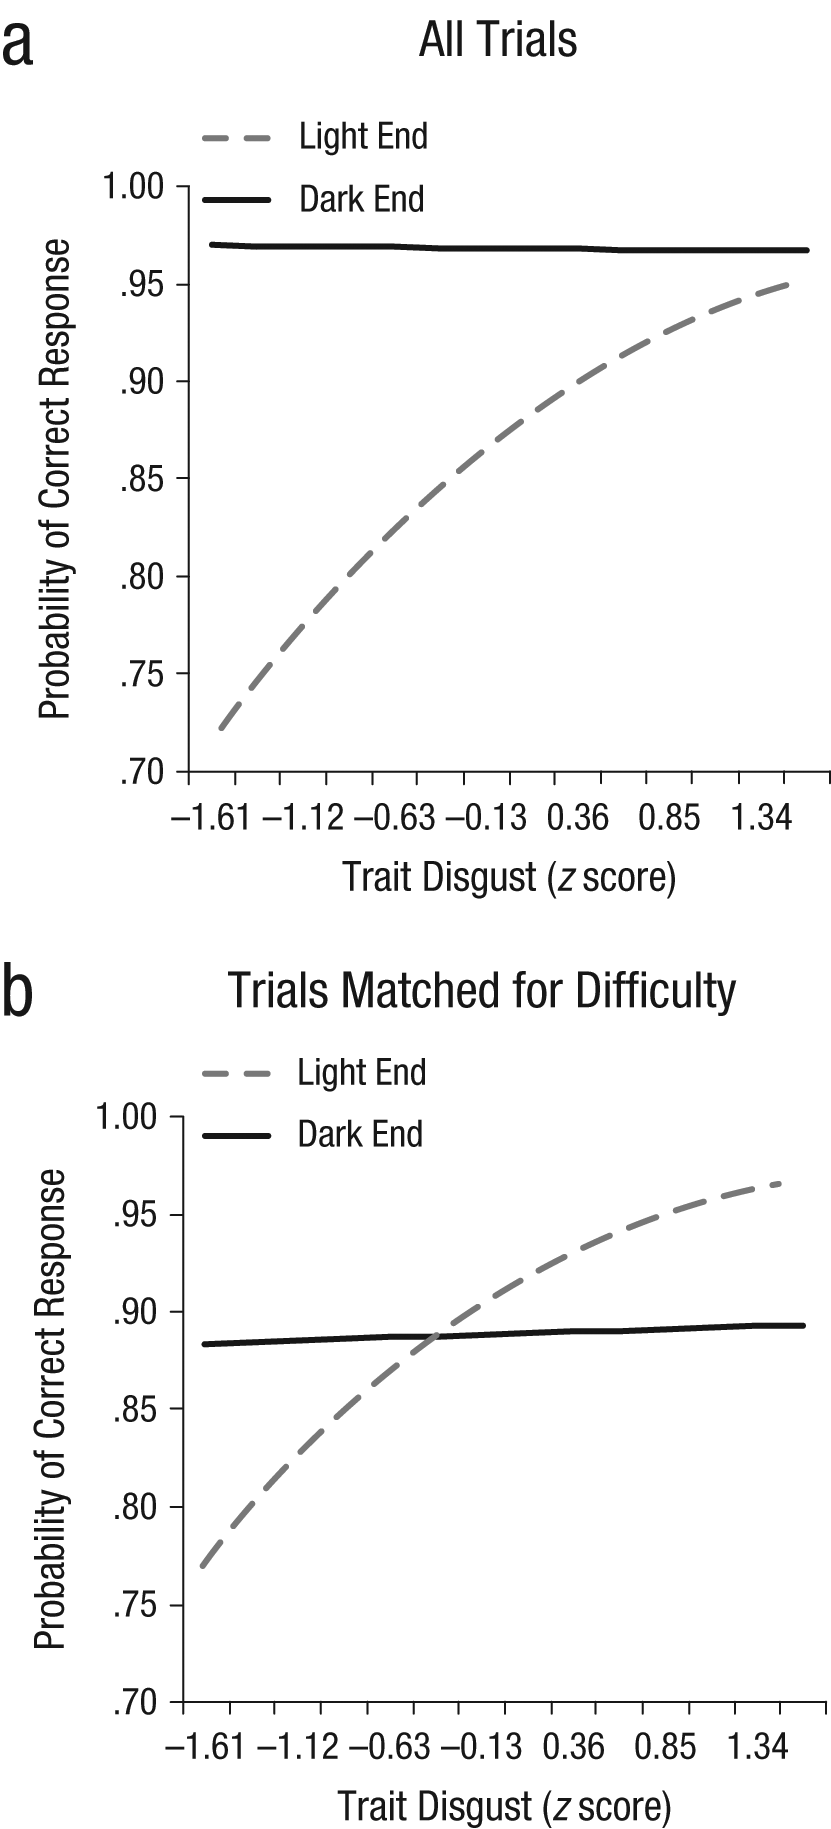
The interaction between end of spectrum and trait disgust in predicting perceptual accuracy in Study 2: (a) results for all trials and (b) results for selected trials that were matched for equivalent overall difficulty.
This selective relationship between trait disgust and accuracy at the light end could be an artifact of differential difficulty: If dark-end performance is near the ceiling, there may be minimal variability to relate to trait variables. We were able to test this explanation because the light-end trials with targets two shades darker than the background and the dark-end trials with targets one shade darker than the background were similarly difficult (i.e., accuracy rates were 83.5% and 82.7%, respectively). Conducting an analysis restricted to these trials revealed the same End of Spectrum × Trait Disgust interaction that we observed across all trials (see Fig. 2b), b = −0.33, SE = 0.09, t(2311), p < .001, OR = 0.72. Again, trait disgust significantly predicted light-end accuracy, b = 0.69, SE = 0.29, t(48) = 2.38, p < .05, OR = 2.00, but not dark-end accuracy, b = 0.03, SE = 0.28, t(48) = 0.11, p = .91, OR = 1.03. Thus, the effect held even under conditions of equivalent difficulty.
Study 3
In Study 3, disgust and fear were elicited prior to the perceptual task by presenting a slide show of emotional images. We predicted that viewing disgusting images would selectively enhance subsequent detection of a faint stimulus against a white background, whereas viewing fear-inducing images would have no such effect, would selectively enhance detection of a faint stimulus against a black background, or would have a global performance-enhancing effect (consistent with the results of Phelps et al., 2006). To increase the generalizability of our findings, we used a different measure of trait fear than in Studies 1 and 2 and an additional measure of trait disgust. We also used different dark-end trials (detecting a faint stimulus against a black background) than we used in the other two studies.
Method
Participants
Forty-four University of Virginia undergraduates (24 female and 20 male) with normal or corrected-to- normal vision participated for partial course credit.
Materials and procedure
For Study 3, we created stimuli for two emotion-induction conditions and two control conditions. For the emotion-induction conditions, six disgust images (e.g., cockroaches, trash) and six fear images (e.g., a handgun, an angry face) were selected from the International Affective Picture System (Lang, Bradley, & Cuthbert, 1999). These fear and disgust images were matched (ts < 1) in valence, arousal, and luminosity (mean and median luminosity values for each image were obtained using Adobe Photoshop). A separate control condition for each emotion-induction condition was created by taking the same six disgust images and six fear images and scrambling and inverting them (i.e., turning them upside down). Including these scrambled images allowed us to rule out the possibility that low-level image features (e.g., color) could be responsible for any effects.
In the perceptual task, participants completed both light-end trials and dark-end trials. The dark-end trials featured a single digit against a black background. Pretesting revealed that making the digit only one or two shades lighter than black made the task too difficult (performance was at chance level). To ensure equivalent difficulty between the dark-end trials and the light-end trials, we made the digit five or six shades lighter than black. Light-end trials featured a single digit against a white background, and the digit was either one or two shades darker than white. This design was successful in creating similar task difficulty: Average performance was nearly identical on light-end trials (M = 70.93% correct) and dark-end trials (M = 70.75% correct). As in Study 2, participants indicated the digit they saw (1, 2, 3, 4, or 5) by pressing the appropriate key (“1,” “2,” “3,” “4,” or “5”), and responses were coded as correct or incorrect. In Study 2, when participants could not see a number, they could indicate that they did not see it (a response that was coded as incorrect) or they could guess one of the five numbers, which would give them a 20% chance of picking the right number. That design gave a performance advantage to participants who guessed. In Study 3, we removed this advantage by forcing participants to pick a number even if they could not see one.
Participants performed four experimental blocks (one for each condition) in random order. Each block consisted of three parts: (a) a slide show that presented the images for that condition (disgust, fear, disgust control, or fear control) for 5 s each, (b) two subblocks of perceptual trials (a subblock of 16 light-end trials and a subblock of 16 dark-end trials, in random order), and (c) a manipulation check. For the manipulation check, participants rated how much they had felt disgusted, grossed out, repulsed, afraid, worried, and fearful (1 = not at all, 7 = extremely) while viewing the slide show. The first three ratings were averaged to form a state-disgust composite (α = .95), and the second three ratings were averaged to form a state-fear composite (α = .97).
In addition to completing the DS-R (α = .86), participants completed the Three Domain Disgust Scale (Tybur, Lieberman, & Griskevicius, 2009). They indicated how disgusting (0 = not at all disgusting, 6 = extremely disgusting) they found concepts from each of three domains: pathogen disgust (e.g., “Sitting next to someone who has red sores on their arm”; α = .80), sexual disgust (e.g., “Hearing two strangers having sex”; α = .84), and moral disgust (e.g., “Forging someone’s signature on a legal document”; α = .93). 3 Participants also completed an abbreviated version of the Fear Survey Schedule-II (Geer, 1965), which asks participants to indicate whether or how much they fear 51 stimuli (1 = none, 7 = terror). From these items, we selected 10 that threaten bodily harm and intentionally avoided items related to social anxiety (e.g., being criticized) and disgust (e.g., worms, hypodermic needle). The 10 items (α = .76) were sharp objects, heights, strange dogs, thunderstorms, snakes, dark places, stinging insects, being in an auto accident, suffocating, and deep water.
Results and discussion
The emotion induction was successful: The disgusting images induced more disgust (M = 4.09, SD = 1.57) than fear (M = 2.07, SD = 1.29), t(43) = 10.65, p < .001, d = 1.41, whereas the fear-inducing images induced more fear (M = 2.78, SD = 1.41) than disgust (M = 1.93, SD = 1.13), t(43) = 5.21, p < .001, d = 0.67.
In analyses of the accuracy of performance, the effect of the emotion-induction and control conditions was entered as a Level 1 predictor and was tested using two dummy-coded variables, one testing the effect of the disgust induction (trial type: disgust = 1, disgust control = −1, fear = 0, fear control = 0) and one testing the effect of the fear induction (trial type: disgust = 0, disgust control = 0, fear = 1, fear control = −1). Trait disgust (DS-R score) and trait fear were converted to z scores and entered as Level 2 predictors. There was no main effect of end of spectrum (t < 1): Light-end trials and dark-end trials were equally difficult. Consistent with the results of Phelps et al. (2006), our results showed that the fear induction had a significant main effect on performance, increasing overall accuracy, b = 0.11, SE = 0.05, t(5573) = 2.32, p = .02, OR = 1.12. This effect was not moderated by end of spectrum (t < 1).
As in Studies 1 and 2, greater trait disgust predicted better performance on light-end trials relative to performance on dark-end trials (i.e., the End of Spectrum × Trait Disgust interaction), b = −0.09, SE = 0.04, t(5573) = −2.27, p = .02, OR = 0.91. There was also a significant Disgust Condition × Trait Disgust interaction, b = 0.17, SE = 0.06, t(5573) = 2.76, p = .006, OR = 1.18, which was qualified by a significant Disgust Condition × End of Spectrum × Trait Disgust interaction, b = −0.13, SE = 0.06, t(5573) = −2.16, p = .03, OR = 0.88. Testing the simple effect of the disgust induction on performance at high and low levels of trait disgust (±1 SD) for the light-end trials and dark-end trials separately revealed that for participants low on trait disgust, viewing disgusting images had no effect on performance at either end of the spectrum (ts < 1.16). In contrast, for highly disgust-sensitive individuals, viewing disgusting images did not affect performance on dark-end trials (t < 1), but significantly enhanced performance on light-end trials, b = 0.44, SE = 0.10, t(5573) = 4.21, p < .001, OR = 1.55 (see Fig. 3).

Effect of disgust condition (viewing disgusting images vs. viewing control images) on perceptual accuracy on light-end trials and dark-end trials in Study 3. The graph on the left shows the results for participants with low disgust sensitivity (1 SD below the mean); the graph on the right shows results for participants with high disgust sensitivity (1 SD above the mean).
This critical three-way interaction still emerged when we replaced participants’ DS-R scores with their pathogen-disgust scores, b = −0.09, SE = 0.05, t(5573) = −1.89, p = .06, OR = 0.91, or sexual-disgust scores, b = −0.13, SE = 0.05, t(5573) = −2.53, p < .05, OR = 0.88, but not their moral-disgust scores (t < 1). Thus, the effect of trait disgust on performance generalized to other measures of physical disgust but not to moral disgust.
The pattern of state-disgust ratings may help explain why the effect of the disgust induction on performance depended on trait disgust. The manipulation’s effectiveness (how much more disgusted each participant was by the disgust images than by the disgust-control images) was positively correlated with trait disgust (r = .44, p < .001); in other words, the disgust-inducing power of the images increased with increasing disgust sensitivity. The disgust manipulation may have failed to alter perception for individuals with low levels of disgust sensitivity because it may have been too weak to induce sufficient disgust among these individuals. This interpretation is consistent with the lack of priming effects in Studies 1 and 2. Apparently, disgust must be induced (and induced fairly strongly) for perception to be altered.
General Discussion
We hypothesized that disgust shifts perceptual sensitivities, facilitating one’s ability to make subtle distinctions among very light shades. The results of two different perceptual tasks—discriminating among patches of gray (Study 1) and detecting a faint stimulus against a background (Studies 2 and 3)—support this hypothesis. Greater disgust sensitivity predicted a greater ability to detect subtle differences in very light shades. Additionally, exposing disgust-sensitive individuals to disgusting stimuli enhanced their ability to detect a faint stimulus on a white background.
The very specific perceptual sensitivity that disgust-sensitive individuals displayed may reflect experience-dependent perceptual tuning. If disgust-sensitive individuals construct white spaces to advance purity-related goals, then their perception may be tuned to this commonly experienced range of the visual spectrum. Conversely, it is possible that their perceptual sensitivity may predispose them to high levels of disgust sensitivity. Individuals who can perceive faint stimuli against a white background will see offensive stimuli that are invisible to others (e.g., a faint speck of dirt on a white toilet), and therefore experience disgust more frequently. Because disgust heightens sensitivity to deviations from white, this would create a feedback loop in which each episode of disgust potentiates future episodes. Consequently, individuals who are the most sensitive to the perception-altering effects of disgust would be the most likely to become highly disgust sensitive.
Disgust may tune perception to the light end of the spectrum to the extent that white is considered relevant to purity. If that is the case, then the effect may be flexible, with disgust tuning perception to whatever aspect of perception is deemed relevant to the goal of preserving purity. Although “white = pure” may be a particularly easy, likely, or natural association to form (Sherman & Clore, 2009), it may not be obligatory or invariant.
The processes of the anterior insula—a brain area commonly involved in the experience and processing of disgust (Chen et al., 2009; Heining et al., 2003; Jabbi, Bastiaansen, & Keysers, 2008)—may be important to the perception-altering effects of disgust. The anterior insula plays a role in the representation of bodily states (Craig, 2003) and is centrally involved in perception. In their review, Sterzer and Kleinschmidt (2010) suggested that it “mediates states of heightened sensory alertness via feedback connections to sensory cortices. This mechanism renders the individual more sensitive to any kind of sensory information in situations that pose potential or actual challenges to homeostasis” (p. 620). Similarly, researchers have argued that the anterior insula is the central hub of a “salience network” that prioritizes and anticipates particularly relevant stimuli (Menon & Uddin, 2010; Seeley et al., 2007; Taylor, Seminowicz, & Davis, 2009). Threat cues, for example, lower the threshold for perceiving ambiguous stimulation as painful, an effect mediated by anterior insula activity (Wiech et al., 2010). Wiech et al. (2010) argued that the anterior insula integrates information concerning stimulus salience and updates perceptual thresholds to help ensure “that harmful stimuli are reliably detected” (p. 16328). If disgust cues foreshadow potential contact with harmful material, insula activation may reflect anticipatory shifts in perception, such as increased sensitivity to certain disgust-relevant ranges of sensory input.
Research on the experience-altering nature of emotion has typically focused on nonperceptual experience, such as changes in cognitive appraisals (e.g., Lerner & Keltner, 2001). It is clear, however, that these influences extend to perception. Anger, for example, leads one to perceive ambiguous color stimuli as red, an effect consistent with the metaphor of anger as “seeing red” (Fetterman, Robinson, Gordon, & Elliot, 2011). Similarly, many phobias are associated with altered perception. Spiders seem faster to spider-phobic individuals than they do to nonphobic individuals (Riskind, Moore, & Bowley, 1995). The distance down from a ledge seems greater to someone afraid of heights than it does to someone who is not afraid of heights (Teachman, Stefanucci, Clerkin, Cody, & Proffitt, 2008). The findings reported here indicate that disgust has a similar effect on perception. Disgust not only makes people want to avoid impurities, but also makes people better able to see them.
Footnotes
Acknowledgements
This research was conducted as part of Gary D. Sherman’s dissertation. We thank Michael Kubovy and Dennis Proffitt for their feedback.
Declaration of Conflicting Interests
The authors declared that they had no conflicts of interest with respect to their authorship or the publication of this article.