
Abstract
In this article, we present the results of an 11-month longitudinal study (beginning when children were 6 years old) focusing on measures of the approximate number sense (ANS) and knowledge of the Arabic numeral system as possible influences on the development of arithmetic skills. Multiple measures of symbolic and nonsymbolic magnitude judgment were shown to define a unitary factor that appears to index the efficiency of an ANS system, which is a strong longitudinal correlate of arithmetic skills. However, path models revealed that knowledge of Arabic numerals at 6 years was a powerful longitudinal predictor of the growth in arithmetic skills, whereas variations in magnitude-comparison ability played no additional role in predicting variations in arithmetic skills. These results suggest that verbal processes concerned with learning the labels for Arabic numerals, and the ability to translate between Arabic numerals and verbal codes, place critical constraints on arithmetic development.
Keywords
The mastery of basic arithmetic skills is a key goal of early education, but so far researchers’ understanding of the cognitive factors underlying arithmetic development is arguably limited. In this article, we report a large-scale longitudinal study in which we explored the cognitive bases of early arithmetic development.
One dominant theory is that the development of arithmetic skills depends on the integrity of an innate approximate number sense (ANS; Dehaene, 1992). The precision of coding within the ANS is typically assessed by subjects’ accuracy and speed at discriminating the numerosity of groups of objects (Barth, Kanwisher, & Spelke, 2003; Piazza et al., 2010). Such discriminations can be made more quickly than is possible by counting and vary in difficulty in proportion to the ratio between the numerosities. These findings provide evidence for the operation of an “approximate” number sense that is not based on counting. The precision of ANS coding increases with age: Six-month-old infants can distinguish 8 from 16 objects but not 8 from 12 objects (Xu & Spelke, 2000), whereas most adults can distinguish 9 from 10 objects without counting (Halberda & Feigenson, 2008).
It has been suggested that the ANS provides the foundation for the later development of abstract, symbolic number concepts, which in turn underpin the development of arithmetic skills (e.g., Piazza & Dehaene, 2004). If this is the case, variations in the precision of coding within the ANS should be related to individual differences in arithmetic skills in children. However, De Smedt, Noël, Gilmore, and Ansari (2013) reviewed existing studies and concluded that evidence for such a relationship was lacking (seven studies with children found such a relationship, whereas 11 did not). Furthermore, the majority of studies assessed concurrent correlations, which may reflect the fact that learning arithmetic leads to improvements in the precision of coding in the ANS (Halberda, Mazzocco, & Feigenson, 2008). For example, Piazza, Pica, Izard, Spelke, and Dehaene (2013) found that the precision of coding in the ANS was greater in participants who had received formal education compared with those who had not.
Crucially, evidence from longitudinal studies is needed to assess whether variations in the precision of coding in the ANS are predictive of later arithmetic skills. The few longitudinal studies to date have generated mixed results. Mazzocco, Feigenson, and Halberda (2011) found a strong relationship between accuracy on a numerosity-discrimination task (at age 4 years, 2 months) and performance on a standardized measure of arithmetic 2.5 years later. However, the sample here was very small (N = 17), and numerosity discrimination was the only measure taken at preschool, so it is impossible to assess the specificity of this relationship.
Libertus, Feigenson, and Halberda (2013) reported that accuracy (r = .44) and reaction time (r = −.28) on a numerosity-discrimination task (at 4 years, 2 months) correlated with scores on an arithmetic test 8 months later. However, using directly comparable measures in the same age group, Fuhs and McNeil (2013) found a nonsignificant concurrent correlation between numerosity-discrimination and arithmetic scores (r = .19). Two other longitudinal studies, with slightly older children, found weak relationships between the ANS and arithmetic skills. Desoete, Ceulemans, De Weerdt, and Pieters (2012) found a weak but significant correlation (r = .16; N = 395) between nonsymbolic numerosity discrimination in kindergarten and calculation scores 1 year later, and Sasanguie, Göbel, Moll, Smets, and Reynvoet (2012) found a correlation of similar magnitude (r = .17).
Evidence for the ANS playing a role in early arithmetic development is clearly mixed, and a major aim of the current study was to clarify its role. Whatever the role of the ANS in arithmetic development, it is also clear that learning the symbol set (the Arabic numeral system) is likely to be a major influence on early arithmetic development (e.g., Krajewski & Schneider, 2009; Purpura, Baroody, & Lonigan, 2013). Accordingly, we assessed children’s knowledge of Arabic numerals (by testing their ability to match numerals to their spoken form) as well as their ability to make speeded number comparisons with Arabic digits. Individual differences in judging the magnitudes represented by Arabic digits (symbolic number-comparison skills) are concurrent correlates of arithmetic but not reading skills (Bugden & Ansari, 2011; Holloway & Ansari, 2009; Sasanguie et al., 2012). Several studies have also shown significant longitudinal relationships between symbolic magnitude-comparison skill assessed in kindergarten or Grade 1 and later arithmetic skills (see De Smedt et al., 2013, for a review). A critical question that we addressed here is how nonsymbolic (numerosity) and symbolic (digit magnitude) judgment tasks relate to each other and how they function as longitudinal predictors of arithmetic development. By using multiple measures of both nonsymbolic (dots) and symbolic (Arabic numeral) numerosity discrimination, we were able to assess the underlying structure of the ANS and how it relates longitudinally to the growth of arithmetic skills. In addition to assessing judgments of the comparative magnitude of digit pairs (e.g., “which is bigger: 3 or 5?”), we used a directly analogous task requiring judgments of the order of letters in the alphabet (e.g., “which letter comes later in the alphabet: c or e?”). The latter task required access to an ordered representation of symbols that was directly analogous to the digit-judgment task but did not require access to numerical or magnitude information.
The aim of the current study was to identify the longitudinal predictors of growth in arithmetic during a period (6 years, 3 months to 7 years, 2 months) when there is rapid development in basic arithmetic skills. Using multiple measures of magnitude comparison, combined with latent variable analyses, allowed us to assess the underlying factor structure of the constructs assessed and to maximize the reliability of the measurements. Our first major aim was to assess the factorial structure and reliability of measures of a hypothetical ANS system by investigating whether different measures of this construct cohere to define a unitary construct and whether it can be measured reliably. Our second aim was to identify possible predictors of growth in arithmetic and possible reciprocal relationships between the development of arithmetic and a hypothetical ANS system.
Method
Participants
All children in Year 1 in four United Kingdom (U.K.) primary schools (eight classes) were invited to take part in the study; 173 children (mean age = 6 years, 3 months; 97 boys, 76 girls) participated at Time 1, and 165 (93 boys, 72 girls) were retested at Time 2, approximately 11 months later.
Materials and procedure
All tests were administered as paper-and-pencil measures to whole class groups in a fixed order in sessions of 1 hr each (three sessions at Time 1; two sessions at Time 2). The measures reported here formed part of a larger test battery. At Time 1, nonverbal ability, vocabulary knowledge, number-identification skill, letter-comparison ability, magnitude-comparison ability, and arithmetic skill were assessed (and the latter two skills were reassessed at Time 2).
Nonverbal ability
To assess general cognitive ability, we administered sets A, B, and C of Raven’s Standard Progressive Matrices (SPM) Plus (Raven, Raven, & Court, 1998). Children were given an incomplete matrix and asked to choose the object that completed it. The first two items were practice items. One point was given per correct response (maximum score = 34).
Vocabulary knowledge
To assess vocabulary knowledge, we administered 36 items taken from sets five to seven of the third edition of the British Picture Vocabulary Scale (BPVS III; Dunn, Dunn, & Styles, 2009). The pictures were shown to the class using an electronic whiteboard. Children indicated in their printed answer booklet which of four pictures best matched a spoken target word. One point was given for each correct answer (maximum score = 36).
Number identification
A number identification task with eight items was constructed to assess children’s ability to identify one-, two-, and three-digit Arabic numerals. The experimenter said the target number aloud (e.g., “14”), and the children attempted to identify the corresponding Arabic numeral out of four or five presented response options on the answer sheet. The first item was a single-digit number (“6”) followed by 4 two-digit numbers (“14,” “28,” “52,” and “76”) and 3 three-digit numbers (“163,” “235,” and “427”). Distractors were chosen on the basis of visual similarity to the target number and common errors with place value (e.g., for the target number “163,” choices were 13, 10063, 136, 16, 163). One point was given per correct response (maximum score = 8).
Comparison tasks
All comparison tasks were presented in an 8.27-in. × 5.83-in. answer booklet. Six pairs of items were presented per page, with one pair on each row. Each comparison task started with an instruction page with an example. Children were told that they had to answer as many items as quickly as possible by ticking the larger item in a pair without leaving out any pairs until the experimenter said “stop.” They were allowed to turn to the test pages only once the experimenter said “go.” After 30 s, children were stopped, and the next comparison task was presented. One point was given per correct response. These measures therefore yield an estimate of efficiency (the number of correct responses per unit of time).
Magnitude comparison
The digit-comparison tasks used the digits 1 to 9 (presented in Calibri font, size 48). Children were presented with two versions of the digit-comparison task: close and far. Pairs of digits in the close version had a numerical distance of either one or two; in the far version, the numerical distance between the digits in each pair was five, six, or seven. Each pair was matched on the total problem size of the two digits (i.e., the sum of the digits was equal) in the close and far versions of the task; for example, the pair (5:3) in the close version was replaced by the pair (7:1) in the far version (the numbers in both pairs sum to 8).
The nonsymbolic number-comparison tasks involved arrays of between 5 and 40 black squares arranged randomly within a 2.5-cm2 box on a white background. There were two versions of this task (same size and same surface area). In the same-size task, squares of the same size were used for each item pair, and the number of squares presented in each box ranged from 5 to 13. The close-comparison version (nonsymbolic same-size close) involved comparing two numerosities differing by one or two, whereas the far-comparison version (nonsymbolic same-size far) involved comparing numerosities differing by five, six, or seven. The sum of the digits in the two versions were matched; for example, the close-comparison item (10:8) was matched to the far-comparison item (12:6).
In the same-surface-area task, the number of squares presented ranged from 20 to 40, but in this case, the total surface area of the squares was matched in each item pair (to prevent discriminations being based on surface area rather than numerosity). The ratios between the numerosities were 3:4, 5:6, and 7:8, and each of these ratios was presented as a separate task. The numbers 20 through 30 were used as a baseline, and the nearest whole number at each ratio was calculated. For example, 20 was compared with 27 (3:4), 24 (5:6), and 23 (7:8).
Letter comparison
The letter-comparison task consisted of pairs of letters ranging from a to i (presented in Comic Sans MS font, size 48, lower case). Children had to tick which of the two letters comes later in the alphabet. Problems in the letter-comparison task were matched to those in the digit-comparison task (digit 1 was replaced with letter a, digit 2 with letter b, etc.). There were two versions of the letter-comparison task: Letter pairs in the close-letters version were either adjacent to each other in the alphabet (e.g., a, b) or just one letter apart (e.g., a, c); in the far-letters version, the letters were five, six, or seven letters apart (e.g., a, g).
Arithmetic
Arithmetic skill was assessed using the Numerical Operations subtest of the second U.K. edition of the Wechsler Individual Achievement Test (WIAT-IIUK; Wechsler, 2005) adapted for group use. This subtest begins with six items that simply involve identifying and writing Arabic numerals and counting dots. Because we wanted a measure of conventional arithmetic skill, for the present analyses, responses to these first six items were excluded. At Time 1, there were nine items that involved conventional arithmetical calculation (addition, subtraction, and multiplication problems). At Time 2, the same items were readministered together with three more difficult items. One point was awarded for each correct response (maximum score = 9 at Time 1 and 12 at Time 2). Children were guided through the first six items but were restricted to 15 min to complete the conventional arithmetical calculation problems.
Results
The means, standard deviations, and reliabilities for all measures at both time points are shown in Table 1. A number of features of the data from the digit-comparison and nonsymbolic magnitude-comparison tasks are worthy of comment. For the digit-comparison and dot-array-comparison tasks (nonsymbolic same-size far, nonsymbolic same-size close, 3:4 surface area, 5:6 surface area, and 7:8 surface area), there were clear distance effects, with children more efficiently comparing pairs of items that were numerically further apart than items that were numerically more similar. All pairwise comparisons between means in each task (nonsymbolic same-size far vs. nonsymbolic same-size close, 3:4 surface area vs. 5:6 surface area, 5:6 surface area vs. 7:8 surface area) showed highly reliable differences at both Time 1 and Time 2. This pattern—better performance on numerically more distant pairs together with rapid performance (average solution time of 1.36 s per item in the nonsymbolic same-size far task at Time 1)—provides evidence that the nonsymbolic comparison tasks are indeed tapping an ANS system and that children are not performing these tasks by counting.
Mean Score and Reliability for all Variables at Time 1 and Time 2

Note: Standard deviations are given in parentheses. BPVS III = British Picture Vocabulary Scale, third edition (Dunn, Dunn, & Styles, 2009); Raven’s SPM Plus = Raven’s Standard Progressive Matrices Plus (Raven, Raven, & Court, 1998).
Structural equation models of these data were estimated with Mplus Version 7 (Muthén & Muthén, 2013). Missing values were handled with robust full-information maximum-likelihood estimation. Figure 1 shows a latent-variable path model in which variations in arithmetic at Time 2 were predicted from all constructs measured at Time 1 (arithmetic, magnitude-comparison, letter-comparison, number-identification, and vocabulary skills; nonverbal abilities; and age). In this model, all seven nonsymbolic and symbolic numerical magnitude-judgment tasks load on a single latent magnitude-comparison factor, whereas the two letter-judgment tasks load on a different factor. Preliminary analyses showed that this two-factor model for all comparison tasks fitted the data significantly better than a model equivalent to a one-factor solution in which the correlation between the magnitude-comparison and letter-comparison factors was fixed to 1, Satorra-Bentler χ2Δ(1) = 13.40, p = .001. Furthermore, when considering the symbolic (digit) and nonsymbolic magnitude-comparison tasks alone, there was no difference between the one-factor magnitude model and a nested model in which the symbolic and nonsymbolic comparison tasks loaded on one factor each, Satorra-Bentler χ2Δ(1) = 0.073, p = .787.

Arithmetic ability at Time 2 (T2) predicted by all constructs measured at Time 1 (T1). Ellipses reflect latent variables, and rectangles reflect observed variables. Values on one-headed arrows from the latent to the observed variables reflect factor loadings in the measurement model, and values associated with one-headed arrows between the latent variables reflect true-score regressions between constructs. The one-headed arrow from the number into the latent variable reflects the residual of the construct. All predictor variables were correlated (see Table 2), but for clarity these correlations are not shown in the diagram. Solid lines indicate statistically significant relationships, and dashed lines indicate statistically nonsignificant relationships. For magnitude comparison, performance was measured on tasks in which digits were close (digits close) and far (digits far) from each other, same-size squares were close in number (NSC-SS) and far in number (NSF-SS), and different ratios of squares with the same surface area were presented (3:4 SA, 5:6 SA, and 7:8 SA). For letter comparison, performance was measured for letters that were close (letters close) and far (letters far) from each other in the alphabet. Asterisks indicate significant paths (*p < .05, **p < .01). BPVS = British Picture Vocabulary Scale, third edition (Dunn, Dunn, & Styles, 2009); Raven = Raven’s Standard Progressive Matrices Plus (Raven, Raven, & Court, 1998); WIAT = Wechsler Individual Achievement Test, second U.K. edition (Wechsler, 2005); ID = identification.
Because arithmetic, number-identification, vocabulary, and nonverbal ability were each assessed by only one indicator (WIAT-IIUK, number identification, BPVS III, and Raven’s SPM Plus, respectively), to avoid distortions caused by measurement error, we prespecified the error variance for these measures based on their reliabilities. The model fitted the data very well, χ2(68) = 95.12, p = .017, root-mean-square error of approximation (RSMEA) = .048 (90% CI = [.021, .070]), comparative fit index (CFI) = .971, standardized root mean residual (SRMR) = .040, which confirms that the factor structure specified in the measurement model for the Time 1 measures was satisfactory. This model shows that there were two unique predictors of individual differences in arithmetic skill at Time 2: arithmetic ability at Time 1 and number-identification skill. Overall, the model explained 86% of the variance in arithmetic ability.
The pattern of correlations between the latent variables in the model was highly informative (see Table 2). First, our measure of the ANS (magnitude comparison) at Time 1 was a strong longitudinal correlate of arithmetic skill at Time 2. In fact, the bivariate longitudinal correlation between magnitude-comparison and arithmetic skills here was stronger (r = .60) than in previous longitudinal studies (in which correlations ranged between .16 and .44; see the description of these studies in the introduction). The strength of this correlation likely reflects the fact that it is based on the true-score variance in these constructs. However, the equivalent measure involving letter-comparison skill at Time 1 has an identical longitudinal correlation with arithmetic skill at Time 2. Although the magnitude- and letter-comparison tasks have identical requirements, the letter-comparison task clearly does not require access to numerical magnitudes, and as the analyses presented earlier confirm, the letter- and magnitude-judgment measures define separable factors. This finding therefore clearly raises the question of whether magnitude comparison plays any specific role in explaining individual differences in arithmetic skill in this age range. Finally, the strongest longitudinal correlate of arithmetic skill at Time 2 was the number-identification task. In summary, these correlations, and the model in Figure 1, show that an ANS construct can be defined and measured with high reliability but that it does not predict unique variance in the growth of arithmetic skills after other related measures are taken into consideration.
Correlations Between the Latent Variables in the Models Predicting Arithmetic Ability (Above the Diagonal) and Magnitude-Comparison Ability (Below the Diagonal)
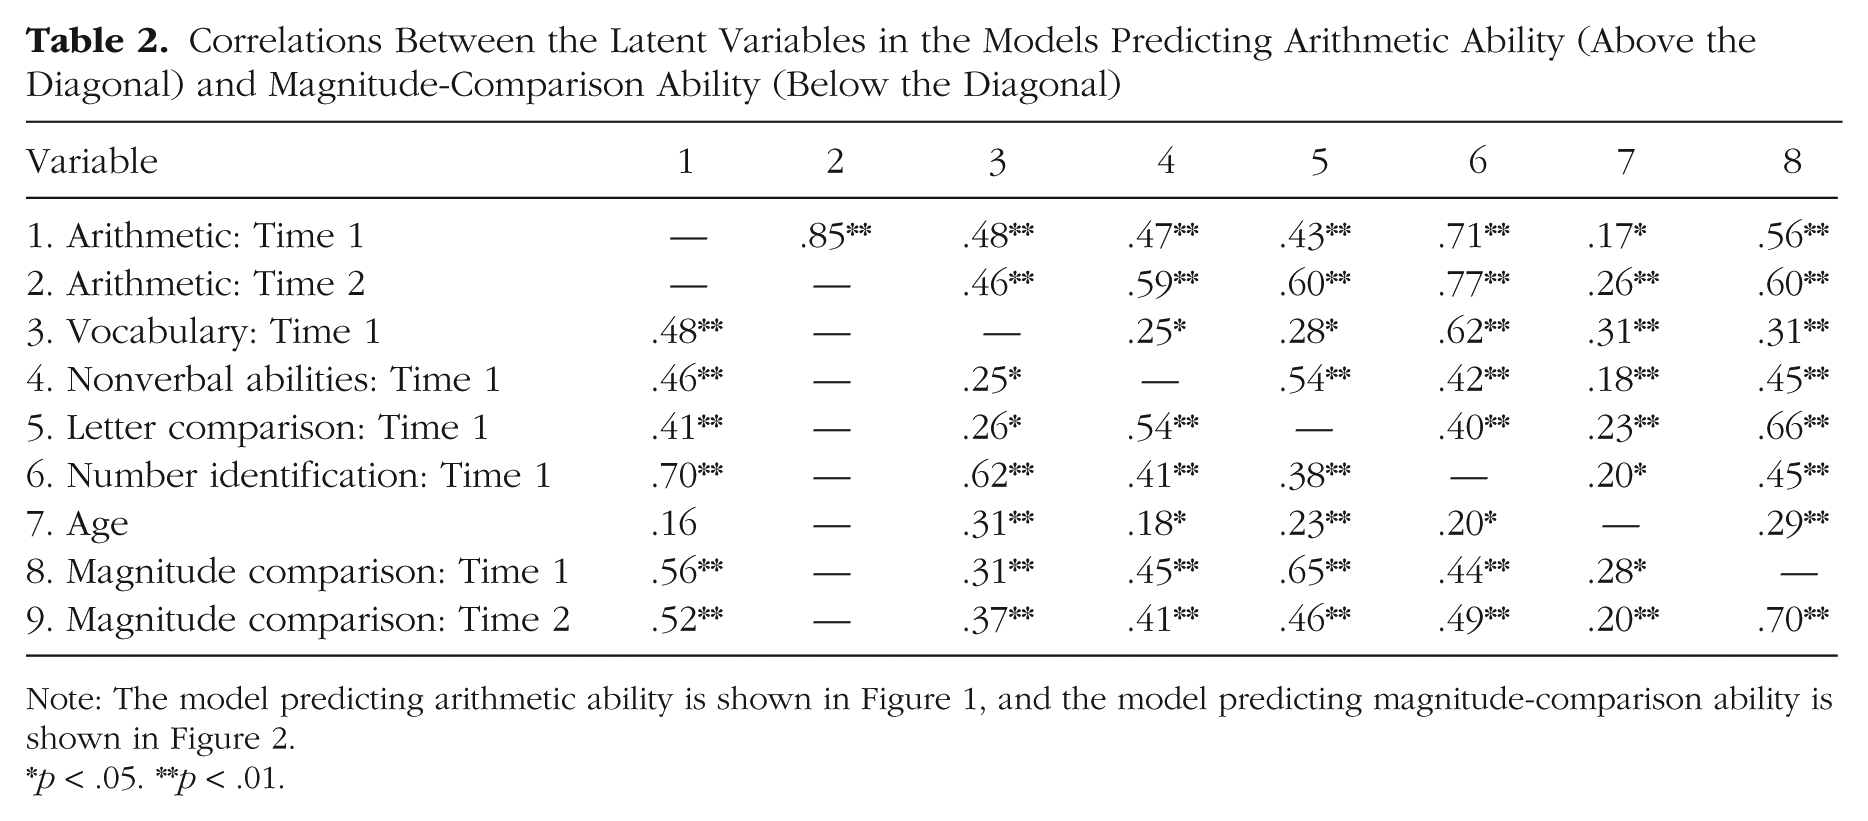
Note: The model predicting arithmetic ability is shown in Figure 1, and the model predicting magnitude-comparison ability is shown in Figure 2.
p < .05. **p < .01.
The correlations in Table 2 show a high degree of shared variance between arithmetic, letter-comparison, magnitude-comparison, and number-identification ability at Time 1 as predictors of arithmetic skill at Time 2. To address this issue, and to explore the relative contributions of these variables in more detail, we used Cholesky factoring (equivalent to hierarchical regression with latent variables) to estimate the unique variance in arithmetic at Time 2 accounted for by the three theoretically important constructs (magnitude-comparison, letter-comparison, and number-identification ability). The critical issue here was the amount of variance accounted for in arithmetic skills at Time 2 after the effects of the control variables (earlier arithmetic skills, age, nonverbal abilities, and vocabulary skills) had been accounted for. Table 3 shows the results of these analyses.
Results From the Cholesky Model Predicting Arithmetic Ability at Time 2

Note: R2 = .855, p < .01. All values are squared beta coefficients. BPVS III = British Picture Vocabulary Scale, third edition (Dunn, Dunn, & Styles, 2009); Raven’s SPM Plus = Raven’s Standard Progressive Matrices Plus (Raven, Raven, & Court, 1998).
p < .05. **p < .01.
Only letter-comparison and number-identification ability explained additional variance in arithmetic skills at Time 2 after the control variables had been entered into the equation (letter-comparison ability = 3.2% and number identification ability = 4.5%). Critically, magnitude-comparison ability was not a unique predictor of arithmetic skill at Time 2 (and, in fact, it was a poorer predictor of later arithmetic skills than the letter-judgment task, which involved no access to numerical information). Only number-identification ability was a unique predictor of arithmetic skill at Time 2 (accounting for 4% of the unique variance after all other predictors in the model were entered).
In a further model (Fig. 2), we assessed whether earlier variations in arithmetic skills and other theoretically relevant variables explained variations in magnitude-comparison ability at Time 2. The data fitted the model well, χ2(163) = 220.59, p = .002, RSMEA = .045 (90% CI = [.028, .060]), CFI = .962, SRMR = .045. It is clear that only earlier magnitude-comparison skills (the autoregressor) predicted later magnitude-comparison skills. Fifty-four percent of the variance in magnitude-comparison skill at Time 2 was explained in this model. These results were confirmed and extended by the results of the Cholesky models shown in Table 4: None of the predictor constructs explained variance in later magnitude-comparison skills beyond earlier magnitude-comparison skills. Thus, there is no evidence of an influence of earlier arithmetic skills on the development of later magnitude-comparison skills. The correlations between all latent variables in this model are shown in Table 2.

Magnitude-comparison ability at Time 2 (T2) predicted by all constructs measured at Time 1 (T1). Ellipses reflect latent variables, and rectangles reflect observed variables. Values on one-headed arrows from the latent to the observed variables reflect factor loadings in the measurement model, and values associated with one-headed arrows between the latent variables reflect true-score regressions between constructs. The one-headed arrow from the number into the latent variable reflects the residual of the construct. All predictor variables were correlated (see Table 2), but for clarity these correlations are not shown in the diagram. Solid lines indicate statistically significant relationships, and dashed lines indicate statistically nonsignificant relationships. For magnitude comparison, performance was measured on tasks in which digits were close (digits close) and far (digits far) from each other, same-size squares were close (NSC-SS) and far (NSF-SS) in number, and different ratios of squares with the same surface area were presented (3:4 SA, 5:6 SA, and 7:8 SA). For letter comparison, performance was measured for letters that were close (letters close) and far (letters far) from each other in the alphabet. For arithmetic, we took every third item to make three item parcels to define the latent variable. Asterisks indicate significant paths (**p < .01). BPVS = British Picture Vocabulary Scale, third edition (Dunn, Dunn, & Styles, 2009); Raven = Raven’s Standard Progressive Matrices Plus (Raven, Raven, & Court, 1998); ID = identification.
Results From the Cholesky Model Predicting Number-Comparison Ability at Time 2
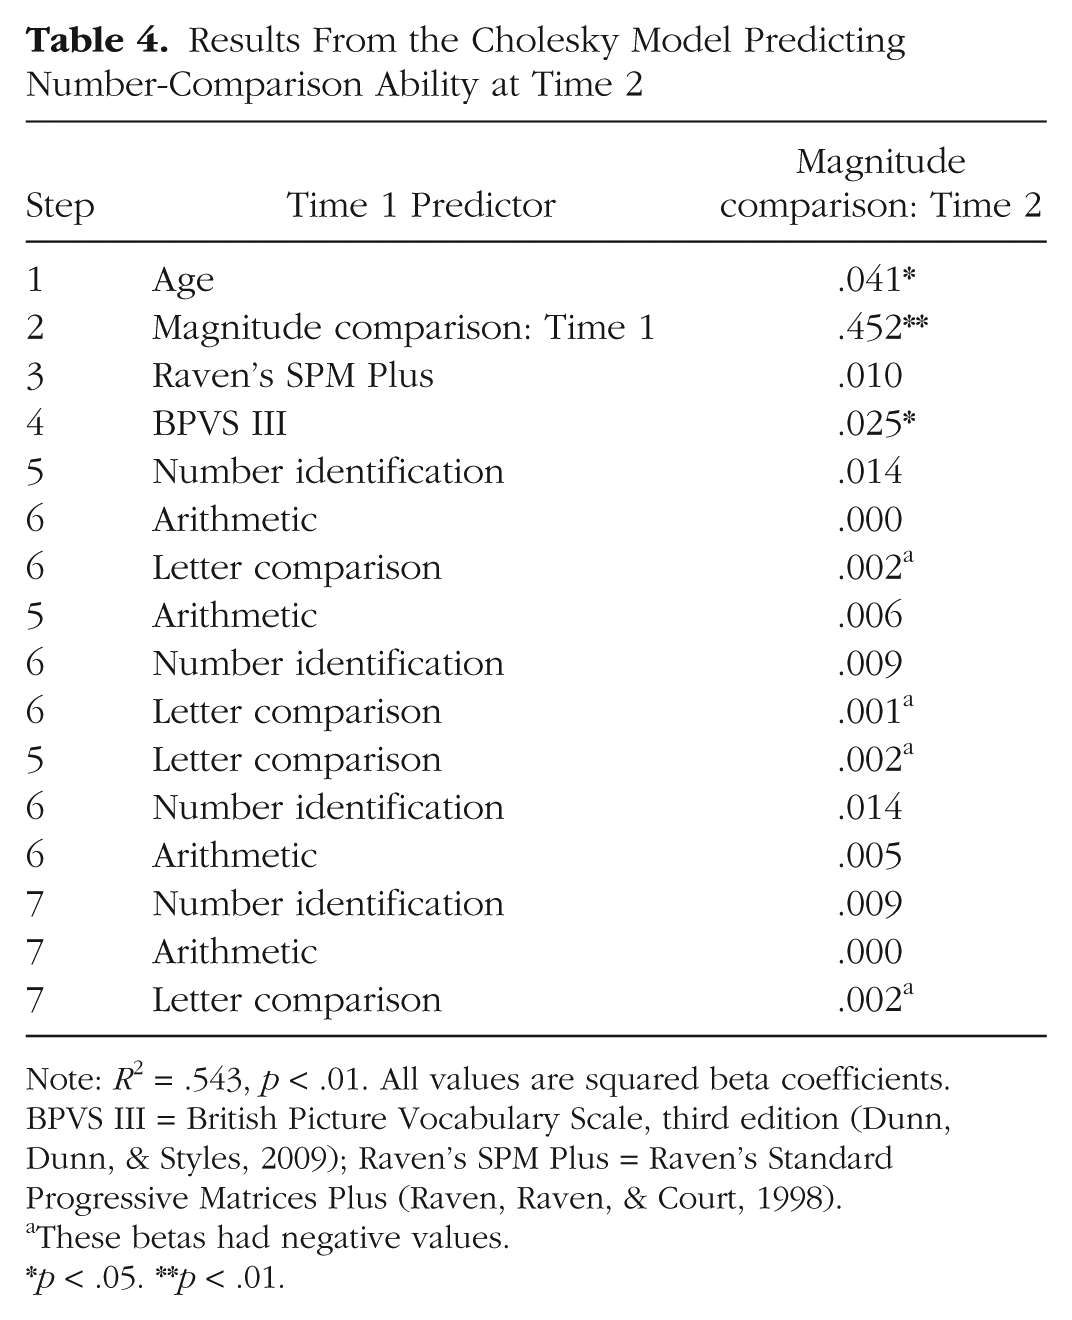
Note: R2 = .543, p < .01. All values are squared beta coefficients. BPVS III = British Picture Vocabulary Scale, third edition (Dunn, Dunn, & Styles, 2009); Raven’s SPM Plus = Raven’s Standard Progressive Matrices Plus (Raven, Raven, & Court, 1998).
These betas had negative values.
p < .05. **p < .01.
Discussion
In this large-scale longitudinal study, we explored some possible causal influences on the development of early arithmetic skills. Our particular focus was on the extent to which individual differences in the efficiency of an ANS system might constrain the development of arithmetic skills (Libertus, Feigenson, & Halberda, 2011; Libertus et al., 2013; Piazza & Dehaene, 2004). To assess the ANS construct, we used tasks that assessed the efficiency with which children could judge the relative numerosity of arrays of squares and the relative magnitudes represented by Arabic digits. The model shown in Figure 1 demonstrates clearly that these symbolic (numeral) and nonsymbolic (arrays of squares) magnitude-judgment tasks load onto a single factor (see also Kolkman, Kroesbergen, & Leseman, 2013). The speed with which children performed these tasks is incompatible with the use of counting strategies to solve them, and this fact, coupled with the correlations between these tasks, provides support for the engagement of a common numerical-comparison process (which is partially distinct from the processes involved in the directly comparable letter-comparison tasks).
Our second major finding is that the efficiency of the ANS at 6 years (indexed by our magnitude-comparison latent variable) is not a unique predictor of arithmetic skill some 11 months later (although our ANS measure shows a strong longitudinal correlation with later arithmetic skill). This calls into question the widely held belief (e.g., Piazza, 2010) that the ANS constrains the development of arithmetic skills (at least in the period of development studied here). An important question for future longitudinal studies is whether variations in the efficiency of the ANS as measured here would be an important longitudinal predictor of later arithmetic skills if assessed in younger children (say, 4-year-olds).
To our surprise, number-identification ability assessed at 6 years of age was a powerful independent predictor of growth in arithmetic skill over the next 11 months. In this task, children heard a spoken number and had to select the appropriate Arabic number from four or five options. This task measures at least two skills: Arabic-digit knowledge and place-value understanding. We speculate that Arabic-digit knowledge at school entry may be a key foundation for the development of later arithmetic skills (e.g., Kolkman et al., 2013; Krajewski & Schneider, 2009; Mundy & Gilmore, 2009). Such an effect might be seen as directly analogous to the role of early letter knowledge as a critical longitudinal predictor of reading development (e.g., Caravolas et al., 2012; Hulme, Bowyer-Crane, Carroll, Duff, & Snowling, 2012). In short, for both arithmetic and reading development, we suggest that learning the symbol set (Arabic numerals or letters, respectively) and their verbal labels is a critical foundational skill.
In addition to knowledge of single Arabic digits, an understanding of multidigit numbers, and especially place-value understanding, is also crucial for arithmetic development. Moeller, Pixner, Zuber, Kaufmann, and Nuerk (2011), for example, showed that place-value understanding in 7-year-old children predicted addition performance 2 years later. An understanding of place-value was also one component required for success on the number-identification task used in this study.
The precision of the ANS system appears to increase with age (Halberda & Feigenson, 2008), and it has been suggested that such age-related improvements may arise partly as a result of experience with formal arithmetic instruction (Piazza et al., 2013). To assess whether arithmetic skills play a role in refining the precision of the ANS, we assessed predictors of change in magnitude-comparison skills between Times 1 and 2 (see Fig. 2). There was no evidence that arithmetic skill at Time 1 predicted growth in the efficiency of magnitude-comparison skills. Further studies over more extensive periods of development are needed to examine this issue further.
In summary, our results clarify the much-debated role of the ANS in early arithmetic development. Although it appears that an ANS system underpins the ability of children to judge the magnitudes represented by both arrays of squares and digits, contrary to some other claims (e.g., Libertus et al., 2011, Piazza, 2010; Piazza & Dehaene, 2004), we found no evidence that this system places specific constraints on the development of arithmetic skills between the ages of 6 and 7 years. In contrast, the ability to match multidigit Arabic numerals to their verbal labels is a strong predictor of individual differences in the growth of arithmetic skill in this developmental period. This latter finding suggests that verbal processes concerned with learning the labels for Arabic numerals, and the ability to translate between Arabic numerals and verbal codes, are critical for arithmetic development.
Footnotes
Declaration of Conflicting Interests
The authors declared that they had no conflicts of interest with respect to their authorship or the publication of this article.
Funding
S. E. Watson was supported by a Biotechnology and Biological Sciences Research Council studentship.