
Abstract
A recent genome-wide-association study of educational attainment identified three single-nucleotide polymorphisms (SNPs) whose associations, despite their small effect sizes (each R2 ≈ 0.02%), reached genome-wide significance (p < 5 × 10⁻⁸) in a large discovery sample and were replicated in an independent sample (p < .05). The study also reported associations between educational attainment and indices of SNPs called “polygenic scores.” In three studies, we evaluated the robustness of these findings. Study 1 showed that the associations with all three SNPs were replicated in another large (N = 34,428) independent sample. We also found that the scores remained predictive (R2 ≈ 2%) in regressions with stringent controls for stratification (Study 2) and in new within-family analyses (Study 3). Our results show that large and therefore well-powered genome-wide-association studies can identify replicable genetic associations with behavioral traits. The small effect sizes of individual SNPs are likely to be a major contributing factor explaining the striking contrast between our results and the disappointing replication record of most candidate-gene studies.
Keywords
The discovery of genetic variants associated with behavioral traits could eventually be transformative for the social sciences, but the first step is identifying the specific genes associated with traits. In psychology, the standard approach for identifying such associations is the candidate-gene study. In a candidate-gene study, a small set of genetic variants (polymorphisms) are selected on the basis of their hypothesized or known biological function, and these polymorphisms are tested for association with a given trait. Most candidate-gene studies have been based on samples of several hundred participants and have applied a significance threshold of .05 (for a review, see Ebstein, Israel, Chew, Zhong, & Knafo, 2010).
Despite the fact that such studies continue to be published in prominent journals, the successful replication of published genetic associations with behavioral traits is the exception, not the rule (Benjamin et al., 2012; Hewitt, 2012). In fact, the situation is so alarming that the editor of the leading field journal Behavior Genetics recently issued an editorial policy on candidate-gene studies of behavioral traits that began, “The literature on candidate gene associations is full of reports that have not stood up to rigorous replication,” and went on to say, “it now seems likely that many of the published findings of the last decade are wrong or misleading and have not contributed to real advances in knowledge” (Hewitt, 2012, pp. 1–2). Psychological Science has adopted the same strict standards for evaluating candidate-gene studies.
Why the replication of findings from candidate-gene studies of complex behaviors has been inconsistent remains an open question, but it is commonly believed that low statistical power is a major contributing factor, and that the problem of low power is further compounded if the reported p values correct for only a subset of the multiple hypotheses that were tested (Hewitt, 2012; Ioannidis, 2005). Candidate-gene studies also cannot always adequately control for the well-known problem of population stratification, in which genotypes covary with unobserved environmental factors (Hamer & Sirota, 2000). For example, individuals with shared genetic ancestry (e.g., individuals from the same ethnic group or from the same ancestral region) may share values, cultural practices, or exposure to other unobserved environmental confounds. Population stratification can give rise to associations driven by the shared environmental factors but spuriously attributed to the shared genotype (Cardon & Palmer, 2003). A finding may be confounded by population stratification even though it is successfully replicated if the population structure that caused a spurious genetic discovery is also present in the replication samples.
Around 2005, as a result of the methodological limitations of candidate-gene studies and the dramatic decline in the cost of genotyping, medical research experienced a paradigm shift, moving away from candidate-gene studies to what are called genome-wide-association (GWA) studies (McCarthy et al., 2008; Pearson & Manolio, 2008; Visscher, Brown, McCarthy, & Yang, 2012). These are hypothesis-free studies in which researchers test the phenotype of interest for association with all of the (typically millions of) measured single-nucleotide polymorphisms (SNPs). Because of the large number of hypotheses tested, a SNP association is considered established only if it (a) reaches the “genome-wide significance” threshold of p < 5 × 10⁻⁸ and (b) is subsequently successfully replicated in an independent sample at a nominal significance level of .05 (McCarthy et al., 2008).
Advocates of GWA studies argue that they overcome or mitigate many of the limitations of candidate-gene studies. First, the large number of SNPs that are tested for association makes transparent the need to correct for multiple-hypothesis testing, which is achieved by imposing the genome-wide significance threshold of p < 5 × 10⁻⁸ (McCarthy et al., 2008). Moreover, GWA studies, as a practical matter, tend to be based on larger samples (as indeed they must to have any chance of identifying a SNP that reaches genome-wide significance).
Second, Bayes’s rule implies that, conditional on observing an association at the genome-wide significance level, the association is likely to be true even if the study had only modest statistical power to detect the association in the first place (see Benjamin et al., 2012, for calculations).
Third, GWA data can be used to mitigate the potential confound of population stratification. In particular, it has become a common practice in GWA studies to (a) estimate the first four principal components of all the genotypes measured by the gene chip (the number 4 having emerged as a convention), (b) drop individuals who are genetic outliers as measured by these principal components, and then (c) include the principal components as control variables in the genetic-association analysis. Intuitively, the principal components capture axes of correlation across the genome that result from common ancestry. The principal components often have a geographic interpretation (Abdellaoui et al., 2013; Price et al., 2009; Price et al., 2006). Controlling for principal components has become standard in GWA studies since Price et al. (2006) showed, through simulation and empirical examples, that doing so can eliminate spurious associations due to population structure. In Section 5 of the Supplemental Material, available online, we illustrate the effectiveness of this method using a simple placebo test. Specifically, we show that controlling for principal components eliminates a spurious association between educational attainment and a SNP for lactose intolerance that is known to vary in frequency across individuals with different ancestries (Bersaglieri et al., 2004; Campbell et al., 2005). (In contrast, the most common way of addressing population stratification in candidate-gene studies—namely, including controls for self-identified race—does not eliminate the spurious association.)
There are thus many reasons to expect findings from GWA studies to be replicated more consistently than findings from candidate-gene studies. Indeed, in the literature on complex anthropometric and medical traits, GWA findings do in fact have a vastly superior replication record (Visscher et al., 2012). But do positive GWA findings from studies of complex behavioral traits similarly identify credible genetic associations that can be replicated consistently? And if the findings can be replicated consistently, is this because what is being observed is a real genetic signal or because population stratification has generated a spurious association in both the discovery sample and the replication sample? If GWA studies do identify credible and replicable genetic associations, then they are a promising response to the nonreplicability problem in gene-discovery research in the social sciences.
Until recently, virtually all GWA studies with positive findings have been studies of anthropometric or medical traits. For this reason, it may be inappropriate to infer from the superior replication record of GWA studies of medical traits that positive findings from GWA studies of behavioral traits will be replicated consistently. If true genetic associations with behavioral traits have smaller effect sizes than true associations with anthropometric and medical traits, then GWA studies on behavioral traits should tend to generate less reliable results because they have lower power to detect true associations. Furthermore, although the convention of controlling for four principal components may be sufficient to minimize population-stratification concerns for anthropometric and medical traits, it might not be sufficient to minimize these concerns for behavioral traits, which may be characterized by more subtle population stratification.
Earlier GWA studies of behavioral traits (Benyamin et al., 2014; De Moor et al., 2012) largely came up empty-handed (probably as a result of a lack of power), but a recent GWA study on educational attainment with a combined sample of more than 100,000 individuals (Rietveld et al., 2013) identified three SNP associations that met the standard criteria for establishing a GWA-study association (i.e., they reached the genome-wide significance threshold of p < 5 × 10⁻⁸ and were replicated in an independent sample at the significance level of .05). The effect sizes of the associations identified by Rietveld et al. are indeed small: The largest effect size corresponds to an R2 of only approximately 0.02% (equivalent to about 1 month of schooling per allele). This is far smaller than the effect sizes for medical and anthropometric traits; for example, it is less than one tenth the R2 of the largest associations discovered for height (R2 = 0.4%; Lango Allen et al., 2010) and body mass index (R2 = 0.3%; Speliotes et al., 2010). The Rietveld et al. results therefore can serve as a test case for the robustness of the GWA approach to behavioral traits.
We sought to investigate (a) whether the Rietveld et al. (2013) results could be replicated in an independent sample with far more stringent controls for population stratification than are typically applied in GWA studies of medical and anthropometric traits, and (b) whether there is any evidence overall that the meta-analytic results are contaminated by unaccounted-for population stratification.
Study 1: Replication of Associations With Specific SNPs in 23andMe Data With Extensive Controls for Stratification
Method
In Study 1, we sought to replicate the three genome-wide significant SNP associations identified by Rietveld et al. (2013) in a new independent sample. Rietveld et al. tested approximately J = 2 million SNPs for association with educational attainment by running the following regression separately for each SNP j ∈ {1, 2, . . . , J}:

where yi is the dependent variable (the phenotype); μ j is a constant term; xij is the number of reference alleles (0, 1, or 2) that individual i is endowed with at SNP j; β j is the coefficient of interest; and Zi is a vector of controls, which include age, sex, and the first four principal components of the variance-covariance matrix of the genotypic data. Rietveld et al. studied two dependent variables: EduYears, a measure of the number of years of schooling completed by the individual, and College, a binary variable equal to 1 if the individual had earned a college degree or its equivalent. (The point-biserial correlation between the two measures is roughly .8; see Section 1 in the Supplemental Material.) The tests of association with years of schooling (EduYears) were conducted by running the linear regressions described above, and the tests of association with receipt of a college degree or its equivalent (College) were conducted analogously using logistic regressions.
We sought to replicate the original associations using data provided by 23andMe for a cohort based on a sample of volunteer participants (Eriksson et al., 2010) that was not included in the Rietveld et al. (2013) study. After quality-control filters were applied and the sample was restricted to include only individuals of European descent who responded to a survey question about educational attainment, the sample size was 34,428. Because of the small effects, replication samples of this magnitude are required for adequate power. Given the sample size of 34,428, our power to replicate an association with R2 of 0.02% at p < .05 was 75% (see Section 6 in the Supplemental Material).
We used the same regression models (see Regression 1) as in Rietveld et al., except that in our analysis, the vector of controls (Zi) included (in addition to age and sex) the first 25 principal components from the sample’s genotype-covariance matrix—compared with only four principal components in Rietveld et al. (2013)—in order to reduce potential population-stratification confounding by partialing out more of the population structure. (For more details on methods, see Section 2 in the Supplemental Material.)
Results
As shown in Tables 1 and 2, all three SNP associations reported in Rietveld et al. (2013) were replicated at a nominal significance level of .05, in the same direction and with similar effect sizes as in the original report. The replication of effect sizes suggests that the additional controls for population stratification from including more than four principal components made little difference (for related evidence, see Section 5 in the Supplemental Material). As a caveat, we note that because all research participants were completely anonymous to us, we cannot rule out overlap between the 23andMe sample and the Rietveld et al. discovery or replication samples; in the case of such overlap, the new results would not be fully independent from the results of Rietveld et al. We believe, however, that such potential overlap is likely to be miniscule and is therefore unlikely to have driven our replication findings.
Replication of Associations Between Single-Nucleotide Polymorphisms and Receipt of College Degree or Equivalent Reported in Rietveld et al. (2013) in 23andMe Data

Note: Odds ratios (ORs) represent the relative likelihood of attending college for an individual with one more reference allele and were estimated using logistic regression (see discussion after Equation 1 in the main text). Standard errors are shown in parentheses. The Rietveld et al. sample sizes are shown as ranges because different sample sizes are available for the three single-nucleotide polymorphisms (SNPs). Because rs9320913 was unavailable in the 23andMe data, we used rs12206087 as a (very reliable) proxy (R2 = .99; see Section 2.3 in the Supplemental Material). Rows in boldface indicate the SNPs found by Rietveld et al. to be associated with the receipt of a college degree or its equivalent in their discovery sample.
Replication of Associations Between Single-Nucleotide Polymorphisms and Years of Schooling Reported in Rietveld et al. (2013) in 23andMe Data
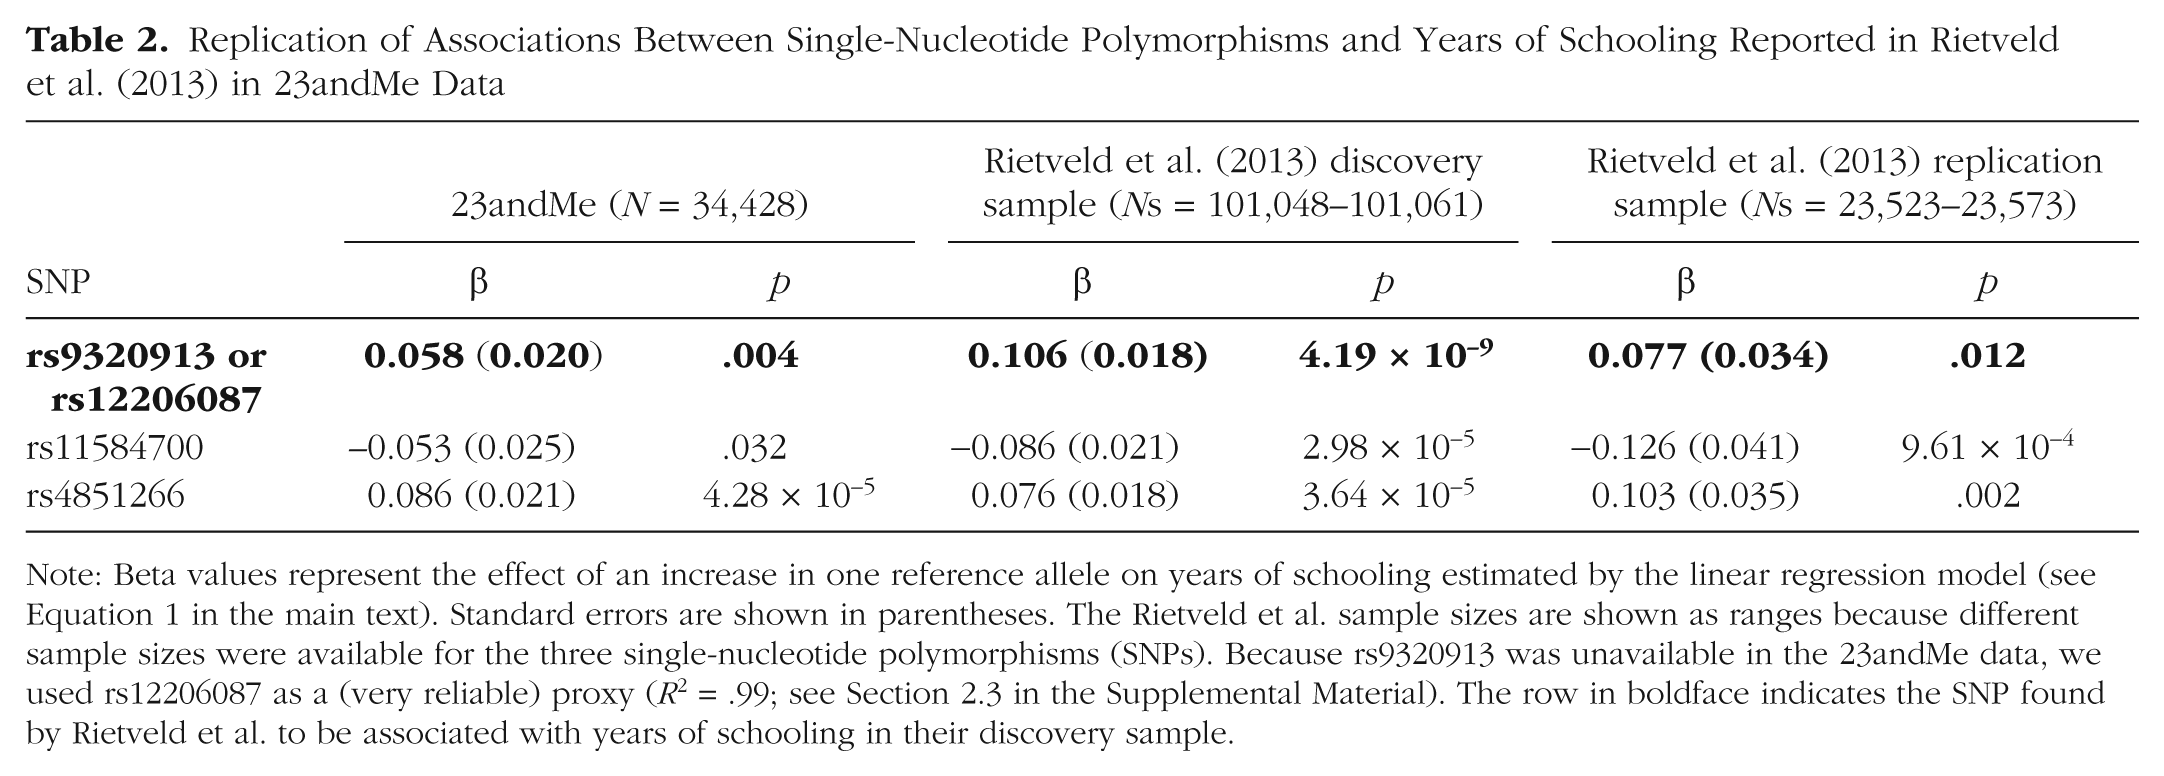
Note: Beta values represent the effect of an increase in one reference allele on years of schooling estimated by the linear regression model (see Equation 1 in the main text). Standard errors are shown in parentheses. The Rietveld et al. sample sizes are shown as ranges because different sample sizes were available for the three single-nucleotide polymorphisms (SNPs). Because rs9320913 was unavailable in the 23andMe data, we used rs12206087 as a (very reliable) proxy (R2 = .99; see Section 2.3 in the Supplemental Material). The row in boldface indicates the SNP found by Rietveld et al. to be associated with years of schooling in their discovery sample.
Study 2: The Robustness of Polygenic Scores in the Swedish Twin Registry and the Queensland Institute of Medical Research Data With Two Distinct Methods of Controlling for Stratification
Method
Whereas in Study 1, we used a new data set to replicate the three genome-wide significant SNP associations reported by Rietveld et al. (2013), in Study 2, we used some of the same data used in the original report to probe the robustness of Rietveld et al.’s reported polygenic-score results to potential confounding from population stratification. Following Purcell et al. (2009), polygenic scores are commonly constructed in the GWA literature in order to allow investigators to evaluate the joint predictive power of a large number of SNPs (possibly including SNPs whose effects are too small or estimated too imprecisely to reach genome-wide significance).
Following a common approach in the genetics literature (Purcell et al., 2009; Yang et al., 2012), Rietveld et al. (2013) constructed a polygenic score (

where the dependent variable yi is always EduYears (never College); μ is a constant term; β is the coefficient of interest; and Zi is a vector of controls, which include age, sex, and the Age × Sex interaction, but no principal components (although principal components were included as controls in the GWA analyses that generated the weights for constructing each
To explore the robustness of the original findings, we reran these prediction analyses using two distinct methods that controlled more stringently for population stratification. In the first, we estimated the same regression model (Regression 2), except we additionally included in the vector of controls the first 20 principal components as control variables. In the second, we estimated mixed linear models (Kang et al., 2010) in place of the regression models. Conceptually, these models involve two steps: (a) The genome-wide data are used to estimate the degree of genetic similarity between each pair of individuals in the sample, and (b) unlike in a standard regression, in which the covariance of the error term (in an educational-attainment regression) between any two individuals is assumed to be zero, the covariance is fitted as an increasing linear function of the individuals’ genetic similarity. In other words, if two individuals are more recently descended from a common ancestor (as can be very accurately measured by overall genetic similarity)—and thus more likely to be similar on unobserved environmental factors—then these individuals are treated as correlated observations on the relationship between educational attainment and the score. (For more details on methods, see Section 3 in the Supplemental Material.)
Results
The results are shown in Table 3. The upper panel shows the results from the association analyses with the scores constructed using different p-value thresholds. We separately report results for the STR and QIMR samples and for the scores constructed from weights estimated using the College and EduYears variables. The middle and lower panels show results from regressions with 20 principal components included as controls and from mixed linear models, respectively. Each coefficient is the estimated effect of a 1-standard-deviation increase in the score.
Results From Additional Analyses of Polygenic Scores as a Function of Significance Threshold of Genome-Wide-Association-Study Regression Weights Used to Construct the Scores in Queensland Institute of Medical Research and Swedish Twin Registry Data

Note: Beta values reflect the effect of a 1-SD increase in the polygenic score on years of schooling estimated by the linear regression model (see Regression 2 in the main text) or by the mixed-linear-model analysis. Positive beta values indicate that the polygenic score predicts the years-of-schooling (EduYears) variable in the same direction in the replication sample as in the discovery sample. Standard errors are shown in parentheses. All p values are for two-sided tests. ΔR2 is the increase in R2 (in units of percentage points) from estimating a model that includes the polygenic score as an independent variable relative to estimating a model that excludes it.
When all SNPs were used to construct the score, it had the predicted sign in all analyses and accounted for approximately 2% of the variance in educational attainment. In the STR sample (the larger and therefore better-powered cohort), the polygenic score was statistically significant in all scenarios, even when only genome-wide significant SNPs were included. The joint effect of the SNP associations with a significance level of p < 5 × 10⁻⁸ explained approximately 0.1% to 0.2% of variance in years of schooling in the STR sample. Because this polygenic score included three SNPs (when constructed using the College variable) or five SNPs (when constructed using the EduYears variable), the results are roughly consistent with Rietveld et al.’s (2013) estimate that each of the most strongly associated SNPs explains approximately 0.02% of variance in years of schooling. Overall, there was no systematic tendency for the predictive power of the scores to change when additional controls for stratification were included.
Study 3: Replication and Within-Family Robustness of Polygenic Scores in the Framingham Heart Study
Method
The gold standard for ruling out concerns about population stratification is to show that the association holds within families. The original Rietveld et al. (2013) study reported a within-family analysis using the pooled STR and QIMR samples. For this within-family analysis, the linear polygenic score constructed using all SNPs in the GWA study of years of schooling was strongly associated with educational attainment, and the score constructed using a p-value threshold of 5 × 10⁻³ was marginally significant. Power was too low to draw conclusions about the scores constructed using p-value thresholds of 5 × 10⁻⁵ and 5 × 10⁻⁸ (which contained information from fewer SNPs). The STR and QIMR analyses were based on sample sizes of 2,774 dizygotic twin pairs and 572 full-sibling pairs, respectively.
In Study 3, we used data from an independent sample, that of the Framingham Heart Study (FHS), to attempt to replicate the within-family analyses of the linear polygenic scores. The FHS is an epidemiological study on three generations of individuals in the Massachusetts town of Framingham; data from the FHS were not included in any of Rietveld et al.’s (2013) analyses (see Section 4 in the Supplemental Material). In the FHS sample, there are 395 families, each with two or more full biological siblings. Fewer SNPs are available in the FHS than in the STR and the QIMR (see Section 4.1 in the Supplemental Material). Consequently, we expected the polygenic scores in Study 3 to have lower explanatory power than the analogous scores from Study 2. Our focus here was on examining, within the FHS data set, how the estimated effect of the score would be affected by restricting the analysis to within-family variation.
Our analyses proceeded in three steps. First, we applied quality controls to the data, pruned the SNPs for linkage disequilibrium, and constructed the polygenic score using the meta-analytic results from Rietveld et al. (2013). Second, we identified all biological full siblings. Finally, we tested the score (

where i indexes individuals, k indexes families, and Xik is an indicator variable assigned a value of 1 if individual i belongs to family k and 0 otherwise. Including the family fixed effect (Xik) is equivalent (except for the resulting R2) to running a regression after both years of schooling (EduYears
i
) and the score (
Results
Each coefficient in Table 4 is the estimated effect of a 1-SD increase in the score. The two columns on the left show the results from the new within-family analyses using the FHS data: Whether or not we controlled for 20 principal components, both polygenic scores constructed from all SNPs and from SNPs whose associations reached a significance level of p < 5 × 10⁻³ were positively and significantly associated with educational attainment. In the two columns on the right, we report analyses analogous to those from Study 2 (i.e., excluding the family fixed effects, thus leveraging both between- and within-family variation in the score). In these analyses, both scores were positively associated with educational attainment, and results were again similar with and without the principal-component controls. The score from SNPs reaching p < 5 × 10⁻³ was marginally significant, and the score from all SNPs was highly statistically significant.
Results From Analyses of Polygenic Scores for Years of Schooling in the Framingham Heart Study Sample

Note: Beta values represent the effect of a 1-SD increase in the polygenic score on years of schooling estimated by Linear Regression Model 3 (for within-family variation; see Equation 3 in the main text) or by Linear Regression Model 2 (for between- and within-family variation; see Equation 2 in the main text). Positive beta values indicate that the score predicts the years-of-schooling (EduYears) variable in the same direction in the replication sample as in the discovery sample. Standard errors are shown in parentheses. All p values are for two-tailed tests. ΔR2 is the increase in R2 (in units of percentage points) from a model that includes the polygenic score as an independent variable relative to a model that excludes it. All analyses were conducted with data from 1,256 individuals (395 families with two or more children). SNP = single-nucleotide polymorphism.
Summary
To summarize, in Study 1, we replicated in an independent sample the associations between educational attainment and Rietveld et al.’s (2013) three genome-wide-significant SNPs, using more stringent controls for population stratification than is typical in the GWA literature; the next two studies showed that polygenic scores were robustly replicated in regressions with controls for population stratification and in within-family analyses.
To facilitate a comparison of the effect sizes across Studies 1 through 3 and Rietveld et al.’s (2013) analyses, we present 95% confidence intervals for the effect on years of schooling (EduYears) in Figure 1. An effect size of 0.1, for example, is equivalent to approximately 1 month of schooling. For the individual SNPs, the average effect of changing the number of reference alleles by 1 is shown, and for the polygenic score containing all SNPs, the average effect of increasing the score by 1 standard deviation is shown. Figure 1a shows that the effect sizes of the genome-wide significant SNPs are comparable across data sets. The effect sizes of the polygenic scores shown in Figure 1b are also similar across the QIMR and STR data sets and methods of controlling for population stratification. The effect sizes of the polygenic score in the FHS (Study 3) are not comparable to those from the QIMR and the STR; the effect sizes are attenuated in the FHS because the scores were constructed from the smaller number of SNPs available in this sample (see Section 4 in the Supplemental Material). Within the FHS, the effect sizes remained similar across different methods of controlling for population stratification, including the within-family analyses.

Absolute value of the effect on years of schooling (EduYears) of a change in one reference allele for each of the three individual single nucleotide polymorphisms (SNPs) as a function of SNP and sample (a) and absolute value of the effect on years of schooling of a 1-SD change in polygenic score (including all SNPs) as a function of study and type of analysis (b). Because rs9320913 was unavailable in the 23andMe data, we used rs12206087 as a (very reliable) proxy (R2 = .99; see Section 2.3 in the Supplemental Material). Error bars show 95% confidence intervals. QIMR = Queensland Institute of Medical Research; STR = Swedish Twin Registry; FHS = Framingham Heart Study; PC = principal component.
Although these results are encouraging, we also note a potential limitation of this study. Our evidence, especially the finding that the polygenic score is significantly associated with educational attainment in within-family analyses, suggests that it is extremely unlikely that the findings of Rietveld et al. (2013) were largely an artifact of stratification. However, biases due to very subtle population stratification may still account for some of the observed relationships between educational attainment and some of the individual SNPs. This possibility cannot be conclusively ruled out until large enough family samples (e.g., N = 47,000 sibling pairs; see Section 6 in the Supplemental Material) are available to enable adequately powered within-family tests of association with individual SNPs. This potential limitation applies to all GWA studies. Our findings suggest, however, that the individual SNPs’ associations with educational attainment were robust even when we included substantially more stringent controls than are standard in medical genetics.
Discussion
The contrast between the robustness of our findings and the disappointing replication record of most candidate-gene studies of behavioral traits is striking. To draw the appropriate methodological conclusions, it is necessary to understand the causes of this difference.
A first major contributing factor is that the Rietveld et al. (2013) analyses were based on a sample size that was unprecedentedly large by the standards of social-science genetics. If, as now seems likely, the effects of individual genetic variants on most behavioral traits are small, then much larger samples than are generally used are required to produce credible findings. This is a methodological lesson that applies to all studies, whether they are GWA studies or not. However, in practice, candidate-gene studies tend to be based on much smaller samples. Though it seems clear that much larger samples are needed, it is important to recognize that statistical power also depends on the reliability of the available phenotypic measure. Researchers will sometimes face a trade-off between studying a cruder variable available in a larger sample (e.g., educational attainment) or studying more proximal variables available in a smaller sample (e.g., cognitive ability). Rietveld et al. (2013, Supplementary Online Material, Section 7) provided a framework for quantifying this trade-off.
A second contributing factor is that some of the seeming discipline underlying the hypothesis-based research of existing candidate-gene studies is illusory: Because a vast majority of genes are expressed in the brain (Ramsköld, Wang, Burge, & Sandberg, 2009), it is usually possible to create an ex post rationalization for an observed association between a candidate gene and a behavioral trait that sounds at least superficially biologically plausible. Therefore, the main advantage of the candidate-gene approach—namely, the theoretical discipline that it imposes on the investigator—may be exaggerated.
We believe that there are two key implications of our findings for research on genetics of behavioral traits. First, our results suggest that standard GWA-study protocols from epidemiological research can indeed be successfully applied to the study of behavioral traits and may therefore offer a way to avoid the replication failures that are plaguing much research on the genetics of complex behavior. Second, even if (given the current state of biological knowledge) current candidate-gene approaches are not bearing fruit, this does not rule out an eventual “comeback” for hypothesis-based research on the genetics of behavioral traits. In fact, we envision that as the number of credibly established associations from GWA studies rises, these discoveries will usher in a new era of “empirical” candidate-gene studies in which the candidates are drawn from among the SNPs identified by GWA studies of related phenotypes. For example, the SNPs associated with educational attainment could be used as candidates to study cognitive and personality traits that may be part of the causal pathway. Such follow-up studies will of course need to be adequately powered to produce robust results, but because the GWA-study results restrict the number of SNPs that are subsequently tested for association, the p-value threshold can be set much more liberally than the level of genome-wide significance.
What does the finding of small effect sizes—reported by Rietveld et al. (2013) and replicated in our three studies—imply about how genetics research in psychology should be conducted and what its payoffs will be for the field? An immediate implication is that current research using genotypic data in laboratory experiments is almost certainly underpowered, and that psychology should therefore accelerate its move away from such methods, as they are unlikely to yield robust findings. A more subtle implication of the small effect sizes is that—as Turkheimer (2012) has persuasively argued—exuberant forecasts that the availability of genetic data will quickly transform the social sciences should be viewed skeptically. In principle, a genetic variant identified in an association study can explain a tiny part of the variation in the phenotype and yet point to an interesting biological system (this has happened several times in medical genetics). In practice, it seems likely that SNPs with smaller effect sizes, on average, are more likely to operate on the phenotype through distal causal pathways involving a large number and many layers of mediating environmental factors. Therefore, it is conceivable that the identification of SNPs with very small effects will not lead to a useful psychological theory of the phenotype.
At present, the extent to which the identification of individual SNPs will reveal new biological and psychological insights about highly polygenic behavioral traits remains an open question. But we believe it is likely that genetic-association research will benefit psychology in the long run, for at least two other reasons. First, even if genetic associations can be discovered only in samples of many tens of thousands of individuals, once the genetic variants to focus on have been identified, large-but-attainable samples of a few thousand individuals will provide sufficient statistical power to address interesting research questions, such as questions about the nature and magnitude of gene-environment interactions.
Second, even though individual genetic variants have very small effects, polygenic scores can have large enough effects to be usable even in relatively small samples. The polygenic score explored here has modest explanatory power (R2 ≈ 2%), but when the weights for constructing the score are estimated in larger samples, the explanatory power will be much greater. For example, Rietveld et al. (2013, Supplementary Online Material, Table S26) estimated that a polygenic score constructed using results from a discovery sample of 500,000 individuals will have an R2 of approximately 12%. We anticipate that such sample sizes will be attainable in the next few years, making it possible to construct such a score. Once a polygenic score with an R2 of 12% can be calculated for each genotyped participant in a study, a sample of only 62 participants will be needed for 80% power to detect its effect.
In summary, our results suggest that in psychology, a shift away from candidate-gene studies and toward GWA studies is likely to be fruitful. However, before the potential payoffs can be realized, the focus of much research on the genetics of behavioral traits will need to be reoriented, and new research infrastructures will need to be created—for example, to build much larger sample sizes than most GWA studies of behavioral traits have had access to. Nevertheless, we believe that this investment is worth making, because it may lead to the accumulation of reliable and replicable knowledge about the genetics of behavioral traits.
Footnotes
Acknowledgements
This research was carried out under the auspices of the Social Science Genetics Association Consortium, a cooperative enterprise among medical researchers and social scientists that coordinates genetic-association studies for social-science variables.
Declaration of Conflicting Interests
The authors declared that they had no conflicts of interest with respect to their authorship or the publication of this article.
Funding
This research was funded primarily by the Ragnar Söderberg Foundation (E9/11) and also by the Swedish Council for Working Life and Social Research (2006-1623) and by the National Institute on Aging and the National Institutes of Health (P01-AG005842, P01-AG005842-20S2, P30-AG012810, and T32-AG000186-23). The formation of the Social Science Genetics Association Consortium was made possible by an EAGER grant from the National Science Foundation and a supplemental grant from the National Institutes of Health Office of Behavioral and Social Sciences Research (SES-1064089).
Open Practices
The meta-analytic data from the genome-wide-association study on educational attainment (Rietveld et al., 2013) are publicly available for follow-up research and replication purposes at http://ssgac.org/Data.php. Rietveld et al. (2013) was published before we began the analyses whose results we report in the present article. Further details about materials and methods used in Rietveld et al. (2013) can be found in the Supplementary Material for Rietveld et al. (2013). The complete Open Practices Disclosure can be found at ![]() .
.
References
Supplementary Material
Please find the following supplemental material available below.
For Open Access articles published under a Creative Commons License, all supplemental material carries the same license as the article it is associated with.
For non-Open Access articles published, all supplemental material carries a non-exclusive license, and permission requests for re-use of supplemental material or any part of supplemental material shall be sent directly to the copyright owner as specified in the copyright notice associated with the article.