




Abstract
Maximizing science achievement is a critical target of educational policy and has important implications for national and international economic and technological competitiveness. Previous research has identified both science interest and socioeconomic status (SES) as robust predictors of science achievement, but little research has examined their joint effects. In a data set drawn from approximately 400,000 high school students from 57 countries, we documented large Science Interest × SES and Science Interest × Per Capita Gross Domestic Product (GDP) interactions in the prediction of science achievement. Student interest in science is a substantially stronger predictor of science achievement in higher socioeconomic contexts and in higher-GDP nations. Our results are consistent with the hypothesis that in higher-opportunity contexts, motivational factors play larger roles in learning and achievement. They add to the growing body of evidence indicating that substantial cross-national differences in psychological effect sizes are not simply a logical possibility but, in many cases, an empirical reality.
Whether it’s improving our health or harnessing clean energy, protecting our security or succeeding in the global economy, our future depends on reaffirming America’s role as the world’s engine of scientific discovery and technological innovation. And that leadership tomorrow depends on how we educate our students today, especially in math, science, technology, and engineering. But despite the importance of education in these subjects, we have to admit we are right now being outpaced by our competitors.
Much attention has recently been paid to the status of science achievement among U.S. students, as a key determinant of both domestic prosperity and international economic competiveness. Understanding the determinants of science achievement at both the individual and national levels has therefore become a major emphasis of basic social science research. Empirical evidence points to strong roles for two classes of factors in science achievement: socioeconomic status (SES; Knudsen, Heckman, Cameron, & Shonkoff, 2006; Sirin, 2005) and science interest (Hulleman & Harackiewicz, 2009). These research emphases are mirrored in guidelines for science education policy (National Science Board, 2010).
In spite of thriving research programs that have separately examined the roles of academic interest and SES on academic achievement, there has until recently been little empirical research on their joint effects. Research on SES and academic achievement has largely focused on identifying the specific mechanisms that mediate achievement disparities. For example, researchers have examined factors such as nutrition; cognitively stimulating materials and experiences; school quality; school peer composition; parent and teacher attitudes, expectations, and behaviors; and stressful, threatening, and uncontrollable life events (Altonji & Mansfield, 2011; Bradley & Corwyn, 2002; Coleman, 1966). Meanwhile, research on academic interest and achievement has used longitudinal data to disentangle the causal ordering of academic interest and academic achievement (Marsh & Martin, 2011; Marsh & O’Mara, 2008; Marsh, Trautwein, Lüdtke, Köller, & Baumert, 2005) and used in-depth survey methods to test the mediating roles of task choice and task involvement on the effects of interests and expectations on academic achievement (Eccles & Wigfield, 2002; Fredricks & Eccles, 2002; Jacobs & Eccles, 2000). Results have been consistent with investment perspectives of knowledge acquisition (Cattell, 1971; von Stumm & Ackerman, 2013), which posit that individual differences in motivational factors, such as intellectual and academic interest, influence the extent to which individuals invest their time and effort in learning.
Only a small body of recent work, focusing specifically on achievement gaps within the United States, has investigated Academic Interest × SES interactions (Tucker-Drob & Briley, 2012; Tucker-Drob & Harden, 2012a, 2012b). Results have consistently indicated that a constellation of closely related variables representing intellectual interest and achievement motivation, on the one hand, and family SES, on the other hand, interact in their prediction of both domain-general academic achievement and multiple domain-specific aspects of academic achievement, most notably mathematics and science achievement. These results are consistent with the hypothesis that students with greater interest and motivation to learn are better able to successfully invest their time and effort in learning when given appropriate opportunities. In other words, rather than facilitating a process by which information is directly transmitted to passive learners, social and educational privilege increase the opportunity for students to actively engage in the learning process (Tucker-Drob, Briley, & Harden, 2013).
The current project extends this nascent body of work on Academic Interest × Family SES interactions in a number of important ways. First, we sought to determine whether such interactions apply to nations outside of the United States. Second, we sought to determine whether the interaction of academic interest with family SES is accounted for by school SES. Third, we examined whether national socioeconomic context (as indexed by per capita gross domestic product, or GDP) also interacts with individual science interest in the prediction of science achievement. Finally, we sought to test whether Academic Interest × SES interactions are independent of other established effects, specifically nonlinear effects and Academic Interest × Self-Concept interactions.
We hypothesized that because adolescent learning opportunities for science are primarily concentrated in schools and because family SES is often stratified across schools (i.e., children from poorer families tend to attend poorer schools with poorer student bodies), Academic Interest × Family SES interactions will be substantially mediated by Academic Interest × School SES interactions. Additionally, following on both previous theoretical work (Tucker-Drob et al., 2013) and empirical work on Academic Interest × SES interactions in the United States (Tucker-Drob & Briley, 2012; Tucker-Drob & Harden, 2012a, 2012b), we hypothesized that socioeconomic context and individual science interest would interact to predict individual science achievement, and that this interaction would be evident at both the intranational and international levels. We propose that in wealthy nations, students interested in science may select, evoke, and attend to science-relevant learning experiences, whereas in poorer nations, students will be far more limited in their options to invest their interests in this way. We therefore predicted that national socioeconomic prosperity would interact with science interest to predict science achievement. The current project represents the first test of such a Person × Nation interaction in the prediction of achievement. Finally, we predicted that these interactions would be robust to controls for nonlinear effects and Academic Interest × Self-Concept interactions that have previously been reported in the literature (Nagengast & Marsh, 2012; Nagengast et al., 2011). We used science interest and science test-score data from a large sample of 15-year-olds from 57 nations, which we combined with per capita GDP data.
Method
Participants
Data were drawn from the Organisation for Economic Co-operation and Development (OECD) Programme for International Student Assessment (PISA), an ongoing international project begun in 2003 to assess the academic competency of 15-year-olds around the world. Every 3 years, a new international sample of 15-year-olds is assessed on reading, mathematics, and science skills and surveyed on one particular subject (reading, mathematics, or science), with the subject rotating across waves. The most recent wave that focused on science occurred in 2006 (reading was the focus in 2009, and mathematics was the focus in 2012). We specifically selected the 2006 data set for this reason. This data set contains a total of 398,750 individual student participants, carefully selected to be representative of the general population of 15-year-old students from each of 57 nations.
Full details of the recruitment, procedures, and assessment methods can be found in technical reports (OECD, 2006, 2007, 2009). Briefly, participants are given a 2-hr paper-and-pencil test that primarily assesses scientific literacy. Literacy refers to the ability to apply scientific thinking to real-world problems, rather than to specific curricular items. The test items are extensively validated in a pilot study and scored using item-response-theory models. Additionally, participants complete a 30-min questionnaire about their demographic background and individual characteristics. All test material is translated from and back-translated to two source languages by two independent translators. A third independent linguist adjudicates any discrepancies. This procedure is far more stringent than standard back translation in that it uses two source languages and three independent translators. Standard methods typically use only one source language and translator. This is done to ensure that the content is appropriate in all countries and languages. Numerous quality-control measures are in place to guarantee that accurate data are obtained from the students and entered into the data set.
Measures
For the current study, we analyzed the variables described in the following subsections.
Science achievement
PISA assessed participants on multiple areas of science achievement. The PISA data file provides five sets of plausible values for latent science-literacy proficiency; these values were derived using item response theory. According to Nagengast and Marsh (2012), “correct analyses of plausible values require that all models are run separately for each plausible value and the results integrated using principles of multiple imputation analysis” (p. 1037). Following Nagengast and Marsh, we used the Mplus multiple-imputation function (Muthén & Muthén, 2012) to achieve this.
Science interest and science self-concept
To index science interest, we selected all of the subquestions from Question 16. This question asks students about their views on “broad-science” topics, which are those they “might encounter in school, or outside of school (for example on television) that relate to space science, biology, chemistry, Earth science or physics.” Participants rated how much they agreed with five statements indexing their interest and enjoyment in learning about broad-science topics.
To index science self-concept, we selected all of the subquestions from Question 37. This question asks participants to rate how much they agree with six statements about “school science” that index how quickly and easily they believe they learn and understand new school-science topics.
Questions 16 and 37 were previously used by Nagengast and colleagues (2011) to index science value and expectancy, respectively, in their analysis of Expectancy × Value interactions. There were no other questions that we judged to directly index broad interest or self-concept in science (although Question 21, which we did not analyze, asked about interest in specific science topics). Participants responded to questions on a scale from 1 (strongly agree) to 4 (strongly disagree). To create a composite reflecting science interest, we summed the subquestions from Question 16 and reverse-scored this value such that higher scores indicated more interest. Cronbach’s alpha for this composite was .905. To create a composite reflecting science self-concept, we summed the subquestions from Question 37 and reverse-scored this value such that higher scores indicated higher self-concept. Cronbach’s alpha for this composite was .910. Nagengast and colleagues (2011) previously reported measurement invariance for these questions across all 57 PISA nations.
Family SES
Our measure of family SES was also obtained from PISA, which provides an index of economic, social, and cultural status derived from student reports of parental educational attainment, parental occupational status, and material possessions (e.g., books, computer, electronic equipment) in the home.
School SES
Following best practices (van Ewijk & Sleegers, 2010), we calculated SES for each school by averaging the PISA index of economic, social, and cultural status across all individual PISA participants attending that school.
Country-level per capita GDP
Per capita GDP in U.S. dollars for each country in 2006 was obtained from the World Bank (2006a). 1 GDP was log-transformed (logGDP) for all analyses and standardized relative to its between-country mean and standard deviation.
Other country-level social and economic indices
In addition to calculating logGDP, we also attempted to integrate other aspects of national social, educational, and economic opportunities (see Table S1 in the Supplemental Material available online for values obtained for each country). We obtained the Gini index and research and development (R&D) expenditures from The World Bank; social justice, access to education, and social cohesion from the Sustainable Governance Indicators (Schraad-Tischler, 2011); and the democracy index from The Economist (Kekic, 2007). The Gini index reflects the extent of income inequality in that country, with larger values indicating greater inequality in income distribution (The World Bank, 2006b). R&D measures the aggregated expenditures on research and development across industries in a country (The World Bank, 2006c).
Social justice, access to education, and social cohesion were available only for 31 OECD member states of the 57 nations. The social-justice index measures the extent to which individuals have the opportunity to develop desired capabilities, with higher numbers indicating greater social justice (Schraad-Tischler, 2011). It is a composite based on poverty rate, access to education, labor equalities, population diversity and integration, health and access to health services, and distribution of social burden in a country. Access to education measures the extent to which education is equally available to everyone in a country (Schraad-Tischler, 2011). Social cohesion measures the extent to which individuals within a country perceive that they are a part of the community and receive fair treatment (Schraad-Tischler, 2011). The democracy index measures the amount of freedom an individual has in contributing to the political environment and the extent to which an individual’s rights are observed in a country (Kekic, 2007).
Results
All data and materials are publicly available via the Organisation for Economic Co-operation and Development and can be accessed at http://pisa2006.acer.edu.au/downloads.php. The Supplemental Material includes annotated SPSS syntax for preparation of data files for analysis in Mplus and annotated Mplus input files for conducting the analyses described below.
All analyses used individual student weights available in the PISA data set to account for unequal participation probabilities associated with both student- and school-driven selective participation and explicit oversampling that was conducted for national reporting purposes. All predictors that varied within country were centered within country in order to avoid confusing between-country effects for within-country effects. We report results using two different methods of standardization of variables that varied within country: standardization relative to U.S. standard deviations and standardization relative to cross-nationally pooled standard deviations. The former puts parameters on a scale comparable with those reported in previous studies, which have predominantly been conducted in the United States and similarly industrialized Western countries. The latter puts parameters on a scale that is typical of all countries in the PISA data set (but not specifically representative of any single country). Standardization was carried out by dividing each relevant variable by the relevant standard deviation prior to creating product terms and fitting models. Standardizing relative to each country’s specific standard deviation would have been inappropriate, as cross-national differences in the magnitude of association would have become confounded with cross-national differences in the magnitude of variation.
Interactions of within-country SES and science interest
In an initial model (Model 1), we predicted science achievement from science interest, family SES, and logGDP, a Family SES × Science Interest interaction, and a LogGDP × Science Interest interaction, using the complex-survey feature of Mplus to correct standard errors for the nonindependence of observations due to nesting of data across the three levels of analysis (individuals, schools, and nations). Results are presented in Table 1. It can be seen that the population-average regression effect of science interest on science achievement was estimated to be of modest magnitude (0.167 scaled relative to U.S. standard deviations, 0.149 scaled relative to pooled standard deviations) and that the population-average regression effect of family SES on science achievement was estimated to be of moderate magnitude (0.278 scaled relative to U.S. standard deviations, 0.304 scaled relative to pooled standard deviations).
Results of Regression Models Predicting Science Achievement
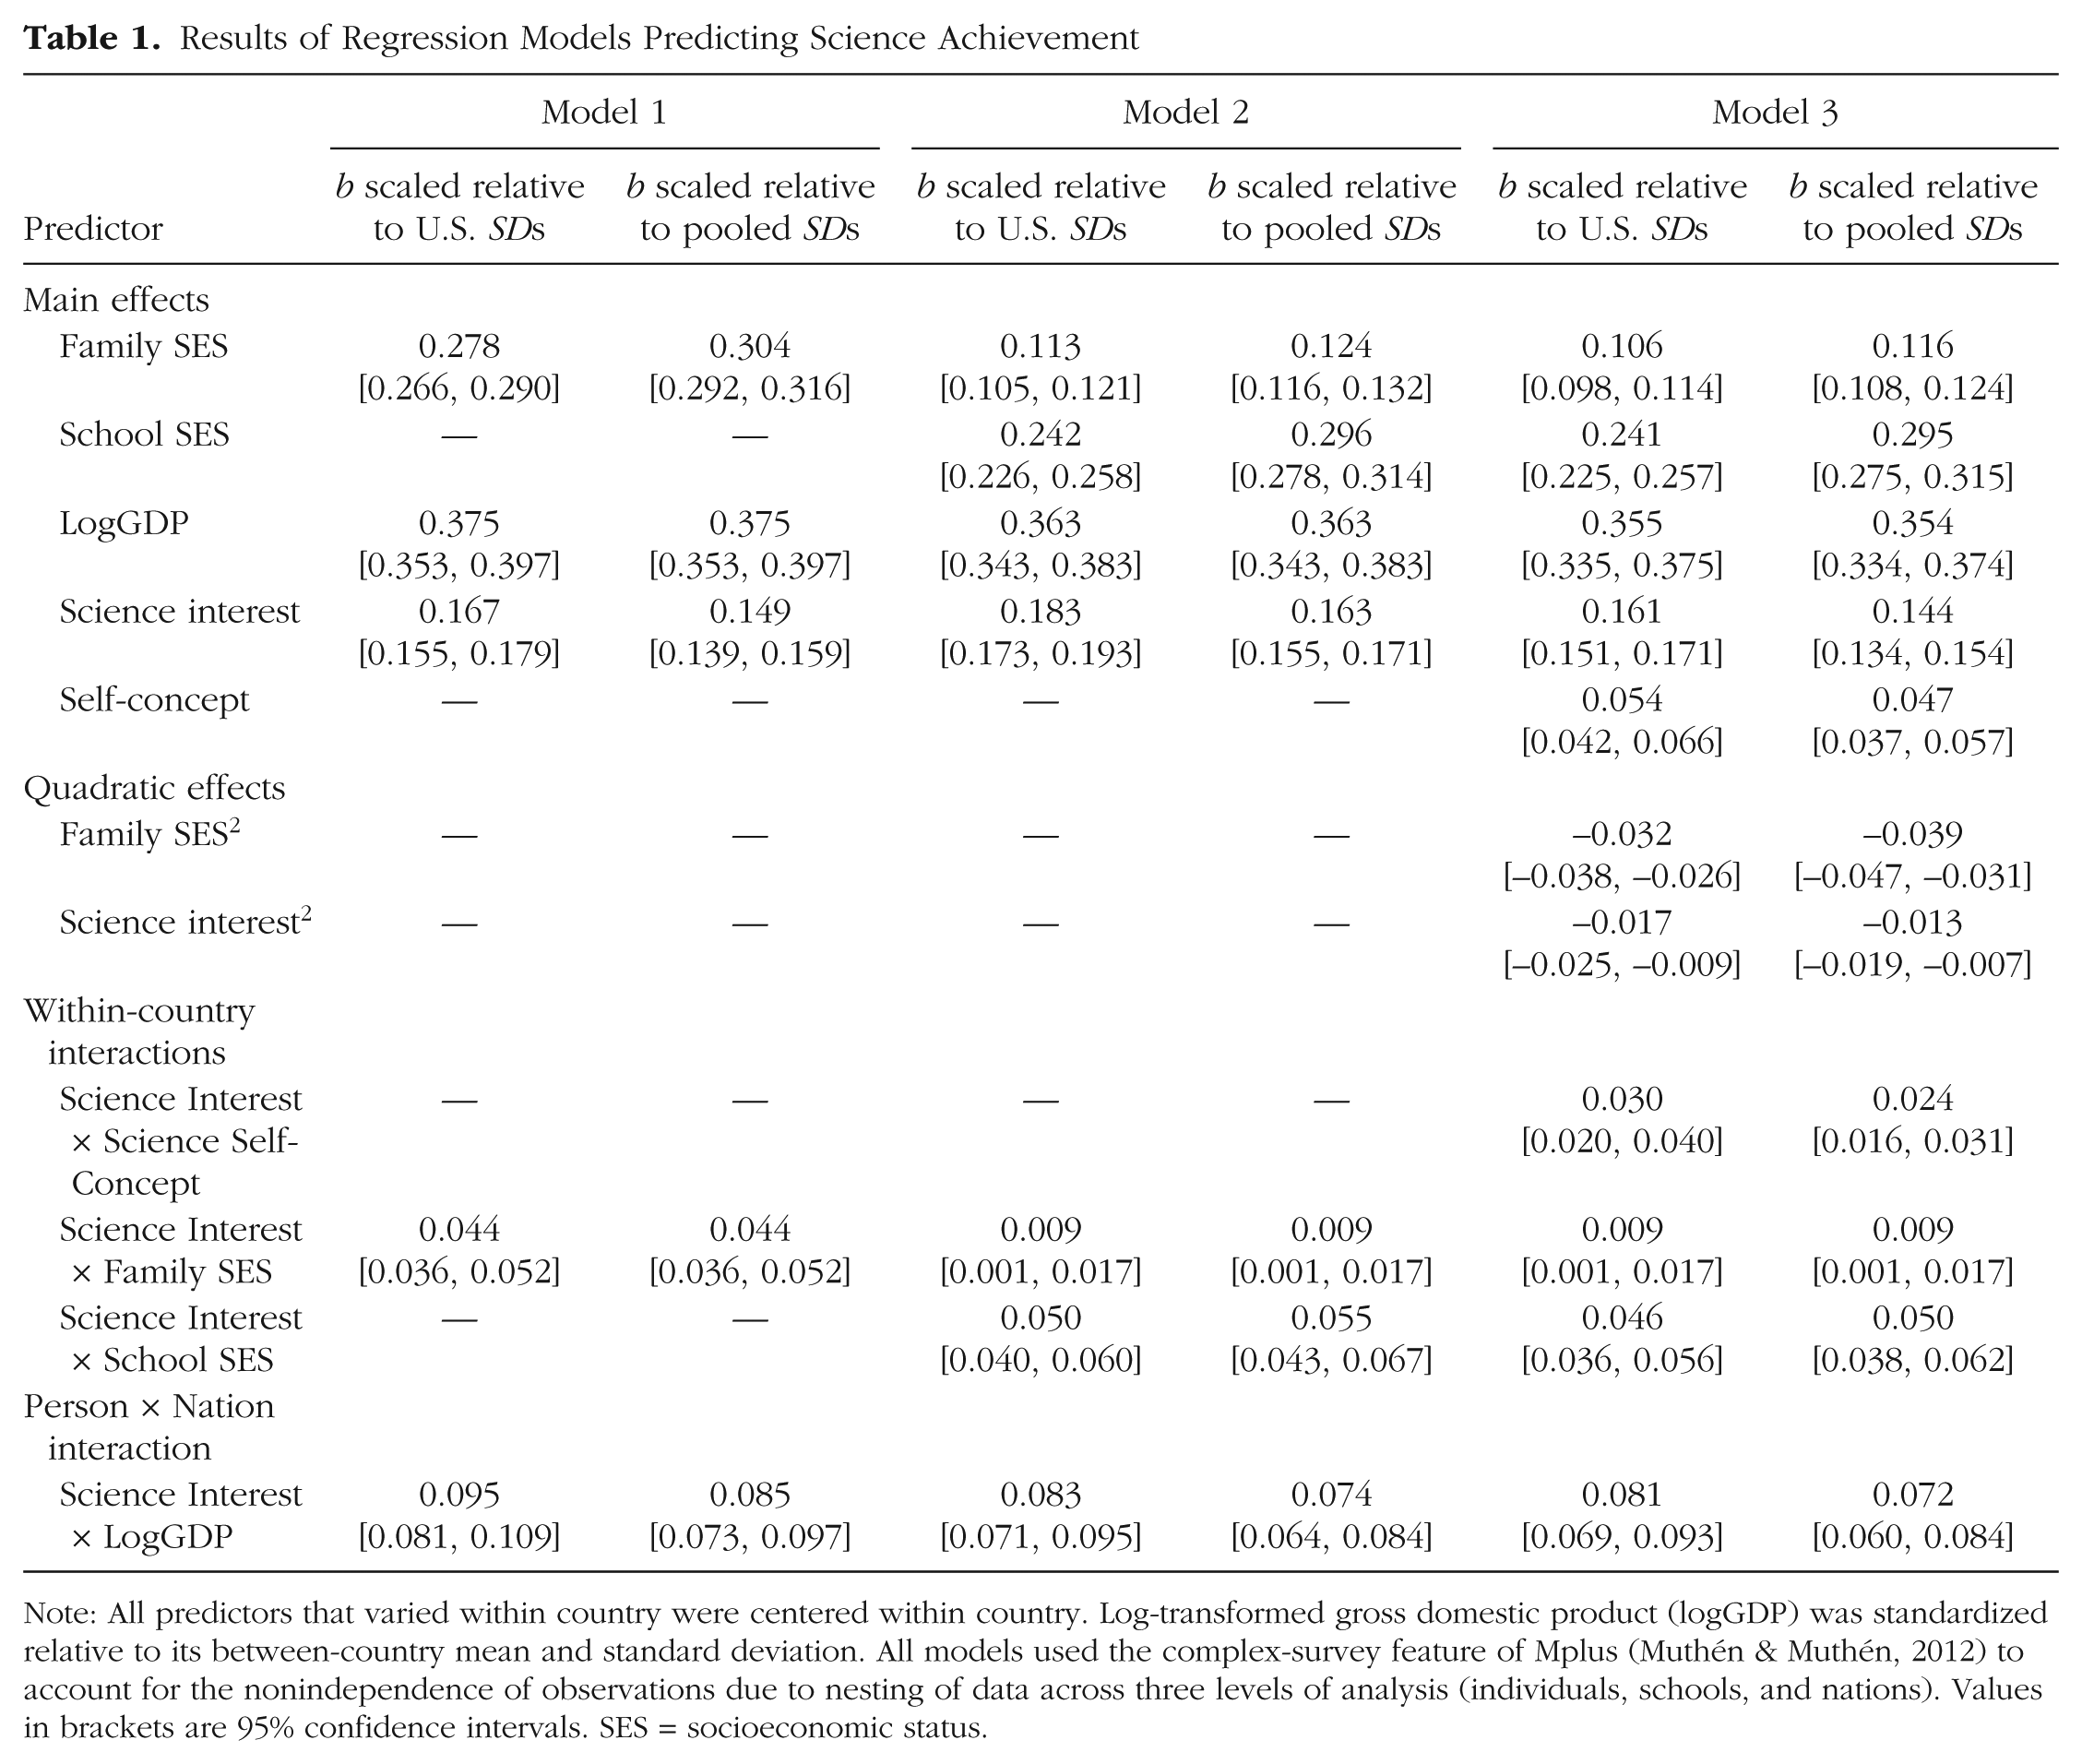
Note: All predictors that varied within country were centered within country. Log-transformed gross domestic product (logGDP) was standardized relative to its between-country mean and standard deviation. All models used the complex-survey feature of Mplus (Muthén & Muthén, 2012) to account for the nonindependence of observations due to nesting of data across three levels of analysis (individuals, schools, and nations). Values in brackets are 95% confidence intervals. SES = socioeconomic status.
Notably, a sizable interaction of family SES and science interest was detected. The magnitude of this interaction can be gauged by calculating simple slopes for science interest at high (2 SD above the mean) and low (2 SD below the mean) values of family SES. Holding logGDP constant at the between-nation mean, among children from low-SES families, the regression effect of science interest on science achievement was 0.079 when computed with U.S. standard deviations and 0.061 when computed with pooled standard deviations. Again, holding logGDP constant at the between-nation mean, among children from high-SES families, the regression effect of science interest on science achievement was 0.255 when computed with U.S. standard deviations and 0.237 when computed with pooled standard deviations. In home environments that were more resource rich, interest in science was more strongly linked to actual science achievement. Of course, these interaction effects also varied across countries.
To estimate within-country parameters, we used the multiple-group feature of Mplus to estimate unconstrained country-specific regressions of science achievement on science interest (centered within country), family SES (centered within country), and a within-country Student SES × Science Interest interaction, using the complex-survey option to correct standard errors for nonindependence of observations associated with nesting of data across two within-country levels of analysis (individuals and schools). The Czech Republic displayed the largest Family SES × Science Interest interaction (0.084 scaled relative to U.S. standard deviations, 0.082 scaled relative to pooled standard deviations). Among Czech children from low-SES families, the regression effect of science interest on science achievement was 0.010 when computed with U.S. standard deviations and −0.005 when computed with pooled standard deviations. Among Czech children from high-SES families, the regression effect of science interest on science achievement was 0.346 when computed with U.S. standard deviations and 0.323 when computed with pooled standard deviations.
Other sizable Science Interest × SES interactions (effect > 0.050 for both forms of scaling) were found for the United States, New Zealand, the United Kingdom, and Bulgaria. Alternatively, near-zero Science Interest × SES interaction effects were found for Hong Kong, Finland, Jordan, Montenegro, Taipei (Taiwan), and Azerbaijan. One country (Kyrgyzstan) had an appreciably negative Science Interest × SES interaction (−0.074 scaled relative to U.S. standard deviations, −0.073 scaled relative to pooled standard deviations), along with an appreciably negative main effect of science interest on science achievement (−0.215 scaled relative to U.S. standard deviations, −0.192 scaled relative to pooled standard deviations). Kyrgyzstan is also the country in the PISA data set with the lowest GDP. Figure 1 presents example simple-slopes plots for countries with varying magnitudes of the interaction between SES and science interest and the main effect of science interest. Full country-specific parameter estimates from the multiple-group models are presented in Tables S2 and S3 in the Supplemental Material.

Example simple-slopes plots of the relation between science interest and science achievement at low, medium, and high levels of family socioeconomic status (SES). From left to right, the columns show plots for countries with no or small, medium, and large Science Interest × Family SES interactions, and the rows, from bottom to top, show these interactions for countries with no or small, medium, and large main effects of science interest. Both science interest and SES are centered at each country’s mean (such that 0 represents the average interest for each country) and are scaled in standard-deviation units relative to the standard deviations observed in the U.S. subsample. For SES, medium represents the nation-specific mean, and low and high represent 2 standard deviations below and above the nation-specific mean, respectively. Science achievement is z-scored relative to the mean and standard deviation observed in the U.S. subsample.
Between-country interactions of GDP and science interest
In addition to indicating main and moderating effects of family SES, Model 1 also revealed both a strong main effect of logGDP (0.375 scaled relative to both U.S. and pooled standard deviations) and a strong moderating effect of logGDP on science interest (0.095 scaled relative to U.S. standard deviations, 0.085 scaled relative to pooled standard deviations) in predicting science achievement. This interaction indicated that students’ levels of science interest were more highly related to their science achievement in more economically prosperous countries. Holding family-level SES constant at each country’s mean, science interest among students from rich countries (logGDP = 2 SD above the mean) was moderately related to their science achievement (expected regression effect = 0.357 when calculated with U.S. standard deviations, 0.319 when calculated with pooled standard deviations), but among students from poor countries (logGDP = 2 SD below the mean), science interest had no relation with science knowledge (expected regression effect = −0.023 when calculated with U.S. standard deviations, −0.021 when calculated with pooled standard deviations).
Using the country-specific parameter estimates for science interest from the multiple-group model described earlier, Figure 2 plots the regression coefficient of science achievement on science interest as a function of logGDP. Note that this is not a plot of levels of science performance across countries. The y-axis represents the magnitude of the regression relation between science interest and science performance (scaled in U.S. standard deviations). It can be seen that there was a strong correlation (r = .753, 95% CI = [.639, .867]) between logGDP and the regression coefficient for science interest as a predictor of science achievement (this correlation is identical when country-specific regression coefficients are scaled in pooled standard deviations). Science interest was more strongly associated with science achievement in higher GDP countries. In very-low-GDP countries, the association between science interest and science achievement was essentially flat. A much weaker correlation (r = .276, 95% CI = [.034, .518]) was found between the Family SES × Science Interest effect size and country logGDP, leaving much unexplained heterogeneity in cross-national differences in the Family SES × Science Interest interaction effect.
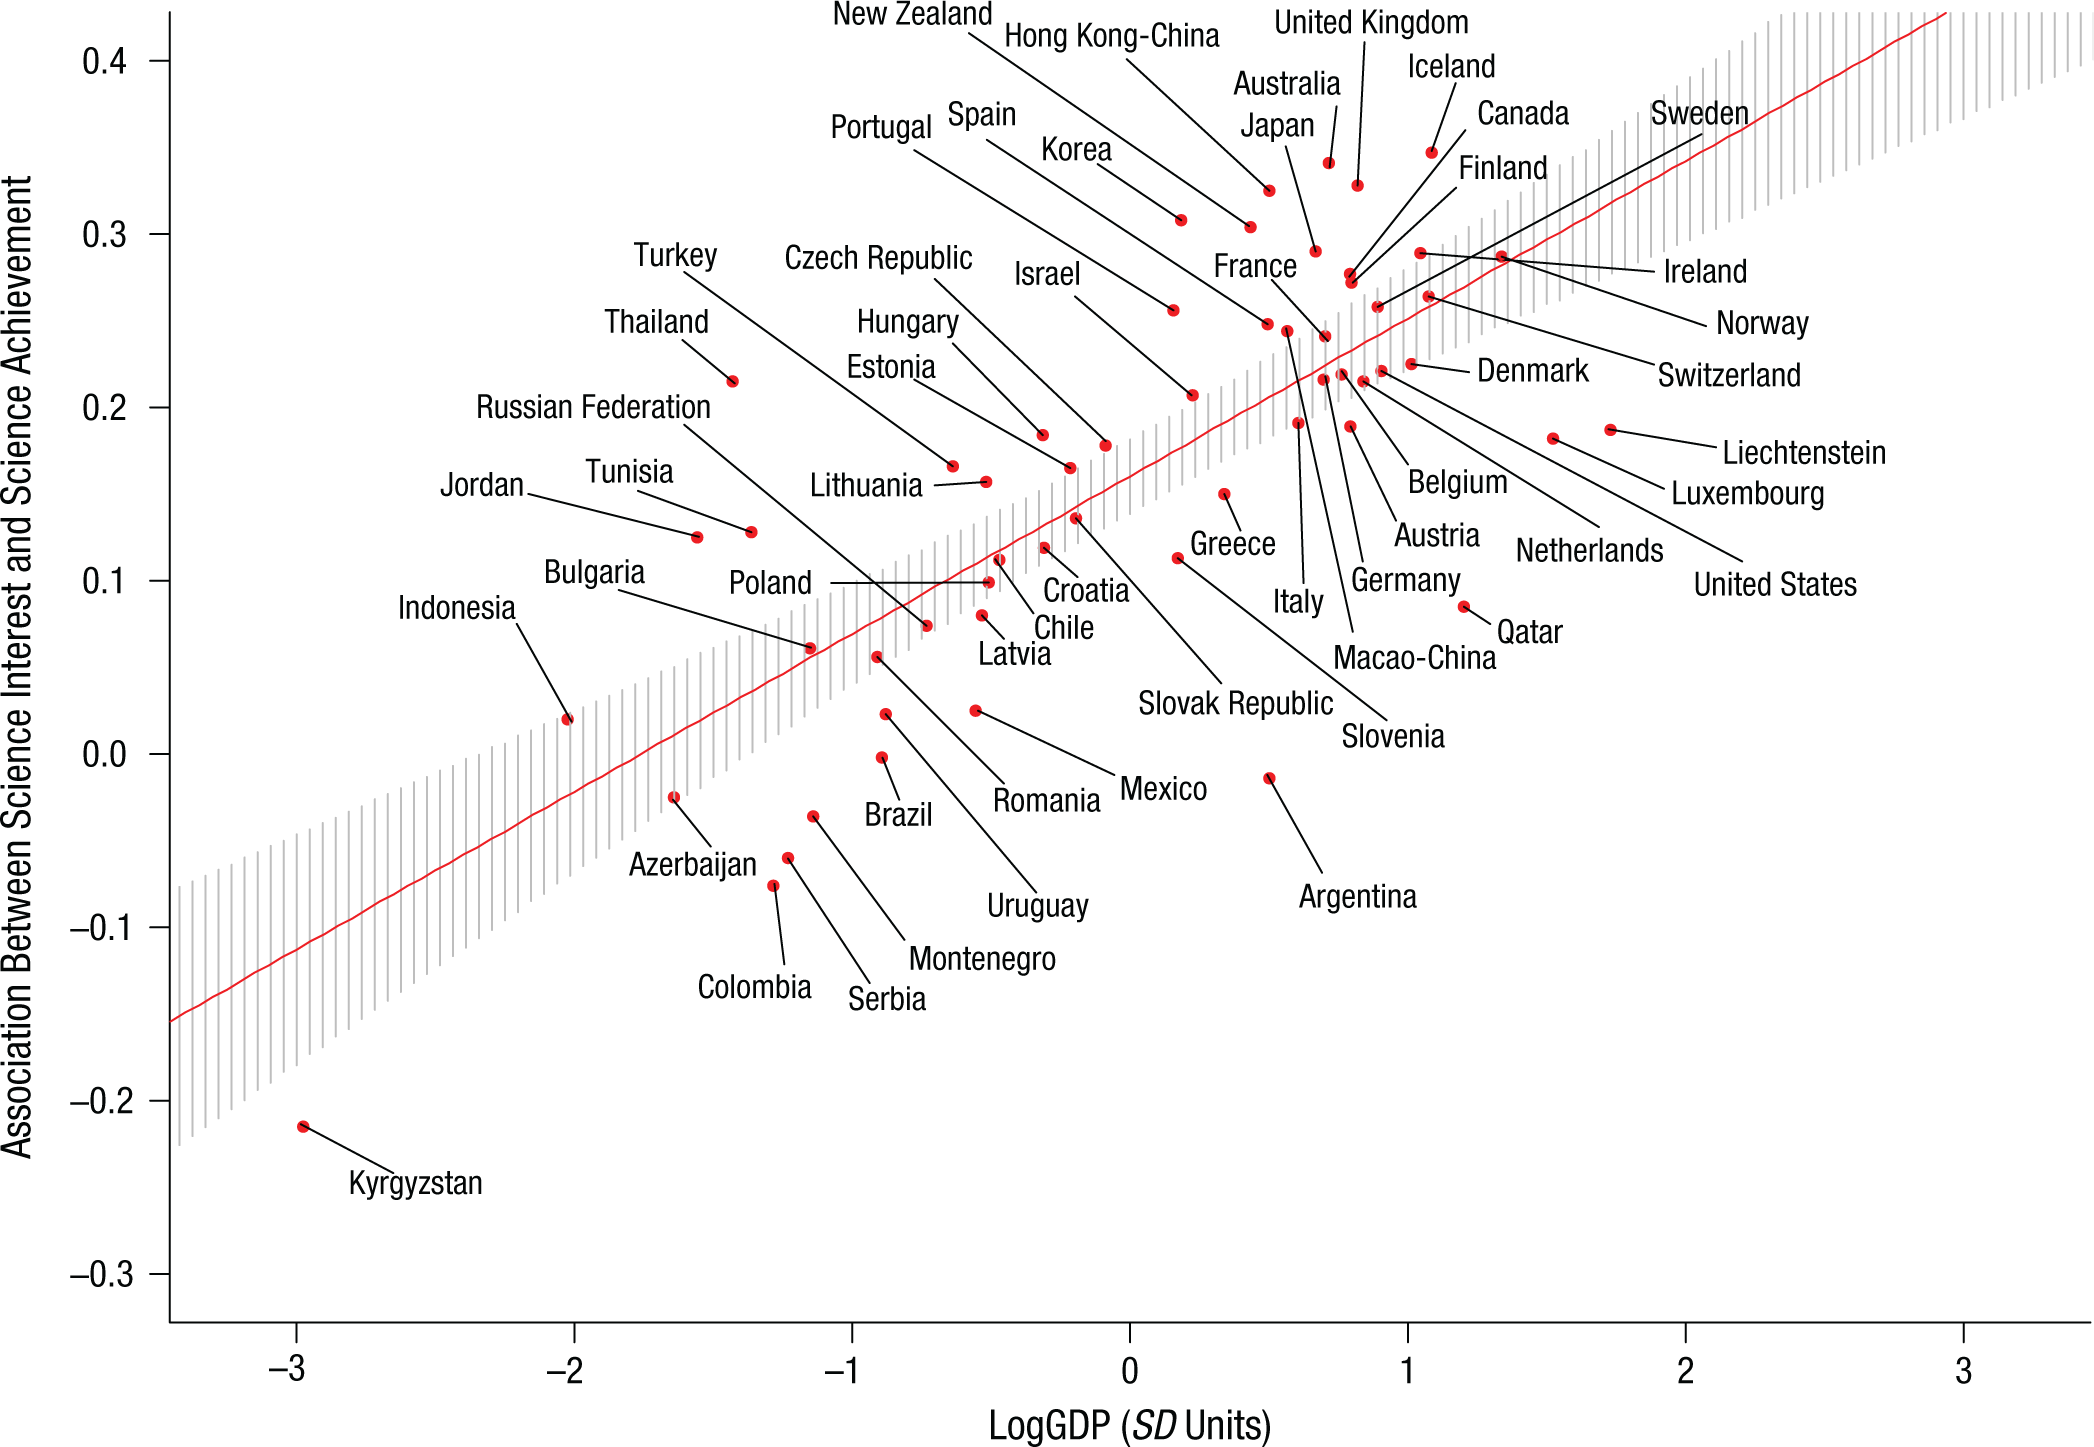
Scatter plot (with best-fitting regression line) showing the relation between log-transformed per capita gross domestic product (logGDP) and the regression coefficient for the association between science interest and science achievement. The shaded area represents the 95% confidence interval. LogGDP is scaled relative to between-country standard deviations. Values on the y-axis are scaled relative to the standard deviation observed in the U.S. subsample.
School-level SES as a mediator of the interaction between family SES and science interest
To test whether school-level SES mediated Family SES × Science Interest interactions, we added school SES and a School SES × Science Interest interaction as predictors. As reported in Table 1, in this model (Model 2), the Family SES × Science Interest interaction was reduced to near zero and the School SES × Science Interest interaction was slightly larger in magnitude than the Family SES × Science Interest interaction in Model 1. Thus, in the sample as a whole, school SES nearly entirely mediated the Family SES × Science Interest interaction. 2 The LogGDP × Science Interest interaction persisted at close to full strength in this model.
Distinguishing SES × Science Interest interactions from nonlinear effects and Expectancy × Value interactions
Nagengast and Marsh (2012) previously reported a nonlinear relation between science interest and science achievement in this data set. Nagengast et al. (2011) previously reported that science interest and science self-concept interacted in the prediction of science motivation (as indexed by enrollment in extracurricular activities and career aspirations) in this data set. To distinguish the SES × Science Interest and LogGDP × Science Interest interactions reported earlier from these previous findings, we added a quadratic term for science interest, a quadratic term for SES, a main effect of science self-concept, and a Science Interest × Science Self-Concept interaction to our model. Results from this model (Model 3) were very similar to those for Model 2 (see Table 1). The School SES × Science Interest and the LogGDP × Science Interest interactions persisted at close to full strength.
Examining other country-level social and economic indices
We found strong positive correlations between the science-interest parameter and the democracy index (r = .574), R&D expenditures (r = .625), social justice (r = .505), and social coherence (r = .625). The results were less consistent for the Gini index (r = −.296) and access to education (r = .228), the two indices that were not strongly correlated with logGDP (r = −.259 and r = .274, respectively). Because of the high multicolinearity between each of these six indicators and logGDP, we used commonality analysis to examine the contributions of each indicator to between-country differences in the association between science interest and science achievement that were shared with and exclusive of logGDP. We chose commonality analysis rather than common factor analysis because we were interested in examining both common and unique effects of each predictor. In this analysis, the regression coefficients on science interest from the multiple-group model were specified as the dependent variable. Results (see Commonality Analysis of Alternative Economic and Political Indicators and Table S4 in the Supplemental Material) indicated that logGDP, but not the other six country-level indicators, had a strong unique influence on the country-specific association between science interest and science knowledge. Variance that logGDP shared with R&D, social coherence, social justice, and the democracy index each explained over 30% of the variance in the science-interest parameter.
Discussion
Previous research on the predictors of academic achievement has routinely highlighted roles for both academic interest and socioeconomic opportunity. Crucially, however, few researchers have examined interactions between these factors. We examined whether differences in family SES, school SES, and national GDP were related to the magnitude of the association between high schoolers’ science interest and their science achievement. Our rationale was that in higher socioeconomic contexts, individuals have greater opportunity to select, evoke, and attend to scientific educational opportunities, whereas in deprived contexts, the process by which students transform their science interest into actual science knowledge is disrupted. As predicted, science interest and family SES interacted in the prediction of science achievement. This Family SES × Science Interest interaction was nearly entirely mediated by an interaction between science interest and school SES.
Moreover, we found considerable evidence for an interaction between individual science interest and national GDP in the prediction of science achievement. The magnitude of the Person × Nation interaction was outstandingly large. The correlation between logGDP and the magnitude of the association between science interest and science achievement was .753. In economically prosperous nations, the association between science interest and science knowledge was approximately .35, but in poorer economies, there was essentially no relation between interest in science and science performance. Thus, at both the intranational and international levels, the joint effect of individual science interest and macroenvironmental opportunity on scientific knowledge is greater than the sum of the individual effects.
Nagengast and colleagues (2011) reported that science interest and science self-concept interacted in the prediction of science motivation, an Expectancy × Value interaction. We found that this Science Interest × Science Self-Concept interaction also held in the prediction of science achievement. It was conceivable that the School SES × Science Interest interaction that was a main focus of the current study was an epiphenomenon of the Expectancy × Value interaction (e.g., it is possible that SES is positively associated with academic concept, and self-concept is the true moderator). However, we found that the School SES × Science Interest interaction persisted at close to full strength after the addition of the Science Interest × Science Self-Concept interaction to the model. In fact, the School SES × Science Interest interaction was approximately double the magnitude of the Science Interest × Science Self-Concept interaction.
Strengths, limitations, and future directions
The current study has a number of important strengths. An extremely large sample was used, with subgroups that were representative of 57 countries. This allowed for precise effect-size estimates, even for cross-level interactions. Further, PISA achievement measures have been well-validated psychometrically and are often used as the gold standard for international comparisons (e.g., Friedman, 2013; Hanushek, 2014). However, our study also has some limitations.
One limitation of the current study is that it is based entirely on correlational data from students at one point in time. For instance, from the current results alone, it is not possible to determine whether SES moderates a causal effect of science interest on science achievement or a causal effect of science achievement on science interest. Notably, however, the current project was preceded by a number of longitudinal studies in single nations, which have demonstrated evidence for cross-lagged effects of interest, and related motivational factors, on later achievement (Marsh & Martin, 2011; Marsh & O’Mara, 2008; Marsh et al., 2005). Thus, the associations between science interest and science achievement documented here are likely to at least partially represent directional effects of science interest on knowledge acquisition.
The issue of direction of causation also applies to the cross-national results. We hypothesized that the association between science interest and science achievement would be stronger in higher GDP countries because national prosperity allows countries to provide more educational opportunities for individuals to pursue their science interest. However, it is also possible that countries with stronger associations between science interest and science achievement (e.g., because of strong cultural emphases on allowing children to pursue their educational interests) become more prosperous over time as a result.
An additional limitation concerns the nature of the school-SES effect. We found that Family SES × Academic Interest interactions, which have been previously reported in the literature (e.g., Tucker-Drob & Briley, 2012), were nearly entirely mediated by School SES × Academic Interest interactions. This finding indicates that, in a statistical sense, disadvantage at the school level is the driving force behind Family SES × Science Interest interactions. However, the precise mechanism underlying this school-SES effect is unknown. School-SES effects may reflect effects of peer composition on individual achievement processes or—because a school’s budget may be directly or indirectly linked to the average SES of its student body—effects of educational resources (e.g., class size, teacher quality, and availability of books, supplies, and technology) on individual achievement processes. It is also possible that school-SES effects are driven by family processes. For example, it is possible that parents who choose to live in higher-income school districts or to send their children to higher-resource schools provide their children with greater extracurricular opportunities for science learning, even when family SES is held constant.
Future research would do well to test proximal mechanisms by which national, school, and family economic advantage might facilitate person-driven learning processes. For example, what national policies and resources allow wealthy countries to better facilitate the transformation of scientific interest into knowledge? A better understanding of the process of how social and economic contexts influence psychological development is crucial to informing policies to promote science achievement and technological competitiveness.
Broader implications
Finally, it is important to discuss the implications of these striking cross-national differences in effect sizes for psychological research more generally. Much psychological research is conducted in positively selected samples (Sears, 1986) from the United States and Western Europe and may therefore not generalize to less-fortunate individuals and individuals living in less-wealthy nations. Indeed, a well-cited meta-analysis (Schiefele, Krapp, & Winteler, 1992) placed the magnitude of the correlation between science interest and science achievement at .35, which is nearly identical to that documented for the wealthiest nations in the PISA sample. Although it may be tempting to interpret meta-analytic estimates as highly generalizable, the current results suggest that such findings may not at all generalize to individuals situated within lower socioeconomic contexts, in which associations between science interest and science achievement are essentially nonexistent. Thus, the current results add to the growing body of evidence (Henrich, Heine, & Norenzayan, 2010; Klein et al., 2014) indicating that substantial heterogeneity in psychological effect sizes is not simply a logical possibility but in many cases an empirical reality.
Footnotes
Acknowledgements
Paige Harden provided helpful feedback and suggestions on this article.
Declaration of Conflicting Interests
The authors declared that they had no conflicts of interest with respect to their authorship or the publication of this article.
Funding
The Population Research Center is supported by National Institutes of Health (NIH) Grant R24HD042849. D. A. Briley was supported by NIH Grant T32HD007081.
Open Practices
All data and materials are publicly available via the Organisation for Economic Co-operation and Development and can be accessed at http://pisa2006.acer.edu.au/downloads.php. The Open Practices Disclosure for this article can be found at http://pss.sagepub.com/content/by/supplemental-data. This article has received badges for Open Data and Open Materials. More information about the Open Practices badges can be found at https://osf.io/tvyxz/wiki/view/ and  .
.
Notes
References
Supplementary Material
Please find the following supplemental material available below.
For Open Access articles published under a Creative Commons License, all supplemental material carries the same license as the article it is associated with.
For non-Open Access articles published, all supplemental material carries a non-exclusive license, and permission requests for re-use of supplemental material or any part of supplemental material shall be sent directly to the copyright owner as specified in the copyright notice associated with the article.
