



Abstract
Discrimination based on weight is a stressful social experience linked to declines in physical and mental health. We examined whether this harmful association extends to risk of mortality. Participants in the Health and Retirement Study (HRS; N = 13,692) and the Midlife in the United States Study (MIDUS; N = 5,079) reported on perceived discriminatory experiences and attributed those experiences to a number of personal characteristics, including weight. Weight discrimination was associated with an increase in mortality risk of nearly 60% in both HRS participants (hazard ratio = 1.57, 95% confidence interval = [1.34, 1.84]) and MIDUS participants (hazard ratio = 1.59, 95% confidence interval = [1.09, 2.31]). This increased risk was not accounted for by common physical and psychological risk factors. The association between mortality and weight discrimination was generally stronger than that between mortality and other attributions for discrimination. In addition to its association with poor health outcomes, weight discrimination may shorten life expectancy.
Unfair treatment based on body weight is stressful (Schvey, Puhl, & Brownell, 2014). A growing literature indicates that perceived weight discrimination is associated with common psychological and physiological correlates of stressful social experiences. People who experience weight discrimination, for example, report more psychological distress, lower well-being, and greater loneliness than people who have not experienced weight discrimination (S. Lewis et al., 2011). Such experiences also take a toll on physical health: Weight discrimination increases obesity risk (Hunger & Tomiyama, 2014; Sutin & Terracciano, 2013), chronic inflammation (Sutin, Stephan, Luchetti, & Terracciano, 2014), and disease burden (Sutin, Stephan, Carretta, & Terracciano, 2015), and it is associated with health-risk behaviors, including avoiding physical activity (Vartanian & Novak, 2011). Many of the diseases associated with obesity (e.g., hypertension, diabetes) are stress-related diseases that may develop, in part, from the stress of discrimination (Muennig, 2008). Indeed, experimental evidence suggests that the experience of weight-based stigma increases blood pressure, reduces cognitive control, and increases food consumption (Major, Eliezer, & Rieck, 2012; Major, Hunger, Bunyan, & Miller, 2014). Consequently, there are significant health correlates to experiencing bias based on body weight, a process that plays out over time (Tomiyama, 2014).
The ultimate cumulative effect of these hostile social interactions may be lower life expectancy. The present research examined whether the harmful effect of weight discrimination reached beyond morbidity to mortality and whether common comorbidities and health-risk behaviors accounted for this association. We also compared weight discrimination with other forms of discrimination (e.g., age, race, sex) to examine whether they share weight discrimination’s association with mortality risk. Finally, we examined whether the association between discrimination and mortality varied by sex, ethnicity, age, or body mass index (BMI). We tested these associations using data from two large longitudinal studies, the Health and Retirement Study (HRS) and Midlife in the United States (MIDUS).
Method
Participants
HRS
Participants were drawn from the HRS, a nationally representative longitudinal study of Americans ages 50 and older. HRS participants were reinterviewed every 2 years. In 2004, the HRS instituted an enhanced face-to-face interview, followed by a psychosocial questionnaire that participants completed at home and returned by mail. Starting in 2006, this questionnaire included items about the experience of everyday discrimination. Half of the participants completed the discrimination measure in 2006; the other half completed it in 2008. These two assessments were combined into a set of baseline data. A total of 13,692 participants (59% female) completed the discrimination measure and had known vital status (i.e., information regarding whether the participant was dead or alive) as of 2012. All participants with relevant data were included in the analysis (i.e., discrimination, vital status, and demographic covariates). At baseline, these participants were, on average, 68.33 years old (SD = 10.48) old and had an average of 12.58 years (SD = 3.11) of education; the sample was 84% White, 13.0% Black, and 3% other ethnicities. The University of Michigan’s institutional review board approved the use of human subjects; the analyses were also approved by the institutional review board at Florida State University. HRS data are publicly available at http://hrsonline.isr.umich.edu.
MIDUS
Participants were also drawn from the MIDUS study. The first wave of the MIDUS collected survey data from a total of 7,108 English-speaking adults in the United States ages 20 to 74 years. At the baseline assessment, collected in 1995 to 1996, participants completed a 30-min telephone interview and a self-administered questionnaire that included the discrimination measure. A total of 5,079 participants (53% female) completed the discrimination measure and either completed the MIDUS II assessment in 2004 to 2005 or were confirmed deceased as of 2007. As with the HRS, all participants with relevant data were included in the analysis (i.e., discrimination, vital status, and demographic covariates). At baseline, these participants were, on average, 47.86 years old (SD = 12.91) and had an average of 14.15 years (SD = 2.57) of education; the sample was 91% White, 4% Black, and 5% other ethnicities. The institutional review boards at the University of Wisconsin–Madison; University of California, Los Angeles; and Georgetown University approved the use of human subjects for the MIDUS data collection; the analyses were also approved by the institutional review board at Florida State University. MIDUS data are publicly available at http://www.midus.wisc.edu.
Measures
Everyday discrimination
Participants rated their experiences with everyday discrimination (Williams, Yu, Jackson, & Anderson, 1997) and then attributed those experiences to a number of personal characteristics (Kessler, Mickelson, & Williams, 1999). Specifically, participants were asked, “In your day-to-day life how often have any of the following things happened to you?” In the HRS, participants rated five items (e.g., “You are treated with less courtesy or respect than other people”) on a scale from 1 (almost every day) to 6 (never). In the MIDUS, participants answered these same five items plus three additional items using a scale from 1 (often) to 4 (never). After making these ratings, participants were asked what they believed were the reasons for these experiences. In the HRS, participants could attribute unfair treatment (yes/no) to one or more characteristics, including ancestry or national origin, gender, race, age, weight, a physical disability, appearance, or sexual orientation. The attributions were similar in the MIDUS questionnaire, except that one option inquired about height or weight rather than weight only, and another option asked about ethnicity or nationality rather than ancestry or national origin. Participants could choose as many or as few attributions as necessary. This measure has been used successfully to examine the effect of race discrimination (Purnell et al., 2012) and gender discrimination (Borrell et al., 2010) on smoking, to track trends in weight discrimination over time (Andreyeva, Puhl, & Brownell, 2008), and to document the correlates of weight bias (Krukowski et al., 2009).
Mortality
The National Death Index (U.S. Centers for Disease Control and Prevention, 2015) or a household proxy report was used to confirm the target participant’s vital status; death dates were accurate to within 1 month. In the HRS, vital status for each participant was available through 2012 from either the NDI or the 2012 assessment. Some information about participants’ vital status was obtained by personal communication between their family members and the HRS staff in 2013. Survival time was computed from the month of the baseline interview (i.e., in 2006 or 2008) to the month of the last interview or death. In the MIDUS, updated vital status information was available through 2007. Survival time was computed from the day of the baseline interview to the month of the last interview or death.
Covariates
We included a number of covariates in the analyses to examine whether poor physical and psychological health could explain part of the association between discrimination and mortality. Because of BMI’s curvilinear association with mortality (Flegal, Kit, & Graubard, 2014), it was dummy-coded into categories, a standard approach in epidemiology (Flegal, Kit, Orpana, & Graubard, 2013). The categories were underweight (BMI < 18.50 kg/m2), overweight (BMI ≥ 25 but < 30 kg/m2), obese (BMI ≥ 30 but < 40 kg/m2), and morbidly obese (BMI ≥ 40 kg/m2); normal weight (BMI ≥ 18.50 but < 25 kg/m2) was the reference group. Subjective health was measured with a single item in the HRS, “Would you say your health is excellent, very good, good, fair, or poor?” Responses ranged from 1 (excellent) to 5 (poor). In the MIDUS, the single item was, “In general, would you say your physical health is . . .” responses ranged from 1 (poor) to 5 (excellent) and were reverse-scored to match the HRS. A detailed medical history was used to calculate disease burden as the sum of 8 diagnoses in the HRS and 30 chronic conditions in the MIDUS. Depressive symptoms were measured in the HRS with an eight-item version of the Centers for Epidemiological Studies Depression Scale and with a seven-item measure in the MIDUS. Respondents were coded as having a positive history of smoking if they had ever smoked. Moderate physical activity in the HRS was measured with the item, “And how often do you take part in sports or activities that are moderately energetic?” Moderate physical activity in the MIDUS was the mean of two items on the frequency of moderate physical activity in a month. These covariates were measured at the same time as the everyday discrimination scale at baseline in both studies. See Table 1 for descriptive statistics for these variables in the HRS and the MIDUS, respectively.
Unweighted Descriptive Statistics for the Health and Retirement Study (HRS) and Midlife in the United States (MIDUS) Study Samples
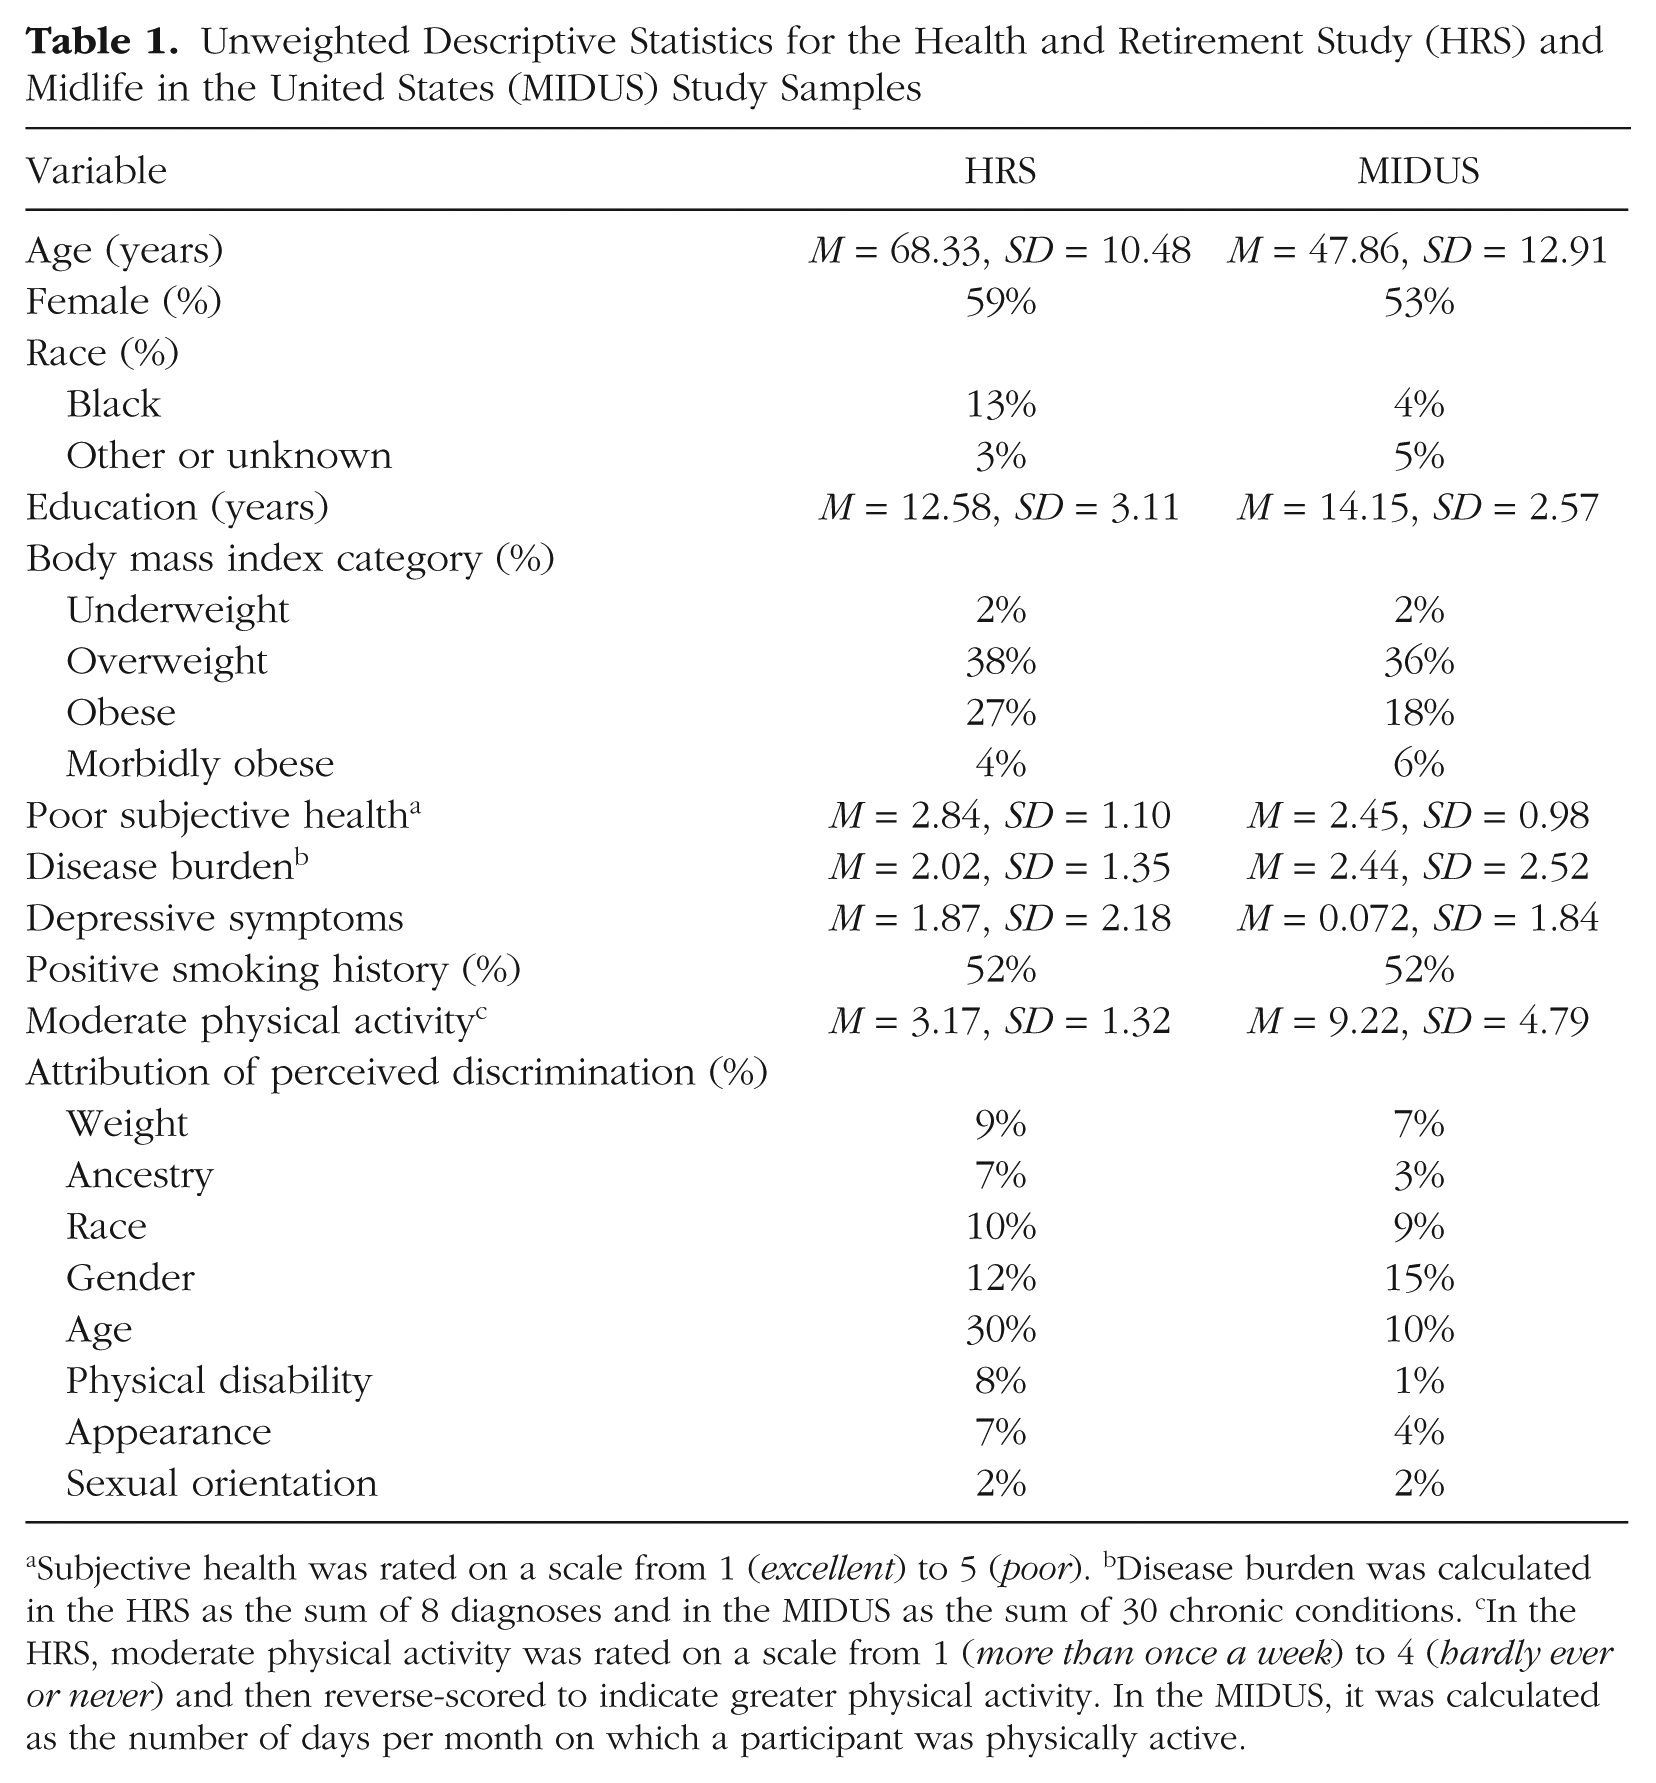
Subjective health was rated on a scale from 1 (excellent) to 5 (poor). bDisease burden was calculated in the HRS as the sum of 8 diagnoses and in the MIDUS as the sum of 30 chronic conditions. cIn the HRS, moderate physical activity was rated on a scale from 1 (more than once a week) to 4 (hardly ever or never) and then reverse-scored to indicate greater physical activity. In the MIDUS, it was calculated as the number of days per month on which a participant was physically active.
Statistical analysis
Cox proportional hazards regression analysis was used to test whether discrimination was associated with mortality risk. Time to event was defined as time (in years) from the discrimination assessment to death or to the date at which the data were right-censored. We tested three progressively restrictive models. Model 1 controlled for age, gender, race, and education to show the association between discrimination and mortality, controlling only for basic demographic characteristics. Model 2 controlled for the same demographic characteristics and for BMI category. The purpose of Model 2 was to test whether any association between weight discrimination and mortality was independent of BMI. Model 3 included the covariates from Model 2 plus the clinical and behavioral risk factors: subjective health, disease burden, depressive symptoms, smoking history, and physical activity. The purpose of Model 3 was to test whether the association between discrimination and mortality remained after we controlled for common comorbidities that also increase risk of mortality. We tested weight discrimination and the other attributions for discrimination to examine whether the effects of discrimination were limited to specific attributions or increased risk broadly. The attributions were entered separately into the model. We also tested sex (1 = female, 0 = male), race (1 = Black, 0 = White), 1 age, and BMI as moderators of the discrimination-mortality relation. The analyses were conducted using SPSS, and we meta-analytically combined the hazard ratios (HRs) from the two studies (weighted by sample size) using the software Comprehensive Meta-Analysis (Biostat, Englewood, NJ).
Results
In the HRS, across the median follow-up of 4.42 years (range = 1–84 months), totaling 65,513 person-years, 15% of the sample died (n = 2,003). In the MIDUS, across the median follow-up of 8.97 years (range = 2–145 months), totaling 44,078 person-years, 9% of the sample died (n = 476). Controlling for the demographic characteristics, discrimination based on weight was associated with an increase in mortality risk of nearly 60% in both the HRS (Table 2) and the MIDUS (Table 3). The combined meta-analytic HR was 1.57 (95% confidence interval, or CI = [1.36, 1.82]). In both samples, BMI, subjective health, disease burden, depressive symptoms, smoking history, and physical activity reduced this association but did not eliminate it. Although the association in the MIDUS sample was reduced to nonsignificance (p = .15), the strength of the association was nearly identical to that in the HRS sample, and the combined meta-analytic HR was similar and significant (HR = 1.32, 95% CI = [1.12, 1.55]).
Results of the Proportional Hazards Regression Analysis of the Association Between Mortality Risk and Perceived Discrimination in the Health and Retirement Study (HRS) Sample
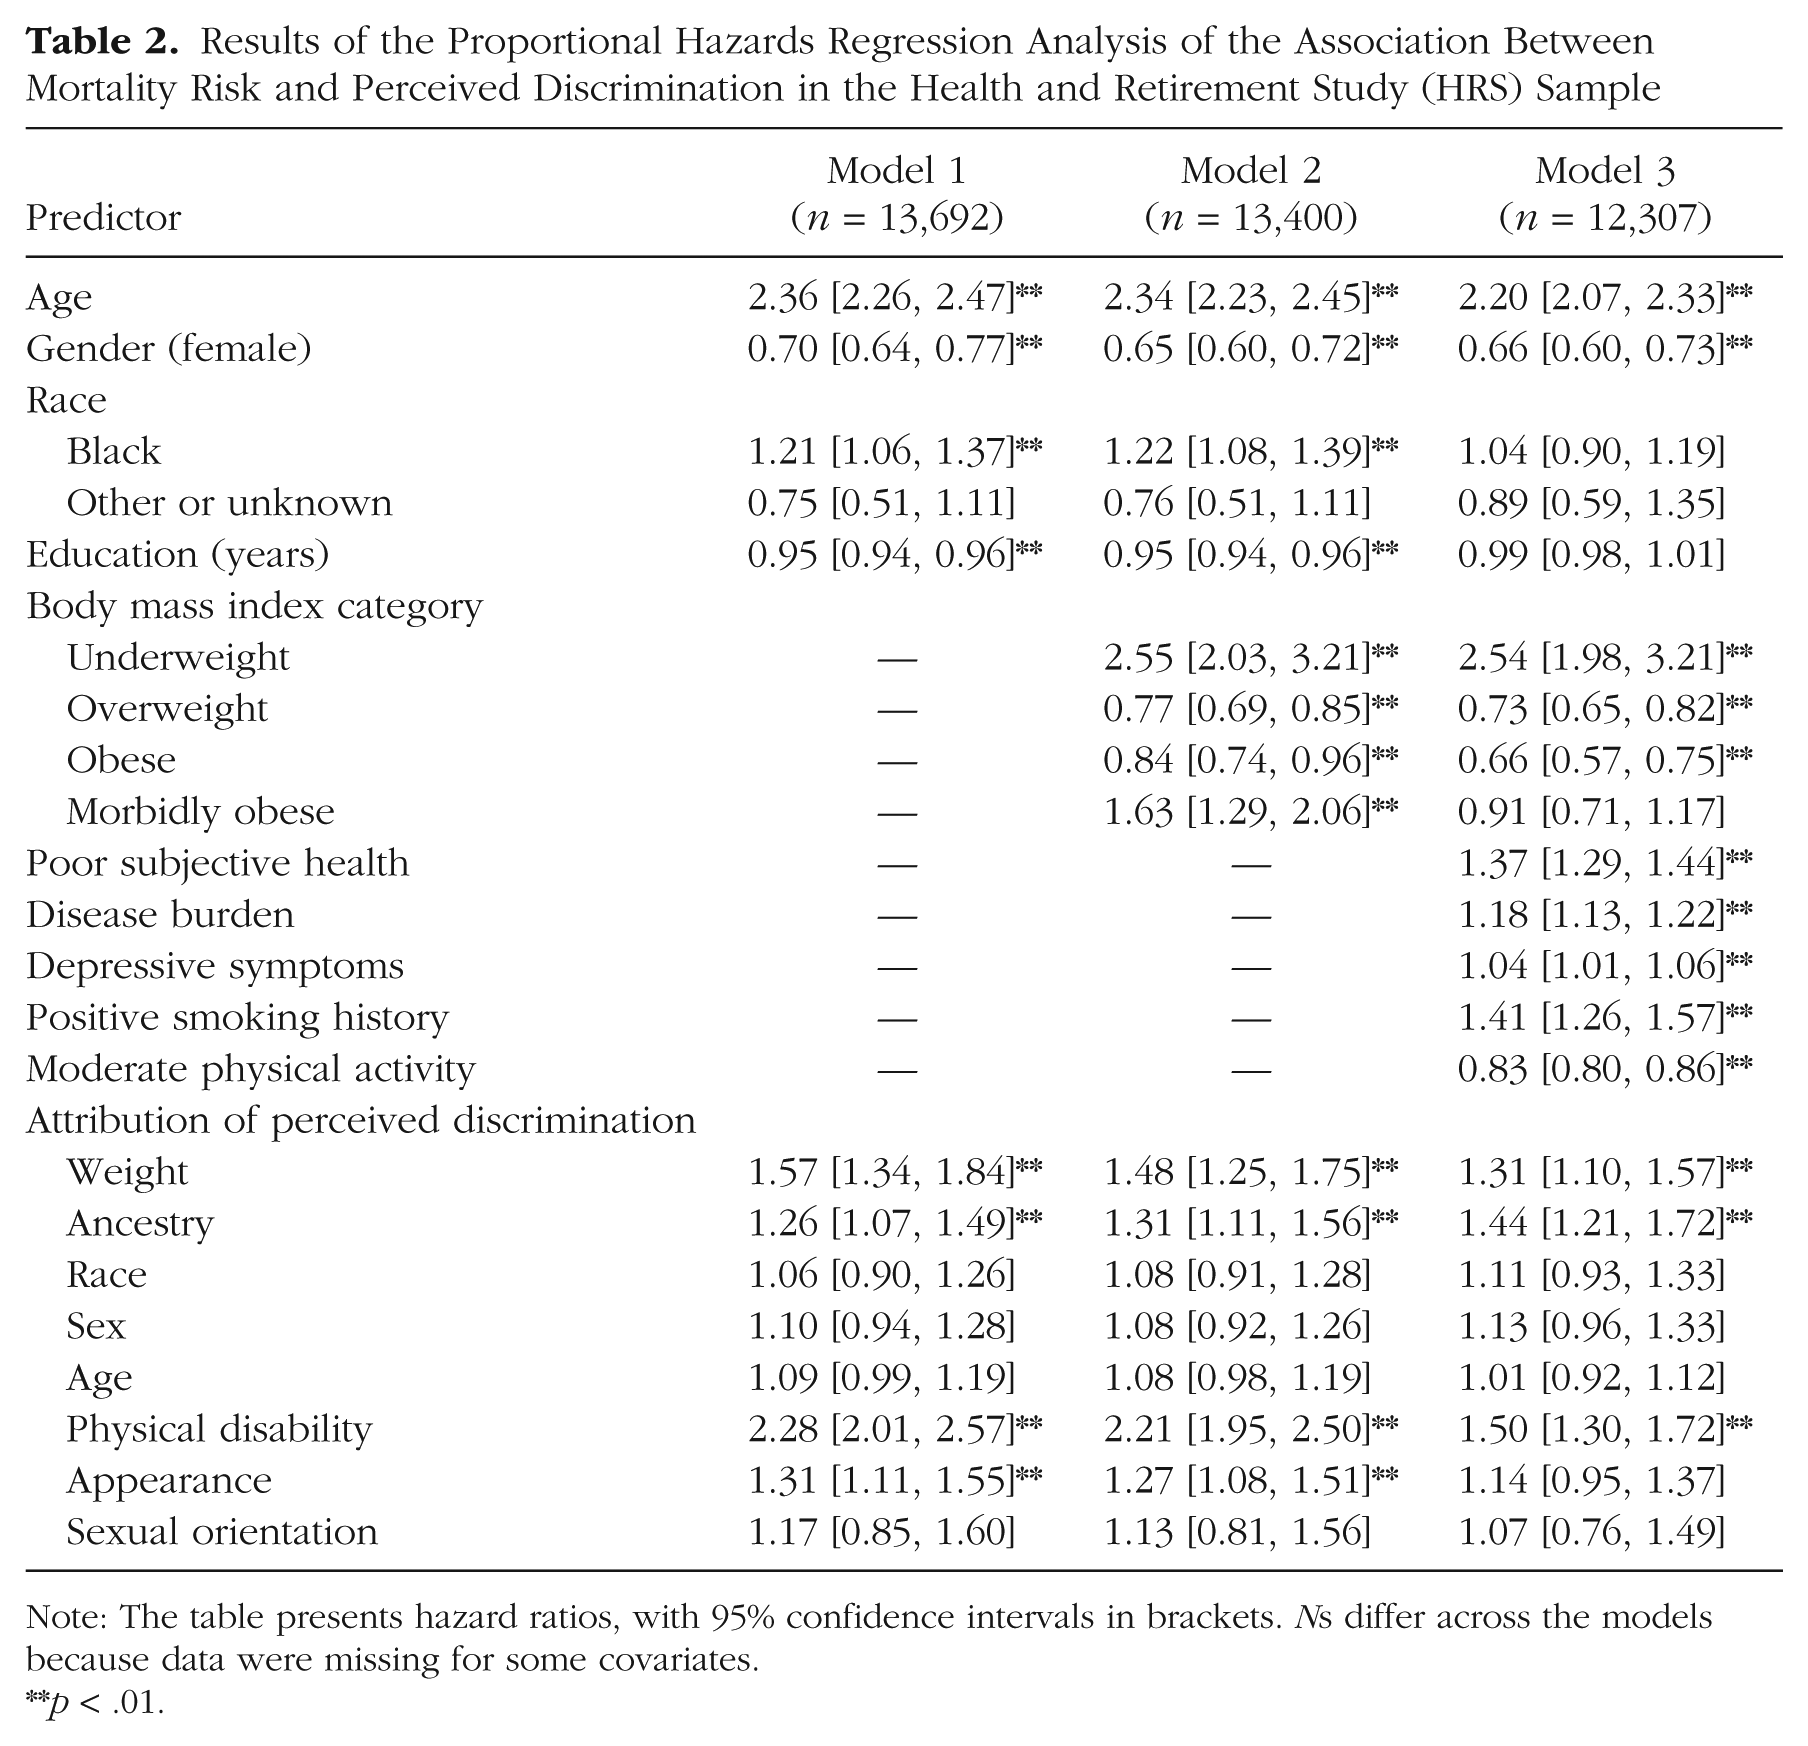
Note: The table presents hazard ratios, with 95% confidence intervals in brackets. Ns differ across the models because data were missing for some covariates.
p < .01.
Results of the Proportional Hazards Regression Analysis of the Association Between Mortality Risk and Perceived Discrimination in the Midlife in the United States (MIDUS) Study Sample
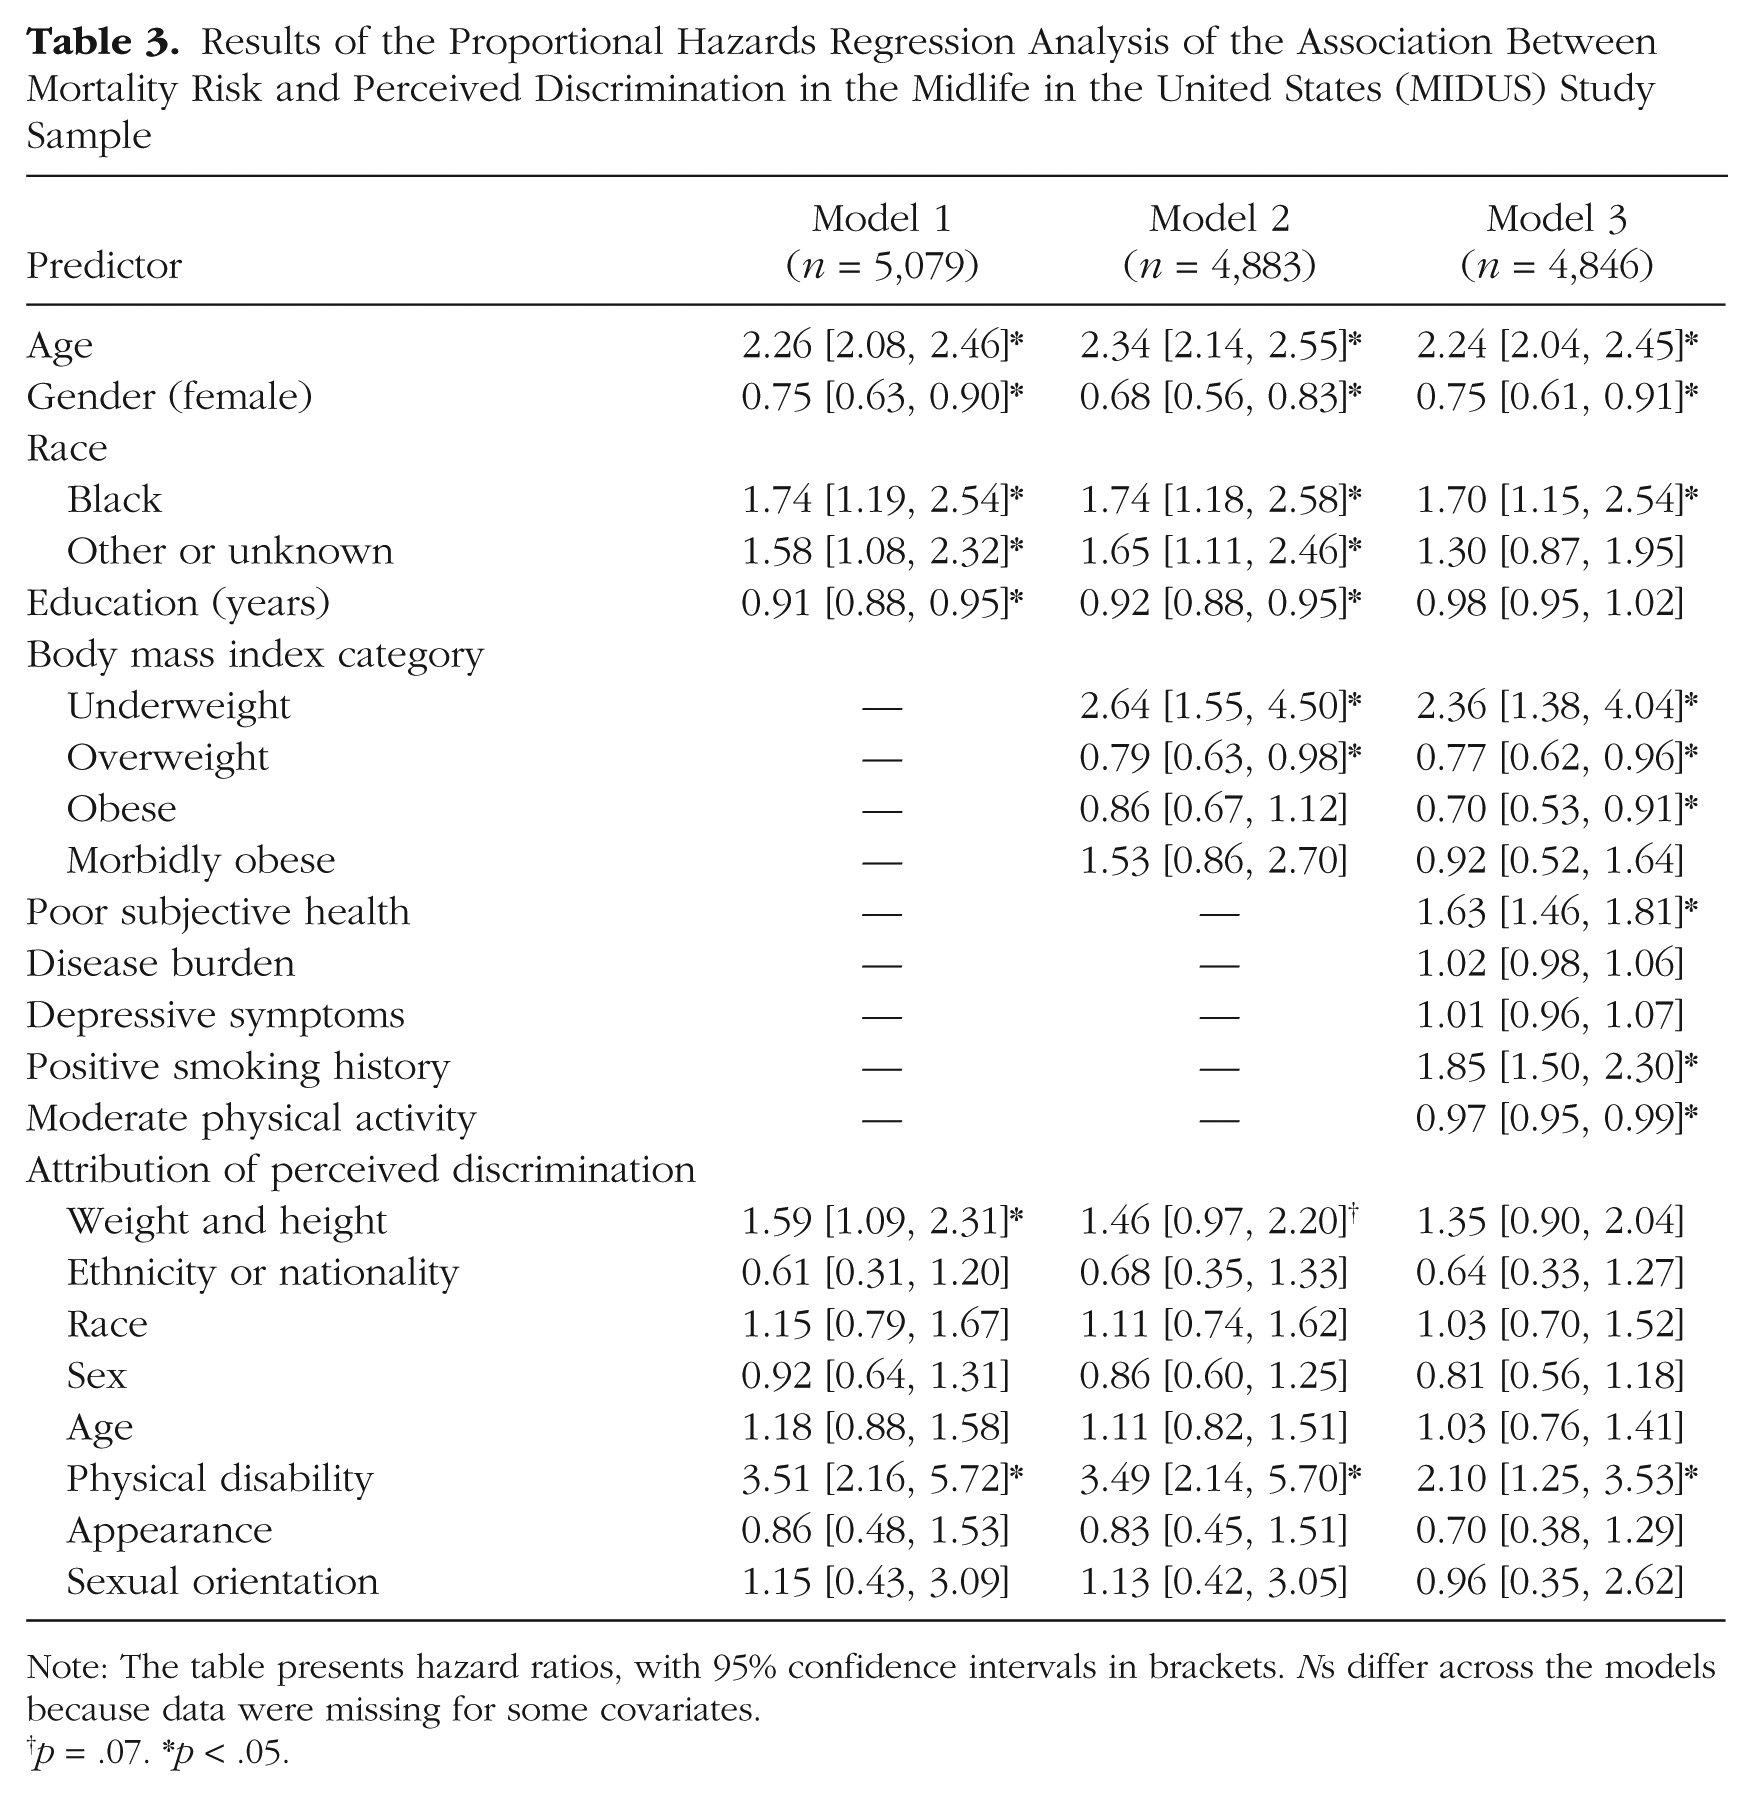
Note: The table presents hazard ratios, with 95% confidence intervals in brackets. Ns differ across the models because data were missing for some covariates.
p = .07. *p < .05.
Demographic moderators
The risk associated with weight discrimination was slightly stronger for Black participants (HRS: HR = 1.91, 95% CI = [1.35, 2.71]; MIDUS: HR = 2.46, 95% CI = [0.92, 6.54]) than for White participants (HRS: HR = 1.50, 95% CI = [1.25, 1.80]; MIDUS: HR = 1.52, 95% CI = [1.00, 2.31]), but the Race × Weight Discrimination interaction was not significant (HRS: HR = 1.46, 95% CI = [0.99, 2.14]; MIDUS: HR = 1.72, 95% CI = [0.60, 4.91]). The interaction of weight discrimination with age was not significant in either study (HRS: HR = 0.85, 95% CI = [0.73, 1.00]; MIDUS: HR = 0.98, 95% CI = [0.73, 1.34]). The same was true of the interaction of weight discrimination with gender (HRS: HR = 1.07, 95% CI = [0.78, 1.47]; MIDUS: HR = 1.15, 95% CI = [0.54, 2.45]). Finally, an interaction of weight discrimination with BMI in the MIDUS sample indicated that the risk of mortality increased at higher BMI, but this interaction was not apparent in the HRS sample (HRS: HR = 1.02, 95% CI = [0.99, 1.04]; MIDUS: HR = 1.08, 95% CI = [1.02, 1.14]). These results suggested that weight discrimination conferred similar risk, regardless of age or gender, but might be slightly stronger for Black than for White participants and for participants at a higher BMI.
Discrimination based on characteristics other than weight
We next examined whether the other attributions for discrimination were associated with mortality risk. Of these attributions, discrimination based on a physical disability had the strongest association with risk of mortality (Model 1). The positive association between mortality and discrimination based on a physical disability was stronger among younger than older participants in the HRS sample, but this Age × Physical Disability Discrimination interaction did not appear in the MIDUS sample (HRS: HR = .70, 95% CI = [0.63, 0.79]; MIDUS: HR = 0.94, 95% CI = [0.56, 1.58]). Gender, race, and BMI did not moderate this association in either sample. The mortality risk was still apparent after controlling for the clinical and behavioral risk factors (Model 3).
In addition to weight and a physical disability, discrimination based on “ancestry or national origin” was associated with increased mortality risk in the HRS sample, but the similar attribution in the MIDUS sample (“ethnicity or nationality”) was unrelated to mortality risk in that sample. Although there was no main effect of race discrimination on mortality, there was an interaction between race discrimination and race in the HRS sample, HR = 0.62, 95% CI = [0.44, 0.86]: Discrimination based on race was associated with mortality among White participants (HR = 1.37, 95% CI = [1.10, 1.71]) but not among Black participants (HR = 0.80, 95% CI = [0.62, 1.02]). This interaction was not significant in the MIDUS, HR = 0.50, 95% CI = [0.21, 1.18], but there was a similar pattern across White participants (HR = 1.51, 95% CI = [0.98, 2.34]) and Black participants (HR = 0.77, 95% CI = [0.33, 1.79]). Although this result was surprising, a previous study reported a similar finding (Barnes et al., 2008).
There was little evidence for the remaining attributions. Discrimination based on appearance in the HRS sample was associated with mortality in the model controlling for basic demographic covariates but not in the fully adjusted model; it was unrelated to mortality in the MIDUS sample. Discrimination based on gender, age, or sexual orientation was unrelated to mortality risk in either sample. None of these associations differed by gender, race, or age.
Discussion
The present findings indicate that the harmful effect of unfair treatment that is attributable to body weight is not limited to psychological distress and morbidity: It also extends to risk of mortality. This association was apparent in two independent samples that covered different periods of the life span, and the association persisted after we accounted for behavioral and clinical risk factors. The effect of weight discrimination on mortality was generally stronger than that of other forms of discrimination but was comparable with that of other established risk factors, such as smoking history and disease burden. Moreover, the association between weight discrimination and mortality risk was in sharp contrast to the protective relation between some of the BMI categories and mortality risk. These findings suggest the possibility that the stigma associated with being overweight is more harmful than actually being overweight.
The exact mechanisms through which weight discrimination contributes to mortality remain to be determined. A growing literature indicates that weight discrimination is associated with behavioral risk factors, such as a sedentary lifestyle, as well as comorbidities that partly explain the association with mortality risk. But the psychological and physiological costs of unfair treatment are not fully captured by common comorbidity measures (e.g., depressive symptoms, disease burden). Other consequences of weight discrimination, such as social isolation (S. Lewis et al., 2011), economic losses (Puhl & Heuer, 2009), and reduced quality of health care (Phelan et al., 2015), are also likely to play a role.
It was somewhat surprising that, with one exception, none of the other attributions for discrimination was associated with mortality consistently across the samples. The experience of weight discrimination may have unique aspects that increase mortality risk but are not shared with other attributions. For example, the perpetrators of weight discrimination are sometimes loved ones who would typically provide social support in stressful situations (Boyes & Latner, 2009). That is, instead of the support that would buffer stress, close others may be the source of the stress. In addition, given that weight is largely perceived to be controllable, unfair treatment because of body weight may lead to feelings of shame because of the perception that people should do something about their weight. These feelings may be compounded by the ambivalence many people feel about their desire to lose weight (for aesthetics or health reasons) and health-care providers’ messages aimed at weight loss (Brown & McClimens, 2012). These mechanisms, however, are speculative and need to be tested in future research.
Discrimination based on a physical disability was the only other attribution associated with mortality risk across both samples. Individuals with a physical disability may be both more ill and more vulnerable to discrimination than adults without such disabilities. However, we could not identify which respondents considered themselves disabled. Supplementary analysis on common markers of disability in the HRS (i.e., limitations in activities of daily living, limitations in instrumental activities of daily living, and identifying as not working because of a disability) reduced but did not eliminate the association between mortality and discrimination based on a disability (HR = 1.36, 95% CI = [1.18, 1.57], p < .01). It is possible that the discrimination measure conflated disability-related morbidity with the stigma of disability. Thus, the relation between discrimination based on a physical disability and mortality may reflect the effect of the disability rather than particularly harmful discriminatory experiences. In light of this limitation, this association should be interpreted with caution.
We found some evidence that discrimination based on race was associated with mortality for White but not Black participants. These counterintuitive findings are consistent with those from other studies (Albert et al., 2010; Barnes et al., 2008) but need to be interpreted within a broader context that may obscure the relation between race discrimination and mortality. First, there may be a survival effect, such that Blacks who survive to old age are particularly resilient against the harmful effects of discrimination (Jackson et al., 2011). There are also differences in socioeconomic status among the groups who report discrimination based on race: Blacks with higher socioeconomic status tend to report more discrimination, whereas Whites with lower socioeconomic status tend to report more discrimination (Purnell et al., 2007). The association between race discrimination and mortality may thus reflect class in addition to perceived experiences. Most important, systemic racism, rather than individual experiences with discrimination, may be more harmful for health. Structural racism, for example, increases risk of morbidity (Lukachko, Hatzenbuehler, & Keyes, 2014) and mortality (Chae et al., 2015), and such inequities (e.g., residential segregation, access to care) may pose greater mortality risk than an individual’s perceived experiences with discrimination. The complexity of race discrimination also may not be captured by a brief measure of discrimination, as was used here, and individuals from different racial background may not respond to such measures in similar ways (T. T. Lewis, Yang, Jacobs, & Fitchett, 2012).
No significant associations were found for the remaining attributions across both samples. The lack of association was particularly surprising for age discrimination, because it has previously been linked with increases in disease burden across old age (Sutin et al., 2015). There may be buffering factors that protect against diseases ultimately resulting in death. Alternatively, perhaps not enough time elapsed from the development of disease associated with age discrimination to have an effect on mortality risk. It was likewise surprising that discrimination based on gender or sexual orientation was unrelated to mortality. Women tend to live longer and lead healthier lifestyles, which may be protective against the stress of discrimination. The low prevalence of discrimination based on sexual orientation may limit the power to detect an effect, and structural stigma may pose greater risk for mortality than individual experiences with discrimination (Hatzenbuehler et al., 2014). Longer follow-up intervals and more diverse samples are needed to adequately address how these attributions contribute to greater mortality risk.
Note that our measure of discrimination was brief and did not assess the frequency, intensity, or timing of the unfair treatment. In addition, in the MIDUS questionnaire, the item asking about discrimination attributable to weight included height as well, which participants may have interpreted differently than the item in the HRS, which mentioned only weight. Even with such a brief measure that was slightly different across the studies, however, weight discrimination was associated with increased mortality risk in two independent samples. This finding points to the importance of weight as a source of social stress with significant consequences for health. To expand on initial evidence, future research needs to better delineate how the timing and course of how weight discrimination contributes to mortality risk. Future research also needs to use alternative measures of adiposity, given the inherent limitations of BMI.
Overall, this research suggests that unfair treatment on the basis of body weight increases mortality risk. There is a pervasive belief that shaming individuals for their weight motivates weight loss. The consequences of this mistaken belief are now clear: Growing evidence suggests that weight bias does not work (Sutin & Terracciano, 2013), it leads to greater morbidity (Sutin et al., 2015) and, now, greater mortality.
Footnotes
Declaration of Conflicting Interests
The authors declared that they had no conflicts of interest with respect to their authorship or the publication of this article.
Funding
This research was supported by Grant 1R15-HD083947 from the Eunice Kennedy Shriver National Institute of Child Health and Human Development (to A. R. Sutin). The Health and Retirement Study (HRS) is sponsored by National Institute on Aging Grant U01-AG009740 and conducted by the University of Michigan. The Midlife in the United States Study (MIDUS) I was supported by the John D. and Catherine T. MacArthur Foundation Research Network on Successful Midlife Development. The MIDUS II research was supported by National Institute on Aging Grant P01-AG020166 to conduct a longitudinal follow-up of the MIDUS I investigation. The authors received no direct financial support from the HRS or MIDUS grants for this research.
Open Practices
All data and materials for the Midlife in the United States Study (MIDUS) have been made publicly available and can be accessed at http://midus.colectica.org. All data and materials for the Health and Retirement Study (HRS) have been made publicly available at http://hrsonline.isr.umich.edu/. The complete Open Practices Disclosure for this article can be found at http://pss.sagepub.com/content/by/supplemental-data. This article has received badges for Open Data and Open Materials. More information about the Open Practices badges can be found at https://osf.io/tvyxz/wiki/1.%20View%20the%20Badges/ and  .
.
Notes
References
Supplementary Material
Please find the following supplemental material available below.
For Open Access articles published under a Creative Commons License, all supplemental material carries the same license as the article it is associated with.
For non-Open Access articles published, all supplemental material carries a non-exclusive license, and permission requests for re-use of supplemental material or any part of supplemental material shall be sent directly to the copyright owner as specified in the copyright notice associated with the article.
