
Abstract
Understanding how and when cognitive change occurs over the life span is a prerequisite for understanding normal and abnormal development and aging. Most studies of cognitive change are constrained, however, in their ability to detect subtle, but theoretically informative life-span changes, as they rely on either comparing broad age groups or sparse sampling across the age range. Here, we present convergent evidence from 48,537 online participants and a comprehensive analysis of normative data from standardized IQ and memory tests. Our results reveal considerable heterogeneity in when cognitive abilities peak: Some abilities peak and begin to decline around high school graduation; some abilities plateau in early adulthood, beginning to decline in subjects’ 30s; and still others do not peak until subjects reach their 40s or later. These findings motivate a nuanced theory of maturation and age-related decline, in which multiple, dissociable factors differentially affect different domains of cognition.
Keywords
Early IQ tests lumped all persons more than 16 years old into the homogeneous category “adult” (Matarazzo, 1972). While it is now recognized that changes in cognition occur late in life, many researchers and laypeople share the intuition that there is some broad age range, after development but before senescence, at which individuals’ cognitive ability is stable (neither improving nor declining)—an intuition that is reflected in studies of cognitive function relying on “typical adults” (usually 18–35 years old).
Nonetheless, it has long been known that this intuition cannot be quite right: Scores for fluid intelligence (e.g., short-term memory) peak early in adulthood, whereas scores for crystalized intelligence (e.g., vocabulary) peak in middle age (Bayley, 1970; Doppelt & Wallace, 1955; Fox & Birren, 1949; Shakow & Goldman, 1938; Sorenson, 1933). Even this may be too simple: Recent evidence shows that whereas short-term memory for names and inverted faces peaks around the age of 22 years, neither short-term memory for faces nor quantity discrimination peaks until around the age of 30, a fact difficult to assimilate into the fluid-/crystalized-intelligence dichotomy (Germine, Duchaine, & Nakayama, 2011; Halberda, Ly, Wilmer, Naiman, & Germine, 2012). Whether face memory and quantity discrimination are exceptions to the fluid/crystalized rule or represent more systematic and previously unrecognized patterns of age-related difference is an open question.
Comparing age of peak performance across cognitive domains has several uses. If age of peak performance is indeed far more variable than the fluid-/crystalized-intelligence distinction implies, that suggests that the fluid-/crystalized-intelligence construct needs revision (cf. Hampshire, Highfield, Parkin, & Owen, 2012). More generally, distinct ages of peak performance for two tasks suggest distinct underlying mechanisms. Delineating age of peak performance also informs research methodology: The widespread use of college students as control subjects for development or aging studies may not be appropriate for functions that are still maturing at 18 years or are already showing evidence of age-related decline. Finally, understanding the dynamics of age-related cognitive change can lead to more optimized educational interventions and methods of identifying and addressing age-related cognitive decline and quality of life among elder members of the population.
Despite increased interest in identifying and understanding differences in age of peak performance, there has been little progress in determining which ages of peak performance are reliably different from one another (cf. Ardila, 2007; Doppelt & Wallace, 1955; Halberda et al., 2012; Kaufman, 2001; Lee, Gorsuch, Saklofske, & Patterson, 2008; Murre, Janssen, Rouw, & Meeter, 2013; Salthouse, 2003; Wisdom, Mignogna, & Collins, 2012; but see Germine et al., 2011). Two main difficulties include lack of access to data sets of sufficient scale and lack of statistically sound methods for quantitatively comparing ages of peak performance.
In the present experiments, we addressed both issues. We used modern statistical analysis techniques to compare age of peak performance across 30 different cognitive tasks. To achieve sufficient sample size, we combined novel reanalyses of normative data from standardized tests with findings from new, massive Internet-based samples. We found similar results across data sets, which strengthens confidence in the validity and reliability of the findings.
In contrast to researchers in many life-span studies who have employed factor analysis to control random noise and other nuisance factors, we took the approach more commonly used in developmental psychology and cognitive neuroscience: Employ well-understood tasks that are purposefully chosen because their results are expected to dissociate. This allowed us to treat unshared variance among tasks as potential sources of signal, rather than noise, with differences resulting from random noise addressed by our very large samples. This was the preferred approach given our specific hypotheses about potential domain-specificity in ages of peak performance (cf. Wilmer et al., 2012).
Experiment 1: Reanalysis of Standardized Tests
Method
To examine the degree of heterogeneity in age of peak performance, we first analyzed published, demographically stratified normative data from two standardized test batteries: the third edition of the Wechsler Adult Intelligence Scale (WAIS-III; Wechsler, 1997a), a widely used intelligence test consisting of 14 subtests tapping a range of mental abilities, and the third edition of the Wechsler Memory Scale (WMS-III; Wechsler, 1997b), which consists of 16 subtests tapping different aspects of short-term and long-term memory. The subtests are described in Table 1. 1 The WAIS-III sample consisted of 2,450 healthy, cognitively unimpaired Americans between the ages of 16 and 89 years who were recruited in geographically diverse locations (200 participants in each of the following age bins: 16–17, 18–19, 20–24, 25–29, 30–34, 35–44, 45–54, 55–64, 65–69, 70–74, and 75–79 years; 150 between 80 and 84 years; 100 between 85 and 89 years). The WMS-III sample consisted of exactly half as many at each age.
Descriptions of Subtests in the WAIS-III and WMS-III Used in Experiments 1 and 2
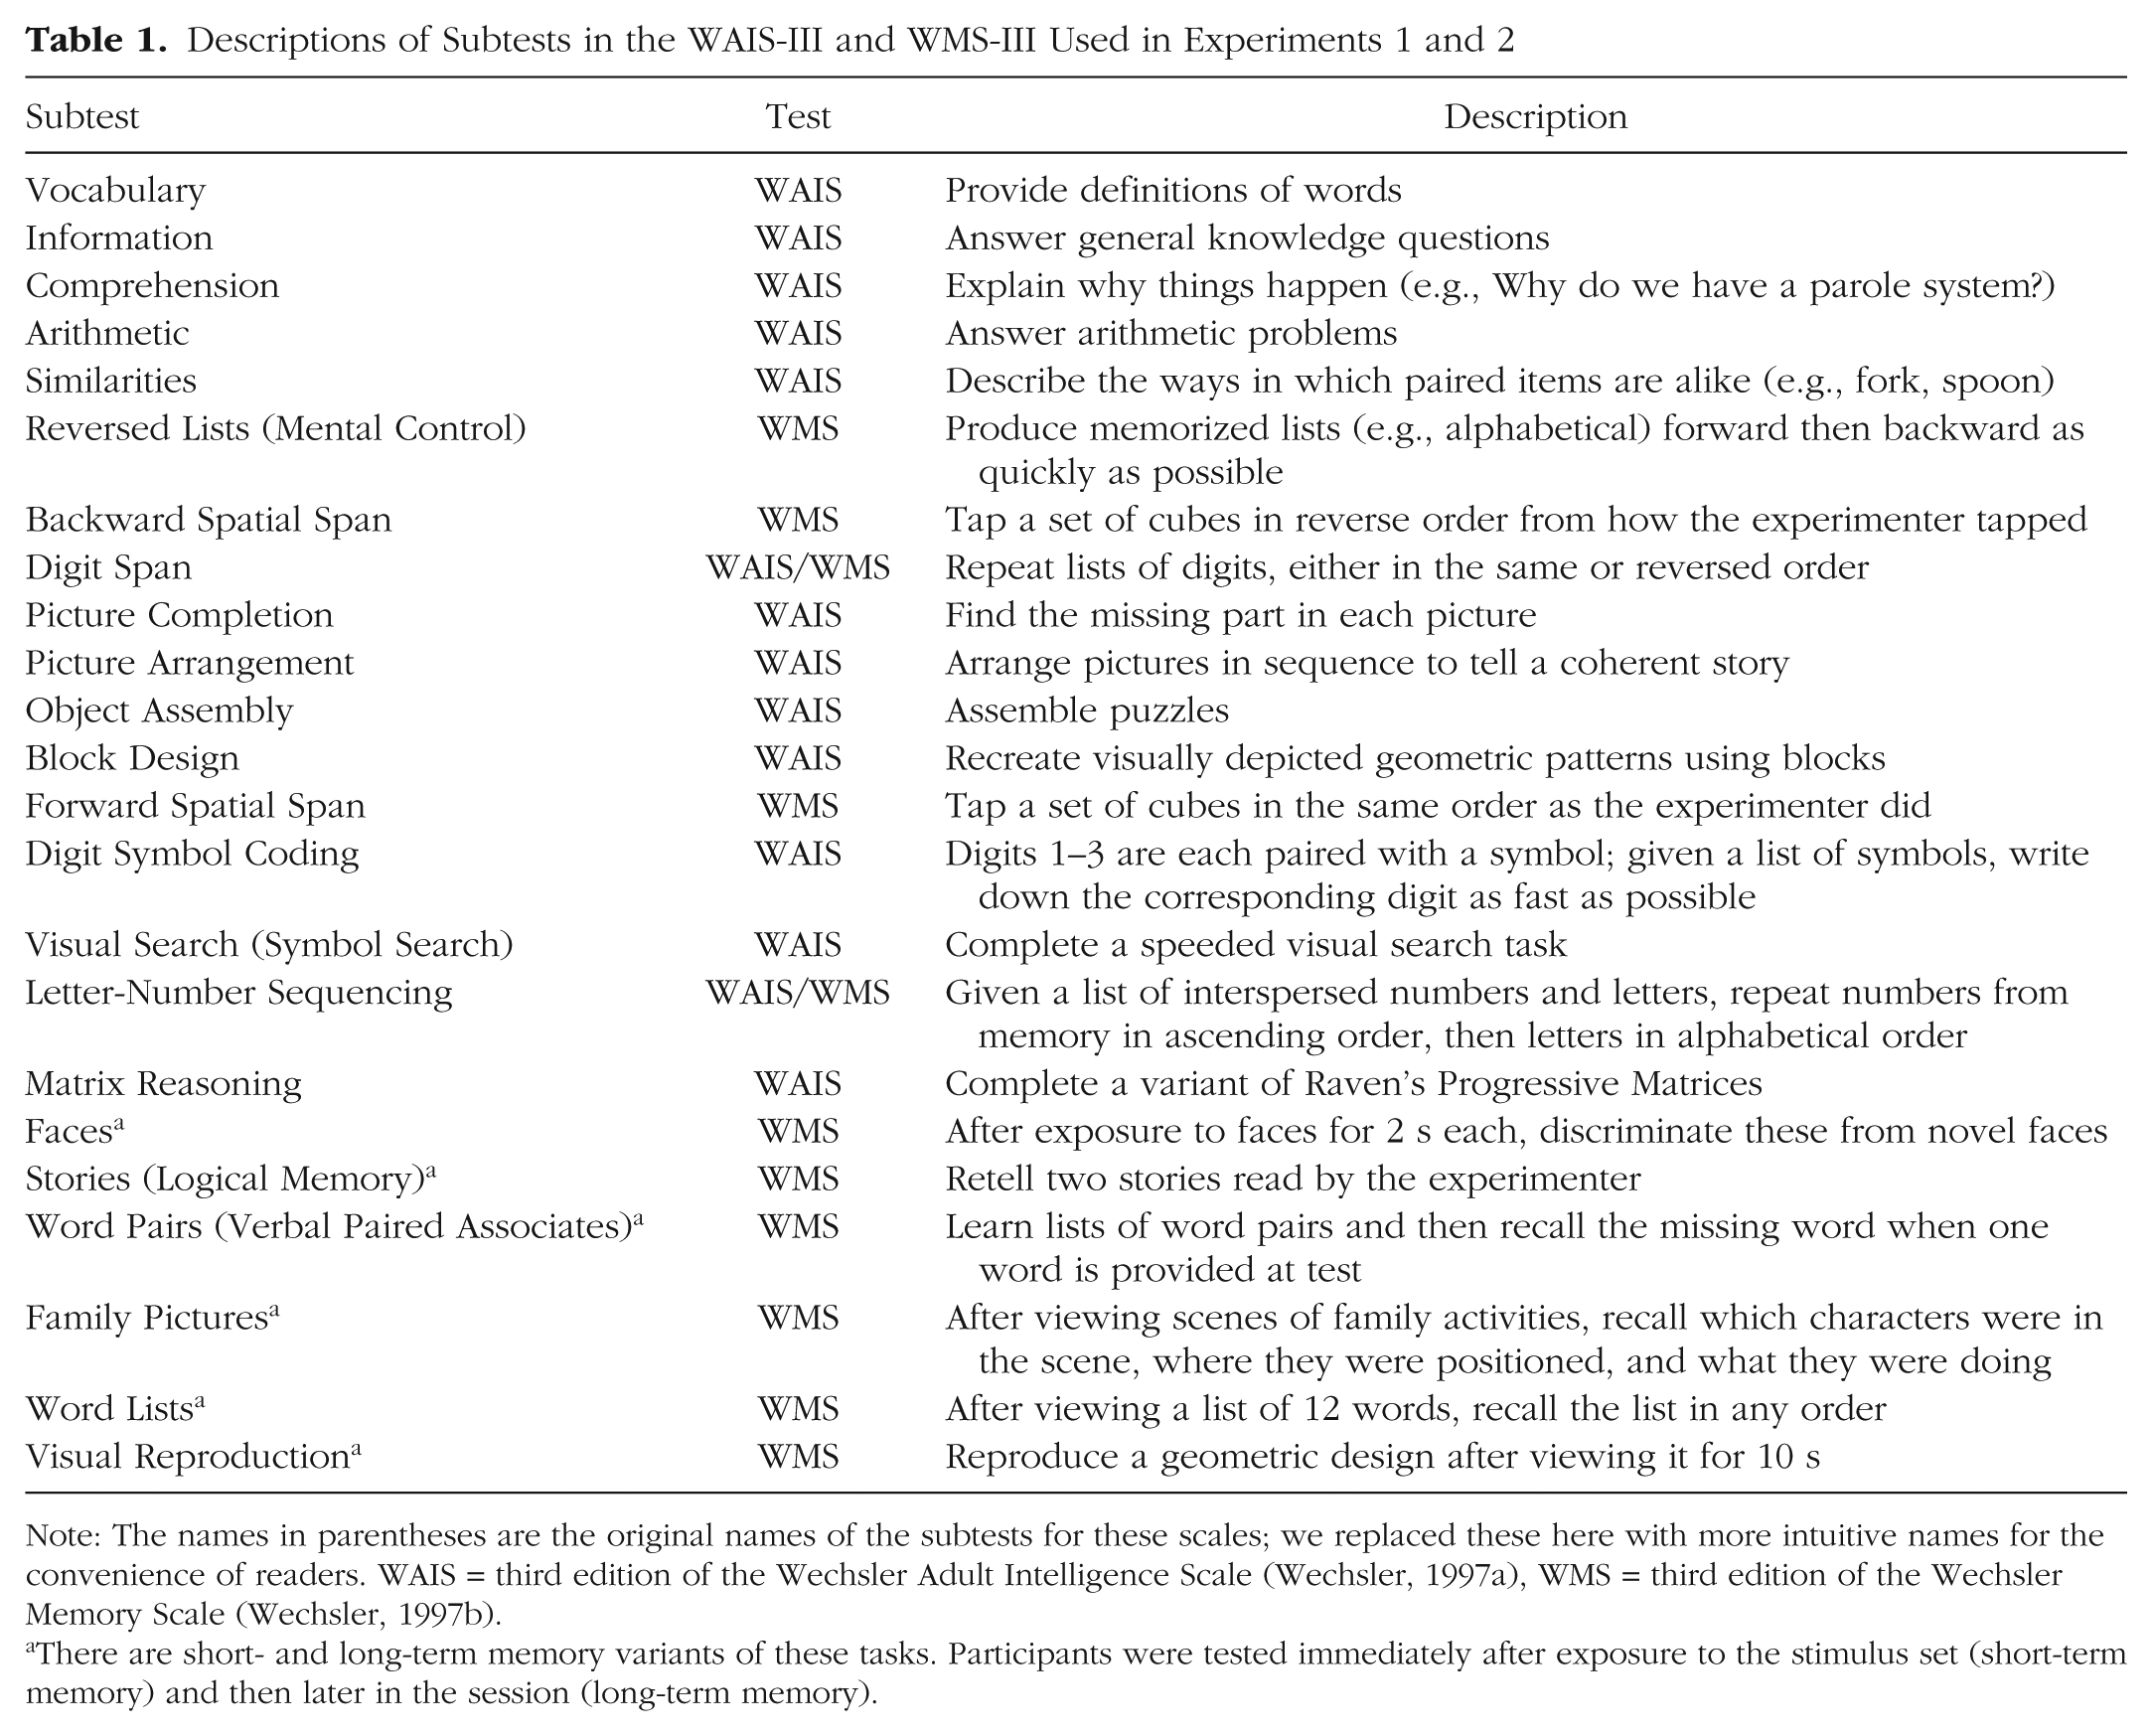
Note: The names in parentheses are the original names of the subtests for these scales; we replaced these here with more intuitive names for the convenience of readers. WAIS = third edition of the Wechsler Adult Intelligence Scale (Wechsler, 1997a), WMS = third edition of the Wechsler Memory Scale (Wechsler, 1997b).
There are short- and long-term memory variants of these tasks. Participants were tested immediately after exposure to the stimulus set (short-term memory) and then later in the session (long-term memory).
Results
We generated bootstrapped estimates for age of peak performance (cf. Germine et al., 2011) based on norms reported in the WAIS-III and WMS-III. The WAIS-III and WMS-III manuals provide a fine-grained approximation of the normal distribution of scores for each age group (the scaled scores). We used these distributions to draw Ng samples from each age group, where Ng is the number of participants used to generate norms for that age group. Resampled scaled scores were then converted back to raw scores using age-specific normative data, and the age group with the highest score was identified. This procedure was repeated 2,500 times for each task in order to provide the distribution on age of peak performance used for analysis and for Figure 1.
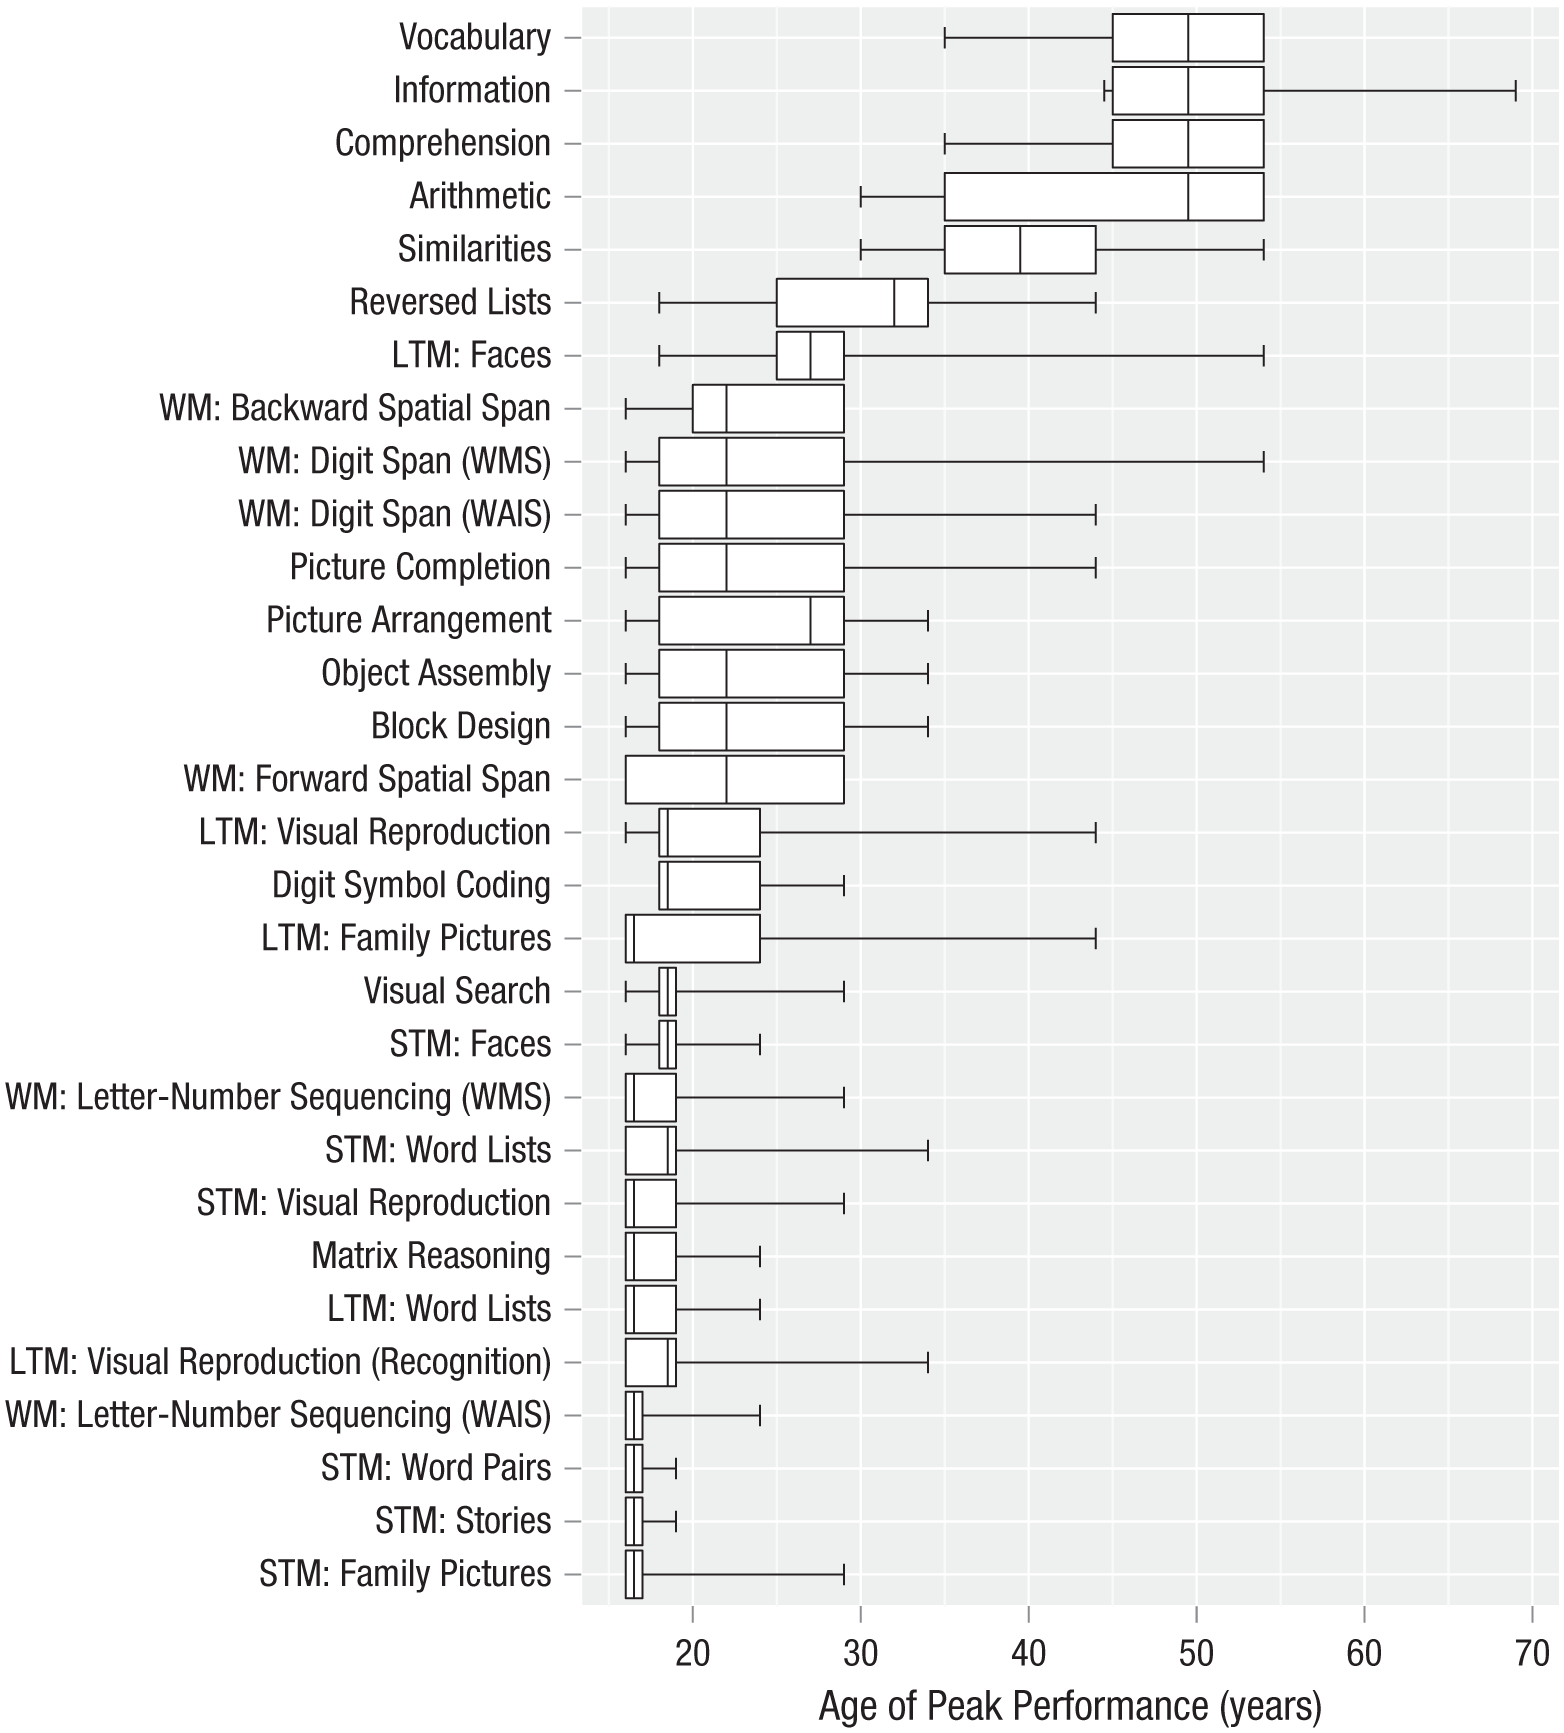
Results of Experiment 1: box-and-whisker plots showing bootstrapped age of peak performance for the subtests on the third edition of the Wechsler Adult Intelligence Scale (WAIS; Wechsler, 1997a) and the third edition of the Wechsler Memory Scale (WMS; Wechsler, 1997b). For each task, the median (interior line), interquartile range (left and right edges of boxes), and 95% confidence interval (whiskers) are shown. Tests of working memory (WM) were completed immediately after each trial, tests of short-term memory (STM) were completed soon after stimulus presentation, and tests of long-term memory (LTM) were completed 20 to 30 min after stimulus presentation.
Intuitively, the width of the distribution returned should reflect the range of ages at which participants are near peak performance. If the life-span curve is sharply peaked, most of the bootstrapped ages of peak performance will fall in a narrow window (assuming sufficient statistical power). If individuals remain at peak over a broad range of ages, the bootstrapped ages of peak performance will fall across a similarly wide window.
We compared ages of peak performance by conducting t tests using the means and standard errors generated by our bootstrapping method (all pairwise comparisons are shown in Tables S1–S3 in the Supplemental Material available online). A significant result indicated that the two distributions were substantially nonoverlapping. 2
We observed the previously reported pattern of earlier peaks for fluid intelligence than for crystalized intelligence (Baltes, 1987; Cattell, 1971). The pattern of age-related differences for representative early- and late-peaking task performance is shown in Figure 2. In particular, performance on the five tasks invoking learned knowledge (Vocabulary, Information, Comprehension, Arithmetic, Similarities) peaked significantly later than performance on nearly every other task (ps < .05; see Tables S1–S3).
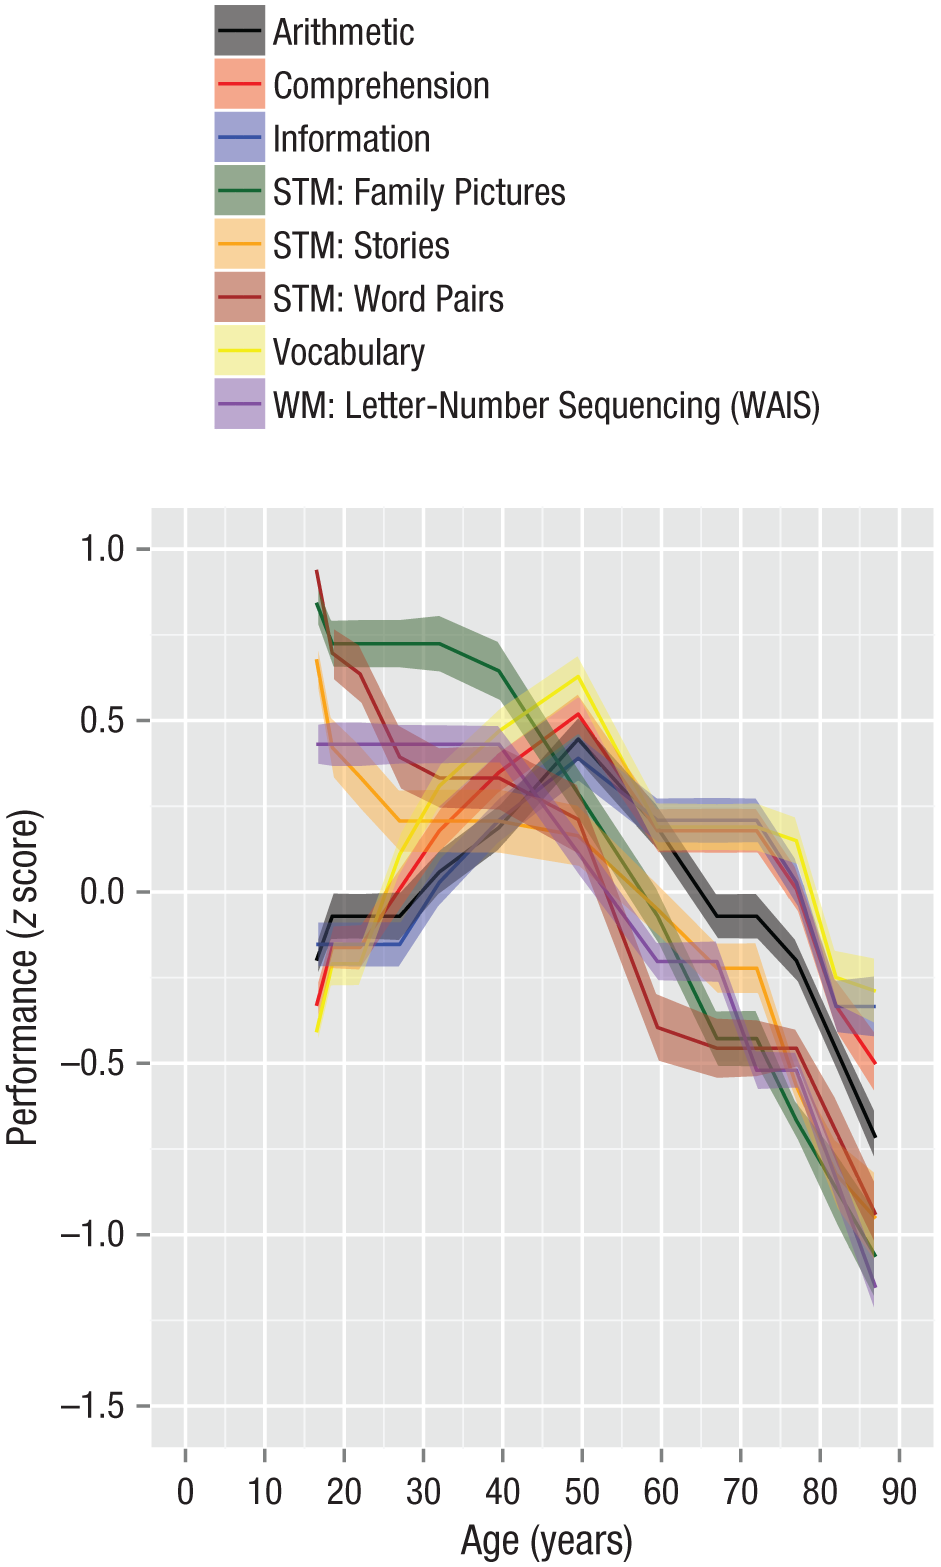
Results of Experiment 1: mean z-scored performance as a function of participants’ age and task in Experiment 1. Shaded bands represent standard errors. STM = short-term memory, WM = working memory, WAIS = third edition of the Wechsler Adult Intelligence Scale (Wechsler, 1997a).
However, the pattern of results was more complicated than this dichotomy would suggest. Among the tasks with earlier-peaking performance, Reversed Lists and Backward Spatial Span peaked significantly later than Word Pairs and Stories (ps < .05) but earlier than Vocabulary, Information, and Comprehension. Performance on Backward Spatial Span additionally peaked earlier than performance on Arithmetic and Similarities (ps < .05). No other differences were significant, though some of the qualitative patterns matched those observed in previous work (Germine et al., 2011; Logie & Maylor, 2009).
Experiments 2 and 3
Experiment 1 suggested that there is some heterogeneity in age of peak performance across fluid intelligence tasks, but the broad, coarse-grained age bins in the normative data limited our ability to identify subtle differences among tasks. In Experiments 2 and 3, we used Internet-based methods to collect very large samples across five specific cognitive tasks, which allowed for a more fine-grained analysis. We focused on Digit Symbol Coding, Digit Span, and Vocabulary, performance for which in Experiment 1 peaked (respectively) in participants’ late teens, early 20s, and around the age of 50 years. The comparison of these three tasks is of particular interest in light of the long-standing debate about how central a role working memory plays in fluid intelligence (cf. Nisbett et al., 2012).
The amount of heterogeneity in age of peak performance might be even greater if we looked beyond the relatively narrow range of intelligence and memory tasks used so far to other areas of behavior, such as social cognition, perception, and linguistic processing. As a first step in this direction, in Experiment 3, we investigated a widely used test of emotion perception (Baron-Cohen, Wheelwright, & Hill, 2001).
Method
Participants
Participants in Experiment 2 (N = 10,394; age range = 10–69 years old) and Experiment 3 (N = 11,532; age range = 10–71 years old) were visitors to TestMyBrain.org, who took part in experiments in order to contribute to scientific research and in exchange for performance-related feedback. 3 We continued data collection for each experiment for approximately 1 year, sufficient to obtain around 10,000 participants, which allowed fine-grained age-of-peak-performance analysis.
Internet-based methods enable the rapid recruitment and testing of very large samples. Systematic comparisons between data collected from lab- versus Internet-based samples have demonstrated that online data can be as reliable as data collected in the lab or using traditional methods (Germine et al., 2012; Meyerson & Tryon, 2003).
Materials and procedure
Experiment 2 consisted of tests of Digit Symbol Coding, visual working memory, verbal working memory (Forward Digit Span), and Vocabulary. Digit Symbol Coding (also known as digit-symbol substitution) and Forward Digit Span were adapted from the WAIS-III (see Table 1). The visual working memory task was adapted from a standard change-detection paradigm for testing visual working memory (Phillips, 1974): On each of 42 trials, participants viewed an array of four nonnameable novel shapes. After a brief retention period, they determined whether a single probe shape was a member of the memory set. The 20-question, multiple-choice vocabulary test was modeled on the General Social Surveys’ WORDSUM test (Smith, Marsden, & Hout, 2013). Experiment 3 consisted of the mind-in-eyes task, in which a series of pictures of faces are cropped such that only the eye region is visible; participants select the most appropriate emotion word to describe each stimulus from a list (for full method, see Baron-Cohen et al., 2001).
Analysis
Estimates and standard errors for age of peak performance were calculated using a bootstrap resampling procedure identical to the one used in Experiment 1 but applied to raw performance data. To dampen noise, we smoothed means for each age using a moving 3-year window prior to identifying age of peak performance in each sample. Other methods of dampening noise provide similar results. In Experiment 2, age of peak performance was compared across tasks with paired t tests. Within-participant data were not available in Experiment 3.
Results
Results for Experiment 2 (Figs. 3a and 3c) show the same ordering in age of peak performance as in the standardized test results: Performance on the two working memory tasks peaked at around 30 years, significantly later than performance on processing speed (ps < .01) and significantly earlier than performance on Vocabulary (ps < .0001; for additional details, see Fig. S1 in the Supplemental Material). These results are consistent with models in which working memory is distinguishable from other tasks that load on fluid intelligence (cf. Nisbett et al., 2012). While age of peak performance for verbal working memory was later than that for visual working memory, the difference was not significant (t < 1).
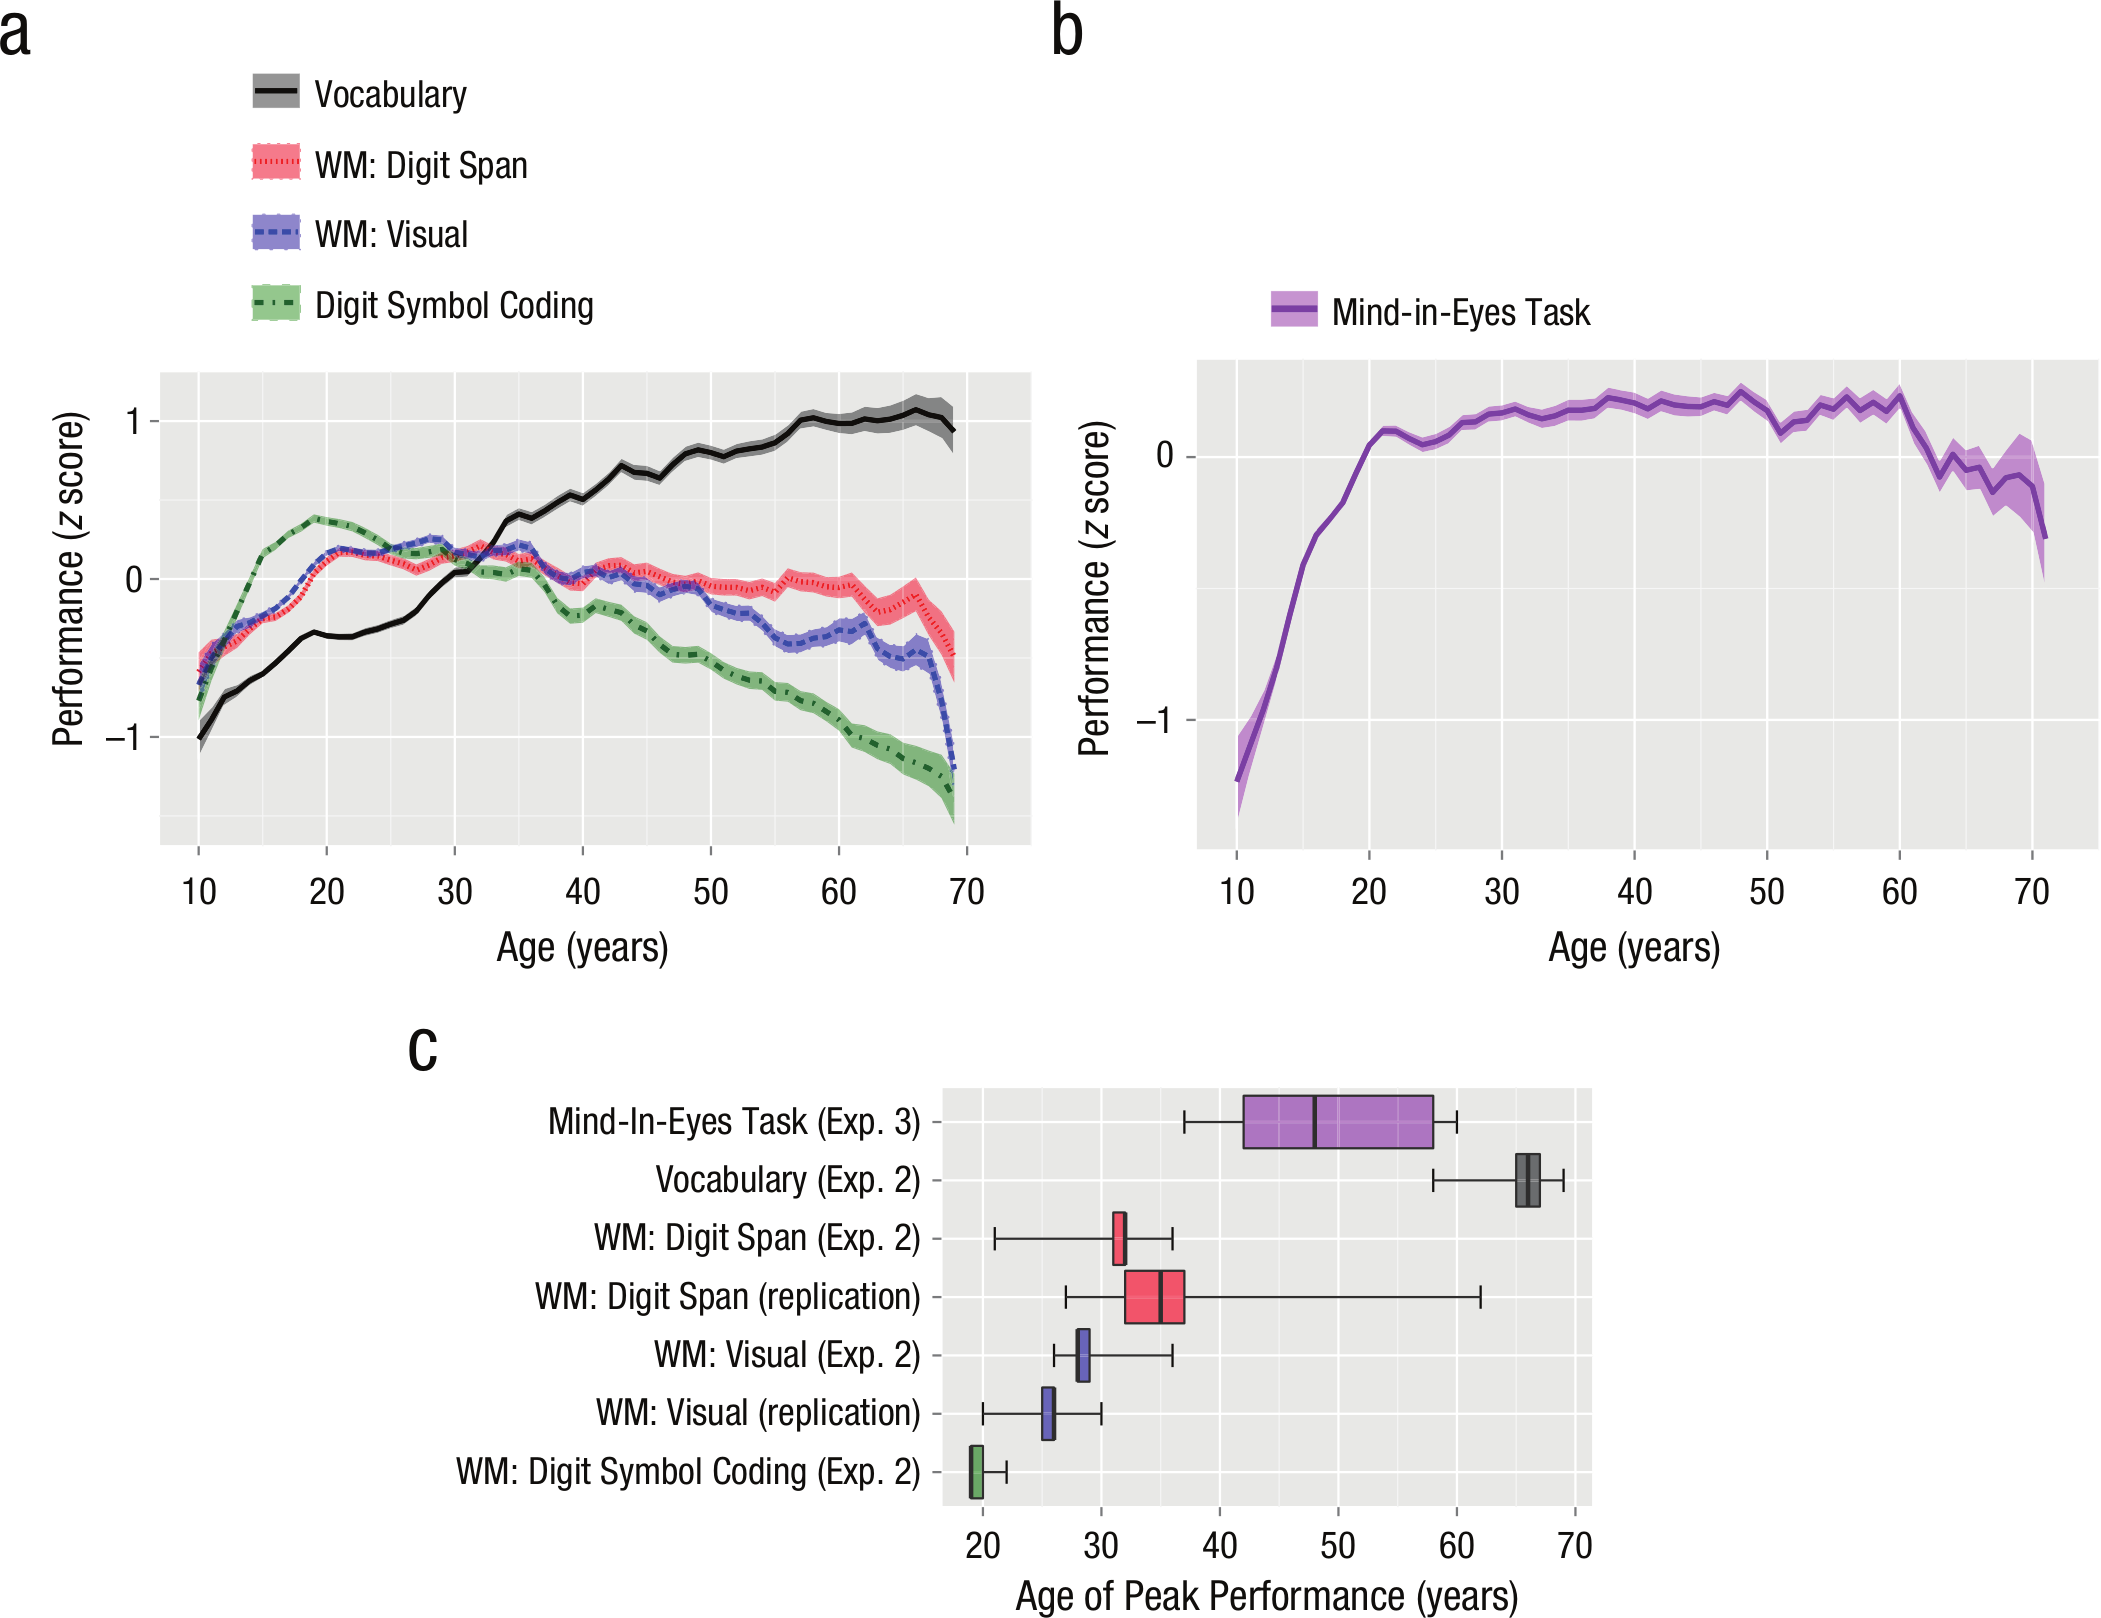
Results of Experiments 2 (a, c) and 3 (b, c). The graph in (a) shows mean z-scored performance as a function of participants’ age and task in Experiment 2. The graph in (b) shows mean z-scored performance on the mind-in-eyes task as a function of age in Experiment 3. For these two graphs, shaded bands represent standard errors. Box-and-whisker plots are shown in (c) for bootstrapped age of peak performance on selected tasks in Experiments 2 and 3, plus replications. For each task, the median (interior line), interquartile range (left and right edges of boxes), and 95% confidence interval (whiskers) are shown. WM = working memory.
Results for the emotion-perception task (Experiment 3; Figs. 3b and 3c) reveal a peak significantly later than the peak for either of the working memory tasks (ps < .05) and a trend toward peaking earlier than Vocabulary performance, t(41595.1) = 1.8, p = .07. The peak in emotion-recognition ability was also much broader than the peaks for any of the other tasks, which reflects a long period of relative stability in performance between the ages of 40 and 60 years. 4
Given the recent concern about the replicability of findings in psychological research (Hartshorne & Schachner, 2012; Open Science Collaboration, 2012), we attempted to confirm a subset of these findings with separate data sets. We asked 12,073 participants between the ages of 10 and 66 years to complete a separate digit span task (identical to the one used in Experiment 2) and 8,300 participants between the ages of 15 and 73 years to complete a slight variation on Experiment 2’s visual working memory task, on a different site (GamesWithWords.org). Resulting peak age estimates (Fig. 3c) were not significantly different from those of Experiment 2—digit span: t(54006.2) < 1; visual working memory: t(55612.0) < 1.
Experiment 4: Cohort Effects
Experiments 2 and 3 revealed the same general pattern as the demographically stratified Wechsler norming samples, with Digit Symbol Coding performance peaking first, followed by working memory, and then finally by Vocabulary. Thus, the different results for these tasks cannot be explained by differences between Internet-based and in-person testing nor by cohort effects (see discussion of Fig. S1 in the Supplemental Material). This provides additional evidence that Internet-based testing methods and traditional testing procedures yield similar results (cf. Germine et al., 2012; Meyerson & Tryon, 2003).
Notably, however, Vocabulary age of peak performance was later for the Internet-based sample (~65 years) than for the WAIS-III sample (~50 years). This could suggest confounds in one or both data sets. Alternatively, this may reflect cohort differences: The Wechsler data were collected two decades ago. With the increase in the proportion of adults engaged in cognitively demanding careers, it may be that ages of peak performance are later in the more recent Internet sample, particularly for Vocabulary. This could be related to the Flynn effect: IQ has increased steadily in modern times, possibly because of increasing amounts of time devoted to mental activity (Flynn, 2007). We tested this hypothesis in Experiment 4.
Method
We reanalyzed published results for 26,850 participants tested from 1974 to 2012 on a 10-question vocabulary test included as part of the General Social Surveys (Smith et al., 2013). To track changes over time, we divided the data set by year of testing into three epochs with roughly equivalent numbers of participants: 1974–1987 (N = 9,155; 5,200 female, 3,955 male), 1988–1997 (N = 8,440; 4,811 female, 3,629 male), and 1998–2012 (N = 9,255; 5,191 female, 4,064 male).
Results
We first confirmed that the data set was sufficient in size and sensitivity to detect the cohort differences of interest. In particular, we found that the data set replicated the standard Flynn effect, with vocabulary scores increasing significantly across epochs, t(26848) < 0.001 (Fig. 4e).
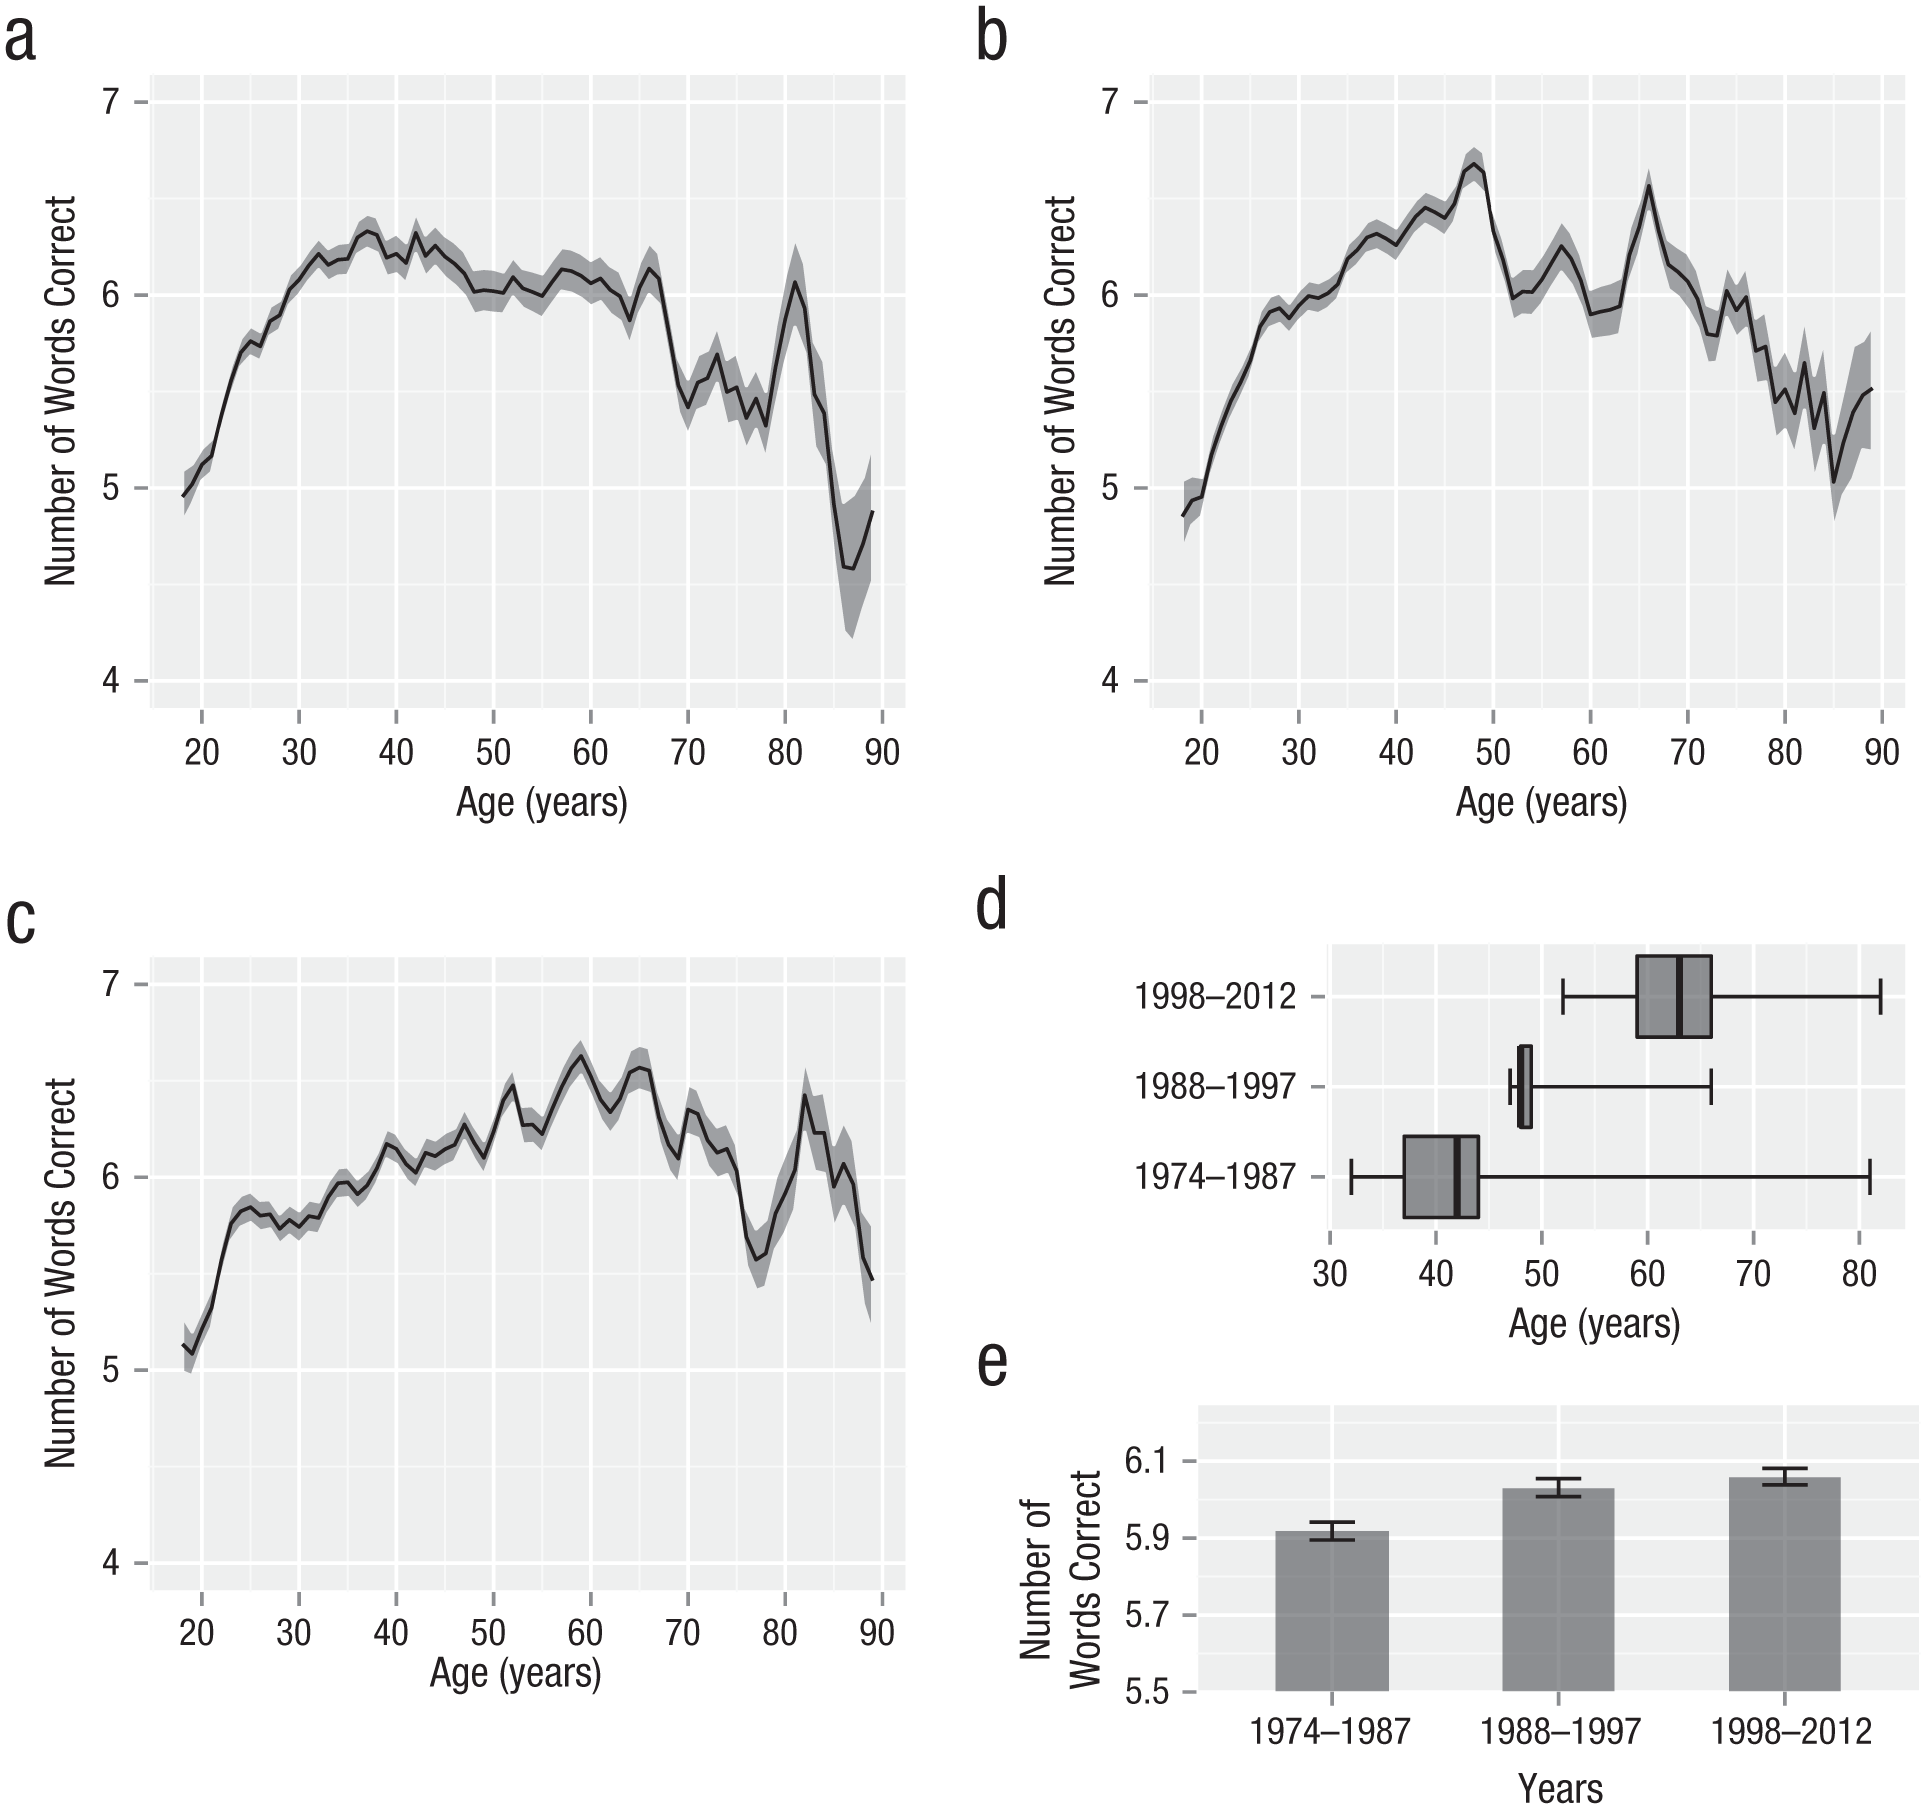
Results of Experiment 4. The mean number of words correctly identified on a vocabulary test is shown as a function of age, separately for participants tested from (a) 1974 to 1987, (b) 1988 to 1997, and (c) 1998 to 2012. Shaded bands represent standard errors. Estimated age of peak performance is shown in (d), where medians are indicated by interior lines, interquartile ranges by the left and right edges of boxes, and 95% confidence intervals by whiskers. The mean score across the entire age range for each cohort is shown in (e). Error bars show standard errors of the mean.
Consistent with our observation of a later peak in the more recent data set, analysis of age-related differences in performance for the three epochs showed visibly later peaks with each epoch (Figs. 4a–4c). We followed this qualitative observation with quantitative age-of-peak-performance estimates, following the method outlined for Experiments 2 and 3. These analyses similarly showed later peaks for more recent samples (Fig. 4d). Linear regression showed that this represents an average annual increase in the age of peak performance of 0.90 years, a result which trended toward significance (p = .078). 5 Combining this data set with the vocabulary data from the WAIS-III (collected in 1995) and Experiment 2 (collected in 2010) resulted in an estimated annual increase in age of peak performance of 0.96 years, a result which reached significance (p = .0003). 6 Thus, it is likely that the later ages of peak performance in our data relative to the Wechsler data are at least partly due to generational differences, with later peaks seen in more recent generations.
General Discussion
The present study demonstrates that age-related changes in cognitive ability are considerably more heterogeneous and complex than the fluid-/crystalized-intelligence distinction suggests. We found evidence for at least three to four distinct patterns.
These results were reliable across samples: We directly replicated the visual and verbal working memory findings of Experiment 2, and we obtained converging results for several tasks in both Internet-based and traditional samples. Moreover, this convergence rules out a significant role for several possible confounds in the Internet-based data, such as older adults having less experience with computers or differential representativeness at different ages; such confounds would have resulted in differences between the Internet-based data and the demographically stratified paper-and-pencil data. 7 This convergence adds to the growing body of work indicating that Internet-based data are highly reliable (e.g., Germine et al., 2012).
One potential concern with cross-sectional data is that it may be subject to cohort effects. Our findings in Experiment 2 are consistent with the possibility that people born in 1945 have unusually large vocabularies, people born in 1980 have unusually good working memory, and people born in 1990 have unusually fast processing speed. Such concerns can be mitigated by converging results from cross-sectional data sets collected at different times (Schaie, 2005). Here, we compared results derived from Internet cross-sectional data with results derived from WAIS-III and WMS-III cross-sectional data collected 20 years earlier. Thus, if the results in Experiment 2 and its replications were driven by cohort effects, all the peaks in these earlier cross-sectional studies should have occurred 20 years previously. Instead, ages of peak performance for Digit Span and Digit Symbol Coding were similar in all data sets.
One difference was observed between Internet-based and traditional samples: earlier age of peak performance for Vocabulary in the latter. This difference is unlikely to be related to testing method, since it also appeared in a long-term paper-and-pencil study (Experiment 4). This novel finding may also explain a current puzzle in the literature: While the average vocabulary of both adults and children has increased in recent years, the increase has been much larger for adults than for children, a fact only partly explained by the increase in tertiary education (Flynn, 2010). Our data offer an explanation: Vocabulary learning is continuing later into adulthood, possibly because of environmental factors (e.g., continued exposure to new words). Some purchase may be gained by exploring whether performance on other tasks shows similar generational changes.
Our findings have practical and theoretical implications. On the practical side, not only is there no age at which humans are performing at peak on all cognitive tasks, there may not be an age at which humans perform at peak on most cognitive tasks. Studies that compare the young or elderly to “normal adults” must carefully select the “normal” population. For instance, comparing college freshman with 65-year-olds on emotion recognition would result in no difference, leading to the erroneous conclusion that there is no age-related change (Fig. 3b). This may explain why studies differ in whether or not they show age-related decline in aspects of social perception (Moran, 2013). Critically, these studies have compared different age groups. Similarly, clinicians attempting to determine whether an individual exhibits early signs of abnormal decline must consider both the type of cognitive task and the individual’s age.
On the theoretical side, the complexities described in this article provide a rich, challenging set of phenomena for theories of development, maturation, and aging. While heterogeneity in some life-span curves results from differences in biological maturation and aging of the underlying neural substrates (Greenwood, 2007; Paus, 2005), this cannot easily account for task performance that shows continued improvement past early adulthood. Salthouse (2003, 2004) suggests that these are precisely those tasks that depend on experience, which necessarily increases with age. However, this alone does not explain why visual working memory, which shows minimal effects of practice and experience (Eng, Chen, & Jiang, 2005), peaks later than Digit Symbol Coding, nor why emotion recognition peaks before vocabulary. Some purchase on this problem may be gained by better understanding differences in the learning problems presented by experience-dependent tasks. For instance, while vocabulary size depends heavily on encountering the words in question, digit span depends heavily on explicit strategies that must be learned (Gathercole, Adams, & Hitch, 1994). Another important factor determining when performance begins to decline as a result of aging is the degree to which different tasks allow for compensatory strategies (Greenwood, 2007).
The present data and method provide powerful new constraints on theories of cognition. Researchers in the aging and intelligence literatures have more typically employed factor analysis. Factor analysis has analytic and conceptual advantages in that it is designed to directly model underlying factors shared across tasks by removing nuisance factors, such as task-specific strategies. Although influential and informative, factor-analysis studies have left numerous questions unresolved, in part because these studies do not provide consistent findings on the number or nature of dissociable factors relevant to aging (Ghisletta, Rabbit, Lunn, & Lindenberger, 2012; Goh, An, & Resnick, 2012; Tucker-Drob, 2011). Power can be an issue: Each participant must complete a large battery of tasks, which makes collecting large samples difficult (though see Hampshire et al., 2012; Johnson, Logie, & Brockmole, 2010). Moreover, by focusing on broad pools of shared variance across tasks, factor analysis may miss smaller but theoretically relevant differences (cf. Wilmer et al., 2012).
As such, our method—which builds on methodologies more common in developmental psychology and cognitive neuroscience—provides a valuable new tool, in which carefully selected tasks are directly compared. Noise is controlled through sample size, and potential nuisance factors, such as scientifically uninteresting task strategies, can be tested experimentally by comparing performance on variants of the same task. Age-of-peak-performance analyses make it possible to directly compare the results of different tasks measured on different scales and performed by different participants. Such data sets are now increasingly easy to obtain through Internet-based testing (e.g., Germine et al., 2012; Germine et al., 2011; Halberda et al., 2012; Hampshire et al., 2012; Hartshorne, 2008; Johnson et al., 2010; Logie & Maylor, 2009).
Footnotes
Acknowledgements
We thank Timothy O’Donnell and Tim Brady for help with analyses and Jeremy Wilmer, Manizeh Khan, Ken Nakayama, Lucia Garrido, Eric Eich, and three anonymous reviewers for comments.
Declaration of Conflicting Interests
The authors declared that they had no conflicts of interest with respect to their authorship or the publication of this article.
Funding
This research was funded by a National Defense Science and Engineering Graduate Fellowship to J. K. Hartshorne, National Research Service Awards from the National Institutes of Health to J. K. Hartshorne (5F32HD072748) and L. T. Germine (1F32MH10297), and an award from the National Science Foundation’s Graduate Research Fellowship Program to L. T. Germine.
Open Practices
Data and materials for Experiment 1 are available through the Wechsler Adult Intelligence Scale and Wechsler Memory Scale test kits (Wechsler, 1997a, 1997b, respectively). Data and materials for Experiments 2 and 3 have been made publicly available via Open Science Framework and can be accessed at https://osf.io/4xp3g/ and https://osf.io/w7jgv/, respectively. Data and materials for Experiment 4 are publicly available through several public Web sites, including the site of the General Social Survey (http://www3.norc.org/GSS+Website/). The complete Open Practices Disclosure for this article can be found at ![]() .
.
Notes
References
Supplementary Material
Please find the following supplemental material available below.
For Open Access articles published under a Creative Commons License, all supplemental material carries the same license as the article it is associated with.
For non-Open Access articles published, all supplemental material carries a non-exclusive license, and permission requests for re-use of supplemental material or any part of supplemental material shall be sent directly to the copyright owner as specified in the copyright notice associated with the article.