




Abstract
People use at least two strategies to solve the challenge of understanding another person’s mind: inferring that person’s perspective by reading his or her behavior (theorization) and getting that person’s perspective by experiencing his or her situation (simulation). The five experiments reported here demonstrate a strong tendency for people to underestimate the value of simulation. Predictors estimated a stranger’s emotional reactions toward 50 pictures. They could either infer the stranger’s perspective by reading his or her facial expressions or simulate the stranger’s perspective by watching the pictures he or she viewed. Predictors were substantially more accurate when they got perspective through simulation, but overestimated the accuracy they had achieved by inferring perspective. Predictors’ miscalibrated confidence stemmed from overestimating the information revealed through facial expressions and underestimating the similarity in people’s reactions to a given situation. People seem to underappreciate a useful strategy for understanding the minds of others, even after they gain firsthand experience with both strategies.
A lot of leaders are coming here, to sit down and visit. I think it’s important for them to look me in the eye. Many of these leaders have the same kind of inherent ability that I’ve got, I think, and that is they can read people. We can read. I can read fear. I can read confidence. I can read resolve. And so can they—and they want to see it. —George W. Bush (quoted in Fineman & Brant, 2001, p. 27) You never really understand a person until you consider things from his point of view. . . . Until you climb into his skin and walk around in it. —Atticus Finch to his daughter, Scout, in Harper Lee’s To Kill a Mockingbird (Lee, 1960/1988, pp. 85–87)
Bush and Lee offer very different strategies for solving a frequent challenge in social life: accurately understanding the mind of another person. Bush suggested reading another person by watching body language, facial expressions, and other behavioral cues to infer that person’s feelings and mental states. Lee suggested being another person by actually putting oneself in that person’s situation and using one’s own experience to simulate his or her experience. These two strategies also broadly describe the two most intensely studied mechanisms for mental-state inference in the scientific literature, theorization (i.e., theory theory; e.g., Gopnik & Wellman, 1994) and simulation (i.e., self-projection or surrogation; e.g., Epley & Waytz, 2010; Gilbert, Killingsworth, Eyre, & Wilson, 2009; Goldman, 2006). In this article, “theorization” refers to a process of inference from observations of another person’s actions, whereas “simulation” refers to using one’s own experience as a guide to another person’s experience. If you want to know whether someone likes a jellybean, should you watch the person eating it or taste it yourself? If you want to know what it is like to be poor, should you observe the poor’s behavior or simulate their experience by living for a week on minimum wage? If you really want to understand the mind of another person, should you try to read that person to infer his or her perspective or try to be that person by putting yourself in that person’s experience and getting his or her perspective directly?
Each strategy’s effectiveness will vary across contexts, but here we suggest that there is a consistent bias in people’s intuitions to underestimate the actual value of being someone compared with reading someone in situations in which both strategies are applicable. Specifically, we predict that people will consistently overestimate the effectiveness of inferring another individual’s experience by observing his or her behavior and underestimate the effectiveness of getting another individual’s perspective by being in his or her situation.
We predicted this bias in favor of top-down theorization over bottom-up simulation on the basis of two existing results. First, people tend to assume that a person’s mind is reflected in his or her observed behavior even when that behavior is obviously misleading (Gilbert & Malone, 1995). In one example, participants who explicitly instructed someone to give conservative answers to a political survey, by reading them from a script, inferred that the other person was actually somewhat conservative (Gilbert & Jones, 1986). Although a person’s thoughts and feelings can be communicated by nonverbal body language and facial expressions, they may not be communicated as clearly as people expect (Aviezer, Trope, & Todorov, 2012; Gilovich, Savitsky, & Medvec, 1998; Kring & Gordon, 1998). If people overestimate how clearly mental states are reflected in behaviors, then they may overestimate the insight gained from observing another person’s actions. Second, different people can react differently to the same situation, which makes simulation seem like an inferior strategy. However, obvious differences may not be as large as intuition suggests. For instance, people tend to overestimate the magnitude of political polarization (Westfall, Van Boven, Chambers, & Judd, 2015), the differences in behavior between people with different moral beliefs (Monin & Norton, 2003), and the magnitude of gender differences on a host of psychological attributes (Hyde & Plant, 1995). As Gilbert et al. (2009) noted, “An alien who knew all the likes and dislikes of a single human being would know a great deal about the entire species” (p. 1617). If people overestimate the uniqueness of their own experiences, then they may underestimate the accuracy gained from putting themselves in another person’s shoes.
In the experiments reported here, we asked some participants (experiencers) to watch 50 emotionally evocative pictures and to report how they felt about each one. Separate groups of participants (predictors) predicted the experiencers’ feelings. We assessed the presumed versus actual effectiveness of the theorization and simulation strategies by allowing some predictors to see experiencers’ facial expressions (theorization) and allowing other predictors to see the same pictures the experiencers saw (simulation). This paradigm provided a comprehensive test of our hypotheses by allowing us to measure confidence, accuracy, and preferences for the two strategies (Experiments 1–5) and by varying the actual effectiveness of both theorization (Experiment 4) and simulation (Experiment 5), to test whether preferences are sensitive to actual performance.
Experiment 1
Method
We first recruited 12 participants (6 women, 6 men) to a research laboratory at the University of Chicago to act as experiencers in exchange for $10. These experiencers viewed a slide show containing 50 pictures taken from the International Affective Picture System (IAPS; Lang, Bradley, & Cuthbert, 2008). We selected pictures that varied widely in their emotional content, from very negative to neutral to positive. Before the slide show, the experiencers learned that their faces would be recorded by a webcam while they viewed the images. The slide show presented each picture for 7 s before advancing to the next picture. The experiencers reported their feelings about each picture on a scale ranging from −4 (extremely negative) to 4 (extremely positive). The scale appeared beneath each picture, and the experiencers made their responses using the computer mouse.
We then recruited 73 additional participants (39 women, 34 men) from the same population as the experiencers to serve as predictors. The sample size was determined ex ante following a simple heuristic that each experiencer would be paired with at least 2 predictors in each condition. These participants predicted the experiencers’ emotion ratings for each picture. Specifically, each predictor was randomly paired with 1 experiencer, referred to as the target, and then received the following instruction: The target was told to rate each photo according to the emotional feeling he/she experienced when viewing it. Lower ratings mean he/she experienced more negative feelings, while higher ratings mean he/she experienced more positive feelings. The rating scale ranges from −4 to +4. Your task is to estimate the target’s emotional ratings for all 50 photos he/she viewed.
The predictors were randomly assigned to three conditions: simultaneous, simulation, or theorization. Predictors in the simultaneous condition completed their task by looking at a computer screen that showed the synchronized playback of each picture viewed by their target experiencer next to a continuous video recording of the target’s expressions (see Fig. 1). Predictors in the simulation condition viewed only the playback of each picture while the adjacent video was covered by a still photograph of the target experiencer. Providing the experiencers’ photos ensured that predictors in the simulation condition would know as much about the demographic features of the experiencers as predictors in the other conditions did. Predictors in the theorization condition viewed only the video of a target experiencer’s face while the adjacent slide show was covered by a gray box. Predictors in all three conditions estimated their experiencers’ actual feelings. Specifically, on each trial, the following question appeared right beneath the picture: “What was the experiencer’s emotional rating for this photo?” The predictors responded to this question using the same 4-point scale that the experiencers used to rate their actual feelings.

Illustration of a screenshot in the simultaneous condition. In this condition, the computer synchronized the playback of the slide show seen by the experiencer (on the left) with a video recording of the experiencer (on the right). In the simulation condition, the video of the experiencer was covered by a still photograph of the experiencer while the slide show (on the left) advanced. In the theorization condition, the slide show was covered with a gray box, so only the experiencer’s video (on the right) was visible. Because of the International Affective Picture System’s licensing restrictions, we are unable to show the actual images used in the slide show. The image here is an example for illustrative purposes and was licensed under the GNU Free Documentation License (https://commons.wikimedia.org/wiki/Commons:GNU_Free_Documentation_License,_version_1.2).
Results
We calculated the predictors’ accuracy both by correlating their predictions with the experiencers’ actual ratings across the 50 trials and by calculating the average absolute difference between predicted and actual ratings across the 50 trials.
As expected, predictors were significantly more accurate when simulating than when theorizing. The correlation between predicted ratings and actual ratings was significantly higher in the simulation condition (M = .66, SD = .20) than in the theorization condition (M = .25, SD = .21), t(70) = 7.26, p < .001. To get a clearer sense of the magnitude of this effect, we calculated the common-language effect size (CLES). The CLES (McGraw & Wong, 1992) expresses the probability that a randomly selected score from one population will be better than a randomly sampled score from another population. In this study, the CLES of the difference between simulation and theorization was 92.30%; in other words, simulation predictors were more accurate than theorization predictors 92.30% of the time. Although predictors in both the simulation and the theorization conditions were significantly more accurate than chance, t(70)s = 16.54 and 6.28, respectively, ps < .001, the accuracy obtained in these conditions was not additive. Indeed, seeing both the video and pictures, in the simultaneous condition (M = .69, SD = .18), produced no additional gain beyond seeing the picture alone, in the simulation condition, t(70) = 0.42, p = .91, CLES = 53.46%.
We observed the same pattern of accuracy in the absolute difference between predicted and actual ratings. Specifically, the absolute difference was significantly smaller in the simulation condition (M = 1.39, SD = 0.39) than in the theorization condition (M = 2.02, SD = 0.58), t(70) = 4.64, p < .001, CLES = 81.56%. Seeing both the video and pictures, in the simultaneous condition (M = 1.34, SD = 0.42), did not decrease the absolute difference more than seeing the picture alone, t(70) = 0.39, p = .92, CLES = 53.61%.
Simulating another person’s experience by being in his or her situation was more effective for understanding that person’s emotional experience than was theorizing about the person’s experience by reading his or her expressions. Experiment 2 tested our more important prediction that people will underestimate the value of simulation compared with theorization. To do this, we enabled some predictors to choose a strategy and measured predictors’ beliefs about their own accuracy.
Experiment 2
We predicted that participants trying to understand the mind of another person would undervalue the benefit of being in his or her situation because people tend to overestimate the degree to which mental states will “leak out” in a person’s behavior, and also underestimate the degree to which their own experiences in a situation will match other people’s experiences. In a pretest, we examined how these intuitive beliefs are related to strategies for inferring mental states by surveying 104 online respondents. They first reported the degree to which they believed it was easy or difficult to detect a stranger’s emotional experience from his or her face, using a scale ranging from −4 (extremely difficult) to 4 (extremely easy), and then reported how much they believed two people would experience similar feelings in response to the same picture, using a scale ranging from 0 (not at all similar) to 7 (extremely similar). These participants then received a video introduction to the simulation and theorization procedures in Experiment 1 and predicted how accurately they would perform in each of these conditions (on a scale from 0 to 100, with higher numbers indicating greater accuracy).
As predicted, the more participants believed that facial expressions revealed emotional experience, the better they predicted performing in the theorization condition, r = .45, 95% confidence interval (CI) = [.28, .59], p < .001, but their predictions for their performance in the simulation condition were not correlated with their beliefs about facial expressions, r = −.02, 95% CI = [−.21, .18], p = .86. In contrast, the more participants believed emotional reactions would differ across people, the worse they predicted performing in the simulation condition, r = .40, 95% CI = [.22, .55], p < .001, but their predictions for their performance in the theorization condition were not correlated with their beliefs about the similarity of different people’s emotional reactions, r = .05, 95% CI = [−.15, .24], p = .65. Overall, participants did not believe they would perform any better using simulation (M = 58.21, SD = 19.17) than using theorization (M = 62.02, SD = 15.48), t(103) = −1.70, p = .092, CLES = 43.87%. This finding stands in stark contrast to the results of Experiment 1, suggesting that people may undervalue the insight gained from putting oneself in another person’s situation. Experiment 2 tested this directly.
Method
Each of 92 participants (48 women, 44 men) recruited to a laboratory in downtown Chicago predicted the feelings of a randomly selected experiencer from Experiment 1. The planned sample size was 96, as determined by the same heuristic we used for Experiment 1 (i.e., each experiencer was paired with 2 predictors in each condition). However, we stopped data collection at 92 participants because the academic quarter ended. Participants earned $5 for participating in the experiment and were further incentivized with cash bonuses based on their accuracy. Specifically, they could earn an extra $10 if their performance ranked above the 80th percentile.
These predictors were first randomly assigned to either the no-choice or the binding-choice condition. Predictors in the no-choice condition (n = 47) were randomly assigned to either the simulation (slide show only) or the theorization (video only) condition. Predictors in the binding-choice condition (n = 45) were shown detailed examples of each condition in a video tutorial and then chose the strategy they believed would maximize their accuracy (and monetary payment) in the experiment. Each predictor then completed the experiment in his or her assigned or chosen condition. This yielded a 2 (choice status: no choice, binding choice) × 2 (inference strategy: theorization, simulation) between-participants design. The procedures in the theorization and simulation conditions were identical to those in Experiment 1.
After predicting their target experiencers’ feelings, all predictors reported their confidence in the accuracy of their predictions on a sliding scale from 0 to 100, with 0 indicating a belief that the estimates were no better than random guessing and 100 indicating a belief that the estimates were perfectly accurate.
Results
Experiment 1 indicated that the correlation between predicted and actual ratings was stronger for participants in the simulation condition than for those in the theorization condition 92.30% of the time. Unless participants in Experiment 2 had perfect insight into their own accuracy, arguably every participant should have selected simulation in order to maximize his or her accuracy. In fact, only 48.89% of the predictors in the binding-choice condition did so. These choices did not reflect any personal insight into which strategy might work best. As in Experiment 1, the correlation between predicted and actual emotional ratings was significantly higher in the simulation condition (M = .66, SD = .24) than in the theorization condition (M = .23, SD = .21), t(91) = 9.29, p < .001, CLES = 91.10%, regardless of whether participants chose their strategy or were randomly assigned to it, F(1, 91) = 0.14, p = .71. If anything, participants were marginally less accurate when they chose a strategy (M = .41, SD = .33) than when it was assigned to them (M = .48, SD = .30), t(91) = −1.72, p = .09, CLES = 41.65%.
We again observed the same pattern of accuracy in the absolute difference between predicted and actual emotional ratings. Specifically, the absolute difference was significantly smaller in the simulation condition (M = 1.44, SD = 0.47) than in the theorization condition (M = 2.18, SD = 0.43), t(91) = 7.96, p < .001, CLES = 87.81%, regardless of whether participants chose their strategy or were randomly assigned to it, F(1, 91) = 0.01, p = .91. Predictors who freely chose a strategy (M = 1.86, SD = 0.61) did not fare better than those who were assigned a strategy (M = 1.75, SD = 0.56), t(91) = 1.25, p = .21, CLES = 43.29%.
Although predictors in the free-choice condition had no accurate foresight into which strategy would be more effective, they did seem to have some accurate hindsight. After the prediction task, predictors in the simulation condition were significantly more confident (M = 62.38) than predictors in the theorization condition (M = 47.59), t(91) = 3.32, p = .001, CLES = 68.54%, regardless of whether participants had chosen their strategy or been randomly assigned to it, F(1, 91) = 0.30, p = .58. However, even this difference in confidence was smaller than would have been justified by the actual differences in accuracy we observed, according to a CLES comparison. Although the chance of a simulation predictor being more confident than a theorization predictor was 68.54%, the chance of the former being more accurate than the latter was 91.10% when we used the correlational measure of accuracy and 87.81% when we used the absolute-difference measure. A bootstrapping simulation confirmed that the between-conditions difference in confidence (i.e., the CLES effect size for confidence) was significantly smaller than the between-conditions difference in both correlation accuracy (ΔCLES = −22.56%), 95% CI = [−35.22%, −10.96%] and absolute-difference accuracy (ΔCLES = −19.27%), 95% CI = [−33.98%, −5.72%].
This experiment suggests that people may undervalue the accurate insight that comes from getting another person’s perspective by being in his or her situation. Not only did predictors in Experiment 2 show no a priori preference for simulation despite its large subsequent advantage for actual accuracy, but also their confidence judgments after becoming acquainted with the two strategies underestimated the difference in accuracy between them. In Experiment 3, we undertook a more stringent test of the perceived versus actual value of each strategy by allowing participants to choose a strategy on each trial in the experiment. Measuring the dynamic time course of preferences also tested the degree of learning across the entire experiment.
Experiment 3
Method
Nineteen participants (10 women, 9 men) recruited from the same population as the experiencers in Experiment 1 served as a new pool of experiencers. They viewed and rated the same slide show as their counterparts did in Experiment 1, in exchange for $10. The procedure was identical to that of Experiment 1, except that these experiencers were unaware of being videotaped during the slide show and were informed about being filmed only after they had completed it. All the experiencers approved use of their videotape for experimental purposes after being informed about the filming. This procedural change addressed a possible concern that experiencers’ awareness of being videotaped in Experiment 1 somehow altered their behavior so that theorization was systematically less effective than it might otherwise have been.
One hundred eighty participants (63 women, 117 men) recruited via Amazon.com’s Mechanical Turk (MTurk) served as predictors. Each predictor estimated the emotional ratings of a randomly selected experiencer from the new pool. We targeted a sample size of at least 171 predictors on the basis of a simple heuristic that each experiencer would be assigned to an average of 3 predictors in each condition. Because of the technical limitation of the online experiment, we were unable to pair each experiencer with exactly 3 predictors. We increased the number of predictors per experiencer per condition from 2 to 3 to account for additional noise we anticipated from collecting the predictions online. Predictors earned $1.50 for their participation, plus an additional bonus based on the accuracy of their estimations. Specifically, they were told that they would earn an extra $5 if their performance ranked above the 80th percentile.
We assigned predictors to one of three conditions: theorization, simulation, or free-choice. The theorization and simulation conditions were identical to the corresponding conditions in Experiments 1 and 2. Predictors in the free-choice condition decided on each trial whether to view the picture seen by the experiencer or to view the video showing the experiencer’s face (i.e., to simulate or to theorize). The computer paused playback of both the video and the slide show before each of the 50 trials and prompted the predictor to choose whether to unblock the video or the picture for the upcoming trial. After a choice was made, the trial continued. This procedure enabled trial-by-trial measurement of each participant’s preferred strategy.
After the prediction task, all predictors reported their confidence in their prediction accuracy on the same sliding scale used in Experiment 2. In addition, predictors in the free-choice condition reported whether they would choose to view the video or the pictures if they were to estimate the ratings of a different experiencer for all 50 trials.
Results
Results for the simulation and theorization conditions replicated the results of Experiment 2. The average correlation between predicted and actual emotional ratings was significantly larger in the simulation condition (M = .70, SD = .16) than in the theorization condition (M = .19, SD = .21), t(177) = 13.52, p < .001, CLES = 97.30%. Simulation predictors were likewise significantly more confident (M = 68.48, SD = 22.29) than theorization predictors (M = 57.16, SD = 22.60), t(177) = 2.93, p = .011, but the difference in confidence (CLES = 63.93%) was again significantly smaller than the difference in accuracy (CLES = 97.30%), ΔCLES = −33.37%, 95% CI = [−43.27%, −22.71%].
Although these results again suggest that people may undervalue the benefit of being in someone else’s situation, both theorization and simulation predictors experienced only one strategy and so were unable to compare the relative merits of the two strategies. This could have hindered their ability to gauge which strategy was more effective. More revealing are correlation-accuracy results from predictors in the free-choice condition, who were able to experience both strategies over the course of the experiment and could choose between them on each trial as the experiment progressed. Results in this condition, however, closely replicated those in the simulation and theorization conditions. Free-choice predictors were more accurate when they chose simulation (M = .70, SD = .29) than when they chose theorization (M = .25, SD = .38), t(44) = 6.28, p < .001, CLES = 82.94%, but did not fully appreciate the effectiveness of simulation because they selected it only 47.7% of the time. As a result, their overall accuracy fell in between the accuracies of the predictors in the simulation and theorization conditions (M = .50, SD = .25). Confidence in judgment in the free-choice condition likewise fell in between reported confidence in the simulation and theorization conditions (M = 62.36, SD = 18.78).
We again observed the same pattern of accuracy when analyzing the absolute difference between predicted and actual evaluations. Accuracy was significantly smaller in the simulation condition (M = 1.38, SD = 0.38) than in the theorization condition (M = 2.03, SD = 0.45), t(177) = 8.29, p < .001, CLES = 86.24%. The difference in confidence (CLES = 63.93%) was significantly smaller than the difference in accuracy, ΔCLES = −22.30%, 95% CI = [−33.79%, −11.72%]. Predictors in the free-choice condition were significantly more accurate when they chose simulation (M = 1.37, SD = 0.56) than when they chose theorization (M = 2.09, SD = 0.57), t(44) = 6.40, p < .001, CLES = 81.85%. As we found with the correlational measure of accuracy, the absolute difference for free-choice predictors fell in between the accuracies of predictors in the simulation and theorization conditions (M = 1.72, SD = 0.45).
Predictors in the free-choice condition were not more accurate on the last 20 trials than they were on the first 20 trials, whether we measured accuracy as the average correlation (M = .49, SD = .31, vs. M = .50, SD = .28, respectively), t(57) = 0.53, p = .60, or the absolute difference (M = 1.63, SD = 0.31, vs. M = 1.73, SD = 0.41, respectively), t(57) = 1.52, p = .13. This suggests that being able to compare the two conditions against each other and choose between them over time did not systematically increase predictors’ insight into the accuracy of their judgments. Indeed, as Figure 2 shows, predictors in the free-choice condition began with a strong bias in favor of theorization, with 74.14% choosing to read the experiencer’s expressions on the first trial. This preference steadily decreased at a constant rate of 2.12% per trial through the first 10 trials, after which preferences remained stable at 45.4% through the 50th trial (see the fitted line superimposed on the bar graph in Fig. 2). Although participants chose theorization less frequently as the experiment progressed, the frequency of this choice never approached the frequency it should have for maximizing accuracy. To maximize accuracy, predictors should have stopped choosing to view the video of the experiencer’s face altogether. In fact, when we asked the free-choice predictors at the end of the experiment whether they would choose to view the video or the pictures if they were to estimate the ratings of a different experiencer but had to stick with their choice for all trials, 47% (27 out of 58) still chose the video. These figures are very similar to the preferences of binding-choice predictors at the beginning of Experiment 2 (51% chose the video).
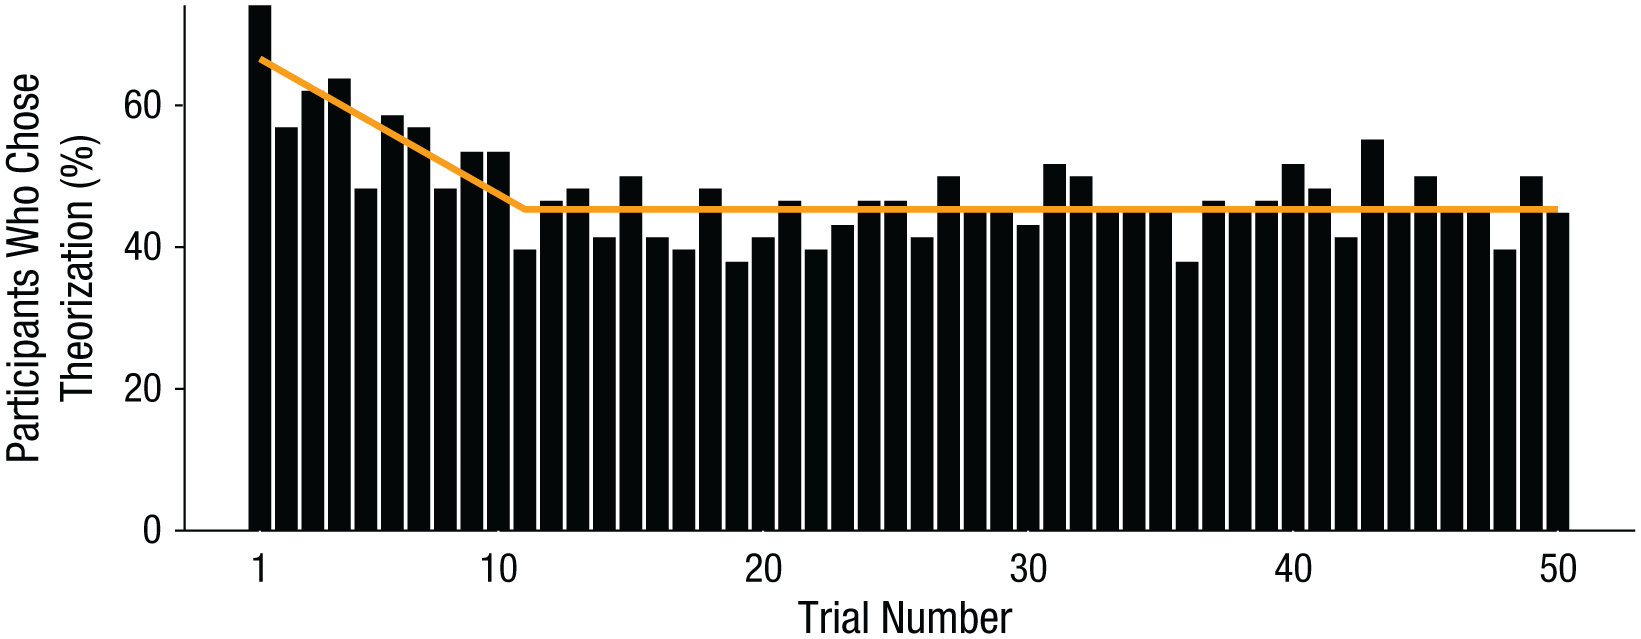
Results from Experiment 3: change in free-choice predictors’ preferred strategy over time. The bars show the percentage of free-choice predictors who chose the theorization strategy (i.e., the experiencer’s video) as a function of trial number. Also shown is the best-fitting line as estimated by a segmented linear regression model.
In summary, experience with the task alone did not lead predictors to value the simulation and theorization strategies accurately. In Experiment 4, we tested whether predictors’ evaluation of theorization would be appropriate if we increased its effectiveness by asking a new set of experiencers to explicitly exaggerate their emotional expressions.
Experiment 4
Experiment 4 was based on the procedures used in Experiments 1 and 3, but in this case the experiencers were assigned to different conditions. Specifically, they were asked to suppress their facial expressions, to express them as clearly as possible, or to simply behave as normal while they rated their emotional response to the pictures. This design allowed us to conduct two important theoretical tests. First, we tested whether increasing the effectiveness of theorization would calibrate confidence, or instead increase confidence in the effectiveness of theorization even further. Second, we tested whether theorization predictors could possibly outperform simulation predictors when the experiencers’ behavioral cues were made as clear as possible.
Method
Fifty-six participants (27 women, 29 men) recruited from the same population as the experiencers in Experiment 1 served as the new experiencers. They viewed and rated the same slide show as their counterparts did in Experiment 1, in exchange for $10. All the experiencers were informed about being filmed before the slide show. Experiencers (n = 19) in the expressive condition were asked to try their best to convey exactly what they were feeling about each picture through their faces. In contrast, experiencers (n = 18) in the suppressive condition were asked to conceal whatever they were feeling from showing up in their faces. The remaining 19 experiencers, in the control condition, received no specific instruction on what to do with their facial movements, as in the preceding experiments.
Four hundred twenty-two participants (209 women, 213 men) recruited via MTurk served as predictors. Each predictor estimated the feelings of a randomly selected experiencer from the new pool. Given the large effect sizes observed in Experiment 3, we reduced the average number of predictors per experiencer per condition from 3 to 2.5 to reduce the experiment’s cost. We therefore targeted a total sample size of 420 participants, determined by the heuristic that each experiencer would be assigned to an average of 2.5 predictors in each condition. In return for their participation, predictors earned $1.50, plus an additional bonus based on the accuracy of their judgments. Specifically, they were told that they would earn an extra $5 if their performance ranked above the 80th percentile.
We randomly assigned the predictors to one of the same three conditions as in Experiment 1: simulation, theorization, or simultaneous. This yielded a 3 (experiencer’s expressivity: expressive, control, suppressive) × 3 (prediction strategy: simulation, theorization, simultaneous) between-participants design. After the prediction task, all predictors indicated their confidence in their prediction accuracies on the same confidence scale used in the preceding experiments. Predictors in the simultaneous condition also made two counterfactual confidence ratings. Specifically, they indicated how well they would have performed if they had had access to only the videos and how well they would have performed if they had had access to only the slide show. Both counterfactual ratings were made on the same scale as the actual confidence rating.
Results
Figure 3 presents the average correlation between predicted and actual ratings and the average confidence rating in each condition. As expected, theorization predictors were significantly more accurate in the expressive condition (M = .54, SD = .23) than in the control condition (M = .20, SD = .26), t(413) = 8.66, p < .001, CLES = 83.61%, and were significantly less accurate in the suppressive condition (M = .04, SD = .16) than in the control condition, t(413) = 4.01, p < .001, CLES = 30.56%. More important, in the expressive condition, theorization predictors were significantly less accurate than simulation predictors (M = .71, SD = .16), t(413) = 3.91, p < .001, CLES = 71.68%. Even when evaluating people who were deliberately trying to make their emotional reactions as obvious as possible, predictors were more accurate when they put themselves in the experiencer’s situation than when they tried to read the experiencer’s expression.

Results from Experiment 4: mean correlation between predicted and actual ratings (left panel) and mean confidence (right panel) in each cell of the 3 (experiencer’s expressivity: expressive, control, suppressive) × 3 (prediction strategy: simulation, theorization, simultaneous) design.
The average absolute difference between predicted and actual ratings for theorization predictors showed a roughly similar pattern. The absolute difference was significantly smaller in the expressive condition (M = 1.43, SD = 0.41) than in the control condition (M = 2.07, SD = 0.47), t(413) = 7.46, p < .001, CLES = 84.39%, but was nonsignificantly larger in the suppressive condition (M = 2.15, SD = 0.34) than in the control condition, t(413) = 0.91, p = .63, CLES = 44.77%. More important, in the expressive condition, theorization predictors (M = 1.43, SD = 0.41) were not significantly more accurate than simulation predictors (M = 1.37, SD = 0.53), t(413) = 0.733, p = 0.74, CLES = 46.11%.
Accuracy among simulation predictors did not vary by expressivity condition, whether accuracy was measured by the average correlations, F(2, 142) = 2.21, p = .11, or the average absolute difference between predicted and actual ratings, F(2, 142) = 0.33, p = .72. Given that simulation predictors could not see the experiencers’ faces, this suggests that experiencers’ feelings did not vary by expressivity condition in a way that could alter the effectiveness of simulation. Indeed, experiencers’ mean ratings of their feelings and the mean standard deviation of their ratings across the 50 trials did not vary by expressivity condition, F(2, 53) = 1.02, p = .37, and F(2, 53) = 0.26, p = .77, respectively.
As in Experiment 1, being able to use both strategies (simultaneous condition) did not increase accuracy significantly beyond using simulation alone. If anything, being able to observe the experiencer’s expressions in addition to the IAPS pictures decreased accuracy. A 2 (prediction strategy: simultaneous, simulation) × 3 (experiencer’s expressivity: expressive, control, suppressive) analysis of variance on the average correlation between predicted and actual ratings revealed a significant main effect such that simulation predictors were more accurate than simultaneous predictors, F(1, 280) = 5.14, p = .02. This main effect was qualified by a significant interaction, F(2, 280) = 6.50, p = .002. When predictors were evaluating expressive experiencers, their accuracy did not differ between the simultaneous and simulation conditions, t(280) = 1.64, p = .11. However, simultaneous predictors were significantly less accurate than simulation predictors when evaluating control and suppressive experiencers, t(280) = −2.51, p = .01, CLES = 34.61%, and t(280) = −3.09, p = .002, CLES = 35.40%, respectively. Collapsing across the three expressivity conditions, we found that simultaneous predictors’ accuracy (M = .64, SD = .21) was roughly similar to simulation predictors’ accuracy (M = .68, SD = .15), t(413) = −2.05, p = .10, CLES = 43.63%, but significantly greater than theorization predictors’ accuracy (M = .26, SD = .30), t(413) = 16.31, p < .001, CLES = 85.17%. Analyses of the average absolute difference between predicted and actual ratings likewise revealed that simultaneous predictors were not more accurate than simulation predictors (M = 1.39, SD = 0.45, vs. M = 1.38, SD = 0.40, respectively), t < 1.
Overall, predictors who had access to both strategies for inferring another person’s experience would have been no worse off, if not better off, were they to have had access to simulation only. Yet their actual and counterfactual confidence ratings suggest that they believed that their accuracy would have suffered if they had been deprived of access to the face (M = 60.43, SD = 22.86, vs. M = 50.70, SD = 25.32, respectively), t(140) = 4.51, p = .001.
Although simulators significantly outperformed theorizers, the differences in accuracy were again not mimicked by commensurable differences in confidence. In the suppressive condition, simulators were more confident than theorizers 69.24% of the time but more accurate 99.64% of the time as measured by the average correlation, ΔCLES = −30.40%, 95% CI = [−42.02%, −19.64%], and more accurate 93.47% of the time as measured by the average absolute difference, ΔCLES = −24.22%, 95% CI = [−37.63%, −11.42%]. In the control condition, simulators were more confident than theorizers 52.05% of the time but more accurate 95.78% of the time as measured by the average correlation, ΔCLES = −43.73%, 95% CI = [−54.68%, −32.75%], and more accurate 89.31% of the time as measured by the average absolute difference, ΔCLES = −37.26%, 95% CI = [−49.93%, −24.66%]. Even in the expressive condition, simulators were more confident than theorizers 45.48% of the time but more accurate 71.68% of the time as measured by the average correlation, ΔCLES = −26.20%, 95% CI = [−44.40%, −10.01%], and more accurate 53.89% of the time as measured by the average absolute difference, ΔCLES = −8.41%, 95% CI = [−25.84%, 10.06%]. As the effectiveness of theorization increased from the suppressive to the control to the expressive condition, participants’ confidence judgments remained mostly miscalibrated. In other words, differences in the perceived effectiveness of the theorization strategy tracked differences in its actual effectiveness: Its perceived effectiveness was larger in the expressive condition than in the control condition (67.95 vs. 55.43), t(413) = 12.52, p = .027, and was smaller in the suppressive condition than in the control condition (42.67 vs. 55.43), t(413) = 12.76, p = .022. Thus, predictors continued to overestimate the value of reading another person’s expressions compared with being in another person’s situation.
Results from the simultaneous predictors, who were able to use both strategies, provide a more revealing comparison of the perceived value of simulation and theorization. Recall that the simultaneous predictors’ performance was much closer to that of the simulators (CLES = 43.63%) than it was to that of the theorizers (CLES = 85.17%). This suggests that their accuracy came primarily from viewing the pictures the experiencers viewed rather than seeing the videos of the experiencers’ expressions.
We tested whether simultaneous predictors were aware of the source of their accuracy by asking them to predict, at the end of the experiment, how accurate they would have been if they had had access to only one of the strategies rather than both of them. Simultaneous predictors believed they would have been just as accurate using theorization as using simulation to evaluate both the expressive experiencers (M = 52.62, SD = 25.50, vs. M = 53.88, SD = 23.64) and the control experiencers (M = 49.09, SD = 28.40, vs. M = 48.64, SD = 24.09), t(138)s = −0.27 and 0.09, respectively, ps > .75. These predictors seemed to believe that their accuracy in these two expressivity conditions came equally from the two sources of information, when in fact it seemed to come mostly from seeing the picture the experiencers were viewing. Simultaneous predictors did believe they would be significantly less accurate using theorization than using simulation in the suppressive condition (M = 32.19, SD = 30.22, vs. M = 50.12, SD = 28.53), t(138) = −3.66, p < .01, CLES = 66.70%. However, this difference in counterfactual confidence ratings (CLES = 66.70%) was still significantly less than the actual advantage of simulation over theorization in the suppressive condition, both as measured by the average correlation (CLES = 99.64%), ΔCLES = −32.95%, 95% CI = [−46.00%, −21.68%] and as measured by the average absolute difference (CLES = 93.47%), ΔCLES = −26.77%, 95% CI = [−41.20%, −15.00%].
Even when actively using both theorization and simulation, participants seemed to undervalue the extent to which accurate insight into the mind of another person came from being in his or her situation. We believe this underestimation stems, at least in part, from a tendency to overestimate the degree to which experiences in the same situation differ across individuals. If so, then people may be more likely to recognize the value of simulation when evaluating someone who is very similar to themselves. We tested this prediction in Experiment 5 by asking participants to predict the emotional experiences of the most similar person: themselves.
Experiment 5
Method
This experiment consisted of two phases. Our plan was to complete Phase 1 in the first week of the 10-week academic quarter and to complete Phase 2 in the last week of the academic quarter. We decided to collect data from as many participants as the laboratory schedule would allow in Phase 1 and eventually recruited 44 participants. These participants reported their emotional reactions to the same slide show used in the previous experiments, in exchange for $10. During the slide show, participants’ faces and upper bodies were videotaped by a concealed webcam, as in the preceding experiments. Participants learned about being filmed at the end of the experiment, and all consented to our using the videotape for research at that time.
Phase 2 began approximately 8 weeks later, when these participants were contacted again and asked to return to the laboratory as part of a follow-up experiment. Twenty-one participants (7 men, 14 women) responded and completed Phase 2, during which they were asked to predict their own Phase 1 emotional ratings and the Phase 1 ratings of another randomly selected participant (the order of target experiencers was randomly determined). For both sets of predictions, participants had access only to the video recordings of the experiencers’ expressions (i.e., participants were in the theorization condition).
Before making their predictions, participants estimated how accurate they would be in predicting their own and the other participant’s emotional reactions. These ratings were made on the same confidence scale used in the preceding experiments. After completing their predictions for both experiencers, participants estimated how accurate they would have been predicting each person’s feelings if they had been in a simulation condition instead (i.e., if they had viewed the pictures seen by the experiencer instead of the video of the experiencer’s expressions). Finally, we assessed the effectiveness of actual simulation in this paradigm by asking participants to go through the slide show again and report their actual emotional reactions. By correlating participants’ Phase 2 emotional ratings with their own and the other experiencer’s Phase 1 ratings, we were able to measure the accuracy they could achieve using simulation to predict their own and another person’s emotional reactions.
Results
As in the preceding experiments, participants were not especially accurate when trying to predict another person’s emotional experience by reading his or her expressions. In fact, participants were no more accurate when evaluating themselves than when evaluating another randomly selected experiencer, whether we measured accuracy as the average correlation between predicted and actual ratings (M = .25, SD = .20, vs. M = .22, SD = .18, respectively), t < 1, CLES = 53.58%, or as the average absolute difference between them (M = 2.18, SD = 0.46, vs. M = 2.15, SD = 0.42, respectively), t < 1, CLES = 48.00%.
Once again, simulation was a significantly more effective strategy for accurately predicting emotional experiences. Participants’ Phase 2 experience was highly correlated with their Phase 1 experience (M = .86, SD = .07). It was also highly correlated with another participant’s Phase 1 experience (M = .70, SD = .10), to a similar degree as we observed in the simulation conditions of the preceding experiments. This correlation measure indicated that participants would have been dramatically more accurate using their own current experience as a source of simulation than trying to read expressions, both when they evaluated themselves, t(40) = 13.52, p < .001, CLES = 99.92%, and when they evaluated other participants, t(40) = 10.59, p < .001, CLES = 98.27%. These results demonstrate that accuracy rates for the two strategies had essentially nonoverlapping distributions.
The average-absolute-difference measure of accuracy showed similar results. Specifically, participants were more accurate using simulation than using theorization, both when evaluating themselves (M = 0.85, SD = 0.24, vs. M = 2.18, SD = 0.46), t(40) = 12.53, p < .001, CLES = 99.51%, and when evaluating other participants (M = 1.40, SD = 0.32, vs. M = 2.15, SD = 0.42), t(40) = 7.05, p < .001, CLES = 92.28%.
More important for our predictions, participants again did not seem to appreciate the value of simulation. In fact, after they made their predictions for both experiencers, they believed they would have performed significantly worse if they had been in the simulation condition (M = 47.26, SD = 24.15) than they had expected to perform in the theorization condition at the start of the experiment (M = 56.91, SD = 17.28), t(20) = 2.37, p = .028, CLES = 62.73%, regardless of whether they were predicting their own or another person’s reactions, F(1, 20) = 0.10, p = .75. This was the case even though simulation outperformed theorization by an extremely large margin. Participants’ expectations about the effectiveness of each strategy were not simply off by a matter of degree; their expectations had the rank ordering reversed.
As we predicted, participants expected that simulation would be a more effective strategy when they evaluated themselves (M = 53.57, SD = 25.80) than when they evaluated other people (M = 40.95, SD = 21.13), t(40) = 3.17, p = .02, CLES = 64.75%. Indeed, participants’ own experience was more strongly correlated with their own prior experience (M = .86, SD = .07) than with another person’s experience (M = .70, SD = .10), t(40) = 3.40, p = .008, CLES = 89.66%. Participants also expected that theorization would be a more effective strategy when they evaluated themselves (M = 64.05, SD = 16.02) than when they evaluated another participant (M = 49.76, SD = 15.77), t(40) = 3.58, p = .005, CLES = 73.75%. In this case, participants’ expectations were mistaken, because they were not more accurate reading themselves than reading another participant. Although participants recognized that their own experience would be a better proxy for predicting the ratings of a highly similar experiencer (themselves) than for predicting the ratings of an experiencer chosen at random, they continued to dramatically underestimate the value of getting someone’s perspective by being in his or her situation, even for predicting their own mental experience.
General Discussion
Our five experiments suggest that Atticus Finch’s advice to Scout—that “you never really understand a person until you consider things from his point of view”—is not just good advice, it is surprisingly good advice. Participants trying to understand another person’s emotional experiences consistently overestimated the accurate insight gained by reading the other person’s expression and underestimated the insight gained by being the other person’s situation. Participants’ tendency to undervalue simulation relative to theorization emerged in foresight (Experiment 2), in hindsight (Experiments 2–5), and in the midst of trying to understand another person’s mind (Experiment 3). Another person’s mind is arguably the most complicated system that anyone will ever think about. Our results suggest that people do not fully appreciate when they are using a relatively good strategy for understanding that most-complicated system and when they are not.
Any strategy’s effectiveness varies from one context to another. Our experiments do not suggest that simulation will always outperform theorization; rather, they indicate only that people’s intuitions may—quite dramatically—underestimate the effectiveness of simulation. The effectiveness of theorization should increase where there are obvious differences between different individuals’ experiences, or when there are easily observable cues to another person’s thoughts or feelings. However, in Experiment 4, we attempted to make theorization as effective as possible by asking some experiencers to be as expressive as they could. Even in this case, simulating another person’s experience outperformed reading another person’s behavior, and predictors continued to undervalue simulation. The effectiveness of simulation, in contrast, will be decreased when actual experiences vary across people, or when they vary more than expected across people (e.g., Hodges, Kiel, Kramer, Veach, & Villanueva, 2010). Nevertheless, Experiments 4 and 5 together demonstrated that altering the actual effectiveness of each strategy also altered the perceived effectiveness of each strategy, thereby maintaining the tendency to underestimate the value of simulation. The perceived effectiveness of each strategy is not random but rather is systematic, as demonstrated in the pretest to Experiment 2. We therefore predict that the bias to undervalue simulation relative to theorization is also likely to be robust across contexts that vary the actual effectiveness of each strategy.
Our experiments are the first we know of that compared intuitions about the effectiveness of interpersonal inference strategies with their actual effectiveness, but our findings extend at least three existing lines of research. First, research on affective forecasting demonstrates that people are more accurate predicting their future emotional experience when they learn how someone else felt in the same circumstance than when they attempt to guess how they would feel on the basis of a description of the circumstance (Gilbert et al., 2009). And yet, people undervalue the benefit of learning from another person’s experience in the same circumstance, presumably because they believe that another person’s experience is not a good guide for their own predictions. We have documented the interpersonal equivalent of this intrapersonal forecasting error. Whereas Gilbert et al.’s participants were reluctant to use another person’s experience as a guide to their own experience, our participants were reluctant to use their own experience as a guide to another person’s. The outcome was identical in the two cases: People were relatively accurate when they based their predictions on someone who was actually in the situation, and yet failed to appreciate this fact. Basic lessons from intrapersonal judgment apply to interpersonal judgment as well.
Second, our research contributes to a growing literature on the perceived versus actual accuracy of nonverbal cues in everyday experience (Ames, Kammrath, Suppes, & Bolger, 2010; Barrett, 2011; Barrett, Mesquita, & Gendron, 2011; Kring & Gordon, 1998). Lies do not “leak out” in facial expressions in the ways that people attempting to detect lies presume (The Global Deception Research Team, 2006; Porter & ten Brinke, 2008; Vrij, 2008). One’s own emotions are not as transparent to others as people may expect (Gilovich et al., 1998). Even the thrill of victory following a tennis match cannot be discerned from the agony of defeat in facial expressions alone (Aviezer et al., 2012). Our results suggest that overconfidence in the ability to read another person’s behavioral cues could lead people to undervalue a much more effective strategy for understanding the minds of others.
Finally, our research provides another example of the challenges of introspection (e.g., Kruger & Dunning, 1999; Nisbett & Wilson, 1977). Accurate insight into the mind of another person comes from getting that person’s perspective, by being in his or her situation. Nevertheless, our participants consistently believed, as did George W. Bush, that they could accurately read another person and therefore preferred this strategy more than they should have. Given the negative consequences that can come from misunderstanding the minds of others, the consequences of mistaken introspection could be profound.
Footnotes
Action Editor
Ralph Adolphs served as action editor for this article.
Declaration of Conflicting Interests
The authors declared that they had no conflicts of interest with respect to their authorship or the publication of this article.
Open Practices
All data have been made publicly available via the Open Science Framework and can be accessed at https://osf.io/j9aa7/. The complete Open Practices Disclosure for this article can be found at http://journals.sagepub.com/doi/suppl/10.1177/0956797616687124. This article has received the badge for Open Data. More information about the Open Practices badges can be found at  .
.
References
Supplementary Material
Please find the following supplemental material available below.
For Open Access articles published under a Creative Commons License, all supplemental material carries the same license as the article it is associated with.
For non-Open Access articles published, all supplemental material carries a non-exclusive license, and permission requests for re-use of supplemental material or any part of supplemental material shall be sent directly to the copyright owner as specified in the copyright notice associated with the article.
