



Abstract
Understanding why people make unhealthy food choices and how to promote healthier choices is critical to prevent obesity. Unhealthy food choices may occur when individuals fail to consider health attributes as quickly as taste attributes in their decisions, and this bias may be modifiable by health-related external cues. One hundred seventy-eight participants performed a mouse-tracking food-choice task with and without calorie information. With the addition of calorie information, participants made healthier choices. Without calorie information, the initial integration of health attributes in overweight individuals’ decisions was about 230 ms delayed relative to the taste attributes, but calorie labeling promoted healthier choices by speeding up the integration of health attributes during a food-choice task. Our study suggests that obesogenic choices are related to the relative speed with which taste and health attributes are integrated into the decision process and that this bias is modifiable by external health-related cues.
Obesity is a serious health problem worldwide, as it increases the risk of many health conditions, including heart disease, adverse lipid concentrations, Type II diabetes, certain types of cancer, and psychological distress (Dixon, 2010). Our modern society, in which palatable but unhealthy and calorically dense junk foods are easily accessible, has been described as an “obesogenic” environment that promotes weight gain (Swinburn, Egger, & Raza, 1999). To maintain a healthy energy balance and reduce the risk of obesity, people need to make food choices by considering the nutritional content of foods as well as the motivational benefits of consuming tasty food. This, however, is not so simple. At the individual level, healthier food choices require effective dietary self-control (i.e., resisting tasty but unhealthy foods; Ha et al., 2016; Hare, Camerer, & Rangel, 2009), which many individuals struggle with. Food-labeling requirements such as the Nutrition Labeling and Education Act (NLEA; Institute of Medicine, Committee on State Food Labeling, 1992) have been implemented as U.S. federal law to encourage healthier food choices, but our societal efforts to manage the obesity epidemic have been largely unsuccessful. To promote healthier choices that prevent obesity and boost the efficacy of societal health efforts, such as nutrition facts labeling, a better scientific understanding of the underlying psychological mechanisms of dietary self-control is necessary.
When choosing a food item, we consider several different attributes, such as tastefulness, healthiness, and accessibility. Behavioral economics and psychological studies suggest that when making decisions for choices with multiple attributes, we compute the overall stimulus value by assigning values to the individual attributes and integrating them using a strategy contingent on task demands (Bettman, Luce, & Payne, 1998; Lim, O’Doherty, & Rangel, 2013). Healthier choices can be achieved when we place greater emphasis on health attributes that provide long-term health benefits compared with other attributes that may provide an immediately rewarding experience but have negative nutritional consequences (e.g., declining unhealthy but tasty foods). Thus, researchers have explored dietary self-control mechanisms in which taste and health-attribute values are represented, controlled, and integrated into food decisions (Hare et al., 2009; Harris, Hare, & Rangel, 2013; Sullivan, Hutcherson, Harris, & Rangel, 2015). This research has yielded several important behavioral and neurobiological findings.
First, individuals with lower self-control significantly overweigh short-term tastiness compared with long-term healthfulness (Hare et al., 2009), which explains why self-control frequently lapses in nonsuccessful dietary self-controllers. Second, directing one’s attentional focus to health aspects of foods by using exogenous cues at the time of choice makes participants more responsive to health attributes and less responsive to taste attributes, increasing healthy choices (Hare, Malmaud, & Rangel, 2011). This suggests that successful dietary self-control partially depends on how participants utilize health-related external cues when making goal-directed food decisions. Third, successful dietary self-control is determined by temporally dissociable mechanisms of early attentional filtering and subsequent value modulation, which are both modulated by dorsolateral prefrontal cortex (dlPFC) activity (Harris et al., 2013). This finding suggests that temporal differences in dynamic decision processing might be important to determine the success or failure of dietary self-control.
Finally, a recent study demonstrated that dietary self-control is critically related to the relative speed with which health-attribute values and taste-attribute values are computed and processed at the time of food choices (Sullivan et al., 2015). This research suggests that considering abstract attributes that provide delayed benefits, such as healthfulness, requires additional higher-order cognitive processing, which is often delayed compared with quickly processed attributes, such as tastiness, during the dynamic decision process. Delayed consideration of heath attributes may bias dietary decisions toward taste-oriented choices rather than health-oriented choices by subsequently leading to an overemphasis on taste attributes and insufficient integration of health attributes (see SI Text and Fig. S1 in the Supplemental Material available online for computational simulations).
Taken together, these studies provide a new perspective on dietary self-control in obesity that has not been systematically studied. Obesogenic choices may not be solely determined by the inability to use health-related information. We need to investigate more precisely when overweight or obese individuals begin to utilize separate attributes, such as tastiness and healthfulness, in their decision process, which usually occurs very quickly, within a few seconds. This temporal difference in the dietary decision process may characterize obesogenic decision making in overweight or obese individuals. This knowledge would provide critical information to adapt societal efforts to prevent and treat obesity, as current research evaluating the efficacy of existing societal efforts that attempt to direct customers’ attention to health-related attributes, such as calorie labeling on both grocery food items and restaurant menus, is mixed and significantly varied by context (Cecchini & Warin, 2016; Nikolaou, Hankey, & Lean, 2015; VanEpps, Roberto, Park, Economos, & Bleich, 2016).
In this experimental study, we aimed to address two unresolved questions that might have important clinical and practical significance to continuing obesity research while partly replicating Sullivan et al.’s (2015) findings. First, we hypothesized that overweight or obese individuals would process taste-attribute values significantly faster than health-attribute values when making food decisions (i.e., delayed health-attribute value integration compared with taste-attribute value integration), which would potentially explain part of why overweight or obese individuals are prone to fail in their dietary self-control. Second, we hypothesized that external manipulation, such as nutrition labeling of food items, would systematically affect food decisions of overweight or obese individuals by shifting the relative speed of value-attribute processing (i.e., speeding up health-attribute value integration relative to taste-attribute value integration), which potentially directs us to how to help prevent or change unhealthy dietary food choices in obesity.
Method
Participants
One hundred seventy-eight college students with a mean age of 22.2 years (SD = 5.9; 54 males; 89 Caucasian, 15 Hispanic, 39 African American, 16 Asian, and 19 multiracial) were recruited through the Psych Pool online research participant recruitment system at the University of Missouri–Kansas City (UMKC). Target sample size (> 31 for each group) was determined on the basis of the effect-size parameter (d = 0.68, two-tailed) of a previous dietary choice mouse-tracking study (Sullivan et al., 2015) with α = .05, 1 – β = 0.95, and data collection was completed by the end of the academic semester. Participants received course credits for participating in the experiment. The study protocol was reviewed and approved by the UMKC Institutional Review Board. Prior to the experiment, all participants provided informed consent and completed a demographics questionnaire. Body weight and height were measured using a digital scale and stadiometer (PD300DHR; Detecto, Webb City, MO) to calculate body mass index (BMI; kg/m2). Of the 178 participants, 6 (3.4%) were underweight (BMI: < 18.5), 92 (51.7%) were normal weight (BMI: 18.5–24.9), 44 (24.7%) were overweight (BMI: 25–29.9), and 36 (20.2%) were obese (BMI ≥ 30; see Fig. S2 in the Supplemental Material for BMI distribution). Because we were mainly interested in comparing overweight and obese individuals with normal-weight individuals, we excluded underweight individuals (n = 6) from group comparison tests. For correlational analyses, data from all participants were used (note that removing underweight participants did not change our correlation results).
Experimental tasks
Participants first completed the food-rating task and then the mouse-tracking food-choice task. Sixty food images were used for both tasks. Experimental stimuli included 30 healthy food items, such as vegetables, fruits, and beans, and 30 unhealthy food items, such as fast food, sweet desserts, processed meats, and fried foods. Food images were presented without any logos or brand names. The calorie amounts (standard serving size) for each food item were counted from the U.S. Department of Agriculture food composition database (https://ndb.nal.usda.gov/). All food pictures were high-resolution (72 dpi) color images with a size of 300 × 300 pixels.
Food-rating task
Participants completed two tasks to provide separate ratings for taste attributes (very bad, bad, good, or very good) and health attributes (very unhealthy, unhealthy, healthy, or very healthy) for each food item. Items were presented on a computer monitor, and participants responded using buttons on the keyboard (Fig. 1a). The order of these two tasks was counterbalanced across participants. To confirm that participants understood the different attribute ratings, we presented the task-type cue (“taste” or “health”) above the food image during the rating decision process. For each individual food item, participants were instructed to provide their subjective taste rating (60 trials) regardless of health attributes and provide their subjective health rating (60 trials) regardless of taste attributes. After taste- and health-attribute ratings, participants were then asked to provide a liking rating (60 trials) for each food item by indicating how much they liked or disliked the item using a 5-point rating scale (strongly dislike, dislike, neutral, like, or strongly like). This overall-preference-rating task was always presented after the taste- and health-attribute ratings. For all rating runs, the food items were presented in a random order and stayed on the screen until a response was entered. Rating trials were separated by a blank screen with a 1-s fixation cross. The stimulus presentation and behavioral response collection for the food-rating task were controlled by Presentation software (Neurobehavioral Systems, Albany, CA).

Experimental tasks. Participants rated 30 healthy and 30 unhealthy randomly presented food items (a) according to taste, health, and overall preference. The order of taste and health ratings was counterbalanced across participants. After rating the items, participants completed the mouse-tracking food-choice task (b), in which they indicated their decision to “eat” or “not eat” for the same 30 healthy and 30 unhealthy food items by moving a mouse cursor from the start area to the decision zones at the upper left and upper right corner of screen. The order of calorie-information and non-calorie-information blocks was randomized. The spatial position for “eat” and “not eat” (left vs. right) was counterbalanced across participants. The trajectory of mouse point (dotted line) is shown here for purposes of illustration. A sample food image with calorie information is shown in (c).
Mouse-tracking food-choice task
After the food-rating task, participants completed a two-alternative forced-choice task using a mouse-tracking paradigm that records mouse trajectory data over the course of the entire decision process (Fig. 1b). The same 30 healthy and 30 unhealthy food items shown during the food-rating task were used for the mouse-tracking food-choice task. The mouse-tracking food-choice task consisted of two different types of decision condition blocks (the non-calorie-information condition and the calorie-information condition), which were presented in random order. In both conditions, participants were asked to make a choice between two response alternatives, “eat” and “not eat,” for each food item. Participants were told to make choices freely on the basis of their desires at that moment and that there was no correct or incorrect answer. The trial structures of the task were identical for both conditions, except that additional calorie information for the food item was provided simultaneously below the food image.
During the mouse-tracking food-choice task, participants completed four non-calorie-information blocks and four calorie-information blocks. Each choice block contained 30 decision trials (15 healthy and 15 unhealthy items). The order of both the block conditions and trials within each block were randomized. Participants completed 120 decision trials (60 items × 2 repetitions) in the non-calorie-information condition and 120 decision trials (60 items × 2 repetitions) in the calorie-information condition. Choice trials were separated by a 1-s blank screen with a fixation cross. Participants were given a break between blocks for as long as necessary.
For each choice trial, participants were instructed to click on the “START” box located at the bottom center of the monitor screen to begin the trial, which subsequently began the recording of the mouse trajectory and presented a food item in the middle of the screen. For the choice trials of the calorie-information condition, additional calorie information was shown below the food image (see Fig. 1c). Participants were asked to move the mouse cursor continuously to make a prompt decision whether they wanted to eat a food item (“eat”) or they did not want to eat it (“not eat”). To remove a potential confounding effect, we counterbalanced the spatial location of “eat” and “not eat” (upper left/upper right or upper right/upper left) across participants. Within individuals, the locations of two response options remained the same to prevent errors resulting from the location change. The food image and “eat” and “not eat” boxes appeared on the screen until participants completed each decision. To best capture the dynamic decision process through mouse trajectory recording paradigm, we encouraged participants to initiate mouse movement immediately on clicking the start button, even if they were not fully sure of their response yet. A warning message appeared if participants did not complete their decision within 3 s after beginning the trial to encourage them to respond as quickly as possible. The stimulus presentation and behavioral response collection for the mouse-tracking food-choice task were controlled by MouseTracker software (http://www.mousetracker.org).
Control mouse-tracking food-choice task with color information
Among the 178 participants, the final 39 participants (2 underweight, 15 normal-weight, 11 overweight, and 11 obese individuals) completed an additional control food-choice task at the end of study. The food stimuli and structure of the task paradigm were identical to those of the main mouse-tracking food-choice task, but task-irrelevant color information (color name and hex code; see Fig. S3A in the Supplemental Material) was presented instead of the calorie information. This control task was designed to check the specificity of calorie-labeling effects on food choices by ruling out a possibility that any additional task-irrelevant information, such as color name and hex code, would produce similar effects of calorie information.
Mouse-tracking data
During mouse-tracking food-choice trials, the MouseTracker software recorded x and y coordinates of the computer mouse at a sampling rate of approximately 60 to 75 Hz, and all mouse trajectories (in pixels) were rescaled into a standard x, y coordinate space that had the start point at [x = 0, y = 0], the top-right point at [x = 1, y = 1.5], and the top-left point at [x = −1, y = 1.5] (Freeman & Ambady, 2010). The software package normalized each mouse trajectory by 100 time-normalized equal spaces (normalized time index t = 1 through t = 101) using linear interpolations through which the mouse trajectory of each choice was expressed by x and y coordinates in 100 normalized time spaces, [xt1, yt1] through [xt101, yt101]. This interpolation allowed trajectory-data averaging and comparison across multiple trials with sizably different reaction times. This normalization is crucial, because the analyses with nonnormalized (absolute) time points would reflect different stages of decision process across different individuals. To ensure our critical assumption that the mouse trajectory data reflect actual on-line (dynamic) decision processing rather than off-line processing, we set the initiation cut time to 450 ms, assuming that longer initiation times indicated that participants might have made their decision before moving the mouse (Freeman & Ambady, 2010; Hehman, Stolier, & Freeman, 2015). Thus, the trials in which mouse movement was not initiated within 450 ms after clicking the start button were excluded.
Statistical analyses
In general, the behavioral data were analyzed by fitting mixed repeated measures general linear models (GLMs). We employed Greenhouse-Geisser correction for all repeated measures GLMs, and the family-wise Type I error was controlled by Tukey’s post hoc test procedure. For correlational analyses, we employed Bonferroni correction.
Results
Attribute and preference ratings of food items
Normal-weight, overweight, and obese groups’ descriptive statistics of behavioral ratings (taste attribute, health attribute, and overall preferences) for healthy and unhealthy food items are reported in Table 1 and Figure 2a. For each type of rating, we performed 2 (food: healthy, unhealthy) by 3 (group: normal weight, overweight, obese) repeated measures analyses of variance (ANOVAs). For taste-attribute ratings, no significant effects of food, F(1, 169) = 2.19, p = .140, η2 = .01; group, F(2, 169) = 2.13, p = .122, η2 = .03; or their interaction, F(2, 169) = 0.96, p = .384, η2 = .01, were found, suggesting that participants perceived tastiness of healthy and unhealthy food items similarly. For health-attribute ratings, significant main effects of food, F(1, 169) = 3,228.47, p < .001, η2 = .95, and group, F(2, 169) = 4.55, p = .012, η2 = .05, were observed, while an interaction effect was not significant, F(2, 169) = 1.89, p = .154, η2 = .02. Similarly, for overall preferences, significant main effects of food, F(1, 169) = 10.76, p = .001, η2 = .06, and group, F(2, 169) = 3.13, p = .046, η2 = .04, were observed, while an interaction effect was not significant, F(2, 169) = 0.73, p = .483, η2 = .01.
Means and Standard Deviations for Behavioral Ratings of Food Items


Health and taste ratings. Mean health and taste ratings for healthy and unhealthy food items (a) are shown separately for the normal-weight, overweight, and obese groups. The histogram (b) shows correlation coefficients between health and taste ratings for the three groups. The scatterplot (c) shows taste- and health-attribute beta weights from the regression analyses, separately for participants in each group. Overall food preferences in each group (d) were determined by health and taste attributes. Error bars represent standard errors of the mean computed across participants.
In simple analyses with one-way ANOVAs, no significant group differences were found in participants’ ratings for taste attributes, health attributes, or overall preferences (all F test ps > .091) except in health-attribute ratings for unhealthy food items, F(2, 169) = 3.90, p = .022, η2 = .04. Subsequent post hoc tests revealed that individuals who were obese perceived unhealthy foods items as less healthy than individuals who were normal weight and overweight, t(126) = −2.55, p = .031, 95% confidence interval (CI) = [−0.27, −0.10]; t(78) = −2.49, p = .037, 95% CI = [−0.30, −0.01]. We also examined the correlations between taste- and health-attribute ratings in our data. As shown in Figure 2b, we found that correlation coefficients were widely varied across individuals with a normally distributed mean (r = .10, SD = .34). There was no significant group difference in correlation coefficients (after Fisher’s z transformation) of the two attributes, F(2, 170) = 0.63, p = .533, η2 = .01.
Next, we examined how individuals who are normal weight, overweight, and obese differently integrate taste- and health-attribute values into their overall preferences. For each individual, we fitted a linear regression model of taste and health ratings on overall preference ratings for all food items (see Fig. 2c for a scatter plot of taste and health beta weights). Two attribute-rating predictors were simultaneously entered in this regression model. Then, 2 (type: health, taste) × 3 (group: normal weight, overweight, obese) repeated measures ANOVAs were performed with estimated regression beta coefficients for group-level inferences. As shown in Figure 2d and in Figure S4A and Table S1 in the Supplemental Material, a main effect of type, F(1, 169) = 64.33, p < .001, η2 = .82, was significant, suggesting that taste attributes compared with health attributes had stronger influences on overall food preferences in all three weight status groups. No significant main effect of group, F(2, 169) = 1.27, p = .282, η2 = .02, or an effect of interaction, F(2, 169) = 1.48, p = .231, η2 = .02, were found. In simple analyses with one-way ANOVAs, there was a significant effect of group in health beta weights, F(2, 171) = 3.05, p = .050, η2 = .03, but there was no significant effect of group in taste beta weights, F(2, 171) = 0.48, p = .618, η2 = .01. Subsequent post hoc tests showed that individuals who are overweight compared with those who are normal weight used health attributes significantly less to determine their overall food preferences, t(126) = −2.40, p = .046, 95% CI = [−0.19, −0.01].
Effects of calorie labeling on food choices
The proportions of “eat” decisions between the non-calorie-information and calorie-information conditions for three groups are shown in Figure 3a and in Table S2 in the Supplemental Material. We conducted a 2 (food: healthy, unhealthy) × 2 (condition: calorie, non-calorie) × 3 (group: normal weight, overweight, obese) repeated measures ANOVA. There were significant main effects of food, F(1, 169) = 61.95, p < .001, η2 = .27, and condition, F(1, 169) = 14.57, p < .001, η2 = .08, while a main effect of group, F(2, 169) = 2.41, p = .093, η2 = .03, was not significant. No interaction effects were significant (all ps > .099). In simple analyses with paired-samples t tests examining the effects of calorie labeling on healthy and unhealthy food choices, we found that the proportion of “eat” decisions for healthy food items was not significantly affected by calorie labeling in all three groups (all ps > .262). However, for unhealthy food items, the calorie labeling significantly decreased “eat” decisions in all three groups—normal-weight group: mean difference = −3.1% (SD = 10.7%), t(91) = −2.75, p = .007, 95% CI = [−0.05, −0.01]; overweight group: mean difference = −6.4% (SD = 16.4%), t(43) = −2.60, p = .013, 95% CI = [−0.11, −0.01]; obese group: mean difference = −8.2% (SD = 16.1%), t(35) = −3.05, p = .004, 95% CI = [−0.14, −0.03], demonstrating the positive influence of additional calorie information on dietary self-control.
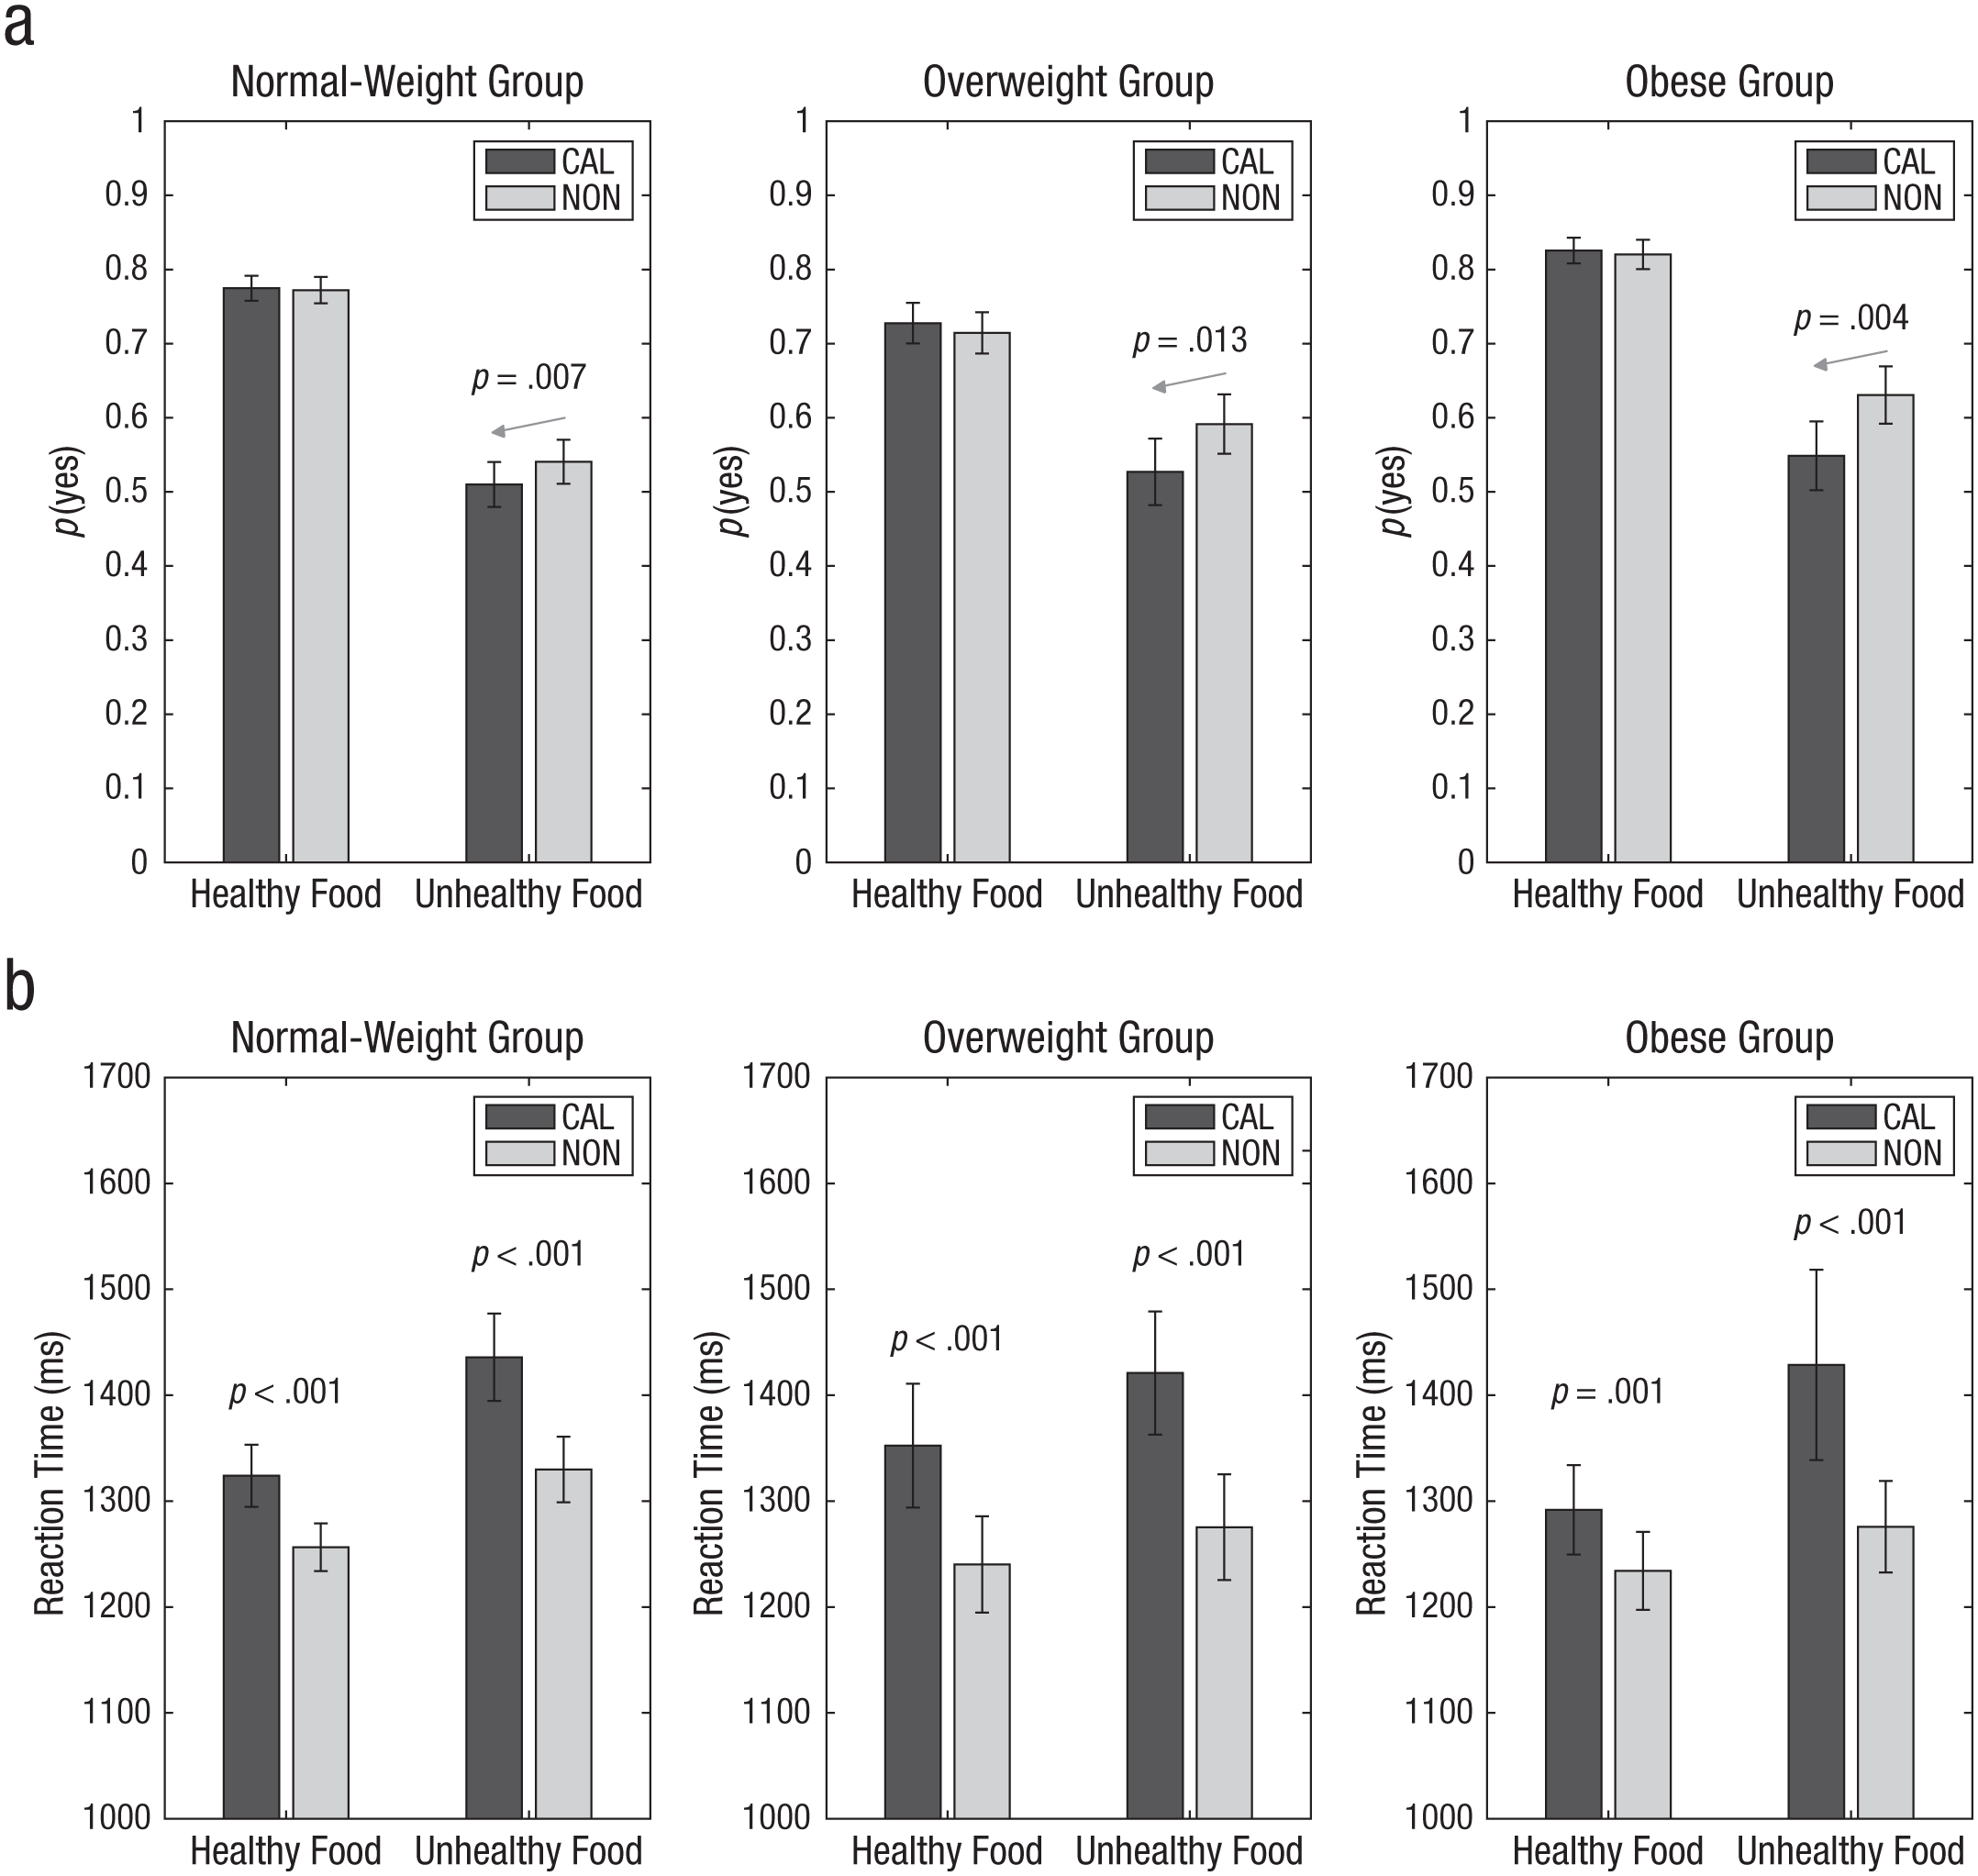
Behavioral data from food-choice task for the normal-weight, overweight, and obese groups. The proportion of trials on which participants selected “eat” (a) and mean reaction time (b) are shown as a function of food type and calorie-information condition (CAL = calorie information, NON = no calorie information). The gray arrows in (a) indicate that participants chose unhealthy food significantly less in the calorie-information condition compared with the non-calorie-information condition, and p(yes) indicates the proportion of “eat” decisions. Error bars represent standard errors of the mean computed across participants.
Next, we analyzed reaction time data (Fig. 3b; see also Table S3 in the Supplemental Material) with a 2 (food: healthy, unhealthy) × 2 (condition: calorie, non-calorie) × 3 (group: normal weight, overweight, obese) repeated measures ANOVA. Similar to the “eat” decision results, there were significant main effects of food, F(1, 169) = 11.54, p = .001, η2 = .06, and condition, F(1, 169) = 76.87, p < .001, η2 = .31, while a main effect of group, F(2, 169) = 0.06, p = .946, η2 = .001, was not significant. All other interaction effects were not significant (all ps > .246). Not surprisingly, across all food-choice conditions, participants were significantly slower to make their choices in calorie-information condition compared with non-calorie-information condition (all ps < .005), suggesting that additional sensory and cognitive processing was required in the calorie condition.
Mouse point trajectories of food choices
To examine the dynamics of the food-choice process, we computed the average mouse point trajectories (x and y coordinates for 100 time-normalized equal spaces) for each experimental choice condition (Fig. 4). For comparisons of two alternative choices, the sign of x coordinates for mouse point trajectories toward the upper-left option was flipped for both spatial mapping conditions (“eat vs. not eat” or “not eat vs. eat”; counterbalanced). In mouse-tracking paradigms, the area-under-the-curve (AUC) index measures amounts of curvature between the actual trajectories and the ideal trajectories (i.e., a straight line from the start point to the final point; Fig. 4d; Freeman & Ambady, 2010). The AUC represents a decision maker’s cognitive efforts to shift a decision toward the selected option from the unselected option to which he or she was initially attracted. For example, as illustrated in Figure 1b (calorie-information condition), an initial decision toward “eating” high-calorie fries could be shifted to “not eating” high-calorie fries during a dynamic decision process through effortful cognitive regulation, and this shift would be evidenced in the greater deviation of the mouse trajectory from a linear ideal trajectory.
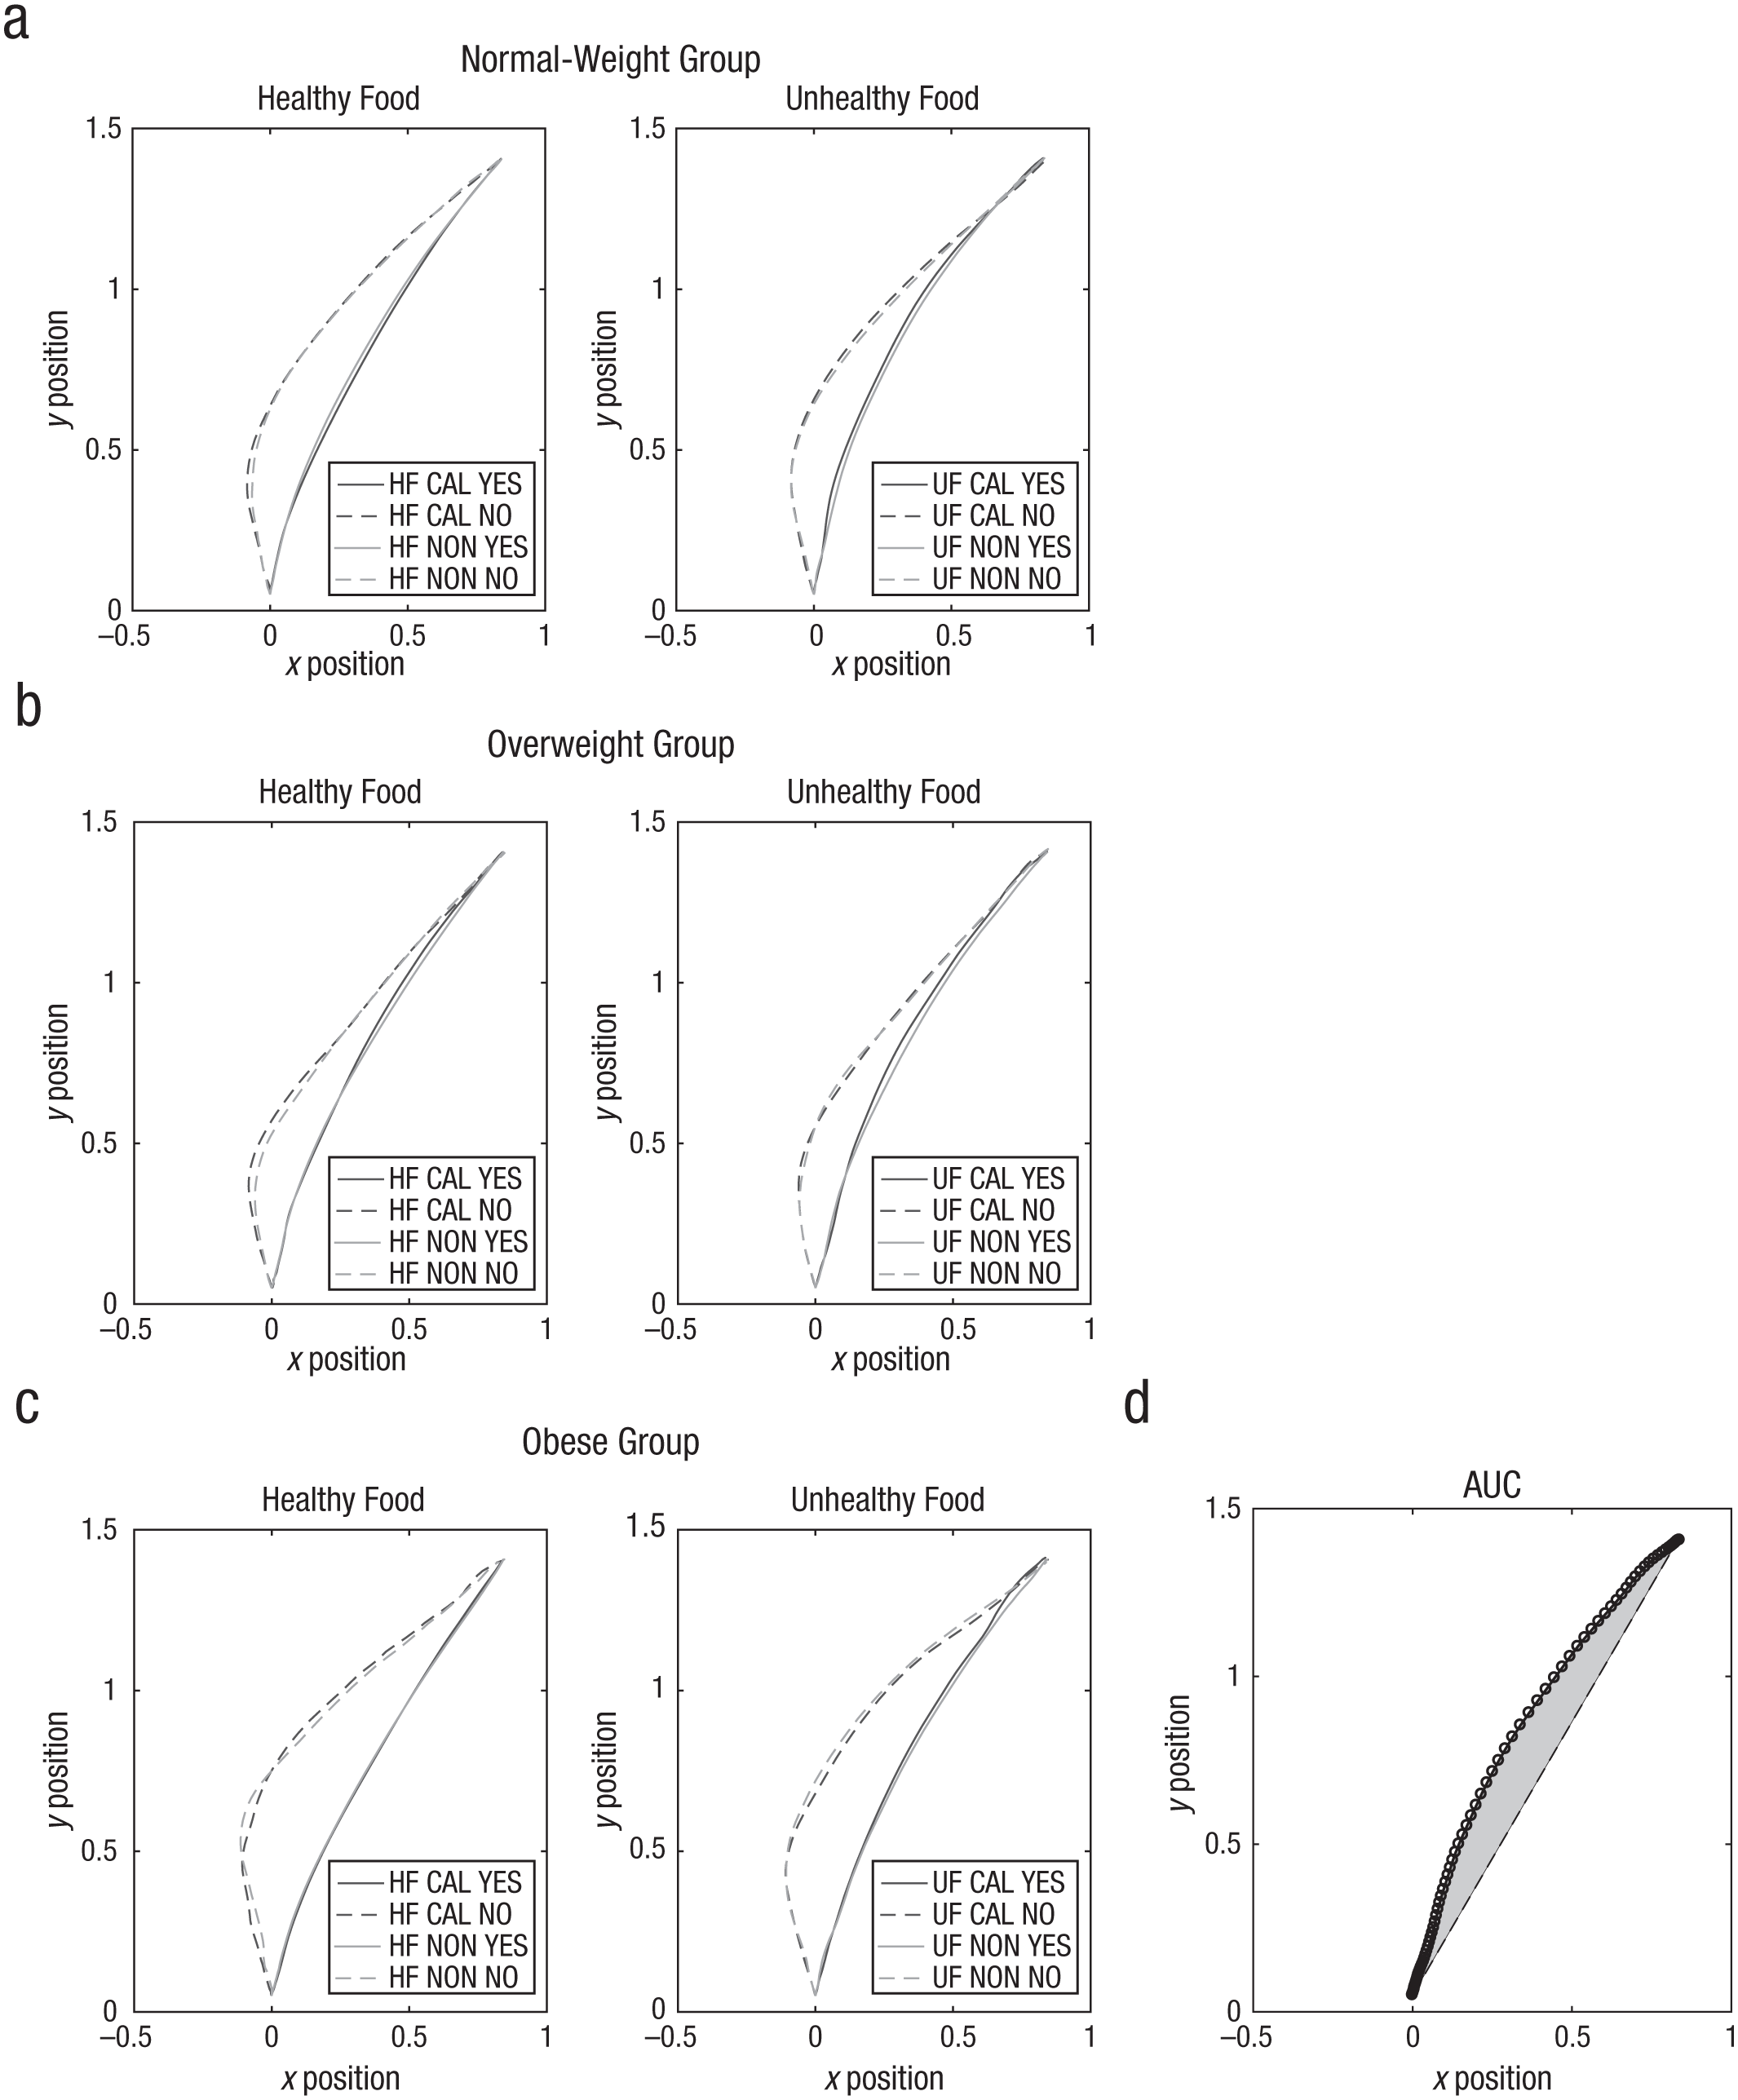
Mouse-tracking plots from the food-choice task, separately for the (a) normal-weight, (b) overweight, and (c) obese groups. For each group, trajectories are shown for each trial type in the healthy- and unhealthy-food conditions. For comparisons, mouse trajectories toward the upper left corner were horizontally flipped. The calorie-information effect (d) was significant for the area-under-the-curve (AUC) measure of unhealthy food “yes” decisions. The AUC measure of mouse trajectory is calculated as the geometrical area (shaded area) between the actual mouse trajectory (curved line) and the idealized mouse trajectory (straight line). HF = healthy food; UF = unhealthy food; CAL = calorie-information condition; NON = non-calorie-information condition.
Descriptive statistics of the AUC scores are shown in Table S4 in the Supplemental Material. Because the previous mouse-tracking food-choice study (Sullivan et al., 2015) did not compare the AUC index, we performed exploratory analyses with three weight status groups. In our exploratory 2 (food: healthy, unhealthy) × 2 (condition: calorie, non-calorie) × 2 (decision: yes, no) × 3 (group: normal weight, overweight, obese) repeated measures ANOVA, there were significant main effects of food, F(1, 149) = 4.86, p = .029, η2 = .03, and decision, F(1, 149) = 58.91, p < .001, η2 = .28, while main effects of condition, F(2, 149) = 1.58, p = .210, η2 = .01, and group, F(2, 149) = 1.22, p = .298, η2 = .02, were not significant. All other interaction effects were not significant (all ps > .093). Our results suggest that decisions for unhealthy food items compared with healthy food items generally increased cognitive efforts or demands in all three weight status groups. Generally, participants’ trajectories showed an initial attraction to “eat” decisions compared with “not eat” during dynamic food decision processes in all three weight status groups.
Additionally, we explored the possibility that participants might have stopped moving the computer mouse after an initial movement in a subset of trials, interrupting the dynamic nature of the decision process. We operationally defined these atypical “stop-and-go trials” in which x and y coordinates of the mouse cursor stayed in the same location over 15 standardized time points (~200 ms). Note that temporary brief stops would be natural responses if participants switched their responses in the middle of decision making. Our results showed that participants rarely made atypical stop-and-go responses (M = 2.67, SD = 3.41; 1.1% of 240 trials). A 2 (food: healthy, unhealthy) × 2 (condition: calorie, non-calorie) × 3 (group: normal weight, overweight, obese) repeated measure ANOVA did not show any significant effect (all ps > .065), suggesting that a systematic bias did not exist in the stop-and-go trials.
Taste and health value computations in the dynamic food-choice process
We hypothesized that the delayed health-attribute value integration relative to taste-attribute value integration at the time of the food choice would explain the frequent dietary self-control failures in overweight or obese individuals. We also hypothesized that external manipulation such as calorie labeling of food items would move the delayed health-attribute value integration up to the time of taste-attribute value integration, reducing dietary self-control failures.
To examine how taste- and health-attribute value computations occur in the dynamic food-choice process, we fitted a series of GLMs on mouse-angle trajectories across normalized time windows by adopting Sullivan et al.’s (2015) mouse-tracking data analysis approach. For each normalized time point (t = 1 through t = 101), the trajectory angle of mouse at point [xt, yt] from the start point [x = 0, y = 0] was predicted by taste and health ratings for the food items. The time series of mean beta weights of the three weight status groups are plotted in Figure 5. In this type of analysis (Sullivan et al., 2015), the beta weights of value attributes typically do not predict trajectories in the early stage (i.e., sensory processing). Instead, they emerge as significant predictors in the middle stage (i.e., the decision process) and then remain significant and stable throughout the final stage of decision making (i.e., action completion). More important, the earliest significant time (ST) represents the relative (normalized) time point at which the value attribute of interest starts to significantly and consistently contribute to the decision without subsequently becoming nonsignificant. Group-level inferential statistics were performed with the ST indices estimated at the individual level (see Table 2 for descriptive statistics).

Time-series plots for the effect of health and taste attributes on mouse trajectory, separately for the (a) normal-weight group, (b) overweight group, and (c) obese group. Beta weights of health and taste attributes were estimated from the regression analyses on mouse trajectory time-series data. Group-average beta weight time series are shown. Vertical lines represent the group averages of the earliest significance time when the effect of each attribute became significantly different from zero (p < .05, two-tailed; estimated individually for each participant) without subsequently becoming nonsignificant. The gray arrows indicate that the addition of calorie information significantly reduced the health attribute’s significance time as well as increased the maximum beta weight of the health attribute in the overweight group. CAL = calorie-information condition; NON = non-calorie-information condition.
Means and Standard Deviations of Significance Time of Taste and Health Values

A 2 (condition: calorie, non-calorie) × 2 (type: health, taste) × 3 (group: normal weight, overweight, obese) repeated measures ANOVA showed a significant main effect of type, F(1, 169) = 12.50, p = .001, η2 = .07, suggesting that participants began to use the taste-attribute values earlier than the health-attribute values in their dynamic food decisions, mean STtaste = 68.3; mean SThealth = 78.3. Although all other effects were not significant (all ps > .082), we observed a significant Condition × Group interaction effect, F(2, 169) = 4.01, p = .020, η2 = .05.
To further clarify this interaction effect, we performed simple-effects analyses with one-way ANOVAs. A one-way ANOVA with the SThealth of non-calorie information revealed a significant main effect of group, F(2, 169) = 3.33, p = .038, η2 = .04. Subsequent post hoc tests showed that overweight individuals began to use the health-attribute values more slowly than normal-weight individuals, t(134) = 2.57, p = .029, 95% CI = [0.88, 20.84]. However, when the calorie information was provided, no significant group difference of the SThealth was observed, F(2, 169) = 0.31, p = .736, η2 = .003. In the paired-samples t tests comparing the calorie-information and non-calorie-information conditions, no effects of calorie labeling were observed for both taste and health attributes in the normal-weight and obese groups (all ps > .325), suggesting that the additional calorie information did not meaningfully change the temporal dynamics of taste -and health-attribute value-integration processes in these weight groups. On the contrary, the overweight group revealed a noteworthy difference in our ST analyses. Without calorie information, the initial integration of health attributes in the overweight group was about 230 ms delayed relative to the taste attributes. However, when additional calorie information was provided, the integration of health attributes during a food-choice task was significantly accelerated in the overweight group, mean SThealth difference = −8.4, t(43) = −3.11, p = .003, 95% CI = [−13.79, −2.94] (see the horizontal arrow in Fig. 5b). In other words, the temporal dynamics of taste- and health-attribute value-integration processing in overweight individuals may be modified by external manipulation.
Next, we investigated how the three weight groups used taste- and health-attribute values in their final food decisions. To do so, we examined the magnitude of effects of the two attribute values on food decisions by comparing the maximums (asymptote) of estimated beta weights (Table 3). A 2 (condition: calorie, non-calorie) × 2 (type: health, taste) × 3 (group: normal weight, overweight, obese) repeated measures ANOVA showed a significant main effect of type, F(1, 169) = 31.77, p < .001, η2 = .16, suggesting that taste-attribute values compared with health-attribute values more strongly predicted food choices in all three weight status groups. A main effect of condition, F(1, 169) = 7.22, p = .008, η2 = .04, and an interaction effect of Condition × Group, F(2, 169) = 5.69, p = .004, η2 = .06, were also significant. In simple-effects analyses, a significant group difference was observed in the beta weight difference of health attributes between the calorie-information and non-calorie-information conditions, F(2, 169) = 4.39, p = .014, η2 = .05, while no difference was observed in the beta weight difference of taste attributes, F(2, 169) = 1.64, p = .197, η2 = .02.
Means and Standard Deviations of Maximum Beta Weights of Value Attributes

Post hoc tests on the beta weight difference of health attributes revealed that there was a significant difference between the normal-weight and overweight groups, t(134) = 2.92, p = .011, 95% CI = [−4.10, −0.43]. Similarly, in the subsequent paired-samples t tests examining the effect of calorie labeling, overweight individuals in the calorie-information condition considered health-attribute values more than did overweight individuals in the non-calorie-information condition, t(43) = 2.74, p = .009, 95% CI = [0.61, 4.00] (see the vertical arrow in Fig. 5b). No significant effects of calorie labeling on the beta weights of health attributes were observed in normal-weight individuals, t(91) = 0.10, p = .918, 95% CI = [−0.69, 0.77], and obese individuals, t(35) = 0.60, p = .551, 95% CI = [−0.94, 1.73], suggesting that additional calorie information itself may not be strong enough to make an observable change in dietary decision making in normal-weight and obese individuals. The analyses with taste- and health-attribute regression beta weights on binary food choices revealed similar results (see Fig. S4B in the Supplemental Material). Taken together, the mouse-tracking data analyses demonstrate that additional calorie information made overweight individuals more strongly consider the health-attribute values of food items as well as incorporate these values earlier in their dynamic decision process.
Correlation analysis
As demonstrated by our computational simulation (Fig. S1B in the Supplemental Material), we predicted that the temporal difference of attribute value integration would determine the success of self-controlled dietary decisions (i.e., healthy food choice). More important, we speculated that external manipulation such as calorie labeling would change the dietary decisions by systematically biasing the value attribute integration process. To explore the effects of calorie labeling on self-controlled dietary decisions, we performed additional correlational analyses with the ST- and food-choice changes. To represent whole group members’ variability, we included all individuals recruited in our study in correlation analyses (Fig. 6). To control family-wise Type I error, we used Bonferroni corrections for correlational analyses (corrected α = .05/5 = .01).

Correlations. The scatterplot in (a) shows the relation between unhealthy food-choice changes and body mass index (BMI). The scatterplot in (b) shows that a decrease of health- and taste-attribute significance time (ST) difference by the addition of calorie information was significantly correlated with a decrease in unhealthy food choices. The scatterplot in (c) shows that a decrease in the ST of the health attribute by the addition of calorie information (the left-pointing arrow in Fig. 5b) was significantly correlated with a decrease in unhealthy food choices. The scatterplot in (d) shows that a delay in the ST of the taste attribute by the addition of calorie information was significantly correlated with a decrease in unhealthy food choices. The scatterplot in (e) shows that an increase in the beta-weight of the health attribute by the addition of calorie information was significantly correlated with a decrease in unhealthy food choices. CAL = calorie-information condition; NON = non-calorie-information condition. Best-fitting regression lines are shown for each plot, and p(yes) indicates the proportion of “eat” decisions.
First, we checked the correlation between BMI and unhealthy food choices. The correlation coefficient was not significant, r(176) = −.16, corrected p = .152. However, consistent with our hypothesis, the change of health- and taste-attribute ST difference induced by calorie labeling (i.e., SThealth–taste calorie condition – SThealth–taste non-calorie condition) significantly correlated with unhealthy food-choice changes, r(178) = .44, corrected p < .001. In other words, when calorie information was presented and the relative temporal delays of health-attribute value integration compared with taste-attribute value were decreased, participants made fewer unhealthy food choices (i.e., successful dietary self-control). Furthermore, when we examined the health and taste attributes separately, a decrease in the ST of health attribute with the addition of calorie labeling (the leftward shift of ST shown in Fig. 5b) significantly correlated with a decrease in unhealthy food choices, r(176) = .43, corrected p < .001, while a delay in the ST of taste attribute by calorie labeling (the rightward shift of ST) significantly correlated with a decrease in unhealthy food choices, r(176) = −.22, corrected p = .014. Also as expected, an increase of the beta weight of health-attribute values by calorie labeling significantly correlated with a decrease in unhealthy food choices, r(176) = −.70, corrected p < .001. Note that these correlations were significant even after partialing out BMI scores (see Fig. S5 in the Supplemental Material for scatterplots for individual weight status groups). When we entered both ST difference and beta-weight changes simultaneously into a regression model to predict unhealthy food-choice changes, both regressors were significant, R2 = .71, F(2, 175) = 89.09, p < .001; βST difference = 0.15, p = .001; βbeta health = −0.63, p < .001.
Control analysis with color information mouse-tracking task
The mouse-tracking food-choice task with color information was designed to rule out the possibility that task-irrelevant information, such as color information, would produce effects on food-choice similar to calorie information. Thirty-nine participants who completed the control task were pooled together in this analysis. First, we examined whether food-decision reaction times were delayed by task-irrelevant color information. Participants’ food decisions were on average 56 ms (SD = 118) slower with additional color information (see Table S5 in the Supplemental Material), which was comparable with the average 66-ms delay associated with additional calorie information, t(38) = −0.38, p = .709, 95% CI = [−46.67, 32.03]. Next, we conducted a 2 (food: healthy, unhealthy) × 2 (condition: color, noncolor) repeated measures ANOVA on food decisions. Only a main effect of food was significant, F(1, 38) = 13.16, p = .001, η2 = .26, while other effects were not significant (all ps > .200), suggesting that color information did not change “eat” decisions in our control experiment.
In a similar analysis on reaction time data, only a main effect of condition was significant, F(1, 38) = 8.72, p = .005, η2 = .19, suggesting that the task-irrelevant color information slowed down the reaction time as expected. All other effects were not significant (all ps > .142). Finally, a 2 (condition: color, noncolor) × 2 (type: health, taste) repeated measures ANOVA on ST indices showed a significant main effect of type alone, F(1, 38) = 17.00, p < .001, η2 = .31, suggesting that participants began to use the taste-attribute values earlier than the health-attribute values in their dynamic food decisions. All other effects were not significant (all ps > .272). Taken together, our control experiment results demonstrated that simply providing task-irrelevant information such as color at the time of choice did not produce similar effects to that of calorie information on food decisions.
Discussion
By comparing normal-weight, overweight, and obese individuals, our study replicated and built on several important findings of previous dietary self-control studies (Ha et al., 2016; Hare et al., 2009; Hare et al., 2011; Harris et al., 2013; Sullivan et al., 2015). Hare et al. (2009) classified participants as self-controllers and non-self-controllers on the basis of their dietary decisions. As reflected in the ventromedial prefrontal cortex (vmPFC), successful self-controllers considered the taste and health attributes of food, whereas nonsuccessful self-controllers considered only taste information. Moreover, the dlPFC modulated the vmPFC activity in the successful dietary self-controllers. Sullivan et al. (2015) first proposed the idea that dietary self-control failures can be explained by the relative difference in speed with which taste attributes and health attributes are processed, and their mouse-tracking study demonstrated that dietary self-control decreases when the onset of health-attribute integration is delayed relative to the onset of taste-attribute integration. However, these studies did not investigate whether normal-weight, overweight, and obese individuals have different behavioral patterns of dietary self-control, which may provide important clinical implications for obesity prevention.
In obesity research, impulsivity and sensitivity to reward are identified as psychological risk traits, whereas conscientiousness and self-control are known to have a protective function in relation to weight gain (Gerlach, 2015). Thus, we speculated that overweight or obese individuals would show dietary decision patterns similar to non-self-controllers (Hare et al., 2009; Sullivan et al., 2015). The behavioral characteristics of non-self-controllers were partly replicated in our study. Compared with normal-weight individuals, obese individuals did not appear to effectively use health attributes to determine their food preferences, as shown in the significantly smaller beta weights of health attributes. The overweight individuals began to process health attributes about 230 ms later than taste attributes during the dietary decision process. Most important, our results show that the decision-making process of overweight individuals is characterized by the relatively slow integration of health attributes, which may contribute to insufficient dietary self-control. How insufficient dietary self-control may be modified is one important question for future obesity research.
Our societal efforts to promote optimal nutrition have focused on increasing nutritional education because making healthier choices requires considering health-related nutritional aspects of foods. For example, the NLEA (Institute of Medicine, Committee on State Food Labeling, 1992) has been adopted by the U.S. Food and Drug Administration to provide consumers the opportunity to consciously consider nutritional aspects such as calorie amount, nutritional composition, ingredients, and portion sizes. Utilizing this information involves effortful focusing of attention toward the nutritional labeling and away from the more tempting taste aspects of food (e.g., smell, visual appeal). Several experimental studies with food-choice paradigms demonstrated that attention plays a critical role in dietary decision making (Hare et al., 2011; Krajbich, Armel, & Rangel, 2010; Lim, O’Doherty, & Rangel, 2011).
When participants were instructed to direct their attentional focus to health aspects of foods at the time of decision, they were more responsive to the health attributes and less responsive to the taste attributes (Hare et al., 2011). Food-choice eye-tracking studies showed that visual attention modulates the computational process of decision values for food items and systematically biases decisions toward an attended food item over unattended food items (Krajbich et al., 2010; Lim et al., 2011). Thus, we speculated that a simple external cue such as calorie labeling would promote healthier choices by directing participants’ attention processes to health-related attributes of foods. In our study, a simple exogenous cue of calorie information produced several changes in dietary decisions. With the addition of calorie information, participants more frequently chose to eat healthy foods and less frequently chose to eat unhealthy foods, seemingly exerting additional cognitive efforts to decide to eat unhealthy food items. Considering that task-irrelevant color information in a control task did not produce the same effects as calorie information, the increase in cognitive effort and healthier choices when calorie labels are present cannot be simply attributed to attentional distraction. With the addition of calorie information, overweight individuals weighted healthy attributes of foods more heavily and integrated them more quickly into their dietary decisions. Overall, these findings indicate that calorie labeling promotes dietary self-control and helps people make healthier choices. Notably, the behavioral changes of overweight individuals induced by calorie labeling resemble the behavioral characteristics of normal-weight individuals. However, the temporal dynamics of normal-weight and obese individuals’ dietary decisions were not strongly affected by calorie information in our study. Similarly, a previous study showed that calorie labels influenced food choices for dieters but not nondieters (Girz, Polivy, Herman, & Lee, 2012). If individuals already have strongly established eating habits, whether these habits and dietary self-controls are healthy (normal-weight group) or not (obese group), additional calorie information may not produce significant changes in the temporal dynamics of dietary decision processes. Future studies will be needed to fully explain the dietary decision-mechanism differences between the overweight and obese groups.
In this study, we explored obesogenic dietary decision making and found that this unhealthy behavioral pattern is modifiable by external manipulation to a certain extent. However, these were not real-world choices, and future studies should examine natural eating behaviors. Also, it is known that overweight and obese individuals often experience social stigma and weight bias (Papadopoulos & Brennan, 2015; Puhl & Brownell, 2003). Thus, experimental or social desirability demands in the calorie-information condition might influence our results to a certain extent, which could not be fully explained with our data. Future studies that include measures of perceived social desirability are required to rule out this possibility. Further, we only tested the effect of calorie labeling on dietary self-control in this study—other external health-promoting cues that direct a decision maker’s attention to the health-related attributes at the time of choice may have similar effects, as food choices are determined by various factors, such as nutritional composition, cultural and social pressures, cognitive-affective factors, physiological states, and personality (Leng et al., 2017). An important open question for further research is how to develop effective social policies and interventions that consider other important individual and contextual variables and promote healthier eating habits to eventually prevent obesity and reduce health risks.
Footnotes
Acknowledgements
Our study replicated and extended Sullivan and colleagues’ (2015) findings. Both mouse-tracking studies were conducted with college students. However, the two studies had several differences, such as sample size (178 vs. 28 participants, respectively), geological region (Midwest vs. West Coast in the United States), gender ratio (30% vs. 75% male), materials (60 vs. 160 food images), mouse-tracking software (MouseTracker vs. Psychophysics Toolbox), participation payment (course credits vs. $25), and hunger-state manipulation (none vs. 4-hr fast). Thus, we expect these results to be reproducible or generalizable to the general college student population and have no reason to believe that our results depend on other characteristics of the participants, material, or context.
Action Editor
Ralph Adolphs served as action editor for this article.
Author Contributions
S.-L. Lim, O.-R. Ha, and A. S. Bruce contributed to the design of the experiment. M. T. Penrod collected the data. S.-L. Lim and M. T. Penrod analyzed the data. S.-L. Lim drafted the manuscript. All authors contributed to the interpretation of the results and edited the manuscript.
Declaration of Conflicting Interests
The author(s) declared that there were no conflicts of interest with respect to the authorship or the publication of this article.
Funding
This work was funded by grants from the Funding for Excellence of the University of Missouri–Kansas City and the University of Missouri Research Board.
Open Practices
All data and materials have been made publicly available via the Open Science Framework and can be accessed at https://osf.io/vqke2. The complete Open Practices Disclosure for this article can be found at http://journals.sagepub.com/doi/suppl/10.1177/0956797617737871. This article has received badges for Open Data and Open Materials. More information about the Open Practices badges can be found at  .
.
References
Supplementary Material
Please find the following supplemental material available below.
For Open Access articles published under a Creative Commons License, all supplemental material carries the same license as the article it is associated with.
For non-Open Access articles published, all supplemental material carries a non-exclusive license, and permission requests for re-use of supplemental material or any part of supplemental material shall be sent directly to the copyright owner as specified in the copyright notice associated with the article.
