



Abstract
We examined whether shifting attention to a location necessarily entails extracting the features at that location, a process referred to as attentional engagement. In three spatial-cuing experiments (N = 60), we found that an onset cue captured attention both when it shared the target’s color and when it did not. Yet the effects of the match between the response associated with the cued object’s identity and the response associated with the target (compatibility effects), which are diagnostic of attentional engagement, were observed only with relevant-color onset cues. These findings demonstrate that stimulus- and goal-driven capture have qualitatively different consequences: Before attention is reoriented to the target, it is engaged to the location of the critical distractor following goal-driven capture but not stimulus-driven capture. The reported dissociation between attentional shifts and attentional engagement suggests that attention is best described as a camera: One can align its zoom lens without pressing the shutter button.
We can process only a limited amount of information at any given time. Selective attention helps us overcome this limitation by enhancing the processing of prioritized events at the expense of other events. What factors determine such prioritization has been intensely debated (e.g., Awh, Belopolsky, & Theeuwes, 2012; Lamy, Leber, & Egeth, 2013; Theeuwes, 2010). To answer this question, researchers have attempted to characterize objects that capture attention against our will, which led them to espouse one of two opposing viewpoints.
Proponents of the salience-based view claim that salient stimuli summon attention irrespective of the observer’s goals (e.g., Theeuwes, 2010; Yantis & Jonides, 1984), whereas proponents of the contingent-capture view suggest that only stimuli matching the observer’s goals (or attentional set) attract attention (e.g., Folk, Remington, & Johnston, 1992). 1 Although the latter view has gained considerable support (e.g., Eimer & Kiss, 2008; Lamy, Leber, & Egeth, 2004), recent research suggests that purely stimulus-driven capture can occur (e.g., Folk & Remington, 2015). In particular, Gaspelin, Ruthruff, and Lien (2016) showed that abrupt onset cues automatically capture attention, but whether such capture is observed depends on how long attention dwells at the cue’s location before the nontarget occupying it is rejected. Thus, the field is moving toward a consensus according to which both stimulus-driven and goal-driven factors can determine attentional priority.
Our focus here was not on the determinants of attentional priority but on their aftermath. It is widely agreed that when attention shifts toward the location of a prioritized object, a burst of transient enhancement speeds the extraction of information at that location and gates its consolidation into working memory (e.g., Goldfarb & Treisman, 2010; Wolfe, 2007), a process often referred to as attentional engagement (e.g., Folk, Ester, & Troemel, 2009; Nieuwenstein, Chun, van der Lubbe, & Hooge, 2005; Posner & Petersen, 1990). 2 Accordingly, several studies showed that attentional engagement follows attentional capture (e.g., Carmel & Lamy, 2014; Folk & Remington, 2006; Theeuwes, Atchley, & Kramer, 2000; Zivony & Lamy, 2016b). Attentional engagement was typically assessed by measuring response-compatibility effects. The identity of the attention-grabbing distractor was associated with either the same response as the current target or the alternative response. Poorer performance on incompatible—relative to compatible—response trials attested that the distractor’s identity was processed because the response associated with it was prepared (Eriksen & Eriksen, 1974).
Note that in these studies, attention was captured by a distractor matching the observers’ attentional set. In some cases, it shared the target’s defining feature (e.g., its color). In other cases, as both the distractor and target were singletons, observers could adopt a general “singleton-detection” mode (Bacon & Egeth, 1994), and the distractor therefore matched the attentional set. Thus, attentional engagement seems to be a mandatory consequence of goal-driven attentional capture.
Here, our objective was to determine whether stimulus-driven attentional capture also necessarily entails attentional engagement. The answer to this question has important implications for attentional-capture research but also, more broadly, for current models of selective attention. A negative answer would entail that while both stimulus-driven and goal-driven factors can control attentional shifts, they elicit qualitatively different perceptual processes at the attended location. It would also entail that in contrast with most leading models of attention (e.g., Goldfarb & Treisman, 2010; Posner, Rueda, & Kanske, 2007; Sperling & Weichselgartner, 1995; Wolfe, 2007), shifting attention to a location does not entail mandatory processing of the features at that location.
We relied on a variant of Gaspelin et al.’s (2016) spatial-cuing paradigm, which is sensitive enough to reveal spatial capture by irrelevant abrupt onsets. Participants reported the identity of a target defined by its known color and presented among distractors similar to the target in color. Prior to the target display, an onset cue appeared abruptly at one of the four potential target locations. It either shared the target color (relevant-color onset cue) or did not share the target color (irrelevant-color onset cue). Attentional capture was measured as the performance benefit when the target appeared at a cued versus uncued location. We expected both the relevant-color (e.g., Carmel & Lamy, 2014; Folk & Remington, 1998) and irrelevant-color (Gaspelin et al., 2016) onset cues to capture attention. Attentional engagement was measured as the compatibility effect associated with the distractor letter at the cued location. We expected attention to be engaged at the location of the relevant-color onset cue (e.g., Carmel & Lamy, 2014). Our main interest was whether this would also occur for cues that did not share the target color.
Experiment 1
Method
Sample-size selection
On the basis of the study by Gaspelin et al. (2016, Experiment 4), we calculated the sample size required to observe a significant location benefit for an irrelevant-color onset cue. We conducted this analysis with G*Power (Faul, Erdfelder, Buchner, & Lang, 2013) using an alpha of .05, power of .80, and the effect size reported by Gaspelin et al. We found the minimum required sample size to be 5 participants.
Participants
Participants were 20 Tel Aviv University undergraduate students (17 women) who participated for course credit. The participants’ mean age was 22.45 years (SD = 2.16 years). All reported normal or corrected-to-normal visual acuity and color vision.
Apparatus
Displays were presented in a dimly lit room on a 23-in. LED screen using 1,920 × 1,280 resolution graphics mode and a 120 Hz refresh rate. Responses were collected via the computer keyboard. Viewing distance was set at 50 cm from the monitor.
Stimuli
All stimuli were drawn with 3-pixel-thick lines and appeared against a black background. The fixation display consisted of a 0.2° × 0.2° cross in the center of the screen, surrounded by four 1.7° × 1.7° empty square placeholders. These squares appeared at the corners of an imaginary 3.66° × 3.66° square centered at fixation. The cue and target displays were similar to the fixation display except for the following differences. In the cue display, four filled dots (0.25° in diameter) appeared at cardinal locations around one of the placeholders, with dot-placeholder center-to-center distance set at 1.2°. These dots were either red (RGB values = 255, 0, 0) or white (RGB values = 255, 255, 255). In the target display, a letter, “E” or “H,” subtending 1° × 1°, appeared in the center of each placeholder. One letter, the target, was red (RGB values = 255, 0, 0), one distractor was pink (RGB values = 210, 0, 80), and the other two distractors were orange (RGB values = 210, 80, 0).
Design
The experiment included 20 practice trials followed by 500 experimental trials divided into 50-trial blocks. Participants were allowed a self-paced rest between blocks. Cue-relevance conditions, red (relevant-color onset) or white (irrelevant-color onset), alternated between blocks, with the first-presented condition counterbalanced between subjects. The cue and target locations were randomly set on each trial. Therefore, the cue and target appeared at the same location on 25% of the trials (same-location trials). Since each display contained exactly two “Es” and two “Hs,” on different-location trials the letter that appeared at the cued location was the same as the target on one third of the trials (compatible-distractor condition) and different from the target on two thirds of the trials (incompatible-distractor condition).
Procedure
The sequence of events on each trial is presented in Figure 1. Participants were instructed to report as quickly and as accurately as possible whether the red letter was an “E” or an “H” by pressing “1” or “3” on the numerical keypad, respectively. Each trial began with the fixation display, which appeared for a random duration ranging from 700 ms to 1,300 ms. Then, the cue display appeared for 100 ms. It was followed by the fixation display for 50 ms and then by the target display, which remained on the screen for 100 ms. The response duration was limited to 2,000 ms. Errors were followed by a 500-ms beep. After response, a blank screen appeared for 500 ms, after which a new trial began. Participants were instructed to maintain their eyes on the fixation cross. They were informed about the presence of the cues and instructed to ignore them.
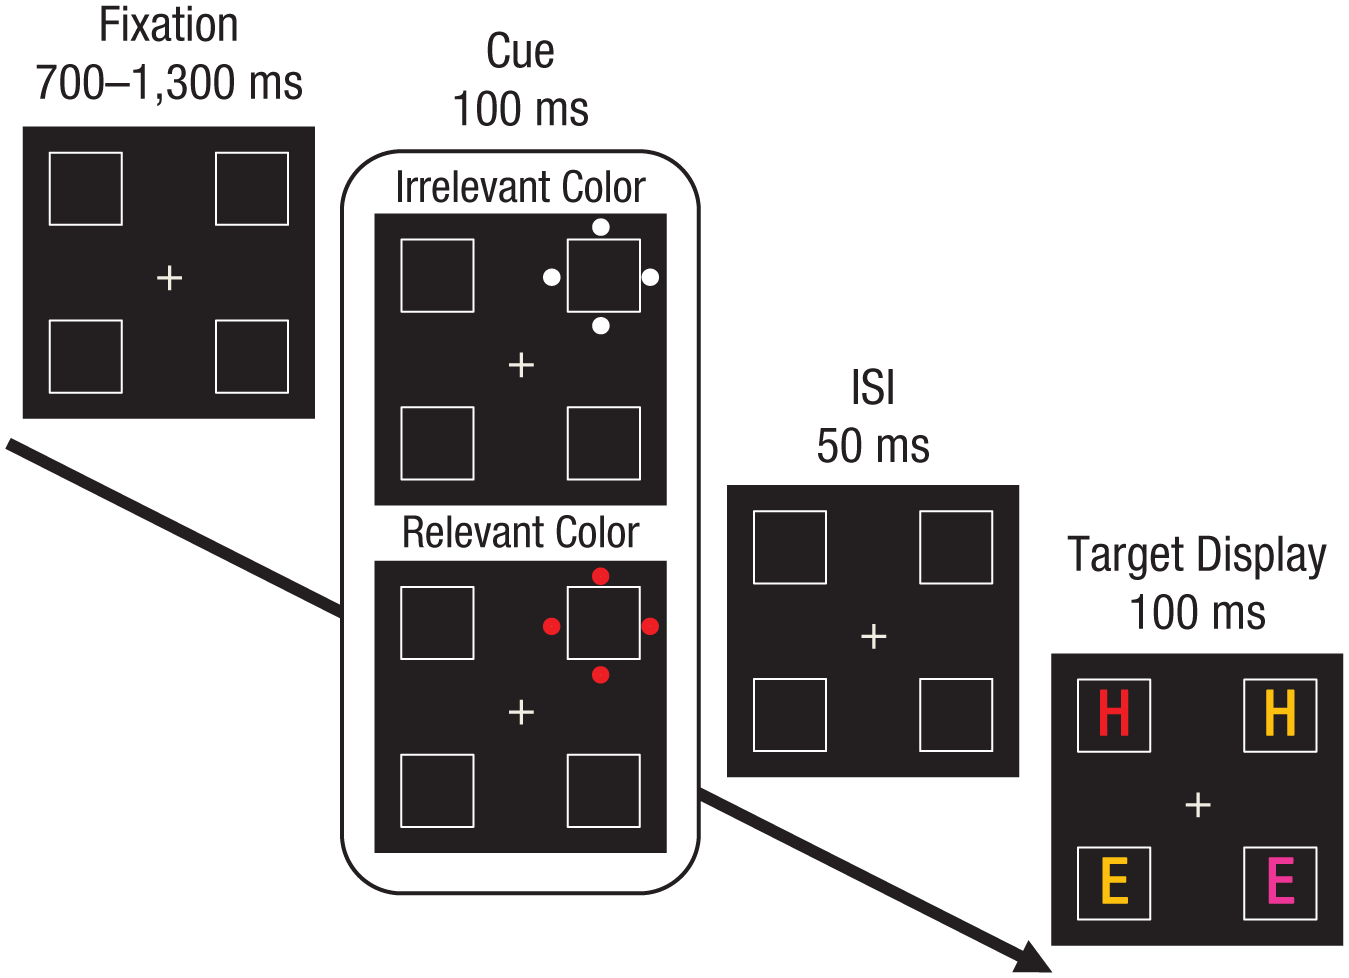
Sample sequence of events in Experiment 1. Cues consisted of four dots around one of the squares in the display and either shared the target color (relevant-color onset cue) or did not share the target color (irrelevant-color onset cue). Participants had to report whether the red letter was an “E” or an “H.” Here, the target is an “H.” In this example, the cue appears in the different location, and the cued distractor is compatible with the target.
Results
All reaction time (RT) analyses were conducted on trials on which responses were correct (96.8%). Outlier-RT trials (i.e., trials with responses faster than 200 ms or exceeding the mean of their cell by more than 2.5 standard deviations—2.14% of all correct trials) were also excluded. Analyses of accuracy rates were conducted on the arcsine-square-root transformation of mean accuracy rates (Winer, 1962/1971). Overall mean RT and accuracy rate are presented in Table 1.
Mean Reaction Time and Accuracy Rate in Experiments 1 through 3
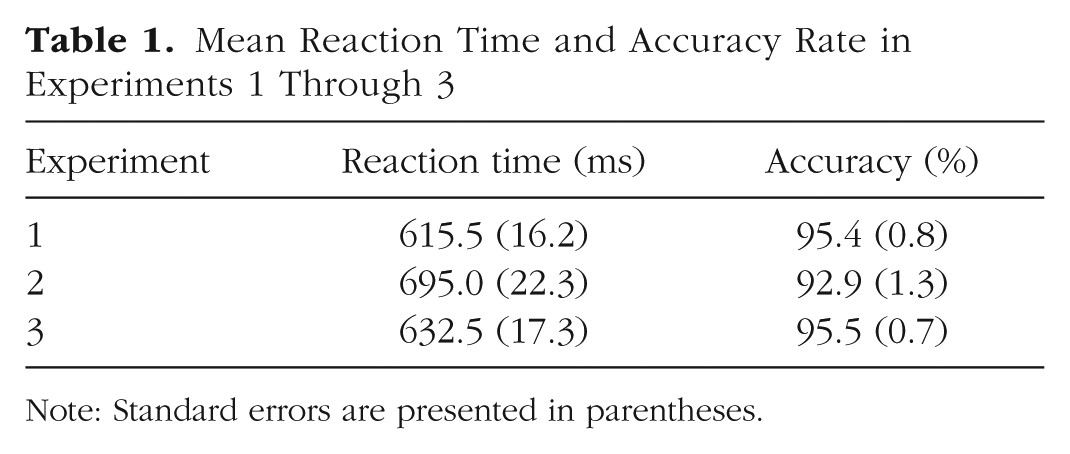
Note: Standard errors are presented in parentheses.
In this and the following experiment, Bayesian analyses of the theoretically most meaningful effects were conducted using the anovaBF function from the BayesFactor package in R (Morey & Rouder, 2015) with participant intercepts as random effects. We used the default medium prior (r = .50), yet in all experiments, we obtained similar results with wider priors (r = .707 or r = 1.0). Importantly, this analysis allowed us to assess the evidence for null effects, which is not possible with frequentist hypothesis testing. We report the Bayes factor (BF) for Hypothesis 1 (BF10) or the null hypothesis (BF01), depending on whether an effect was statistically significant or nonsignificant, respectively. Following Dienes and Mclatchie (2018), we consider a BF10 to provide evidence for the null hypothesis if it smaller than 0.33 (i.e., BF01 > 3), inconclusive evidence if it stands between 0.33 and 3, and evidence for Hypothesis 1 (i.e., the experimental hypothesis) if it exceeds 3 (with a BF10 between 3 and 10, 10 and 30, 30 and 100 and > 100 providing substantial, strong, very strong, and decisive evidence, respectively, for Hypothesis 1; Jeffreys, 1961). Evidence for two-way interactions was evaluated by comparing the model including all effects with the model including only the main effects.
Attentional capture (location effect)
We conducted a repeated measures analysis of variance (ANOVA) with cue location relative to the target (same vs. different) and cue-color relevance (relevant vs. irrelevant) as within-subjects variables. Mean cue-location effects on RT and accuracy are presented in Figure 2.

Mean location effect (different location – same location) and distractor-compatibility effect (incompatible distractor – compatible distractor) on reaction time (RT; top row) and error rate (bottom row) in Experiment 1 as a function of cue-color relevance (relevant vs. irrelevant). Distractor-compatibility effects were calculated for trials on which the cue and the target appeared at different locations. Error bars denote within-subjects standard errors (Morey, 2008). BF01 = Bayes factor for the null hypothesis.
Reaction time
For RT, the main effect of cue location was significant, F(1, 19) = 84.41, p < .0001, η p 2 = .82, and interacted with cue-color relevance, F(1, 19) = 64.657, p < .0001, η p 2 = .77, indicating that the relevant-color onset cue yielded a larger location effect than the irrelevant-color onset cue, BF10 > 100. Follow-up analyses revealed that the location effect was significant for both the relevant-color onset-cue condition (same-location trials: M = 566 ms, SE = 4 ms; different-location trials: M = 638 ms, SE = 5 ms), F(1, 19) = 100.76, p < .0001, η p 2 = .84, and the irrelevant-color onset-cue condition (same-location trials: M = 599 ms, SE = 4 ms; different-location trials: M = 613 ms, SE = 3 ms), F(1, 19) = 10.27, p = .005, η p 2 = .35. Bayesian analyses revealed that the evidence for a location effect was decisive in the relevant-color onset-cue condition, BF10 > 100, and very strong in the irrelevant-color onset-cue condition, BF10 = 91.17. There was no main effect of cue-color relevance, F < 1.
Accuracy
The results for accuracy mirrored those of the RT analysis. The main effect of cue location was significant, F(1, 19) = 7.00, p = .016, η p 2 = .27, and interacted with cue-color relevance, F(1, 19) = 8.39, p = .009, η p 2 = .30. Yet Bayesian analyses revealed that the evidence for this interaction was inconclusive, BF10 = 2.19. Follow-up analyses revealed that the location effect was significant when the cue color was relevant (same-location trials: M = 96.8%, SE = 0.7%; different-location trials: M = 94.2%, SE = 0.4%), F(1, 19) = 14.77, p = .001, η p 2 = .44, and not when it was irrelevant (same-location trials: M = 95.9%, SE = 0.5%; different-location trials: M = 95.8%, SE = 0.6%), F < 1. Evidence for a location effect in the relevant-color onset-cue condition was decisive, BF10 > 100, and evidence in favor of the null hypothesis in the irrelevant-color onset-cue condition was very strong, BF01 = 25.78. The main effect of cue-color relevance was not significant, F < 1.
Attentional engagement (compatibility effect)
We conducted a repeated measures ANOVA with distractor compatibility (compatible vs. incompatible) and cue-color relevance (relevant vs. irrelevant) as within-subjects variables. Same-location trials were excluded from this analysis. Mean distractor-compatibility effects on RT and accuracy are presented in Figure 2.
Reaction time
For RT, the main effect of cue-color relevance was significant, with slower RTs when the cue was in the relevant versus irrelevant color, F(1, 19) = 6.15, p = .023, η p 2 = .24. This effect interacted with distractor compatibility, F(1, 19) = 6.16, p = .02, η p 2 = .25, BF10 > 100. Follow-up analyses revealed that the compatibility effect was significant when the cue color was relevant (compatible trials: M = 627 ms, SE = 8 ms; incompatible trials: M = 644 ms, SE = 5 ms), F(1, 19) = 6.46, p = .02, η p 2 = .25, and not when it was irrelevant (compatible trials: M = 618 ms, SE = 6 ms; incompatible trials: M = 610 ms, SE = 3 ms), F(1, 19) = 1.78, p = .20, η p 2 = .08. Evidence for a compatibility effect when the cue was in the relevant color was decisive, BF10 > 100. Evidence for the null hypothesis when the cue was in the irrelevant color was substantial, BF01 = 3.55. The main effect of distractor compatibility was not significant, F(1, 19) = 1.50, p = .23, η p 2 = .07.
Accuracy
The results for accuracy mirrored those of the RT analysis. The main effect of cue-color relevance approached significance, F(1, 19) = 4.15, p = .056, η p 2 = .18, indicating that accuracy was lower when the cue color was relevant than when it was irrelevant. This effect interacted with distractor compatibility, F(1, 19) = 8.34, p = .009, η p 2 = .30, BF10 = 23.28. Follow-up analyses indicated that the effect of distractor compatibility approached significance when the cue color was relevant (compatible trials: M = 95.6%, SE = 0.5%; incompatible trials: M = 93.5%, SE = 0.7%), F(1, 19) = 4.09, p = .057, η p 2 = .17, and was not significant when the cue color was irrelevant (compatible trials: M = 96.0%, SE = 0.7%; incompatible trials: M = 95.4%, SE = 0.6%), F(1, 19) = 1.22, p = .28, η p 2 = .05. Bayesian analyses revealed that evidence for these effects was inconclusive, BF10 = 1.36 and BF01 = 1.55, respectively. The main effect of distractor compatibility was not significant, F < 1.
Discussion
We found that whereas both relevant- and irrelevant-color onsets 3 captured attention, attentional engagement occurred only with relevant-color onsets. Thus, attentional engagement following an involuntary shift of attention is contingent on goal-driven factors. This conclusion is open to two alternative explanations. First, because location effects were substantially larger for relevant—than for irrelevant—color onsets, the null compatibility effect in the latter condition may reflect a scaling effect. This possibility is addressed in the results section of Experiment 3. Second, attentional engagement might follow capture by irrelevant-color onsets, but its time window might be brief, in line with the fast-disengagement account (e.g., Schreij, Owens, & Theeuwes, 2008; Theeuwes 2010). This account suggests that attention is automatically shifted and engaged to the location of the most salient object but that these processes fail to produce observable location or compatibility effects when the target follows the salient distractor by enough time for attention to disengage. Because in Experiment 1 the letters driving the compatibility effect appeared only in the target display, attentional engagement following attentional capture by the irrelevant-color onset may have terminated during the 150-ms cue–target stimulus onset asynchrony.
In Experiment 2, we examined this alternative account by having the letters appear from the trial’s beginning: They were therefore present when the cue appeared. If attentional engagement is brief rather than withheld following capture by an irrelevant-color onset, compatibility effects should emerge in this experiment.
Experiment 2
Method
Sample-size selection
On the basis of the previous experiment, we calculated the sample size required to observe a significant location benefit for the irrelevant-color onset-cue condition. We conducted this analysis with G*Power (Faul et al., 2013), using an alpha of .05, power of .80, the effect size reported in Experiment 1 (η p 2 = .35), and the correlation between observations (r = .94). We found the required minimum sample size to be 4 participants.
Participants
Participants were 20 Tel Aviv University undergraduate students (17 women) who participated for course credit. The participants’ mean age was 22.75 years (SD = 3.57 years). All reported normal or corrected-to-normal visual acuity and color vision.
Apparatus, stimuli, design, and procedure
The apparatus, stimuli, design, and procedure were similar to those of Experiment 1 except that the letter inside each placeholder appeared in all displays (fixation, cue, and target) and was drawn in gray in the fixation and cue displays. The target display was the same as in Experiment 1. The sequence of events on each trial is presented in Figure 3.
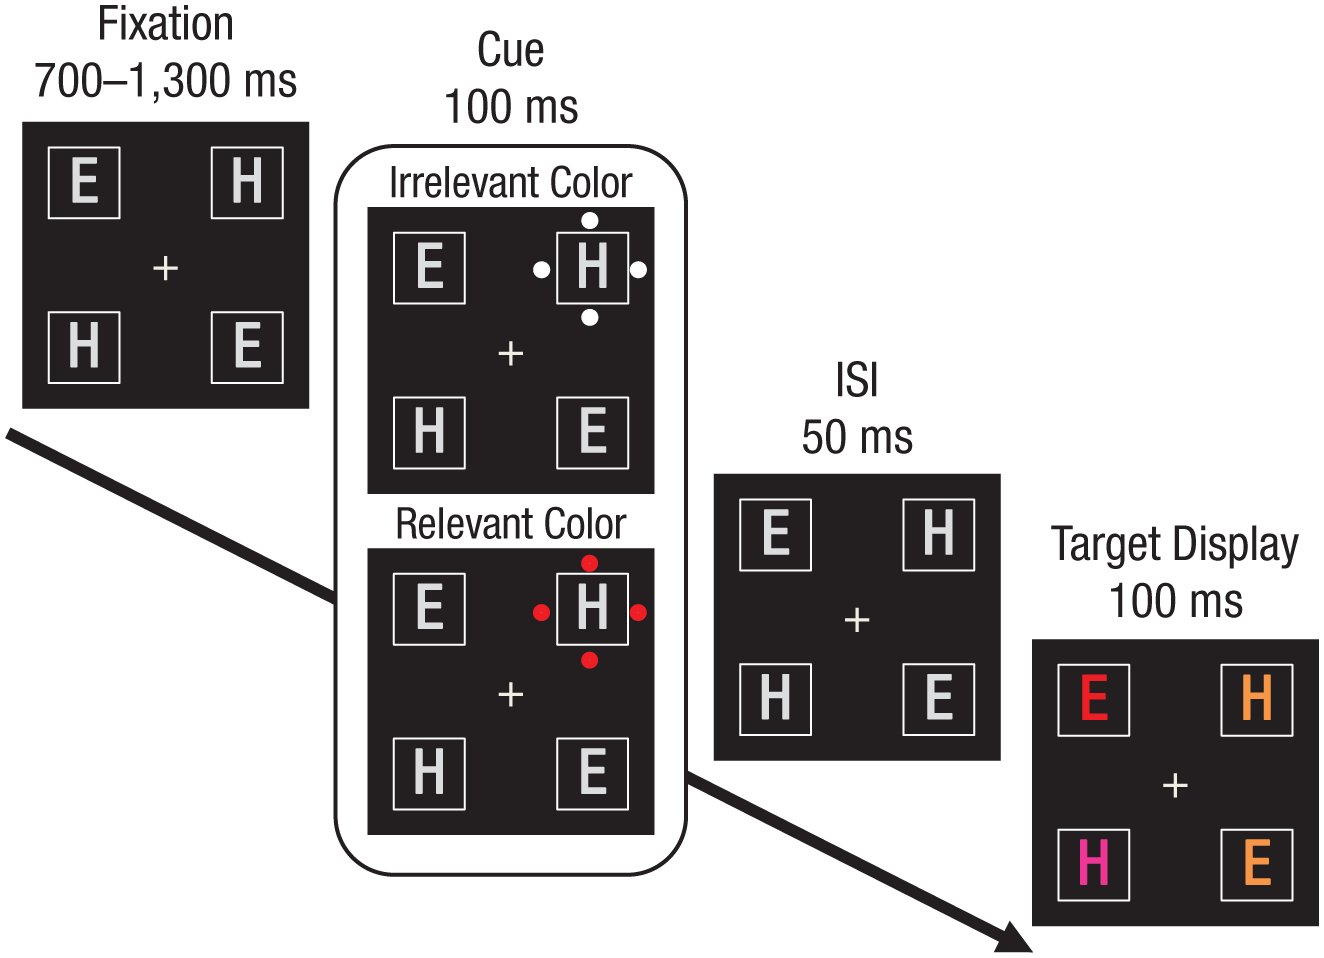
Sample sequence of events in Experiment 2. The paradigm was the same as in Experiment 1, except that the letter stimuli appeared in the fixation display and were therefore present when the cue appeared. Participants had to report whether the red letter was an “E” or an “H.” Here, the target is an “E.” In this example, the cue appears in the different location, and the cued distractor is incompatible with the target.
Results
All RT analyses were conducted on trials with correct responses (92.9%). Outlier-RT trials (2.16% of all correct trials) were excluded. Overall mean RT and accuracy rate are presented in Table 1.
Attentional capture (location effect)
We conducted a repeated measures ANOVA with cue location relative to the target (same vs. different) and cue-color relevance (relevant vs. irrelevant) as within-subjects variables. Mean cue-location effects on RT and accuracy are presented in Figure 4.

Mean location effect (different location – same location) and distractor-compatibility effect (incompatible distractor – compatible distractor) on reaction time (RT; top row) and error rate (bottom row) in Experiment 2 as a function of cue-color relevance (relevant vs. irrelevant). Distractor-compatibility effects were calculated for trials on which the cue and the target appeared at different locations. Error bars denote within-subjects standard errors (Morey, 2008). BF01 = Bayes factor for the null hypothesis.
Reaction time
For RT, the main effects of cue-color relevance and cue location were significant, F(1, 19) = 33.25, p < .0001, η p 2 = .64, and F(1, 19) = 7.82, p = .01, η p 2 = .29, respectively, as was the interaction between the two effects, F(1, 19) = 23.08, p < .001, η p 2 = .55, indicating that the relevant-color onset cue yielded a larger location effect than the irrelevant-color onset cue, BF10 > 100. Follow-up analyses revealed that the location effect was significant in both the relevant-color onset-cue condition (same-location trials: M = 644 ms, SE = 7 ms; different-location trials: M = 744 ms, SE = 8 ms), F(1, 19) = 37.66, p < .0001, η p 2 = .66, and the irrelevant-color onset-cue condition (same-location trials: M = 658 ms, SE = 6 ms; different-location trials: M = 685 ms, SE = 5 ms), F(1, 19) = 7.95, p = .011, η p 2 = .28. Bayesian analyses revealed that the evidence for a location effect was decisive in both the relevant- and the irrelevant-color onset-cue conditions, both BF10s > 100.
Accuracy
The results for accuracy mirrored the main findings of the RT analysis. The main effect for cue location was significant, F(1, 19) = 17.94, p < .001, η p 2 = .49, and interacted with cue-color relevance, F(1, 19) = 15.60, p < .001, η p 2 = .45, BF10 > 100. Follow-up analyses revealed that the location effect was significant when the cue color was relevant (same-location trials: M = 92.6%, SE = 0.5%; different-location trials: M = 90.2%, SE = 0.9%), F(1, 19) = 31.46, p < .0001, η p 2 = .62, but not when it was irrelevant (same-location trials: M = 93.3%, SE = 0.7%; different-location trials: M = 94.3%, SE = 0.4%), F < 1. The evidence for a location effect in the relevant-color onset-cue condition was decisive, BF10 > 100, and the evidence in favor of the null hypothesis was very strong in the irrelevant-color onset-cue condition, BF01 = 24.15. There was no main effect of cue-color relevance, F < 1.
Attentional engagement (compatibility effect)
We conducted a repeated measures ANOVA with distractor compatibility (compatible vs. incompatible) and cue-color relevance (relevant vs. irrelevant) as within-subjects variables. Same-location trials were excluded from this analysis. Mean distractor-compatibility effects on RT and accuracy data are presented in Figure 4.
Reaction time
For RT, the main effect of cue-color relevance was significant, F(1, 19) = 20.84, p < .001, η p 2 = .52. This effect interacted with distractor compatibility, F(1, 19) = 9.74, p = .006, η p 2 = .33, BF10 > 100. Follow-up analyses revealed that the compatibility effect was significant when the cue color was relevant (compatible trials: M = 723 ms, SE = 9 ms; incompatible trials: M = 754 ms, SE = 14 ms), F(1, 19) = 6.77, p = .017, η p 2 = .26, and not when it was irrelevant (compatible trials: M = 692 ms, SE = 6 ms; incompatible trials: M = 682 ms, SE = 9 ms), F(1, 19) = 1.43, p = .25, η p 2 = .07. The evidence for a compatibility effect was decisive when the cue was in the relevant color, BF10 > 100, and the evidence for the null hypothesis when the cue was in the irrelevant color was substantial, BF01 = 6.94. The main effect of distractor compatibility was not significant, F(1, 19) = 1.74, p = .20, η p 2 = .08.
Accuracy
The results for accuracy mirrored those of the RT analysis. The main effect of cue-color relevance was significant, F(1, 19) = 7.75, p = .012, η p 2 = .28, indicating that accuracy was lower when the cue color was relevant than when it was irrelevant. The interaction between this effect and distractor compatibility approached significance, F(1, 19) = 3.06, p = .10, η p 2 = .13, but Bayesian analyses revealed that the evidence for this interaction was inconclusive, BF10 = 0.62. Follow-up analyses indicated that the effect of distractor compatibility approached significance when the cue color was relevant (compatible trials: M = 92.5%, SE = 0.5%; incompatible trials: M = 90.1%, SE = 1.2%), F(1, 19) = 3.96, p = .06, η p 2 = .16, but was not significant when the cue color was irrelevant (compatible trials: M = 93.4%, SE = 0.8%; incompatible trials: M = 94.4%, SE = 0.5%), F < 1. The evidence for a compatibility effect when the cue color was relevant was inconclusive, BF10 = 0.78, but the evidence in favor of the null hypothesis when the cue color was irrelevant was substantial, BF01 = 20.16. The main effect of distractor compatibility was not significant, F < 1.
Discussion
We replicated the findings of Experiment 1: Although the feature driving the compatibility effect was present at cue onset, irrelevant-color onsets produced no compatibility effects. This result suggests that attentional engagement is withheld following capture by events outside the attentional set.
In both Experiments 1 and 2, the relevant color was always red, whereas the irrelevant color was always white, so cue-color relevance was confounded with cue color. To address this problem in Experiment 3, we made the target red for half of the participants and gray for the other half, and for both groups, the cue color was either gray or red. We expected attentional engagement to occur only with relevant-color onsets irrespective of cue color.
Experiment 3
Method
Participants
Participants were 20 Tel Aviv University undergraduate students (15 women) who participated for course credit. The participants’ mean age was 22.42 years (SD = 1.77 years). All reported normal or corrected-to-normal visual acuity and color vision.
Apparatus, stimuli, design, and procedure
The apparatus, stimuli, design, and procedure were similar to those of Experiment 1 except for the following changes. The background color was light gray (RGB values = 195, 195, 195). Half of the participants searched for a red target among two orange distractors and one pink distractor (as in Experiments 1 and 2), whereas the other half searched for a dark-gray target (RGB values = 125, 125, 125) among two black distractors (RGB values = 0, 0, 0) and one white distractor (RGB values = 255, 255, 255). The cue was either red or dark gray. Cue-color relevance was therefore determined by the cue color’s match with the target’s color (see Fig. 5).

Sample target displays in Experiment 3 and the corresponding cue-color conditions. Target color (left column) was either gray (upper panel) or red (lower panel) and was manipulated between subjects. Cue color (right column) was either gray (upper panel) or red (lower panel) and was manipulated within subjects. Thus, the same cue color was relevant for half of the participants and irrelevant for the other half.
Results
The data from 1 participant were excluded from further analysis because his accuracy (66%) was lower than the group’s mean (95.4%, SD = 3.2%) by more than 2.5 standard deviations. All RT analyses were conducted on trials with correct responses. Outlier-RT trials (2.01% of all correct trials) were also excluded. Overall mean RT and accuracy rate are presented in Table 1.
Attentional capture (location effect)
We conducted an ANOVA with target color (red vs. gray) as a between-subjects variable and with cue location relative to the target (same vs. different) and cue-color relevance (relevant vs. irrelevant) as within-subjects variables. Mean cue-location effects on RT and error rate are presented in Figure 6.

Mean location effect (different location – same location) and distractor-compatibility effect (incompatible distractor – compatible distractor) on reaction time (RT; top row) and error rate (bottom row) in Experiment 3 as a function of cue-color relevance (relevant vs. irrelevant), separately for red targets and gray targets. Distractor-compatibility effects were calculated for trials on which the cue and the target appeared at different locations. Error bars denote within-subjects standard errors (Morey, 2008). BF01 = Bayes factor for the null hypothesis.
Reaction time
For RT, the main effect of cue location was significant, F(1, 17) = 45.76, p < .0001, η p 2 = .73. The interaction between cue-color relevance and cue location was also significant, F(1, 17) = 18.81, p < .001, η p 2 = .54, BF10 > 100, indicating that the relevant-color onset cue yielded a larger location effect than the irrelevant-color onset cue. Follow-up analyses revealed that the location effect was significant in both the relevant-color onset-cue condition (same-location trials: M = 592 ms, SE = 14 ms; different-location trials: M = 645 ms, SE = 14 ms), F(1, 19) = 51.70, p < .0001, ηp2 = .75, and the irrelevant-color onset-cue condition (same-location trials: M = 607 ms, SE = 13 ms; different-location trials: M = 624 ms, SE = 14 ms), F(1, 19) = 7.95, p = .011, ηp2 = .28. Bayesian analyses revealed that the evidence for a location effect was decisive in both the relevant- and the irrelevant-color onset-cue conditions, both BF10 > 100. No other effect was significant, all ps > .10.
Accuracy
There was no significant effect of accuracy (see Fig. 6).
Attentional engagement (compatibility effect)
We conducted a repeated measures ANOVA with target color (red vs. gray) as a between-subjects variable and with distractor compatibility (compatible vs. incompatible) and cue-color relevance (relevant vs. irrelevant) as within-subjects variables. Same-location trials were excluded from this analysis. Mean distractor-compatibility effects on RT and error rate are presented in Figure 6.
Reaction time
For RT, the main effects of cue-color relevance and distractor compatibility were significant, F(1, 17) = 11.71, p = .003, η p 2 = .40, and F(1, 17) = 4.99, p = .039, η p 2 = .23, respectively, as was the interaction between the two factors, F(1, 17) = 9.56, p = .007, η p 2 = .36, BF10 = 7.09. Follow-up analyses revealed that the compatibility effect was significant when the cue color was relevant (compatible trials: M = 634 ms, SE = 5 ms; incompatible trials: M = 651 ms, SE = 4 ms), F(1, 17) = 16.10, p < .001, η p 2 = .48, but nonsignificant when it was irrelevant (compatible trials: M = 626 ms, SE = 6 ms; incompatible trials: M = 623 ms, SE = 4 ms), F < 1, η p 2 = .02. The evidence for a compatibility effect was very strong for relevant-color onset cues, BF10 = 59.56, and the evidence for the null hypothesis was strong for irrelevant-color onset cues, BF01 = 21.60. No other effect was significant, all ps > .19. In particular, the three-way interaction between target color, cue-color relevance, and distractor compatibility was not significant, F < 1. As is clear from Figure 6, when the cue was in the relevant color, the compatibility effect was significant both when the target was red and when it was gray, F(1, 17) = 5.55, p = .03, η p 2 = .25, and F(1, 17) = 10.86, p = .004, η p 2 = .39, respectively. In contrast, when the cue was in the irrelevant color, there was no compatibility effect when the target was gray (red cue) or when it was red (gray cue), F(1, 17) = 1.06, p = .32, η p 2 = .02, and F < 1, respectively.
Accuracy
There was no significant effect of accuracy (see Fig. 6).
Combined analysis of Experiments 1 through 3: addressing potential scaling effects
The location effect indexing attentional capture was considerably larger with relevant—than with irrelevant—color-onset cues in all experiments. This observation raises the possibility that relative to relevant-color onset cues, the compatibility effects associated with irrelevant-color onset cues may have been proportionally smaller and thus reflected a scaling effect. This account predicts that participants who show a large location effect in the irrelevant-color onset-cue condition should also show a sizable compatibility effect. We pooled the data of all experiments and conducted two analyses to test this prediction.
First, we divided the participants into four groups: a small- and large-location-benefit group (relative to the median location effect) for each cue-relevance condition. We then analyzed the compatibility effect of each group with a series of t tests (see Table 2). The results showed that although the location effect was similar in magnitude in the large-benefit group for irrelevant-color onset cues to that in the small-benefit group for relevant-color onset cues (M = 38 ms, SE = 4 ms vs. M = 39 ms, SE = 3 ms, respectively), the compatibility effect was significant in the latter group, t(29) = 3.52, p = .001, BF10 > 100, and not in the former, t(28) = 1.46, p = .15, BF01 = 4.27. Second, to address the potential problems associated with dichotomizing continuous data, we also calculated the correlation between location effects and compatibility effects. This correlation was significant with relevant-color onset cues, r(57) = .38, p = .003, and not with irrelevant-color onset cues, r(57) = .09, p = .50.
Mean Location Benefits and Distractor-Compatibility Effects Across Experiments 1 to 3 as a Function of Cue-Relevance Condition (Relevant vs. Irrelevant) and Location-Benefits Group (Small vs. Large)
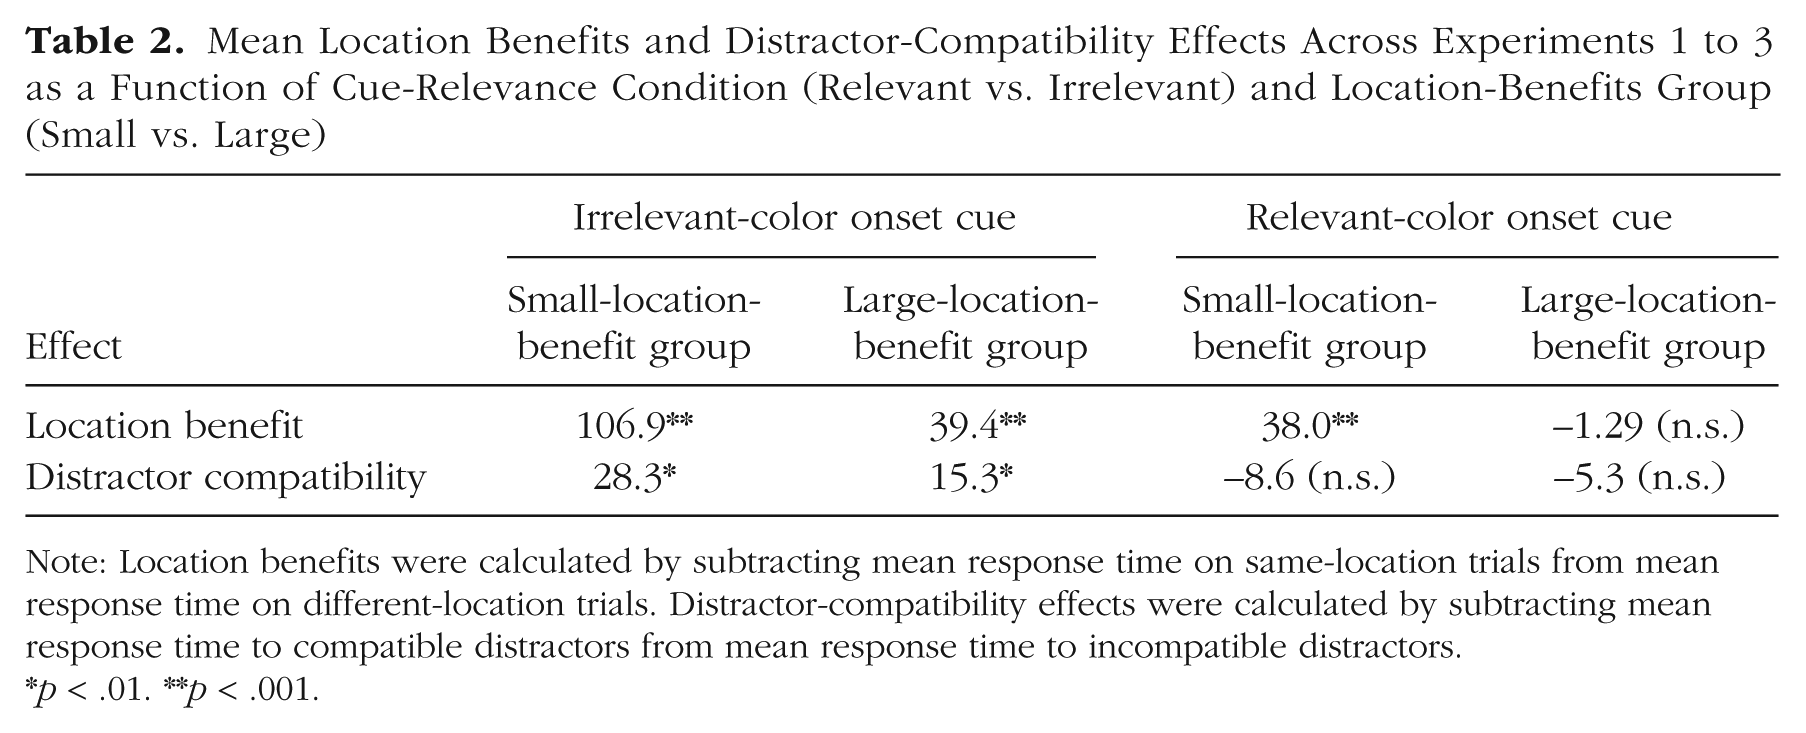
Note: Location benefits were calculated by subtracting mean response time on same-location trials from mean response time on different-location trials. Distractor-compatibility effects were calculated by subtracting mean response time to compatible distractors from mean response time to incompatible distractors.
p < .01. **p < .001.
Discussion
Again, both irrelevant- and relevant-color onset cues captured attention, yet irrespective of their color, only the latter were associated with distractor-compatibility effects. Although the location effect was smaller for irrelevant—than for relevant—color cues across experiments, two additional findings suggest that the null compatibility effect following capture by irrelevant-color onsets did not result from a scaling effect. First, a positive correlation between location and compatibility effects was observed with relevant- but not irrelevant-color onset cues, suggesting that attentional capture by an onset cue increased the probability that attention was also engaged to its location only when this object matched the attentional set. Second, even individuals with large location benefits for irrelevant-color onset cues showed no compatibility effects. We conclude that attentional engagement was not merely weaker in the irrelevant-color onset-cue condition but was altogether withheld and that attentional engagement is contingent on goal-driven capture.
General Discussion
We examined whether shifting attention to a location necessarily entails that all features at that location are processed. Using a spatial-cuing paradigm, we found that an onset cue captured attention when it did not share the target’s color but more so when it did, suggesting that both stimulus-driven and goal-driven factors determine attentional priority (e.g., Awh et al., 2012). Yet compatibility effects, which are diagnostic of attentional engagement, were observed with relevant-color and not irrelevant-color onset cues. These findings indicate that stimulus- and goal-driven capture have qualitatively different consequences and that shifts of attention are not necessarily followed by attentional engagement.
Note that the target color was held constant, so that relevant-color onset cues always matched the previous target’s color, whereas irrelevant-color onset cues never did. Thus, the dissociation on attentional engagement between the two cue types may result only (or also) from such selection-history differences (for a similar potential alternative account of contingent capture, see Folk & Remington, 2008). However, while priming from previously selected features speeds attentional engagement (e.g., Biderman, Biderman, Zivony, & Lamy, 2017; Yashar & Lamy, 2010), it cannot determine whether attentional engagement will occur: When a relevant-color object captures attention, processing properties other than its color (i.e., attentional engagement) is necessary for deciding whether this object is the target or a distractor. Therefore, attentional engagement will occur whenever the task-relevant color is detected and cannot depend solely on whether this color was recently selected.
The present findings have important implications for models of spatial attention, most of which assume that attentional engagement necessarily follows a shift of attention toward a prioritized stimulus in healthy individuals (for evidence that brain damage can selectively impair attentional shifts and engagement, see Posner & Petersen, 1990). These models typically relied on paradigms in which attention is voluntarily moved for the purpose of extracting information from prioritized locations. Here, we used an involuntary-attentional-capture paradigm, in which it is counterproductive to engage attention to the salient distractor. Under these conditions, we found that “shallow” attentional shifts, during which attention is moved but not engaged, occur following stimulus-driven capture.
What purpose might shallow shifts of attention serve, and what processes are speeded following such shifts, leading to location effects? We suggest that when an object elicits an attentional shift, basic features such as its location or color are rapidly extracted, a process that is resource free (Lamy, Alon, Carmel, & Shalev, 2015; Zivony & Lamy, 2016a) and occurs during feed-forward processing (Lamme & Roelfsema, 2000; Töllner, Rangelov, & Müller, 2012). When this information suffices for the visual system to conclude that the attended object is of no interest, the shift is not followed by attentional engagement. Because spatial attention must be aligned before attention is engaged, performance is nevertheless better when the target appears at the shift’s location—although the measured benefit can be small (e.g., Gaspelin et al., 2016). When potentially relevant information is detected at the location of the shift, extraction of higher-level information (i.e., attentional engagement) is initiated and results in recurrent processing that is more resource demanding.
Our findings are consistent with a camera metaphor of attention (Zivony & Lamy, 2016a): One can align the lens (shifting attention) without pressing the shutter button (engaging attention). Given that engagement to a nontarget incurs a higher cost than merely shifting attention toward it, stricter boundary conditions for attentional engagement (which allow shallow shifts of attention) are a functional and desired feature of our perceptual system.
Supplemental Material
ZivonyOpenPracticesDisclosure – Supplemental material for Contingent Attentional Engagement: Stimulus- and Goal-Driven Capture Have Qualitatively Different Consequences
Supplemental material, ZivonyOpenPracticesDisclosure for Contingent Attentional Engagement: Stimulus- and Goal-Driven Capture Have Qualitatively Different Consequences by Alon Zivony and Dominique Lamy in Psychological Science
Footnotes
Action Editor
Edward S. Awh served as action editor for this article.
Author Contributions
All authors developed the study concept, contributed to the study design, and wrote the manuscript. A. Zivony performed the programming, data collection, and statistical analyses. All the authors approved the final manuscript for submission.
Declaration of Conflicting Interests
The author(s) declared that there were no conflicts of interest with respect to the authorship or the publication of this article.
Funding
This research was supported by Israel Science Foundation Grant No. 1286/16 to D. Lamy.
Open Practices
All data have been made publicly available via Figshare and can be accessed at https://doi.org/10.6084/m9.figshare.6818228.v1. Materials for this study have not been made publicly available, and the design and analysis plans for the experiments were not preregistered. The complete Open Practices Disclosure for this article can be found at https://journals-sagepub-com.web.bisu.edu.cn/doi/suppl/10.1177/0956797618799302. This article has received the badge for Open Data. More information about the Open Practices badges can be found at  .
.
Notes
References
Supplementary Material
Please find the following supplemental material available below.
For Open Access articles published under a Creative Commons License, all supplemental material carries the same license as the article it is associated with.
For non-Open Access articles published, all supplemental material carries a non-exclusive license, and permission requests for re-use of supplemental material or any part of supplemental material shall be sent directly to the copyright owner as specified in the copyright notice associated with the article.
