



Abstract
Face-recognition abilities differ largely in the neurologically typical population. We examined how the use of information varies with face-recognition ability from developmental prosopagnosics to super-recognizers. Specifically, we investigated the use of facial features at different spatial scales in 112 individuals, including 5 developmental prosopagnosics and 8 super-recognizers, during an online famous-face-identification task using the bubbles method. We discovered that viewing of the eyes and mouth to identify faces at relatively high spatial frequencies is strongly correlated with face-recognition ability, evaluated from two independent measures. We also showed that the abilities of developmental prosopagnosics and super-recognizers are explained by a model that predicts face-recognition ability from the use of information built solely from participants with intermediate face-recognition abilities (n = 99). This supports the hypothesis that the use of information varies quantitatively from developmental prosopagnosics to super-recognizers as a function of face-recognition ability.
Keywords
Abilities for face recognition vary greatly among neurologically typical individuals. At one end of the spectrum, developmental prosopagnosics show great difficulty recognizing faces, despite not having sustained any brain injuries (for a review, see Susilo & Duchaine, 2013). At the other end of the spectrum, super-recognizers easily recognize faces they have not seen in years, even if these faces have physically changed in a substantial manner (Noyes, Phillips, & O’Toole, 2017; Russell, Duchaine, & Nakayama, 2009).
Understanding how perceptual mechanisms are linked with individual abilities can offer important and straightforward insights for improving face processing in both developmental prosopagnosics and people whose jobs require strong face-processing ability. So far, most research into individual differences in face perception has focused on holistic face processing: Whereas some researchers found a weak to moderate correlation between holistic face processing and face-recognition abilities (e.g., DeGutis, Cohan, & Nakayama, 2014), others have observed no correlation (e.g., Konar, Bennett, & Sekuler, 2010). More avenues need to be explored to better understand the processes underlying individual differences in face-processing skills.
The goal of the present study was to examine how the use of targets’ facial features at different spatial scales affects the face-identification ability of observers from developmental prosopagnosics to super-recognizers. An observer’s ability at a task is necessarily related to the information that the observer makes use of (e.g., Murray, Bennett, & Sekuler, 2005), but it is unclear whether individual use of information varies systematically with face-recognition ability. It is possible, for example, that ability is linked to the extent to which one uses the features utilized, on average, by typical individuals. Another possibility is that this ability is correlated with the use of a subset of this visual information (e.g., the left eye). Here, we investigated the nature of the relationship between use of face information and face-recognition ability. Our findings show that we can explain much of the variance in abilities from use of information for face recognition. By specifically recruiting developmental prosopagnosics and super-recognizers, we had the opportunity to investigate how these individuals’ perceptual mechanisms relate to those of participants of intermediate ability. We showed that a linear model trained only on nonextreme participants predicts the abilities of developmental prosopagnosics and super-recognizers from their use of information for face recognition, adding to the evidence that these groups consist of the extremes of the normal spectrum.
Method
Participants
For the purpose of our study, we wished to include participants from the entire spectrum of face-recognition abilities. We estimated that at least 106 participants were required to obtain a suitable statistical power level of .80, assuming an effect size (R2) of .25. We recruited a sample of 109 participants from the general population with normal or corrected-to-normal vision and unknown face-recognition abilities. Seven of these participants were excluded because they did not recognize 10 celebrities or more, a requirement to take part in the study. Two more were excluded because of incoherencies in their results, which are described in the Results section. One of the remaining participants from this sample qualified as a developmental prosopagnosic.
In addition, we recruited six previously identified developmental prosopagnosics (five women, average age = 35.7 years; Guo, Yang, & Duchaine, 2017; Guo, Yang, Rezlescu, Susilo, & Duchaine, 2016) and eight known super-recognizers (two men, average age = 36.5 years; Cohan, Nakayama, & Duchaine, 2016). These super-recognizers reported highly superior face recognition in daily life and obtained scores higher than 1.7 standard deviations above the mean of three tests: the long form of the Cambridge Face Memory Test (CFMT; long form, i.e., CFMT+; Russell et al., 2009), an alternate version of the CFMT with different faces (CFMT 2), and the Cambridge Face Perception Test (CFPT; Duchaine, Germine, & Nakayama, 2007). They also performed above 2.5 standard deviations from the mean of 42 participants when recognizing famous faces photographed before they were famous (Russell et al., 2009). At the opposite end of the spectrum, the previously identified developmental prosopagnosics had no history of brain damage and reported substantial difficulties with face recognition. They scored below 1.7 standard deviations from the average on the CFMT (Duchaine & Nakayama, 2006). They also performed poorly on an old/new face-recognition test and a famous-faces identification test. One of these known developmental prosopagnosics did not finish the bubbles task, and one did not recognize 10 celebrities or more, a requirement for the study, resulting in a sample of four known developmental prosopagnosics (four women, average age = 33.3 years). The final sample (N = 112; 55 men, 57 women; average age = 26.6 years, SD = 8.3) therefore spans the entire spectrum of face-recognition abilities.
Measures of face-processing abilities
Face-processing abilities were measured using the CFMT and the CFPT. The CFMT (Duchaine & Nakayama, 2006) measures memory of newly learned faces. It is widely used in the study of individual differences in face recognition (e.g., Royer, Blais, Gosselin, Duncan, & Fiset, 2015; Russell et al., 2009). Participants memorize a series of six different male faces and subsequently identify the learned face among three faces on each trial (72 in total). The test increases in difficulty across trials, with modifications of lighting and the viewpoint from which the face is seen, as well as the addition of visual noise.
The CFPT (Duchaine et al., 2007) measures the ability to distinguish small differences between faces. In 16 trials, participants are asked to sort a series of six faces according to their resemblance to a target face. Stimuli are versions of the target face morphed with other faces at six different levels (28%–88%). Faces are inverted in half of the trials. The final score corresponds to the distance between the sequences produced by participants and the correct sequences and is calculated separately for trials with upright and inverted faces. A larger score indicates a greater distance and, hence, poorer face-perception abilities. Our ability score was calculated on only trials with upright faces.
Evaluation of information utilization
Software
Tasks included to measure use of information were completed on a web platform created specifically for this purpose using PHP, HTML, and Javascript. Secure data management was carried out using MySQL databases. The stimuli were generated on a trial-by-trial basis using MATLAB (The MathWorks, Natick, MA).
Stimuli
Images of celebrity faces were used in this experiment because the ability to recognize them has several things in common with the ability to recognize a face from one’s social environment. Famous faces, such as the faces of personal acquaintances, are learned through repeated exposure during participants’ lifetimes in various visual conditions (e.g., static/dynamic, various visual angles and lighting conditions). Therefore, unlike the recognition of a face newly learned in the context of a study, the recognition of a famous face likely taps into mechanisms that are similar to those used when identifying an old friend.
We selected 100 celebrity faces (50 female faces) from the celebrity-faces database assembled by Butler, Blais, Gosselin, Bub, and Fiset (2010). These faces were selected because they were the best-recognized faces in a pilot study conducted with American and Canadian university students. All faces displayed either a happy or a neutral expression and were viewed from a frontal perspective. Faces were translated, rotated, and scaled to minimize the mean square of the difference among the positions of the eyes, the eyebrows, the nose, and the mouth of each face and the average positions of these features across faces. Importantly, these so-called Procrustes transformations preserve relative interattribute distances. A single elliptical mask was applied to all faces to hide external features of the face, such as hair or ears.
Identification of known celebrities
For the purpose of our bubbles experiment (Gosselin & Schyns, 2001), it was important that participants knew the faces presented to them. To determine the subsets of faces personally known by participants, we followed a two-step procedure. First, all 100 faces were presented sequentially, in random order, for 1 s. After each presentation, the celebrity’s name appeared along with four randomly selected names drawn from all the same-gender celebrities in the face database. The participant’s task was to select the name of the celebrity presented. Participants either (a) selected the name with the computer mouse or (b) used the up or down arrow keys to navigate through the names and select their response. Second, the same procedure was then repeated twice for the faces correctly identified in the first run. For each participant, the faces correctly identified on all three occasions—an event unlikely to have happened by chance—were chosen as the subset of faces used in the bubbles experiment. On average, participants correctly identified 54.3 (SD = 26.3) faces.
Bubbles
To reveal the visual features used by each participant to recognize celebrities, we used bubbles (Gosselin & Schyns, 2001). In a bubbles experiment, stimulus information is randomly sampled, and the multiple regression is done between the samples’ locations and the corresponding accuracy scores. The resulting classification image reveals which parts of the stimuli, on the dimensions sampled, are correlated with performance. Only the errors due to ineffective samples of information were of interest to us; it was, therefore, important to reduce the number of errors due to unknown celebrities (see Identification of Known Celebrities).
Each participant completed 1,000 trials. Such a large number of trials was necessary to enable reliable statistical inference about the correlations between face parts and accuracy at the individual level. Each trial began with a “bubblized” face stimulus, which remained on the screen for approximately 1 s. The stimulus was then immediately replaced by five response choices, consisting of the celebrity’s name along with four randomly selected names drawn from the same-gender celebrities in the personally known subset of the face database. Each participant had to select the celebrity’s name using either the mouse or the up and down arrow keys. No feedback was provided. The next trial started approximately 1 s after the participant’s response.
The sampling method is illustrated in Figure S1 in the Supplemental Material available online. First, the image was filtered using a Laplacian pyramid decomposition (Burt & Adelson, 1983) into six spatial-frequency bands (128–64, 64–32, 32–16, 16–8, 8–4, and 4–2 cycles per image, or 85–43, 43–21, 21–11, 11–5, 5–3, and 3–1 cycles per face width). Note that we do not report spatial-frequencies in cycles per degree because we did not control for the size of stimuli in degrees of visual angle. The sixth and coarsest spatial-frequency band was always entirely revealed and served as a background. A mask was applied to the remaining five spatial-frequency bands using pointwise multiplication. This mask contained Gaussian apertures (bubbles) at random locations, which partially revealed visual information. To equalize the number of cycles revealed in one bubble regardless of spatial-frequency band, we varied the size of the Gaussian windows depending on the spatial-frequency band. Therefore, higher spatial-frequency bands contained smaller bubbles, and lower spatial-frequency bands contained larger bubbles. More bubbles were applied to the high-spatial-frequency bands than to the low-spatial-frequency bands to equalize the total surface of information revealed. Ultimately, the five filtered images were summed, along with the coarsest band. The same procedure was applied on each trial to create a randomly sampled stimulus. Accuracy was maintained at 75% correct on average by adjusting the total number of bubbles on the stimulus on a trial-by-trial basis using QUEST (Watson & Pelli, 1983). On average, participants needed 150.9 (SD = 54.6) bubbles to reach a 75% accuracy rate.
Results
Face-recognition abilities
One participant who obtained an extremely poor score on the CFPT—higher than 6 standard deviations above the average—was removed from further analysis. Another participant was excluded because the number of bubbles that this person needed was 2.74 standard deviations above the mean. Both participants performed normally on the other tests, which suggests that they misunderstood the instructions for the tests on which they performed poorly or did not comply with these instructions.
For all remaining participants, the average CFMT score was 80.1% (SD = 13.9%), and the average CFPT score was 34.4 (SD = 13.7). Two participants recruited from the general population completed an alternate version of the CFMT (CFMT 2) because technical problems interrupted the original version halfway. This version follows the same procedure but includes computer-generated faces. Results of this version correlate well with those for the original CFMT (Wilmer et al., 2010).
The CFMT and CFPT scores correlated negatively (see Table S1 in the Supplemental Material). We thus ran a principal component analysis on these measures of face-recognition ability to combine them. The first component explained 80.9% of the variance and had an eigenvalue of 1.63, whereas the second component’s eigenvalue was 0.39. This first component was used in the following analyses as a general index of ability for face recognition. We observed large individual differences on this as well as other face-ability indices, as illustrated in Figure S2 in the Supplemental Material.
One participant recruited from the general population was considered a developmental prosopagnosic. This participant scored worse than the highest scoring previously identified developmental prosopagnosics on the first component of the principal component analysis, the CFMT, and the CFPT (see inverted triangles in Fig. S2). Applying the same criteria, we did not find any super-recognizer in the participants recruited from the general population. Table S2 in the Supplemental Material shows the raw scores of each developmental prosopagnosic and super-recognizer on the CFMT, the CFPT, and other measures of face-recognition ability.
Use of information
Average use of information
To pinpoint the visual information used by participants to identify faces of familiar celebrities, we computed a classification image for each participant and for each spatial-frequency band. A classification image is a weighted sum of the bubble masks that were presented to a participant during the experiment, with the accuracy of the participant transformed into z-score values as weights. This procedure amounts essentially to a multiple linear regression on the bubble masks and on accuracy. The result of this analysis indicates which facial areas in each spatial-frequency band are correlated with accurate face identification. In other words, it shows what visual information was systematically present on trials that led to correct face identification. The classification images were transformed into z scores using the uninformative area surrounding the face stimulus as a reference noise distribution.
A group-classification image was then computed for each band of spatial frequencies by summing the individual classification images and then dividing the sum by the square root of 112 (i.e., the number of participants). Finally, the pixel test (Chauvin, Worsley, Schyns, Arguin, & Gosselin, 2005) was applied to the group-classification images to determine the critical z-score threshold for statistical significance (p < .05, Bonferroni corrected for five tests, Sr = 256 × 256 pixels; σ = 8, 16, 24, 32, and 40 pixels, respectively, from finest to coarsest scale; threshold z = 4.38, 4.05, 3.84, 3.69, and 3.58, respectively, from finest to coarsest scale). The statistical threshold provided by this test corrects for multiple comparisons while taking the spatial correlation inherent to smooth classification images into account. The group-classification images are available in Figure S4E in the Supplemental Material; participants, on average, made use of the inner face features, mainly the eyes, eyebrows, and mouth.
The statistically significant regions are quite similar to the ones found in previous bubbles studies on the use of information for face identification: Across the five spatial-frequency bands, the critical pixels in our group-classification images (see Fig. S4E) overlapped with 53.3% of those in the Schyns, Bonnar, and Gosselin (2002) classification images (see Fig. S4B in the Supplemental Material), 59.0% of those in the Caldara et al. (2005) classification images (see Fig. S4C in the Supplemental Material), and 50.1% of those in the Butler et al. (2010) classification images (see Fig. S4D in the Supplemental Material). Note that, prior to this analysis, the group-classification images from the different studies were aligned using Procrustes transformations to ensure that the locations of facial features were comparable. Furthermore, the number of critical pixels was equalized across these aligned group-classification images in each band of spatial frequencies.
Use of information as a function of face-identification ability
The main goal of the present study was to investigate how interindividual variation in the use of facial information is linked with variation in face-recognition ability. To do so, we ran a second-order multiple regression to predict our general index of face-recognition ability from use of information. The classification images computed for each participant in the analysis detailed in the previous section correspond to the participants’ use of information in faces; z scores in each region of the face represent how much each participant used this region.
To diminish the collinearity between the independent variables (i.e., the value of a pixel can be predicted from the value of neighboring pixels), we did the following. First, we used unsmoothed individual classification images (smoothing introduces spatial correlation). Second, we reduced the size of these unsmoothed individual classification images to 6 × 9, 5 × 9, 4 × 9, 4 × 6, and 3 × 5 elements, respectively, for the finest to coarsest spatial-frequency bands; unsmoothed individual classification images collapsed across spatial-frequency bands were reduced to 5 × 7 elements. Third, and finally, we used a regularized multiple linear regression (ridge function in MATLAB).
Regression coefficients for each of these elements are depicted in Figure 1a. The model predicted the general-ability index better in higher than in lower spatial-frequency bands (R2 = .613, k = 43.10; R2 = .530, k = 44.00; R2 = .351, k = 68.90; R2 = .281, k = 49.25; and R2 = .141, k = 33.45, respectively, from high- to low-spatial-frequency bands). Statistically significant regression coefficients are marked with asterisks (p < .05, determined with a 5,000-iteration permutation test). The eyes or eyebrows were related to abilities at all spatial-frequency bands except the lowest, with a focus on the right eye or eyebrow from the observer’s point of view between 5 and 21 cycles per face width. Use of the mouth was also related to abilities in high to middle spatial-frequencies. When all spatial-frequency bands were collapsed (R2 = .406, k = 45.25), use of both eyes or eyebrows as well as the mouth was a statistically significant predictor of face-recognition ability. We also ran the same second-order regularized multiple linear regressions on the use of facial information and CFMT scores only, CFPT scores only, and other face-recognition ability scores (see Fig. S4). In all cases, results were remarkably similar.
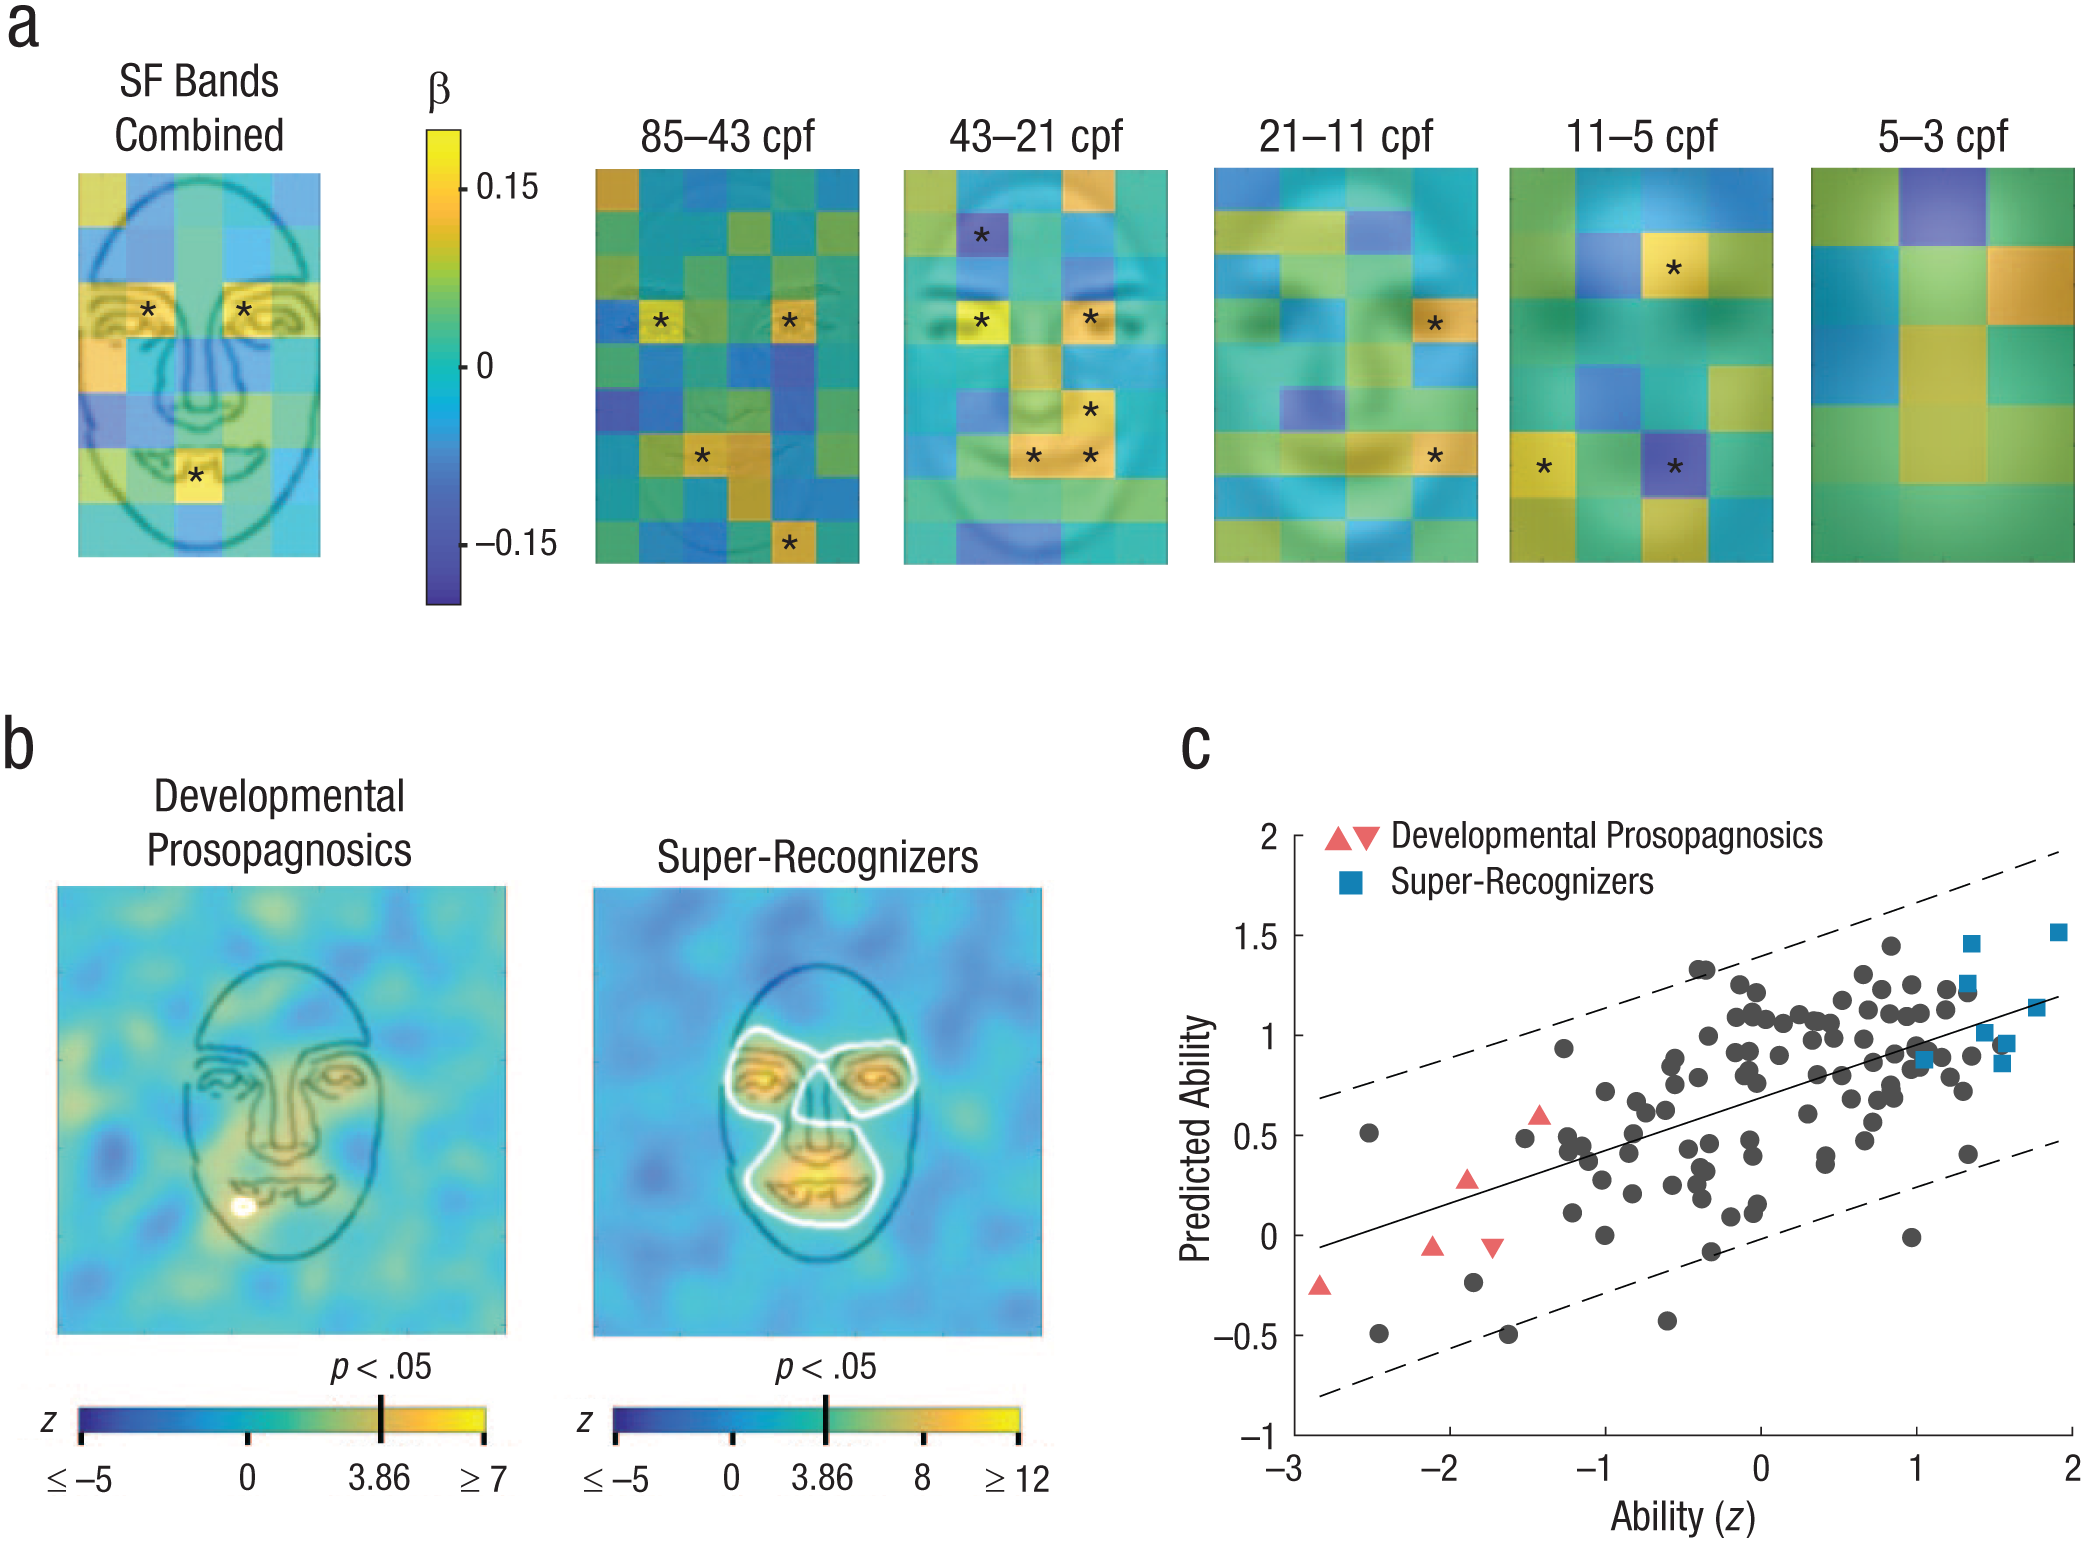
Results. Second-order regularized multiple linear regression coefficients (a) are shown for all participants (N = 112), separately for each of the five spatial-frequency bands as well as for all bands combined. The color of each element represents its regression coefficients or the level at which the particular area predicted the global index of performance. Statistically significant areas are marked with asterisks (p < .05, determined with a 5,000-iteration permutation test). Classification images of the developmental-prosopagnosics group (n = 5) and the super-recognizers group (n = 8) are shown in (b). Areas in which the use of spatial information was above the statistical threshold (p < .05; threshold z = 2.9; σ = 10; Sr = 15,204) are marked in white. The scatterplot (c; with best-fitting regression line) shows the relation between the actual and predicted global index of face-recognition abilities for all participants, including developmental prosopagnosics and super-recognizers. Predictions were made using the model built solely with data from participants with intermediate face-recognition abilities. Dashed lines delimit the 95% confidence interval. The inverted triangle represents the developmental prosopagnosic recruited from the general population. SF = spatial frequency; cpf = cycles per face width.
Use of information in developmental prosopagnosics and super-recognizers
There are two main hypotheses about how face processing differs in developmental prosopagnosics, super-recognizers, and individuals with intermediate face-recognition skills (for a recent review, see Barton & Corrow, 2016). According to the first hypothesis, these groups would process faces in qualitatively different ways. In other words, from developmental prosopagnosics to super-recognizers, observers’ use of facial information would not vary predictably (see, e.g., Bobak, Parris, Gregory, Bennetts, & Bate, 2017, in which atypical eye movements were observed only in extremely impaired developmental prosopagnosics). The alternate hypothesis states that developmental prosopagnosics, super-recognizers, and individuals with intermediate face-recognition skills process faces in a quantitatively different way (e.g., Russell et al., 2009). This translates to predictable variations in the use of facial information from developmental prosopagnosics to super-recognizers. Because we have evaluated the use of information during face identification across the entire spectrum of face-recognition abilities for the first time, we have the opportunity to test these two propositions directly.
To increase signal-to-noise ratio of the individual classification images, we reduced their dimensionality by pooling the data across spatial-frequency bands. Specifically, for each participant, we performed a multiple linear regression on the participant’s accuracy and the locations of the bubbles, irrespective of the spatial-frequency band, and smoothed the resulting image with a single Gaussian filter with a standard deviation of 10 pixels. Individual classification images of the five developmental prosopagnosics and the eight super-recognizers are available in Figure S5 in the Supplemental Material. Grouped developmental prosopagnosics’ and super-recognizers’ classification images (see Fig. 1b) were also computed by summing, respectively, the individual classification images of developmental prosopagnosics and the individual classification images of super-recognizers. Statistical significance was determined using the pixel test (Chauvin et al., 2005). Areas in which the spatial information used was above the statistical threshold (p < .05; threshold z = 2.9; σ = 10; Sr = 15,204) are marked in white in Figure 1b.
Seven of the eight individual super-recognizers used the left eye or eyebrow from the observer’s point of view, five out of eight used the right eye or eyebrow, and five out of eight used the mouth (see Fig. S5B). In the classification image of the super-recognizer group (see Fig. 1b), the highest z scores were observed in the eyes, eyebrows, and mouth. In contrast, none of the five individual developmental prosopagnosics used the left eye or eyebrow (see Fig. S5A). Interestingly, a single developmental prosopagnosic used the right eye and this individual happened to be the most competent at face recognition of our five developmental prosopagnosics. The classification image of the developmental-prosopagnosic group (see Fig. 1b) showed a single area attaining statistical significance—the leftmost part of the mouth. The use of this area was only weakly positively correlated with face-recognition ability, shown in Figure 1a.
If the use of information by developmental prosopagnosics and super-recognizers is predictable from that of individuals with intermediate abilities, we would expect (a) that super-recognizers’ use of facial information is similar to that of nonextreme but skilled face identifiers, whereas developmental prosopagnosics’ use of the information is similar to that of nonextreme but unskilled face identifiers, and more generally, (b) that a model predicting the global index of face-recognition ability from the use of information in nonextreme participants would generalize to developmental prosopagnosics and super-recognizers. Thus, we ran a regularized multiple linear regression similar to the one presented in Figure 1a but excluding developmental prosopagnosics and super-recognizers (R2 = .419, k = 44.35). Regression coefficients for each of 35 elements are depicted in Figure S6 in the Supplemental Material. In this model, use of the mouth as well as the right eye or eyebrow was correlated significantly with face-recognition ability (p < .05, determined using a 5,000-iteration permutation test), and use of the left eye or eyebrow was linked marginally with face-recognition ability (p = .052).
Informally comparing these results with information used by super-recognizers and developmental prosopagnosics suggests, indeed, that super-recognizers’ use of facial information is similar to that of nonextreme but skilled face identifiers and that developmental prosopagnosics’ use of the information is similar to that of nonextreme but unskilled face identifiers. In Figure 1c, we plot the global index of face-recognition ability measured experimentally in all participants against the global index of face-recognition ability predicted from the model derived only on the nonextreme participants. First, we noticed that none of the 13 extreme participants fell outside the 95% confidence interval. Second, and more crucially, the model based on participants of intermediate abilities explains 65% of the variance in developmental prosopagnosics’ and super-recognizers’ face-recognition ability (n = 13). Together, our results favor the quantitative rather than the qualitative hypothesis about how face processing differs in developmental prosopagnosics, super-recognizers, and individuals with intermediate face-recognition skills.
Discussion
We revealed the features used to identify faces in 112 individuals, including 5 developmental prosopagnosics and 8 super-recognizers, using an online famous-face-identification task and the bubbles method. We replicated the findings that the eyes and eyebrows, followed by the mouth, are on average the most important regions for face identification (e.g., Abudarham & Yovel, 2016; Butler et al., 2010; Caldara et al., 2005; Gosselin & Schyns, 2001; Schyns et al., 2002). More importantly, however, we discovered that at least 41% of the variance in face-recognition ability, evaluated from the CFMT and CFPT scores as well as other measures, was explained by a linear integration of facial-information usage. We found that the use of the eyes or eyebrows as well as the mouth was strongly correlated with face-recognition ability.
The super-recognizer participants made use, on average, of all of these facial features, and the developmental-prosopagnosic participants made use of none of these facial features, except the leftmost part of the mouth. This finding is in agreement with studies showing that developmental prosopagnosics are selectively impaired with processing of the eyes (DeGutis, Cohan, Mercado, Wilmer, & Nakayama, 2012; Fisher, Towler, & Eimer, 2016). It also suggests that use of information in developmental prosopagnosics and super-recognizers is in continuation with use of information in individuals with intermediate face-recognition skills. Indeed, we found that 65% of the variance in the face-recognition ability of developmental prosopagnosics and super-recognizers is explained by their use of information using a simple linear model trained solely on participants with intermediate face-recognition abilities (n = 99). Thus, most of the variance in face-recognition ability observed in developmental prosopagnosics and super-recognizers can be predicted from nonextreme participants. It is possible that a portion of the remaining unexplained variance, excluding measurement error, is not accounted for by the model generated from the nonextreme participants, but overall, we believe our results indicate that developmental prosopagnosics’ and super-recognizers’ face-processing mechanisms are quantitatively, not qualitatively, distinct from the normal population (e.g., Barton & Corrow, 2016; Russell et al., 2009).
These findings fall short of establishing a causal link between perceptual mechanisms and differences in face-recognition ability. To go beyond correlations, DeGutis and colleagues (2014) trained 24 developmental prosopagnosics for 3 weeks using a procedure targeting holistic face processing; their subjects exhibited a moderate improvement on one measure of front-view face discrimination. This result seems promising given the mixed evidence linking holistic face processing to face-identification abilities. More recently, Towler, White, and Kemp (2017) have successfully improved matching accuracy of participants from the general population by training them to rate the similarity of facial features in two images. To address the question of causation while simultaneously developing what could lead to an efficient intervention for improving face recognition, we could condition participants to adopt either developmental-prosopagnosic-like or super-recognizer-like face-processing strategies and examine the effect on their face-recognition performance. Possible applications of this conditioning approach include interventions for individuals specifically impaired in face recognition such as developmental prosopagnosics, acquired prosopagnosics, and individuals with autism spectrum disorder, as well as training for professionals relying on strong face processing, such as police officers, security agents, and customs officials.
Supplemental Material
TardifSupplementalMaterial – Supplemental material for Use of Face Information Varies Systematically From Developmental Prosopagnosics to Super-Recognizers
Supplemental material, TardifSupplementalMaterial for Use of Face Information Varies Systematically From Developmental Prosopagnosics to Super-Recognizers by Jessica Tardif, Xavier Morin Duchesne, Sarah Cohan, Jessica Royer, Caroline Blais, Daniel Fiset, Brad Duchaine and Frédéric Gosselin in Psychological Science
Footnotes
Action Editor
Alice J. O’Toole served as action editor for this article.
Author Contributions
F. Gosselin and B. Duchaine developed the study concept. The web platform was elaborated by F. Gosselin and X. Morin Duchesne. S. Cohan recruited and tested participants, classifying them as developmental prosopagnosics or super-recognizers. All remaining data were collected by J. Tardif. J. Tardif analyzed and interpreted that data under the supervision of F. Gosselin. J. Tardif drafted the manuscript, and critical revisions were provided by F. Gosselin. Further revisions were provided by J. Royer, C. Blais, and D. Fiset. All the authors approved the final manuscript for submission.
Declaration of Conflicting Interests
The author(s) declared that there were no conflicts of interest with respect to the authorship or the publication of this article.
Funding
This research was supported by a team research project grant from the Fonds de Recherche Nature et Technologies du Québec (FRQNT) to F. Gosselin and C. Blais and by graduate scholarships from the FRQNT and from the Natural Sciences and Engineering Research Council of Canada to J. Tardif.

Open Practices
Data and materials for this study have not been made publicly available. The design and analysis plans were not preregistered.
References
Supplementary Material
Please find the following supplemental material available below.
For Open Access articles published under a Creative Commons License, all supplemental material carries the same license as the article it is associated with.
For non-Open Access articles published, all supplemental material carries a non-exclusive license, and permission requests for re-use of supplemental material or any part of supplemental material shall be sent directly to the copyright owner as specified in the copyright notice associated with the article.
