



Abstract
Perceptual processes underlying individual differences in face-recognition ability remain poorly understood. We compared visual sampling of 37 adult super-recognizers—individuals with superior face-recognition ability—with that of 68 typical adult viewers by measuring gaze position as they learned and recognized unfamiliar faces. In both phases, participants viewed faces through “spotlight” apertures that varied in size, with face information restricted in real time around their point of fixation. We found higher accuracy in super-recognizers at all aperture sizes—showing that their superiority does not rely on global sampling of face information but is also evident when they are forced to adopt piecemeal sampling. Additionally, super-recognizers made more fixations, focused less on eye region, and distributed their gaze more than typical viewers. These differences were most apparent when learning faces and were consistent with trends we observed across the broader ability spectrum, suggesting that they are reflective of factors that vary dimensionally in the broader population.
Keywords
Faces provide fundamental social information, but people’s ability to recognize faces varies to a surprising extent. Ability ranges from people with congenital prosopagnosia, who are unable to recognize friends and family and perform at chance on standardized tests (Duchaine & Nakayama, 2006), to “super-recognizers,” who are capable of remarkable feats of recognition in their daily life and achieve the highest scores attainable on standardized tests (for reviews, see Noyes et al., 2017; Ramon, 2021; also see Russell et al., 2009).
This wide-ranging spectrum of ability is believed to be the result of a stable and specific cognitive trait. Support for this comes from the stability of performance across repeated testing (Bobak et al., 2016; Dunn et al., 2020; White et al., 2022), genetic heritability (Wilmer et al., 2010), resistance to training effects (Towler et al., 2019; Towler, Kemp, & White, 2021), and independence from general object recognition (Richler et al., 2017; Shakeshaft & Plomin, 2015; cf. Geskin & Behrmann, 2018). Representing the top of the distribution, super-recognizers are individuals who have obtained visual expertise for a task that we all perform many times each day. Studying the basis of their skill can therefore help us to understand not only face recognition but perhaps also visual intelligence more broadly.
A useful starting point in understanding super-recognizers’ superiority is examining the information that they rely on for face recognition. Initial work aiming to understand individual differences in face recognition was inspired by the finding that people, in general, tend to process faces as gestalts, rather than the more piecemeal part-based processing that characterizes other types of object processing (Farah et al., 1998; Richler & Gauthier, 2014). This led to the hypothesis that interindividual differences in face-processing ability could be explained by differences in the extent to which they use “holistic” processing (DeGutis et al., 2013; R. Wang et al., 2012). Although this hypothesis received some initial support from studies of the full ability spectrum, the association between holistic-processing and face-recognition ability was found to be weak (DeGutis et al., 2013; R. Wang et al., 2012), and other studies showed no association (Konar et al., 2010; Rezlescu et al., 2017; Richler et al., 2015; Sunday et al., 2017).
Another approach to studying individual differences has been to compare people at extremes of the face-recognition ability spectrum with typical viewers. Here, there is also mixed evidence for an association between holistic-processing and face-recognition ability. Some studies have reported a reduced face composite effect for people with congenital prosopagnosia (Avidan et al., 2011; Palermo et al., 2011) as well as smaller inversion effects for faces (Malaspina et al., 2017). But other studies using face composites show no impairment of holistic processing in congenital prosopagnosia (Biotti et al., 2017; Schmalzl et al., 2008; Susilo et al., 2010). At the opposite extreme, larger face inversion effects have been reported for super-recognizers compared with typical viewers (Bobak et al., 2016; Russell et al., 2009; cf. Towler, Dunn et al., 2021). When viewing scenes containing faces, super-recognizers spent longer fixating on nose regions (Bobak et al., 2017), which may also indicate a global processing strategy (but see Miellet et al., 2013).
On the other hand, there is emerging evidence pointing to differences in part-based processing being important in explaining individual differences in face-recognition ability. Royer and colleagues (2015) found that better face recognizers required less visual information to maintain accurate recognition, suggestive of enhanced local processing at higher levels of face-recognition ability. Although this result has not been shown in super-recognizers, there is preliminary evidence that super-recognizers exploit the same information more effectively (Tardif et al., 2019) and consistently (Nador et al., 2021) than typical viewers.
Statement of Relevance
Super-recognizers have exceptional face-recognition abilities that far exceed those of average performers. They often report amazing feats of recognition, for example, identifying a classmate from many years ago through a glance in their rearview mirror. How do they achieve these feats? To understand the perceptual processes involved, we measured the visual information they sampled when learning and recognizing faces. Using eye-tracking technology, we created “spotlight” apertures that revealed part of the face each time they moved their eyes. Super-recognizers performed better than average people at all aperture sizes, even when just 12% of a face was visible at once through the aperture. This shows that individual differences in face-recognition ability cannot be explained by holistic information sampling, which previous theories have proposed are the key driver of face-processing ability. Finally, differences in how super-recognizers sample information were especially apparent when they initially learned faces, which suggests that super-recognizers might better be thought of as “super-learners.”
Exactly how an individual’s face-recognition ability is supported by initial perceptual processing is unclear. Here, we addressed this question by manipulating the amount of global versus local information available to viewers when they perform a face-recognition task. We restricted face information using gaze-contingent “spotlights”—viewing apertures of varying size that are centered on the participants’ fixated location (Caldara et al., 2010; Miellet et al., 2013; Papinutto et al., 2017; for an example, see Fig. 1; a demonstration video is available at https://osf.io/xtjzh). This enabled us to examine active exploration of face information during face learning and recognition, while also having control over the information available to viewers on a given fixation.
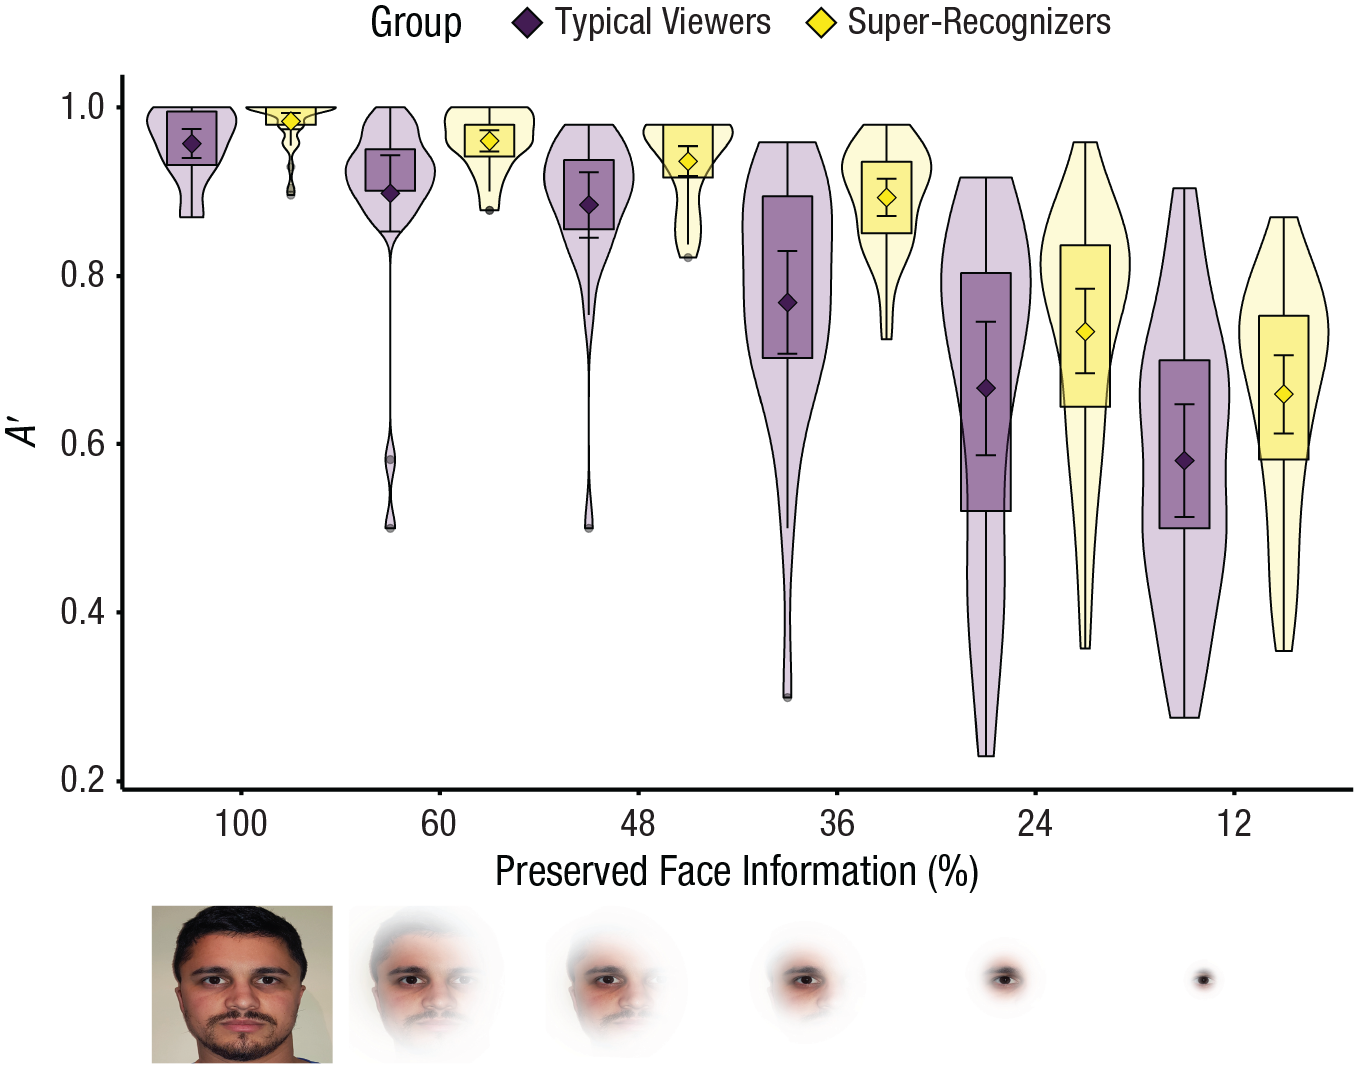
Super-recognizers are more accurate than typical viewers even with only 12% of face information available on each fixation. Diamonds show group means, and error bars show 95% confidence intervals. Violins and box plots show the distributions and interquartile ranges, respectively. Images below the x-axis show the face information that is preserved at each aperture size when the left eye is fixated.
In Experiment 1, we measured the visual information sampling of 34 super-recognizers and compared it with that of typical viewers. Super-recognizers were more accurate than typical viewers across all spotlight aperture sizes, contrary to the notion that differences in holistic processing drive differences in accuracy. We also found reliable differences in the amount of information that they sample from faces, the extent to which they distribute their sampling across the face, and their viewing patterns. These differences were most apparent when learning faces. In Experiment 2, we examined whether these differences in visual information sampling are reflective of trends across the full spectrum of face-recognition ability to address whether perceptual processing in super-recognizers represents an extreme version of normal face processing or whether they rely on qualitatively different processing strategies (Noyes et al., 2017; Tardif et al., 2019).
Experiment 1
Method
Sample-size estimation
To estimate sample size, we performed a statistical power analysis using G*Power (Version 3.1; Faul et al., 2007). On the basis of the only previous comparison of eye-movement strategies in super-recognizers and typical viewers (Bobak et al., 2017), we expected large to very large effect sizes (η p 2 > .13). Taking the smallest effect size estimate, which corresponds to a Cohen’s f of 0.39, we needed a projected total sample size of 58 participants to detect an effect of this size (α = .05, power = .8). Consequently, we aimed to recruit at least 29 super-recognizers and typical viewers after accounting for exclusions.
Participants
Forty super-recognizers were recruited to participate in the study by an email advertisement sent to a database of volunteers who scored highly on three standardized face-identification tests completed before the study began: the Cambridge Face Memory Test–Long Form (CFMT+; Russell et al., 2009), the Glasgow Face Matching Test–Short Form (GFMT; Burton et al., 2010), and the UNSW Face Test (Dunn et al., 2020; for a description of the screening tests, see the Supplemental Material available online; for super-recognizers’ individual scores on each screening test, see Table S1 in the Supplemental Material). All super-recognizers satisfied the criterion for super-recognition by having a mean z score above 1.7 standard deviations across these tests and received cash compensation for their participation. This is a strict criterion relative to selection thresholds used in this field (see Ramon, 2021), and the requirement to show repeated high performance over subsequent tests limits any influence of chance or transient factors on performance. Twenty-eight typical viewers volunteered to participate responding to an advertisement on a research-participation database hosted by the School of Psychology at the University of New South Wales and received cash compensation for their participation. All participants had normal or corrected-to-normal vision.
Six super-recognizers and two typical viewers were excluded from analysis because of technical difficulties with the eye tracker (n = 2), incomplete data (n = 3), or excessive data loss (> 20% of trials were removed; see data-cleaning parameters below; n = 3). The final group of 34 super-recognizers (14 female, 20 male) were between the ages of 26 and 51 years old (M = 37.8 years, SD = 7.4). The final group of 26 typical viewers (15 female, 10 male, one nonbinary) were between the ages of 18 and 61 years old (M = 27 years, SD = 8.6).
This research was approved by the Human Research Ethics Advisory Panel at the University of New South Wales. All participants gave their informed consent either digitally or in writing.
Apparatus
Participants’ eye movements were recorded with Tobii Pro Spectrum (with chin rest). This tracker has an average gaze-position error of about 0.25° and a spatial resolution of 0.01°. Only the dominant eye was tracked. The experiment was coded in MATLAB (The MathWorks, Natick, MA) using the Psychophysics Toolbox (Brainard, 1997). Calibrations for eye fixations were conducted at the beginning of the experiment using a nine-point fixation procedure using MATLAB software and repeated until the optimal calibration criterion was reached.
Stimuli
Stimuli were obtained from the Lifespan Database of Adult Facial Images (Minear & Park, 2004). We used a total of 144 identities with different genders (female = 81, male = 63), ethnicities (White = 88, Black = 33, Indian = 23), facial expressions (neutral or smiling), and ages (M = 40.5 years, SD = 22.8, range = 18–88). Faces were all shown in full view from the neck up with hairline visible and in front of a neutral backdrop. We aligned the faces by the eye and mouth positions to ensure that they appeared at a standard size on the screen. To operationalize the aperture viewing, we created spotlight viewing apertures using a method described by Papinutto and colleagues (2017). We used aperture sizes of 5°, 10°, 15°, 20°, and 25° of visual angle. To determine the preserved information in the Gaussian aperture, Papinutto and colleagues carried out a data-driven reconstruction of the Facespan on the basis of the convolution of a retinal filter (Targino Da Costa & Do, 2014), computation of the Structural SIMilarity index (Z. Wang et al., 2004), and use of the pixel test (Chauvin et al., 2005; based on random-field theory). Their analysis showed that a 17° Gaussian aperture corresponds to 7° or 45% of the total face information being preserved. Thus, assuming linearity, in the present study, 5°, 10°, 15°, 20°, and 25° apertures correspond to 2°, 4°, 6°, 8°, and 10°, respectively, of preserved information. To provide a clearer description of the amount of information available at each aperture size, we report the angular representations of the faces (5°, 10°, 15°, 20°, and 25°) in terms of their respective preserved face information (12%, 24%, 36%, 48%, and 60%), with the natural view providing 100% of the face.
Procedure
Participants completed a recognition-memory procedure in which they studied faces displayed on a screen and were later tested on their memory for the faces. There were six blocks, each involving a presentation of a series of faces to be learned and subsequently recognized. In each of these blocks, participants viewed 12 faces in one of six viewing conditions (natural viewing and each aperture size condition; a demonstration video is available at https://osf.io/xtjzh). Faces were presented in the same viewing conditions in the learning and test phases, but allocation of faces to viewing conditions and the order of viewing conditions were randomized between participants.
Prior to each presentation, participants were instructed to fixate a cross at the center of the screen. Faces were then displayed with either neutral or happy facial expressions, for 5 s each, at random locations on the computer screen (to avoid anticipatory oculomotor strategies). Each learning phase was immediately followed by a recognition phase in which 24 faces were presented using the same 12 images from learning and 12 images of new faces. At test, participants were instructed to press a key to indicate as quickly and accurately as possible whether each face had been presented in the face-learning phase.
Typical viewers completed the CFMT+ after the experimental task, and super-recognizers had completed the CFMT+, GFMT, and UNSW Face Test as part of the prescreening (see the Participants section).
Eye-movement classification and cleaning parameters
Fixations were coded on the basis of a threshold of 30° of visual angle per second; adjacent samples that were below the velocity threshold were coded as a single fixation, and adjacent samples above this threshold were coded as saccades. Fixation data were then cleaned using the following parameters: (a) Fixations that were within 0.5° of visual angle and 75 ms were merged, (b) fixations shorter than 50 ms were removed, and (c) fixations longer than 3 standard deviations from the mean fixation duration of each participant were removed. For trial-level analyses, trials were removed if there were no valid fixations or if response latency was greater than 3 standard deviations from the mean latency for each participant. Participants were excluded from analysis if more than 20% of the total trials were excluded after cleaning.
Statistical analyses
Our primary measure of interest was face-recognition accuracy across gaze-aperture conditions, which provided a test of whether super-recognizers rely on global sampling of information for face learning and recognition. We also carried out a more exploratory analysis of fixation patterns. Given the preliminary nature of this work, we opted for data-driven analysis methods that did not rely on experimenter intervention, for example, by predefining regions of interest (Bobak et al., 2017). All statistical analyses were conducted with linear mixed models using the GAMLj module package in jamovi (The jamovi project, 2021). Participants’ intercept was included as a random effect in all models, and all continuous factors were analyzed with z-score scaling. To control for variability in the difficulty of remembering specific faces, we also included stimuli as a random effect in trial-level analyses. The specific factors included in each analysis are specified below. For brevity, full analyses for each model are reported in the Supplemental Material.
Face-recognition accuracy
We measured participants’ performance in the face-recognition task using A′ (Stanislaw & Todorov, 1999) with preserved face information (continuous: 100%, 60%, 48%, 36%, 24%, 12%) and group (super-recognizers, typical viewers) as factors. Analysis of response latency was also conducted using the same factors and is reported in the Supplemental Material.
Fixation count and gaze dispersal
Analyses of the number of fixations were conducted at the trial level with phase (face learning, face recognition), aperture size (continuous: 100%, 60%, 48%, 36%, 24%, 12%), group (super-recognizers, typical viewers), and all interactions as fixed factors. To control for the impact of trial duration on the number of fixations, we also included trial duration as a fixed factor in the model (without any interaction terms) using study time (5 s) as the duration for study-phase trials.
The dispersal of gaze across the face was measured using the Gini coefficient. The Gini coefficient is a measure of statistical dispersion that represents the inequality among values in a distribution (Lorenz, 1905). When gaze maps are analyzed, higher Gini coefficients correspond to fixations occurring in concentrated regions, whereas lower Gini coefficients correspond to fixations dispersed over greater areas (for an example, see Fig. 2, left panel). To quantify and compare the dispersion of eye movements across the face between super-recognizers and typical viewers, we computed the Gini coefficient for each trial-level gaze map (using the MATLAB “Gini coefficient and the Lorentz curve” package; see Lengwiler, 2020). Analysis of Gini coefficients was conducted at the trial level with phase (face learning, face recognition), preserved face information (continuous: 100%, 60%, 48%, 36%, 24%, 12%), group (super-recognizers, typical viewers), and all interactions as factors. To control for the impact of trial duration on the Gini coefficient, we also included trial duration as a factor in the model (without any interaction terms) using study time (5 s) as the duration for study-phase trials.
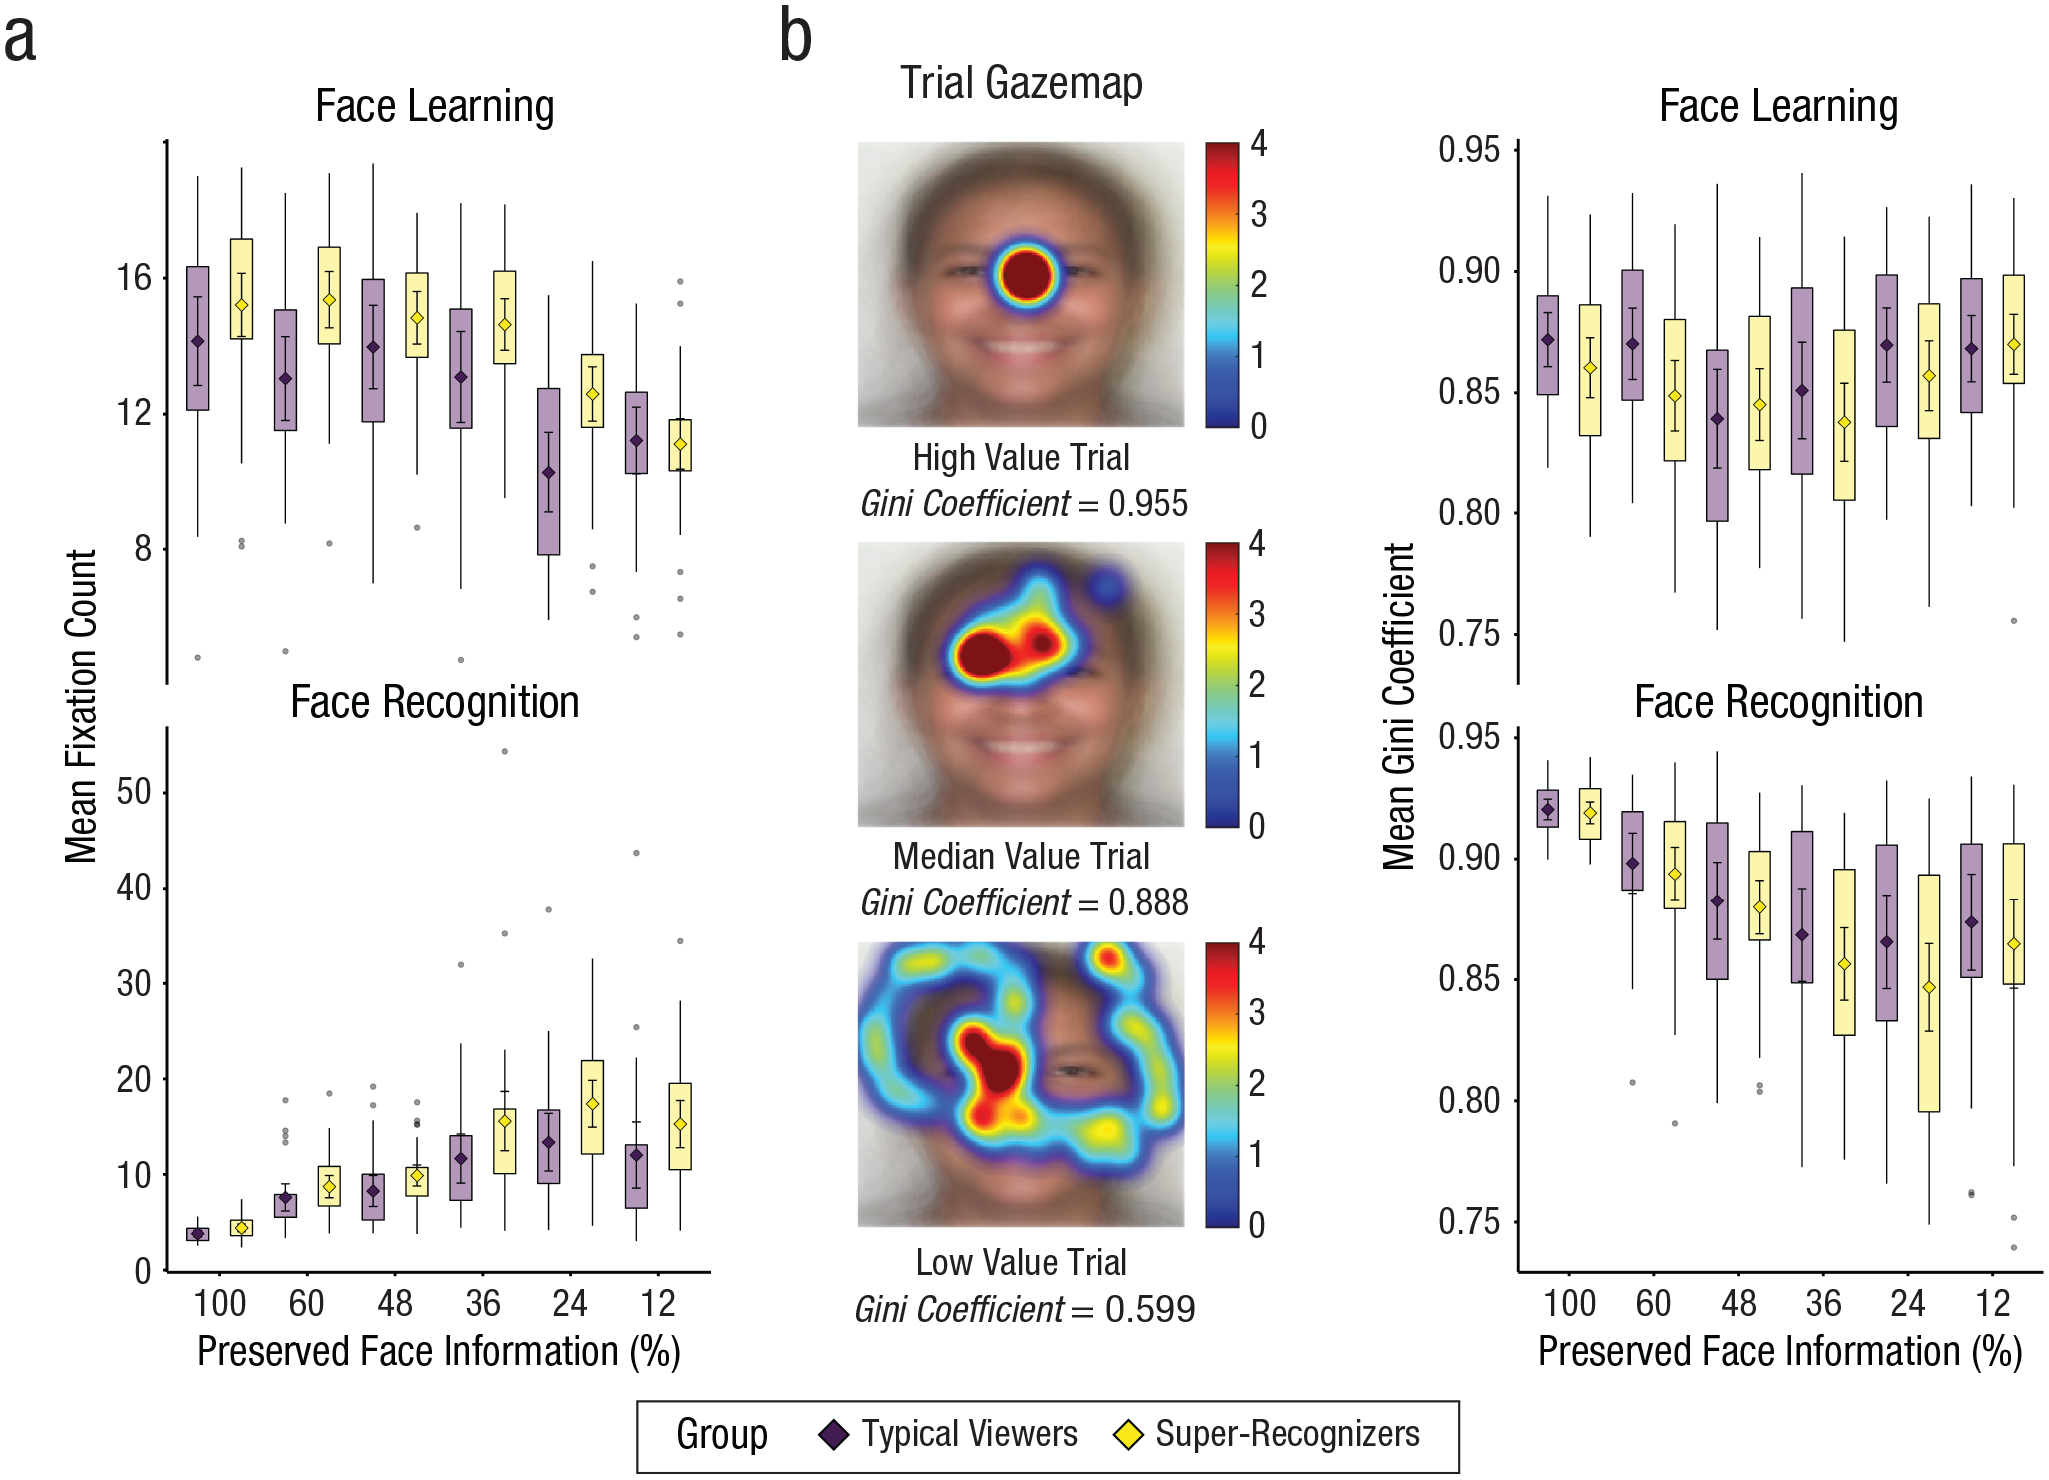
Differences in fixation counts and dispersal between typical viewers and super-recognizers. Super-recognizers made more fixations (a), and this difference was driven mostly by face learning (top) rather than recognition (bottom). Gini coefficients (b) were used to measure the statistical dispersion of gaze across the face; lower values correspond to higher dispersion. Example trial gaze maps show those with highest (top), median (middle), and lowest (bottom) Gini coefficients. Super-recognizers had lower Gini coefficients than typical viewers, signaling greater visual exploration. Again, this was driven mostly by face learning (top right) rather than recognition (bottom right). In all graphs, diamonds show group means, and error bars show 95% confidence intervals; box plots show interquartile ranges of means.
Gaze-pattern analysis
To capture the major differences in gaze patterns across participants, we conducted principal components analysis (PCA) on trial-level gaze patterns. PCA is data driven, in the sense that it does not rely on experimenter input in the form of predefined regions of interest and so is well suited to exploratory analysis of eye-tracking data (see Varela et al., 2018; Wegner-Clemens et al., 2019). To conduct this analysis, we first normalized and then resized the gaze maps—from 891 × 656 pixels to 209 × 182 pixels—and converted each to a single vector. Separate PCAs were conducted for trials from face-learning and face-recognition phases with principal component loadings reported as a z score (i.e., SD units from mean). After applying the PCA, we created visual reconstructions of the first five principal components (PC1–PC5) and compared the loadings for super-recognizers and typical viewers on these principal components.
Analysis of PC1, representing the major source of differences in gaze patterns, was conducted at the trial level with phase (face learning, face recognition), preserved face information (continuous: 100%, 60%, 48%, 36%, 24%, 12%), group (super-recognizers, typical viewers), and all interactions as factors. This same analysis was repeated for PC2 to PC5, but these are reported in the Supplemental Material.
Results
Face-recognition accuracy
Linear mixed models show that super-recognizers’ superior face-recognition accuracy was maintained under increasingly restricted viewing conditions (see Fig. 1). This is shown by a significant main effect of group for A′, b = 0.069, 95% confidence interval (CI) = [0.035, 0.102], t(58) = 4.05, p < .001, and nonsignificant interaction with aperture size, b = 0.017, 95% CI = [−0.005, 0.039], t(298) = 1.52, p = .129. There was a significant main effect of aperture size; both groups showed similar decreases in A′ with small aperture sizes, b = 0.123, 95% CI = [0.112, 0.134], t(298) = 21.74, p < .001.
Analysis of fixation counts and dispersal
Linear mixed models showed that super-recognizers made more fixations, especially during face learning (see Fig. 2). This was evident from a significant interaction between group and phase, b = 0.67, 95% CI = [0.43, 0.91], t(11519.8) = 5.44, p < .001, and simple effects showed a larger group difference in number of fixations during face learning (b = −1.28, 95% CI = [−2.30, –0.25]) than during face recognition (b = −0.61, 95% CI = [−1.63, 0.41]). We also observed a significant interaction between group and aperture size, b = −0.19, 95% CI = [−0.31, –0.06], t(10564.6) = 2.93, p = .003, due to a larger group difference at larger aperture sizes.
Although super-recognizers made more fixations than typical viewers, it is not clear whether they also sampled more face information. It is possible that they focused their gaze on the same regions on each fixation. To examine whether they also engaged in more exploratory fixations, we analyzed participants’ dispersal of gaze using the Gini coefficient. The Gini coefficient is a measure of statistical dispersion that represents the inequality among values within a distribution and was originally used to study the distribution of wealth (Lorenz, 1905). When gaze maps are analyzed, higher Gini coefficients index a higher concentration of fixations to specific regions, whereas lower Gini coefficients index a greater dispersal of fixations across the face (for an example, see Fig. 2, middle panel).
In line with the interactions between number of fixations between group and aperture size, and between group and phase, linear mixed models revealed a significant three-way interaction between group, phase, and aperture size for gaze dispersal, b = 0.004, 95% CI = [0.001, 0.007], t(11503.5) = 2.82, p = .005. Simple effects show that during learning, super-recognizers generally showed a lower Gini coefficient (i.e., more exploration) at larger aperture sizes than did typical viewers (b = −0.013, 95% CI = [−0.028, 0.002]), but this trend was diminished for smaller aperture sizes (b = −0.003, 95% CI = [−0.018, 0.012]). During recognition, group differences were not observed at any aperture sizes (larger apertures: b = −0.002, 95% CI = [−0.017, 0.013]; smaller apertures: b = −0.001, 95% CI = [−0.015, 0.014]). Together, this pattern of effects shows that the largest differences in face-information sampling between super-recognizers and typical viewers are during face learning with larger aperture sizes.
Gaze-pattern analysis
To capture the key differences in eye-movement behavior across participants, we conducted a PCA of gaze patterns on each trial separately for the face-learning and face-recognition phases. Figure 3 shows the reconstruction of PC1 in both the face-learning and face-recognition phases (reconstruction of first 5 principal components are shown in Fig. S4 in the Supplemental Material). We found remarkable stability in the first principal component (PC1) that emerged in both learning and recognition phases despite being independent models. PC1 consistently coded participants’ tendency to fixate the eye region (i.e., negative PCA loadings to the left of Fig. 4a) versus their tendency to distribute fixations more broadly across central regions of the face (i.e., positive PCA loadings to the right of Fig. 4a) and accounted for between 15% and 18% of the variance in gaze patterns across trials (for more information, see the Supplemental Material).
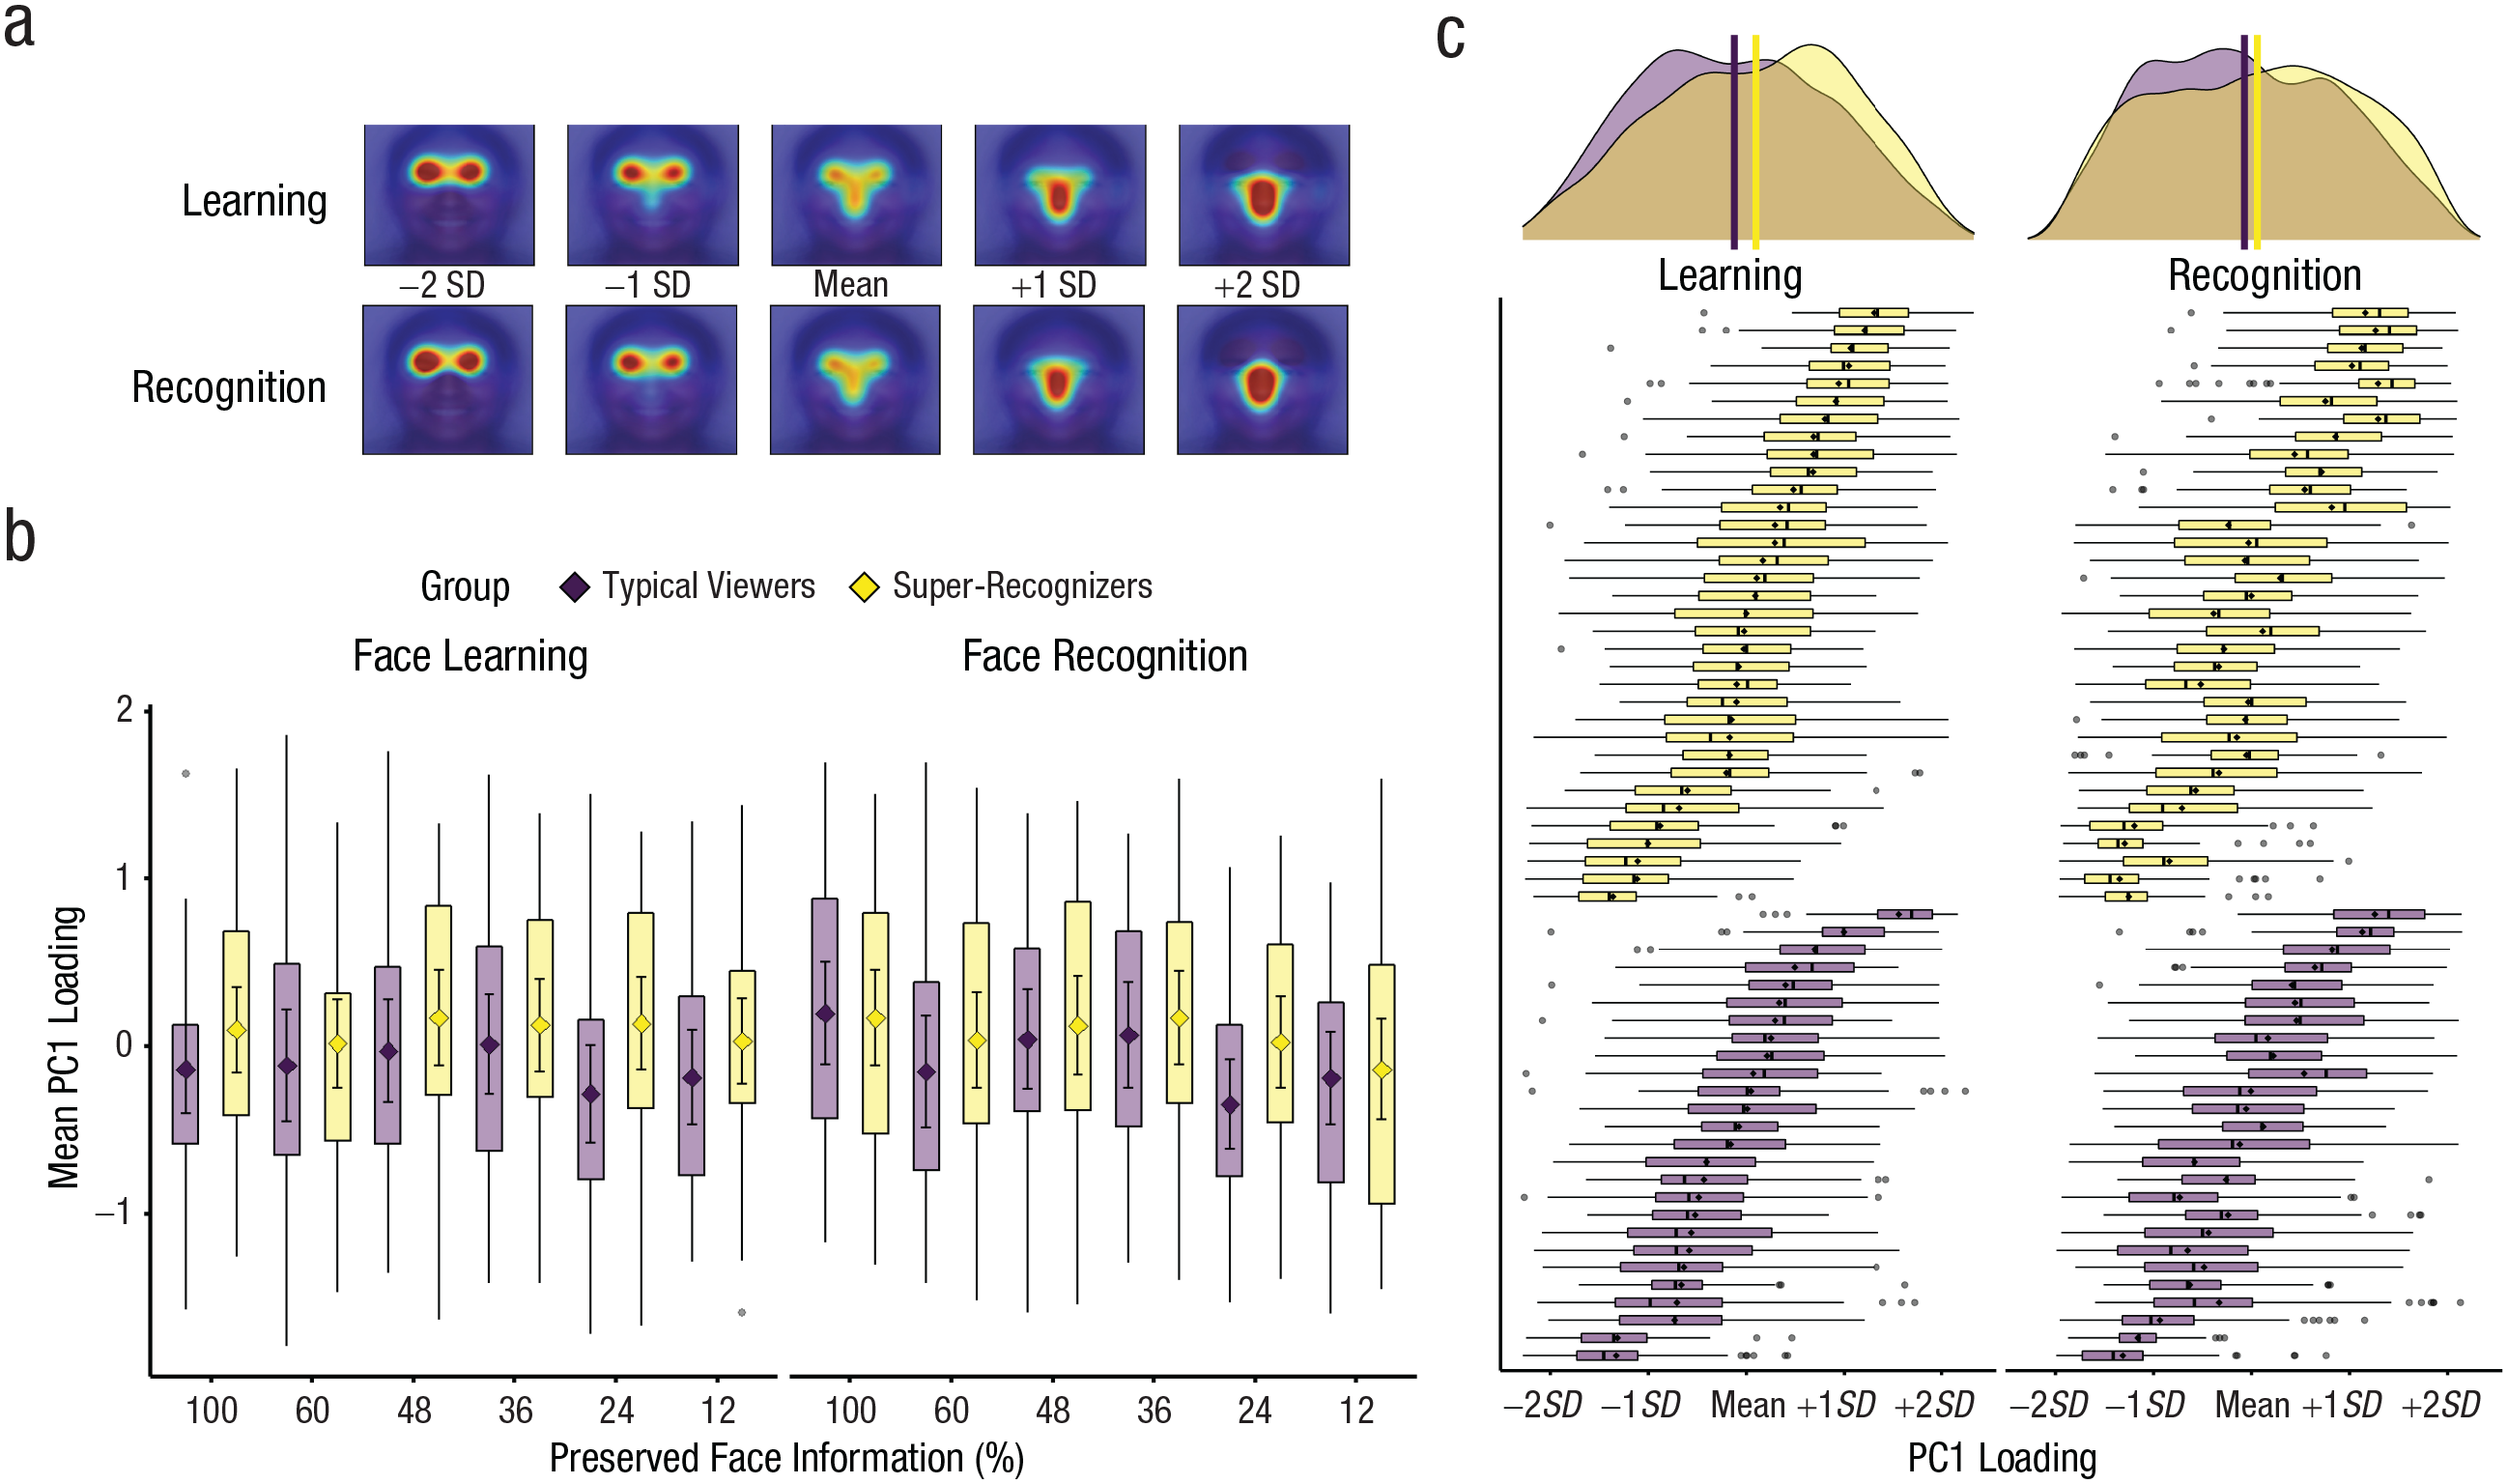
Principal components analysis shows more dispersion of gaze-patterns for super-recognizers than typical viewers, particularly during face learning. Visualization of first principal component (PC1) that emerged from principal components analysis (PCA) of trial-level gaze maps during face learning and recognition in Experiment 1 (a). PC1 loadings show differences in gaze patterns between super-recognizers and typical viewers (b). Diamonds show means, and error bars show 95% confidence intervals; box plots show interquartile ranges of mean PC1 loadings (in standard-deviation units) for each condition. Consistent with all of our eye-tracking analyses, results show that differences between super-recognizers and typical viewers are most consistent during face learning. Box plots and mean distributions of PC1 loadings across trials are shown for each participant (c). Visual inspection shows substantial intertrial variability in PC1 for each participant. Participants’ data are ordered from top to bottom in both learning (left) and recognition (right) phases on the basis of mean loading on PC1 on the learning phase (left). Consistent ordering between learning and recognition shows remarkably strong stability in individual gaze patterns. Probability distributions at the top show aggregates of trial-level PCA loadings; vertical lines show the group means.

For all amount of preserved information, super-recognizers conforms to the linear relationship between CFMT scores and A′ fitted on typical viewers. Distributions of A′ for each aperture size in Experiment 2 (left). Diamonds show group means, and error bars show 95% confidence intervals; violins and box plots show distributions and interquartile ranges, respectively. Data from three super-recognizers collected as part of this experiment are shown as yellow dots. Scatterplots and correlations (right) show that Cambridge Face Memory Test–Long Form (CFMT+) scores predict A′ for most aperture sizes. Linear models and coefficients were produced without including the super-recognizers (yellow dots), which appear to also fit onto the same trendlines. Shaded regions in scatterplot indicate 95% confidence intervals.
Figure 3 also shows the mean PC1 loadings across conditions for each group. Linear mixed models show a significant interaction between phase and group, b = −0.101, 95% CI = [−0.154, –0.048], t(1151.6) = 3.72, p < .001, and simple effects show that the difference between groups was larger during face learning (b = 0.225, 95% CI = [−0.148, 0.599]) than face recognition (b = 0.125, 95% CI = [−0.247, 0.497]). As can be seen from visual inspection of Figure 3, this difference reflected a more negative loading in typical viewers relative to super-recognizers, which is reflective of a stronger bias to fixate on the eye regions in typical viewers (see Fig. 3). This difference was larger at smaller apertures (b = 0.229, 95% CI = [−0.144, 0.601]) than larger apertures (b = 0.121, 95% CI = [−0.251, 0.494]; for the full analysis model, see the Supplemental Material). This suggests that super-recognizers’ greater dispersal of gaze across the face is linked to their decreased focus on the eye region.
Figure 3 shows intraindividual differences in processing strategy across trials, and the width of box plots shows the extent of intertrial variability for individual participants’ PC1 loadings. In addition to the group difference aggregated across aperture size (top), two main observations can be made from visual inspection. First, there are large intraindividual differences, suggesting that sampling strategy is influenced at least as much by the individual trial as by the individual observer. Second, there appears to be a strong relationship between participants’ PC1 loadings for learning and recognition phases. This relationship indicates that, despite large intraindividual variation, there is also consistency in participants’ modal strategy between learning and recognition, r(58) = .954, p < .001, 95% CI = [.924, .972]. Interestingly, there was also stability in the standard deviation of these box plots between learning and recognition, r(58) = .686, p < .001, 95% CI = [.524, .801], suggesting that the extent to which individual participants shift their sampling pattern from trial to trial is also a stable individual difference. Both patterns were consistent across aperture sizes, and their consistency is especially striking given that learning and recognition eye-gaze data were used to produce separate PCA models (see the Supplemental Material).
Discussion
Super-recognizers were more accurate than typical viewers in all aperture conditions. Previous estimates of the perceptual span for face recognition in typical viewers correspond to 45% preserved face information (Papinutto et al., 2017). We also found a sharper drop-off of performance in both groups after this threshold, but critically, the magnitude of super-recognizers’ superiority remained relatively unchanged down to as little as 12% of face information per fixation. This suggests that super-recognizers are equally adept at piecemeal as they are at more global sampling and can draw on either type of processing to support face learning and recognition.
In addition, number of fixations and fixation dispersal analyses show that super-recognizers distribute their gaze more widely across a face than typical viewers. We also found differences in the gaze patterns of super-recognizers; factor loading from PC1 suggests that they are less focused on the eye region relative to typical viewers. Unexpectedly, all these differences were found most strongly during face learning.
Experiment 2
An important question for understanding the nature of individual differences in face-recognition ability is whether perceptual processing in super-recognizers represents an extreme version of normal face processing or whether they rely on qualitatively different processing strategies (Noyes et al., 2017; Tardif et al., 2019). Do the information sampling differences between super-recognizers and typical viewers found in Experiment 1 reflect qualitative processing differences? To address this, we recruited a larger group of typical viewers to examine whether the group differences that we observed can be explained by linear changes in processing as a function of face-processing ability across the ability spectrum. We also recruited three additional super-recognizers to test whether their performance fitted the linear models derived from the broader population.
Method
Participants
Forty-three typical viewers were recruited from the University of New South Wales and University of Wollongong research-participant pools and all were given course credit for their participation. One was excluded from analysis for excessive data loss following the same data-cleaning procedures as Experiment 1. The final group consisted of 35 female and seven male participants between 18 and 44 years old (M = 21.2 years, SD = 5.0). Three super-recognizers were recruited to participate in the study by an email advertisement sent to a database of volunteers that scored highly on the CFMT+, GFMT, and UNSW Face Test and were not compensated for their participation. The super-recognizers (two females and one male) were between the ages of 24 and 46 years (M = 31.7, SD = 12.4). All participants had normal or corrected-to-normal vision.
This research was approved by the Human Research Ethics Advisory Panel at the University of New South Wales and the Department of Psychology ethics committee at University of Wollongong. All participants gave their informed consent either digitally or in writing.
Apparatus and procedure
Participants’ eye movements were recorded with the EyeLink Portable Duo (with chin rest only; SR Research, Kanata, Ontario, Canada) at the University of New South Wales and with the EyeLink 1000+ eye tracker (with a chin and forehead rest; SR Research) at the University of Wollongong. Critically, the angular size of the stimuli was the same in both recording sites and matched Experiment 1, at approximately 16.5° of visual angle. Both devices had an average gaze-position error of about 0.25° and a spatial resolution of 0.01°. Only the dominant eye was tracked. The experiment was completed in MATLAB using the same procedure as Experiment 1 using the EyeLink toolbox (Cornelissen et al., 2002).
Statistical analyses
Analyses were conducted using linear mixed models with the same parameters as Experiment 1, except that the continuous variable of the CFMT+ score replaced the categorical variable of group as a factor in all models. Scores were z-score normalized before analysis.
Results
Face-recognition accuracy
Figure 4 shows A′ scores as a function of gaze-aperture conditions as well as correlations between accuracy and CFMT+ score for each aperture size. As in Experiment 1, linear mixed models show that face-recognition ability did not interact with aperture size. This is shown by a significant main effect of CFMT+ score for A′, b = 0.042, 95% CI = [0.023, 0.060], t(43) = 4.42, p < .001, and nonsignificant interaction with aperture size, b = −0.004, 95% CI = [−0.015, 0.007], t(223) = −0.69, p = .492. There was again a significant main effect of aperture size; both groups show similar decreases in A′ with small aperture sizes, b = 0.091, 95% CI = [.080, .101], t(223) = 16.61, p < .001.
To examine whether super-recognizers’ performance was consistent with the linear models at each aperture size, we plotted their accuracy on linear trends established from the broader population (see Fig. 4). Visual inspection of these plots clearly shows that super-recognizers’ performance is closely predicted by broader patterns of individual differences. This pattern is confirmed by goodness-of-fit statistics for a linear model trained on typical viewers because it predicts super-recognizers’ A′ scores with high accuracy (typical viewers: root-mean-square error [RMSE] = 0.107, R2 = .48; super-recognizers: RMSE = 0.072, R2 = .60; for more details, see the Supplemental Material).
Analysis of fixation counts and dispersal
Linear mixed models replicate the findings of Experiment 1, showing that participants with higher CFMT+ scores made more fixations and distributed these fixations across wider regions of the face. Again, these differences were most apparent at face learning. Scatterplots of the relationships between CFMT+ scores and fixation data are shown in Figure 5.
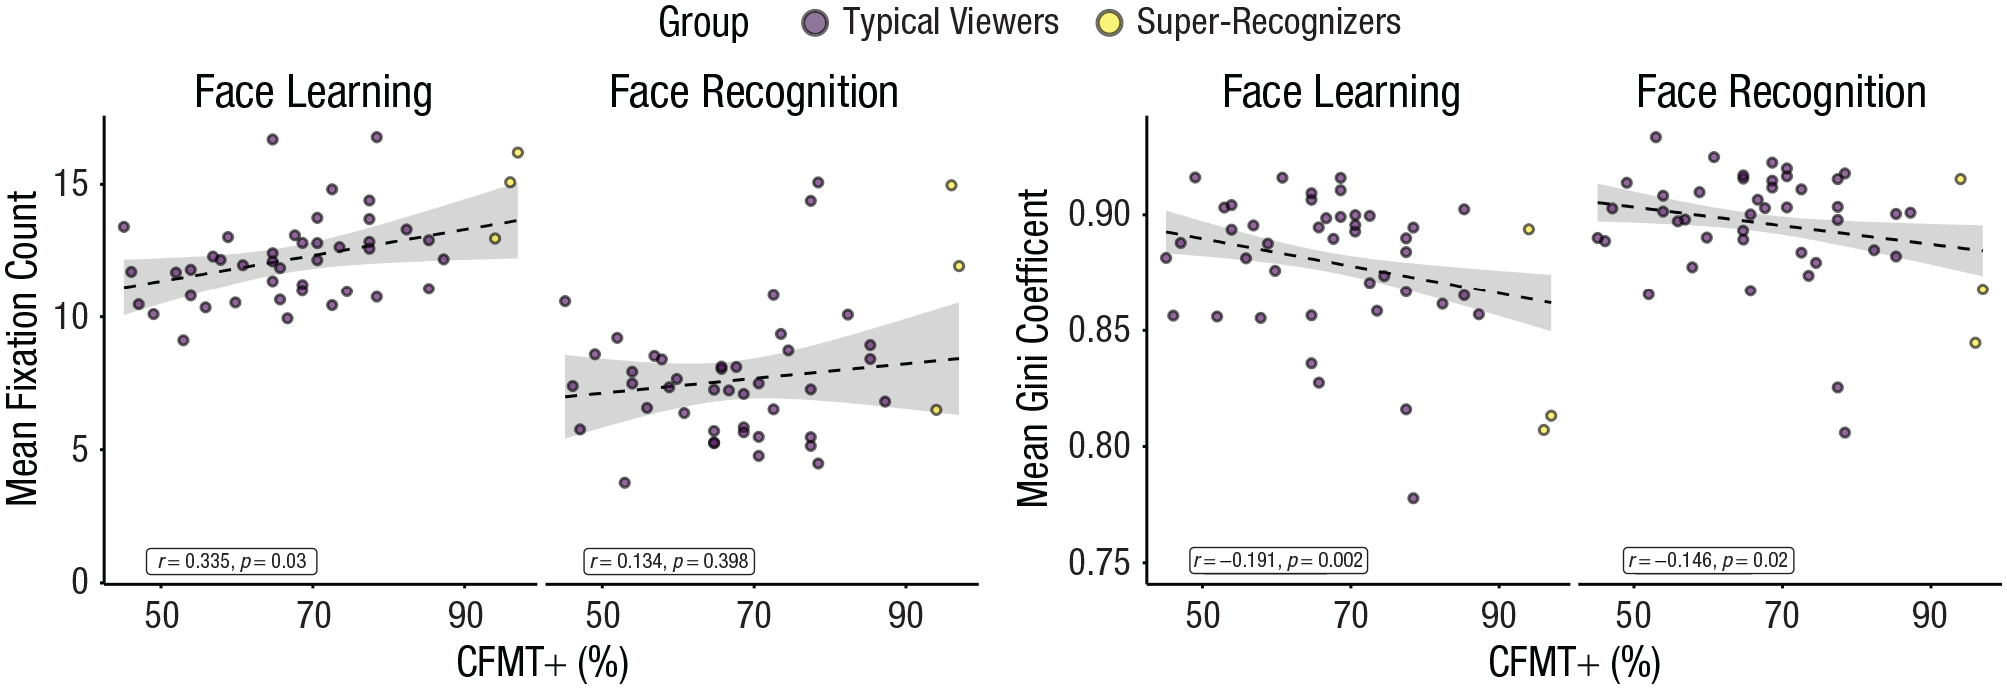
Scatterplots showing mean fixation count (left) and gaze dispersal (mean Gini coefficient; right) as a function of Cambridge Face Memory Test–Long Form (CFMT+) scores in Experiment 2. Typical viewers used to generate linear models (dashed lines) are shown in purple, and super-recognizers are shown as yellow dots. Shaded regions indicate 95% confidence intervals.
For number of fixations, the main effect of CFMT+ score was significant, b = −0.55, 95% CI = [0.24, 0.86], t(43.2) = 3.44, p = .001, and higher CFMT+ participants tended to make more fixations per trial than lower CFMT+ participants. There was also a significant main effect of aperture size, b = 1.04, 95% CI = [0.93, 1.15], t(1553.8) = 18.28, p < .001, and fewer fixations were made at smaller aperture sizes. These effects were qualified by a significant three-way interaction between CFMT+, phase, and aperture size, b = −0.14, 95% CI = [−0.24, –0.03], t(9160.6) = 2.60, p = .009. Simple effects suggest that whereas the main effects of CFMT+ scores and aperture size are seen in both phases, these effects are larger in face learning (smaller apertures: b = 0.70, 95% CI = [0.36, 1.04]; larger apertures: b = 0.89, 95% CI = [0.55, 1.23]) than face recognition (smaller apertures: b = 0.34, 95% CI = [0.01, 0.67]; larger apertures: b = 0.26, 95% CI = [−0.07, 0.59]). Goodness-of-fit statistics show that a linear model trained on typical viewer data predicted super-recognizers’ fixation counts with comparable fit to the typical viewer data (typical viewers: RMSE = 2.4, R2 = .58; super-recognizers: RMSE = 4.6, R2 = .42; for more details, see the Supplemental Material).
Gaze dispersal analysis also replicated Experiment 1. Linear mixed models of the Gini coefficient show a significant main effect of CFMT+ score, b = −0.008, 95% CI = [−.014, –.002], t(43.0) = −2.44, p = .019, and higher CFMT+ scores led to lower Gini coefficients. This effect was characterized further by a significant interaction between CFMT+ and phase, b = 0.007, 95% CI = [.005, .008], t(9141.6) = 10.44, p < .001, and simple effects show an effect of CFMT+ scores during face learning (b = 0.011, 95% CI = [−.018, –.005]) but not during face recognition (b = 0.004, 95% CI = [−.011, .002]). Again, goodness-of-fit statistics show that a linear model trained on typical viewer data predicted super-recognizers’ Gini coefficients with comparable fit with the typical viewer data (typical viewers: RMSE = 0.031, R2 = .15; super-recognizers: RMSE = 0.052, R2 = .27; for more details, see the Supplemental Material). Together with accuracy analysis, these results are consistent with differences in super-recognizers’ viewing behavior observed in Experiment 1 being due to dimensional—rather than qualitative and categorical—differences across the ability spectrum.
Gaze-pattern analysis
PCA was conducted in the same way as Experiment 1 and appeared to replicate the same first component (see Fig. 6). PC1 again appeared to code participants’ tendency to fixate the eye region (left side) versus their tendency to distribute fixations more broadly across central regions of the face (right side) and accounted for between 19% and 20% of the variance in gaze patterns across trials (for more information, see the Supplemental Material).

Nonlinear relationship between gaze-patterns and face-recognition abilities. Visualization of first principal component (PC1; a) that emerges from principal component analysis of trial-level gaze maps during face learning and recognition in Experiment 2. Scatterplots (b) show the poor predictiveness of super-recognizers’ eye-gaze patterns based on linear models trained on only typical viewers’ data (dashed red line). A U-shaped function provided a closer fit to the data (solid blue line). Shaded regions indicate 95% confidence intervals. CFMT+ = Cambridge Face Memory Test–Long Form.
As in Experiment 1, we explored the relationship between PC1 loading and face-recognition ability. Scatterplots of this relationship are shown separately for learning and recognition in Figure 6. Critically for our research question, linear mixed models of PC1 show no significant main effect of CFMT+ score, b = 0.02, 95% CI = [−0.18, 0.23], t(43.0) = 0.2, p = .844. There was a significant three-way interaction between CFMT+ score, phase, and aperture size, b = 0.03, 95% CI = [0.00, 0.06], t(9157.4) = 2.17, p = .030, which was peripheral to the motivation of Experiment 2 and is described in the Supplemental Material. Goodness-of-fit statistics suggest that linear models trained on typical viewers poorly predict both super-recognizers’ and typical viewers’ gaze patterns (typical viewers: RMSE = 0.732, R2 = .05; super-recognizers: RMSE = 1.264, R2 = .07; for more details, see the Supplemental Material). As in Experiment 1, we found a strong relationship between participants’ PC1 loadings for learning and recognition phases in both modal strategy, r(43) = .926, p < .001, 95% CI = [.869, .959], and variability of strategy across trials, r(43) = .719, p < .001, 95% CI = [.539, .836] (for analysis separately by aperture size, see the Supplemental Material).
This suggests that individual differences in gaze patterns, although present, are not linearly related to face recognition across the ability spectrum. Differences observed in super-recognizers’ gaze patterns, which were less fixated on eye regions in both Experiments 1 and 2, raise the question of whether there is a nonlinear relationship between CFMT+ scores and gaze pattern differences. Visual inspection of data points shown in Figure 6 was suggestive of a U-shaped relationship. Given evidence showing that people with congenital prosopagnosia also show less fixation on eye regions (DeGutis et al., 2012; Towler et al., 2016), we conducted a formal analysis of quadratic fit. Comparison of information criteria showed a better quadratic than linear fit for both learning and recognition for typical viewers (RMSE = 0.722, R2 = .05; model-comparison likelihood ratio = 14.03, p < .001) and super-recognizers (RMSE = 0.638, R2 = .26; for more details, see the Supplemental Material). Both linear and quadratic regressions are displayed in Figure 6 for purposes of visual comparison.
Discussion
In Experiment 2, we replicated key differences between super-recognizers and typical viewers from Experiment 1 in the broader ability spectrum. Face-recognition ability was a significant predictor of face-recognition accuracy, and this did not interact with aperture size. Likewise, differences in the number and dispersal of fixations observed in Experiment 1 were predicted by differences observed in Experiment 2 across the spectrum of face-recognition ability, showing that higher performance in face recognition is associated with more fixations and a more distributed sampling of face information.
We also examined whether linear trends in participants sampled from the broader ability spectrum predicted the performance and sampling strategies observed in a smaller group of super-recognizers. Consistent with previous work (Tardif et al., 2019), most of the differences between super-recognizers and typical viewers found in Experiment 1 were predicted by linear trends in the broader ability spectrum. Notably, however, our analysis of gaze patterns showed that these differences were not explained by linear trends in the broader ability spectrum. Instead, we observed a U-shaped function whereby gaze patterns in super-recognizers were more similar to those in participants with low ability than participants with average ability.
General Discussion
Across two experiments, we made three consistent observations about face-information sampling in people with superior face-identification ability. First, high performers retain their performance advantage even when only able to sample very small regions of the face on each fixation. Second, they sample more information from across the face. Third, these differences are observed most when they initially learn faces.
Reducing the amount of global information available to super-recognizers in a single fixation did not reduce super-recognizers’ performance advantage. Initial work aiming to understand perceptual processes underlying individual differences in face-processing ability had examined the association between measures of holistic-processing ability and face-identification performance (e.g., DeGutis et al., 2013). Whereas this work sometimes reported an association (e.g., R. Wang et al., 2012), more recent studies have not (e.g., Sunday et al., 2017). The findings we report here extend recent reports that underline the importance of local processing for explaining individual differences. For example, people with superior face-recognition ability require less local image information for accurate recognition (Royer et al., 2015; cf. Tsantani et al., 2020).
In our study, the abilities of high performers were not contingent on holistic sampling of information. This does not rule out the possibility that holistic representations were accumulated across sequential fixations (for a discussion on this point, see Miellet et al., 2013). Recent accounts of face-recognition deficits in congenital prosopagnosia propose that they result from impairments in spatial integration of information across multiple fixations (Avidan & Behrmann, 2021; cf. Farah et al., 1998). It is possible that superior integration of local information can explain group accuracy differences in small aperture viewing, but this processing advantage is clearly not contingent on viewing the whole face at one time. This presents a challenge to accounts of face representation that propose that holistic processing precedes the processing of spatial relations (e.g., Maurer et al., 2002) and that the tendency for people to perceive faces as gestalts fundamentally underpins individual differences in face-recognition ability (DeGutis et al., 2013). Our results instead emphasize the need for a more specific understanding of the mechanisms involved in face processing (Avidan & Behrmann, 2021; Bicanski & Burgess, 2019; Burton et al., 2015) to enable a quest for the fundamental perceptual and cognitive differences in those with differing levels of ability.
We also found differences in the face information sampled by super-recognizers compared with typical viewers that can inform this question. The greater number of fixations, greater dispersal across the face, and differences in factor loading suggest that super-recognizers sample more information across the face than typical viewers with less focus on just the eyes. Interestingly, we found that these differences were most clearly and consistently observed in information sampled during face learning. This result suggests that understanding superior face-recognition abilities might first require understanding the process of face learning.
Notably, we observed these differences despite limiting participants to studying a single image of each unfamiliar face on a computer screen for just 5 s before recognizing the same image at test. In everyday experience, visual information sampling is far less constrained, and so these results may not capture viewing behavior in more realistic settings where face stimuli are more diverse (varying, for example, in pose, expression and demographics). Moreover, the degrees of freedom for visual exploration—for example, through interacting with people or changes in viewpoint—are increased exponentially, potentially enabling the discovery of richer identity signatures in the face (Bulthoff et al., 2019; Butcher & Lander, 2017; Butcher et al., 2011; Yovel & O’Toole, 2016). Understanding how super-recognizers encode faces into memory in more realistic settings, where faces are constantly varying in appearance, may therefore help to understand how they construct robust memory representations of familiar faces.
In Experiment 2, we found that most differences in information sampling of high performers were consistent with linear trends across the broader ability spectrum. This extends recent studies examining information use in high performers in face-identification tasks (Chuk et al., 2017; Royer et al., 2018; Schyns et al., 2002; Tardif et al., 2019) and appears to show that super-recognizers’ abilities are not supported by qualitatively different processing (see Noyes et al., 2017). However, there were two important differences to this prior work. First, in our analysis of gaze patterns, super-recognizers appeared to fixate eye regions less than typical viewers, despite the prior implication of greater eye region use in high performers (e.g., Tardif et al., 2019). This difference is likely because we enabled participants to actively explore the face information, rather than the information available being constrained by the experimenter (as in the bubble technique; Schyns et al., 2002). Second, we did not observe a linear trend of information sampling patterns across the ability spectrum. Instead, the U-shaped association suggests that both low and high performers fixated less on the eye region. This is consistent with studies of people with congenital prosopagnosia, who also show more visual exploration and less attention to eyes compared with typical viewers (e.g., Malaspina et al., 2017; for reviews, see Avidan & Behrmann, 2021; Towler et al., 2016). This is an intriguing pattern and may suggest that additional information obtained via visual exploration both compensates for reduced function in low performers and augments normal function in high performers.
Overall, these findings highlight the importance of studying extreme face-recognition abilities in the context of the broader ability spectrum. As yet, there is no clear evidence of qualitative differences in super-recognizers’ perceptual and cognitive processing, suggesting that the study of super-recognizers is simply an alternative approach to studying individual differences. We have shown that these are linked to differences in visual sampling and exploration during face learning and so we suggest that differences observed in recognition may be founded on more elaborative information processing during encoding. Understanding individual differences in the construction of face identity representations during learning is, therefore, a critical avenue for future work.
Supplemental Material
sj-docx-1-pss-10.1177_09567976221096320 – Supplemental material for Face-Information Sampling in Super-Recognizers
Supplemental material, sj-docx-1-pss-10.1177_09567976221096320 for Face-Information Sampling in Super-Recognizers by James D. Dunn, Victor P. L. Varela, Victoria I. Nicholls, Michael Papinutto, David White and Sebastien Miellet in Psychological Science
Footnotes
Acknowledgements
We thank Bojana Popovic for her assistance with data collection.
Transparency
Action Editor: Sachiko Kinoshita
Editor: Patricia J. Bauer
Author Contributions
D. White and S. Miellet contributed equally to this study. J. D. Dunn, D. White, and S. Miellet designed the research. J. D. Dunn, V. I. Nicholls, M. Papinutto, and S. Miellet programmed the eye-tracking and presentation software. J. D. Dunn and V. I. Nicholls conducted the research. J. D. Dunn, V. P. L. Varela, and V. I. Nicholls analyzed the data. J. D. Dunn, V. P. L. Varela, D. White, and S. Miellet wrote the manuscript. All the authors approved the final manuscript for submission.

References
Supplementary Material
Please find the following supplemental material available below.
For Open Access articles published under a Creative Commons License, all supplemental material carries the same license as the article it is associated with.
For non-Open Access articles published, all supplemental material carries a non-exclusive license, and permission requests for re-use of supplemental material or any part of supplemental material shall be sent directly to the copyright owner as specified in the copyright notice associated with the article.
