
Abstract
It has become increasingly clear that COVID-19 is transmitted between individuals. It stands to reason that the spread of the virus depends on sociocultural ecologies that facilitate or inhibit social contact. In particular, the community-level tendency to engage with strangers and freely choose friends, called relational mobility, creates increased opportunities to interact with a larger and more variable range of other people. It may therefore be associated with a faster spread of infectious diseases, including COVID-19. Here, we tested this possibility by analyzing growth curves of confirmed cases of and deaths due to COVID-19 in the first 30 days of the outbreaks in 39 countries. We found that growth was significantly accelerated as a function of a country-wise measure of relational mobility. This relationship was robust either with or without a set of control variables, including demographic variables, reporting bias, testing availability, and cultural dimensions of individualism, tightness, and government efficiency. Policy implications are also discussed.
Over the last several months, a novel strain of coronavirus (SARS-CoV-2) has spread across the globe, causing the COVID-19 pandemic. Although there is substantial cross-national variation in the damage caused by the virus, little is known about the factors that contribute to this variation. It is commonly accepted, however, that the virus is transmitted through social contact. Hence, viral transmission could increase as social contact becomes more frequent and variable. We thus investigated whether country-wise vulnerability to COVID-19 might vary systematically on the basis of social ecologies that encourage or discourage social contact.
Our focus is on relational mobility, the extent to which it is easy to form new relationships and terminate current ones in any given society (Yuki & Schug, 2020). In societies low in relational mobility, interdependence with close others is valued (Markus & Kitayama, 1991). Relationships are typically ascribed by social roles and restricted to close others (Adams, 2005). Conversely, in societies high in relational mobility, social relationships tend to be freely chosen and more expansive. People can form new relationships and leave former ones at will. They thus tend to be socially open (Schug, Yuki, & Maddux, 2010). The resulting social ecologies would increase the opportunity for interaction with a greater number of individuals outside each person’s primary social groups (e.g., close inner circle of friends). Thus, high relational mobility may put people at particularly high risk for contracting an infectious disease such as COVID-19.
We tested whether country-wise relational-mobility scores (Thomson et al., 2018) would positively predict growth in both confirmed cases of and deaths due to COVID-19. The growth (the rate of increase) is unlikely to be affected by reporting biases and testing availability, as long as the latter factors are constant. It was therefore important to examine a short initial period of growth. At the same time, it was necessary to test a sufficiently long period to obtain reliable estimates of the growth rate. To simultaneously meet these two competing demands, we focused on the first 30 days of country-wise outbreaks in the main analysis. This analytic strategy also enabled us to capture the COVID-19 spread prior to country-wide lockdowns.
Method
Data
Main variables
We retrieved data on daily confirmed COVID-19 cases and deaths by country from a public repository updated daily by the Johns Hopkins University Center for Systems Science and Engineering (2020). Our current results are based on data up until July 21, 2020. Relational-mobility scores were obtained from Thomson et al. (2018), who measured relational mobility by assessing the extent to which people perceive others in their local communities as socially open and, thus, seek new friendships and exit unsatisfactory relationships. In 39 countries, these researchers administered a 12-item scale of relational mobility to a large number of adults who were recruited with Facebook ads, and they found systematic cross-cultural variation. A series of analyses with a wide range of culture-level indicators of behavioral outcomes shows the validity of the relational-mobility score. For example, relational mobility predicts the national levels of general trust, self-disclosure, intimacy, and social support (Thomson et al., 2018).
We followed prior work (Berg, Yu, Salvador, Melani, & Kitayama, 2020) and defined the day of the first 100 confirmed cases as Day 1. We then included only those countries that reported at least 15 days of data. For deaths, we defined the first day of at least one reported death as Day 1. We included only those countries with at least 15 days of data. All 39 countries met these criteria.
The 39 countries included are listed in Table S1 in the Supplemental Material available online, which also shows the dates of (a) the first 100 confirmed cases, (b) the first confirmed death, and (c) the national lockdown (if instituted) for each of the countries. In many cases, the lockdown occurred during the first 30 days of the outbreak. Even in those cases, the lockdown occurred more than halfway through the period. Because it takes a certain amount of time (usually several weeks, based on an estimate for the 1918 influenza pandemic by Bootsma & Ferguson, 2007) for any lockdown to have an effect, it would seem reasonable to ignore any effect of state-imposed lockdowns on the current analysis. This point is arguably valid in a robustness check with the first 15 days of data.
Statement of Relevance
The COVID-19 pandemic has impacted all countries on the globe. However, some countries have suffered far more than others. It is of utmost significance to understand factors explaining this cross-country variability. Here, we report the first evidence that the variation in vulnerability to COVID-19 may be due, in part, to cultural practices of social relationships. In particular, we found that the spread of this virus depends on a community’s social openness (the degree to which people interact with others of their choosing)—a dimension called relational mobility. Compared with countries that are low in relational mobility, those higher in relational mobility showed a significantly steeper slope, indicating that the virus spread faster during the early period of country-wise outbreaks. This evidence underscores the need for social distancing to “flatten the epidemic curve,” especially in countries where social openness is valued.
Demographics
Following prior work (Berg et al., 2020), we included several demographic variables as covariates. Total population was added because in larger groups of people, there will be more cases and deaths. Median age of the total population (in years) was included because older adults are more susceptible to disease. Population density (in persons per square kilometer) was used because it is likely to foster greater social contact, resulting in greater chances of infection. Net migration (persons entering the country minus persons exiting the country, per 1,000 people) was included to control for population movement. These four statistics were obtained from the United Nations Department of Economic and Social Affairs (2018). Gross domestic product (at purchasing-power parity) per capita (in thousands), tourism rates, and percentage of the population that is urban (percentage urban) were included to control for economic development, the influx of foreigners, and how urban the country is (The World Bank, 2019).
Cultural dimensions
Three cultural dimensions were tested as potential confounding variables. First, Hofstede’s index of individualism (Hofstede, 1984) was used because its conceptual equivalent (independent self-construal) is positively correlated with relational mobility (San Martin, Schug, & Maddux, 2019; Thomson et al., 2018), consistent with the notion that freedom to choose is an important facet of independent self-construal (Markus & Kitayama, 1991). Scores are based on responses to a series of questions asked to employees of a large information technology company across countries. Scores were available for 35 of the 39 countries. Second, the efficiency in governmental operations might promote more effective coping with COVID-19. We used the Government Efficiency Index (The World Bank, 2020), which shows the public sector’s performance in managing and regulating the political economy. The index varies from 1 (very inefficient) to 5 (highly efficient). Scores were available for 34 of the 39 countries. Third, recent research suggests that the tightness (vs. looseness) of social norms could be an adaptation to threats, including pathogen threats (Gelfand et al., 2011). Tightness might then lower the growth rate of cases and deaths. The measure of tightness-looseness, adopted from Gelfand et al. (2011), is an arithmetic mean of responses to a six-item questionnaire assessing the perceived rigidity of social norms in one’s own country. Scores were available for 23 of the 39 countries tested.
Bacillus Calmette-Guérin (BCG) policy status
Berg et al. (2020) tested 139 countries and found that those with universal BCG vaccination policies show a reduced growth rate of both COVID-related confirmed cases and deaths (Berg et al., 2020). We thus used BCG policy status (with or without BCG policy) as another covariate. Data were available for 37 out of the 39 countries.
Robustness checks
Underreporting of cases
Countries may vary in underreporting for many reasons (e.g., governmental information suppression). To account for this, we adopted an underreporting index devised by Russell and colleagues (2020). These researchers first computed a case fatality ratio (CFR) in each country that is adjusted for delay between admission to the hospital and death. Then they computed the ratio of the best empirical estimate of CFR (1.4%) to the adjusted CFR for each country. If this ratio is smaller than 1, it indicates underreporting of cases. Some countries, such as Italy, Spain, and Morocco, show substantial underreporting (index < 10%), whereas others, such as Norway, Israel, and South Korea, show very low underreporting (index > 50%). We used country-wise underreporting scores on April 15, 2020, downloaded from https://github.com/thimotei/CFR_calculation. This index was available for 29 of the 39 countries.
This index can be defined as a measure of inaccuracy of the report of cases. In one analysis, we used it as a weight, with the data from countries with higher values weighted more than the data from those with lower values. The index can also indicate underestimation of the number of cases reported. Thus, in another analysis, we also used it as an additional covariate. These analyses were performed only for the number of confirmed cases.
Testing availability
We also adopted the number of COVID-19 tests per case. These data were obtained from the Our World in Data (2020) project. In countries such as France and Mexico, the tests-per-case ratio was low, suggesting that testing was not readily available. Conversely, in countries such as New Zealand, Australia, and Taiwan, this ratio was high, implying higher degrees of testing availability. Data were available for 29 out of the 39 countries. As with the reporting index, we conducted two analyses with these scores. First, we weighted countries with more testing more heavily because we assumed that more testing would lead to more accurate counts of cases. Second, we included testing availability as a covariate because less testing can also lead to an underestimation of cases reported. These analyses were performed only for the number of confirmed cases.
Days of country-wise outbreaks
In the main analyses, we focused on the initial 30-day period of country-wise outbreaks. To ensure the robustness of the pattern, we carried out two analyses that used a half (15 days) or twice (60 days) as many days as in our standard analysis. Note, however, that the analysis with the 60-day period must be treated with caution because the change in cases or deaths by day do sometimes deviate dramatically from an exponential function (the function assumed in the current analysis; see the Statistical Analysis section below) after an initial period of approximately 30 days.
Interpolation of relational-mobility data with cultural-distance scores
In a recent study, Muthukrishna and colleagues (2020) offered an index of cultural distance for each of the pairs of 80 countries. The distance index is based on geometric distance across many attitudinal items culled from the World Value Survey. The 80 countries tested by Muthukrishna et al. included 34 of the 39 countries for which relational-mobility scores were available. We interpolated the relational-mobility score for each of the 46 (i.e., 80 − 34) countries without relational-mobility scores. This was done for each country by averaging the relational-mobility scores of the 34 countries after weighting them by the inverse of the cultural distance between the target country and the 34 countries. For example, consider one of the 80 countries tested by Muthukrishna et al. that did not have a relational-mobility score (designated as RM j ). This country has a cultural-distance score (designated as Dij, where i = 1 to m) with each of the m countries with relational-mobility scores (designated as RM i ). The relational-mobility score for this country was computed by the following formula:
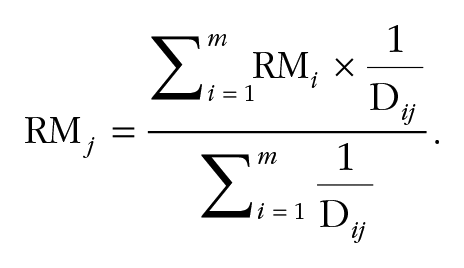
In this instance, m was equal to 34. The relational-mobility scores imputed for the 46 countries were used to repeat the same set of analyses for the 85 (i.e., 39 + 46) countries.
To assess the validity of this procedure, we repeated the same procedure for the 34 countries for which relational-mobility scores were available. In this case, we interpolated the relational-mobility score for a target country by averaging the relational-mobility scores for the remaining 33 countries (i.e., all countries for which relational-mobility scores were available except for the target country) after weighting each score with the inverse of the cultural distance between the target country and each of the 33 countries. In this instance, m was equal to 33. The correlation between actual relational-mobility scores and the interpolated relational-mobility scores was .596, p < .001.
Statistical analysis
All analyses were conducted on up to 30 days of data from each country. Linear mixed-effects models with restricted maximum likelihood estimation were used to analyze both the number of cases and deaths. We natural-log-transformed both cases and deaths because the growth of cases and deaths is known to be exponential in an early period of a pandemic. Day was centered so main effects could be interpreted as differences at the mean day of the growth curve. Total population was natural-log-transformed to reduce skewness. All demographic and cultural variables were z scored. We estimated both a random intercept and random slope across days to allow for the heterogeneity of growth curves across countries. We included another random effect that accounted for countries being nested in geographic regions defined by The World Bank (2019), because these nations are not independent and have some shared cultural and political history.
We tested three models. Model 1 included day, relational mobility, and the Day × Relational Mobility interaction. To control for population size, we also included both population and its interaction with day. Model 2 added all the demographic variables to Model 1. All demographic variables were available for each of the 39 countries, with the exception of the tourism measure for Taiwan. Model 3 included only those covariates that had a significant interaction with day (p < .10) in Model 2. We report the statistics from Model 3 in the text. All other statistics can be found in Table 1 or in Tables S1 through S11 in the Supplemental Material. Regarding the remaining covariates (e.g., cultural values, BCG policy status, underreporting, and testing availability), data were often missing for some countries. Thus, to retain the maximal number of countries, we tested them one at a time in a separate analysis. When a full model failed to converge, we dropped the intercept-slope covariance of the random effects (country and geographic region). This is arguably the most conservative strategy, as the covariance terms would be automatically dropped once one of the two terms defining the covariance was dropped (Bates, Kliegl, Vasishth, & Baayen, 2018). When the model still did not converge, we dropped the geographic region as a nesting factor although this happened only for a few robustness checks. Correlations among the cultural and demographic variables are given in Figure S1 in the Supplemental Material.
Results of the Regression Predicting the Number of Confirmed Cases and the Number of Deaths Over the First 30 Days of Country-Wise Outbreaks
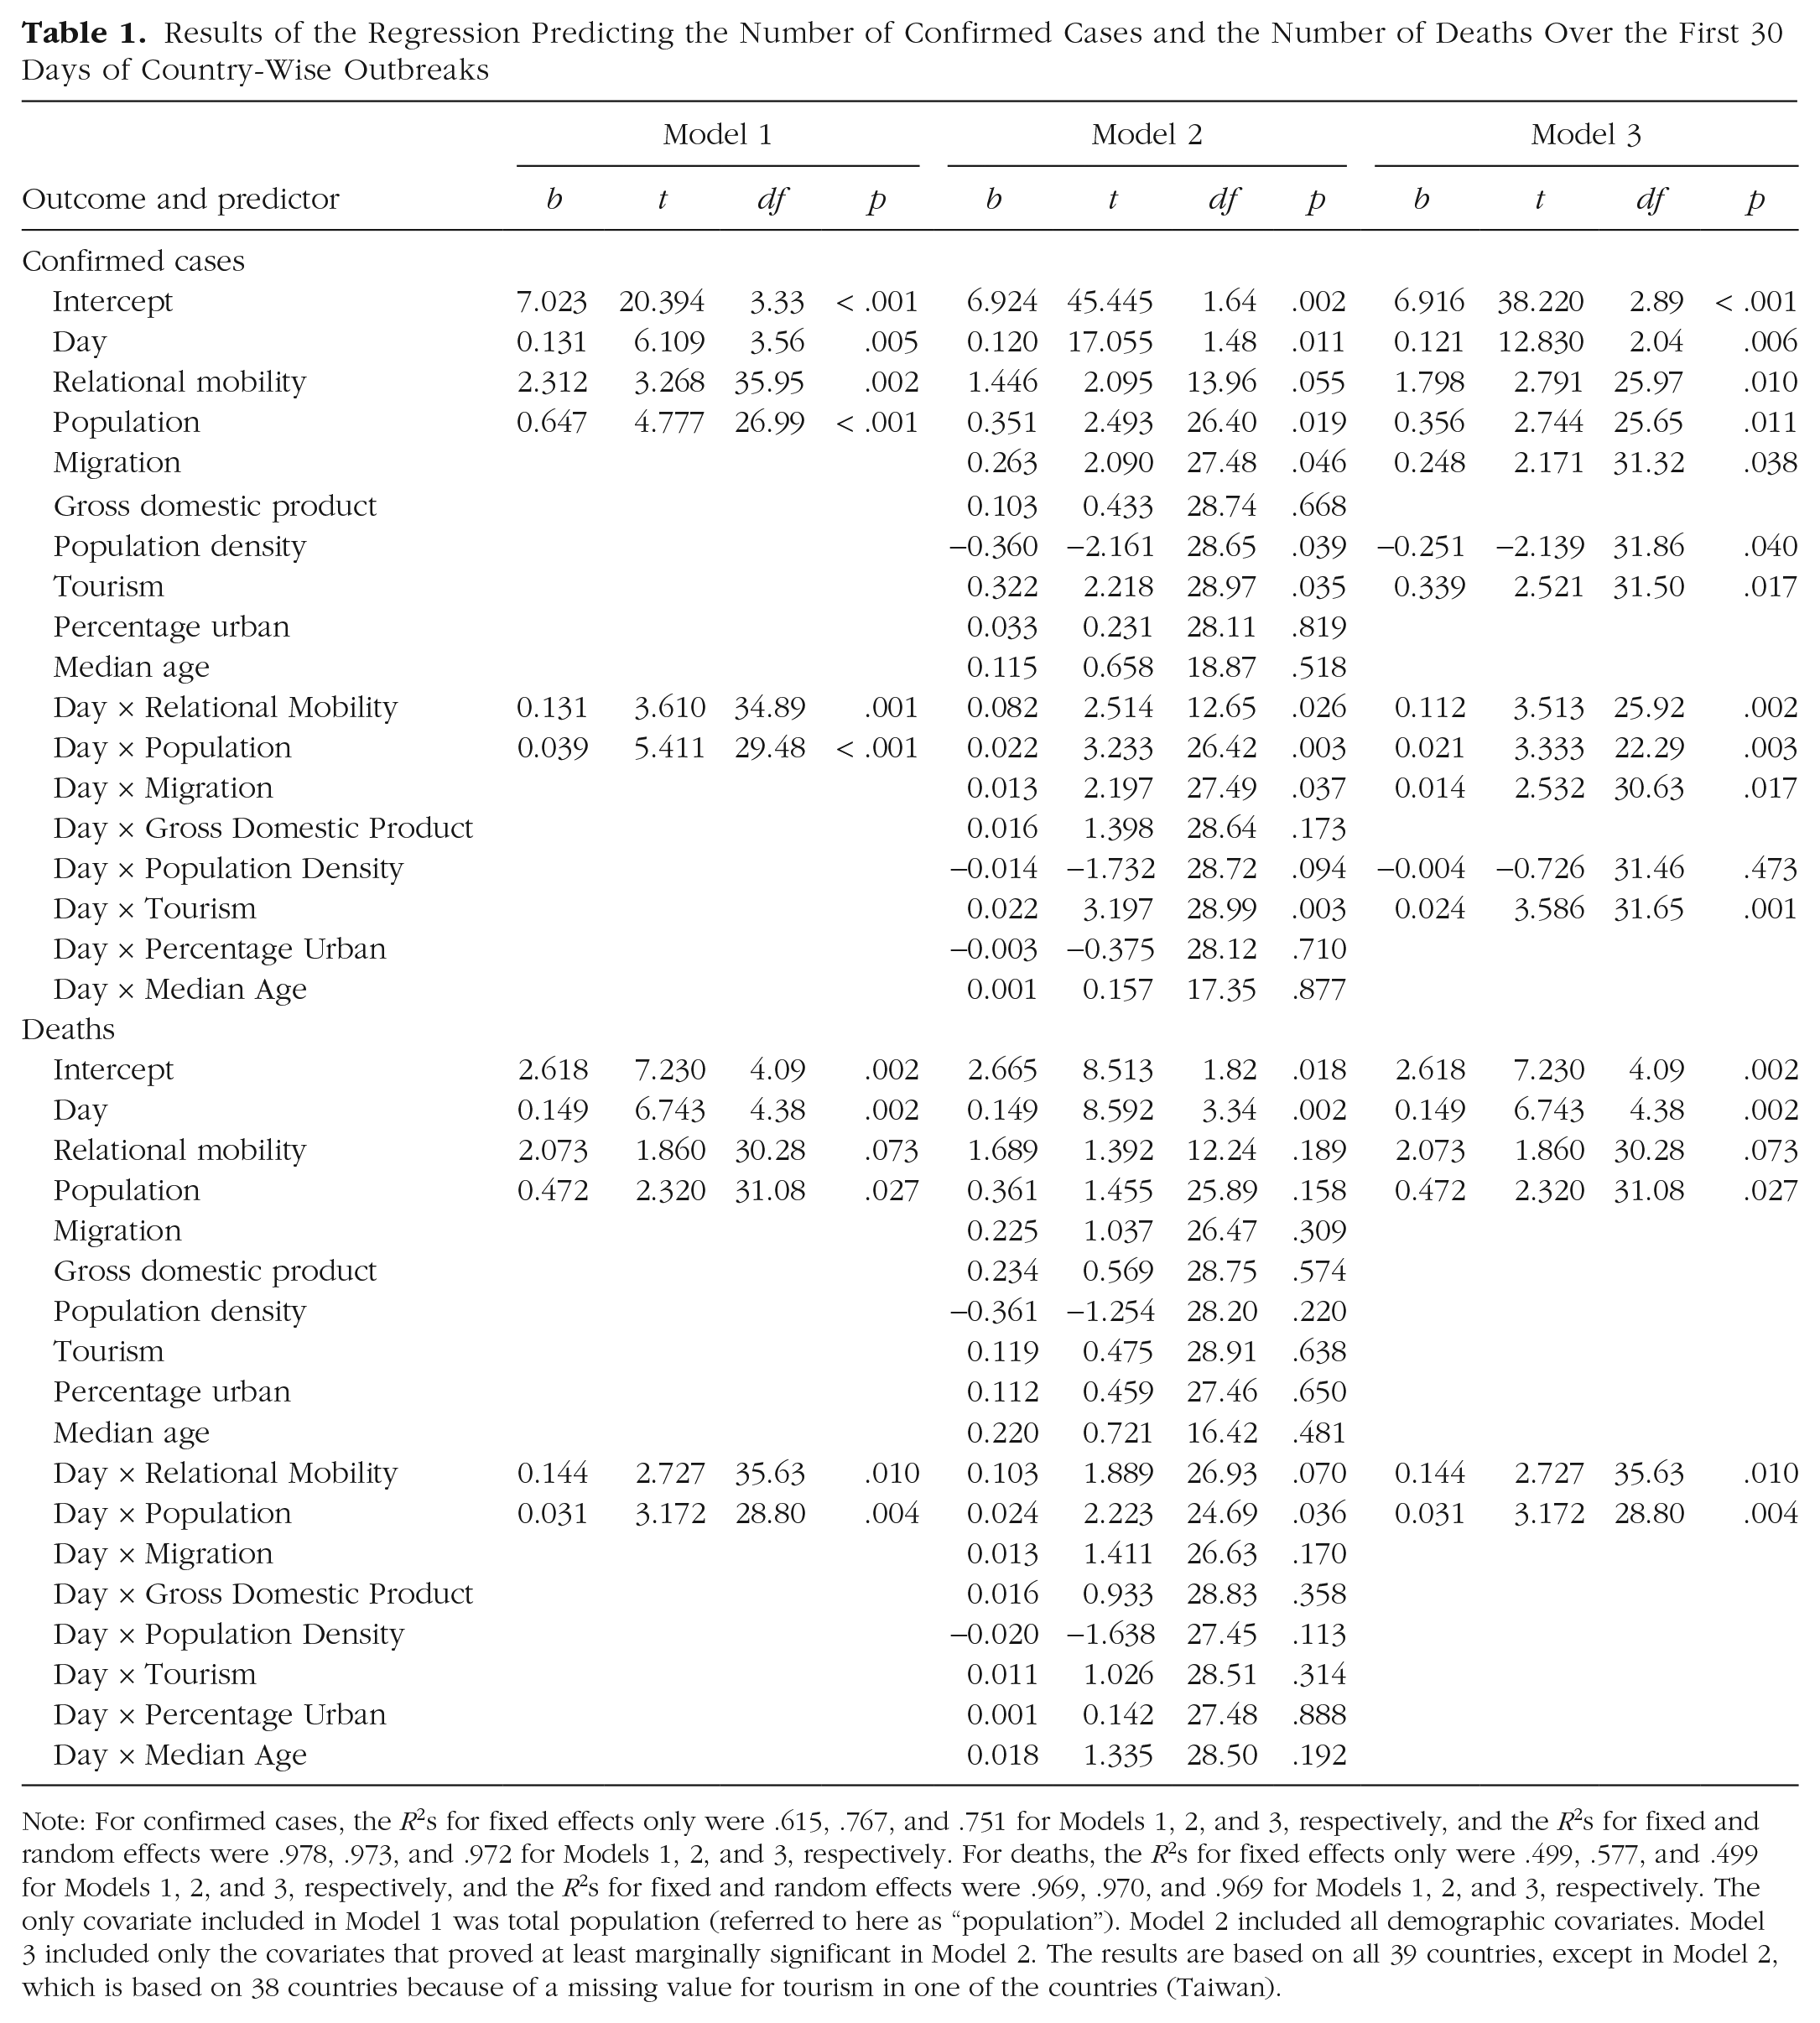
Note: For confirmed cases, the R2s for fixed effects only were .615, .767, and .751 for Models 1, 2, and 3, respectively, and the R2s for fixed and random effects were .978, .973, and .972 for Models 1, 2, and 3, respectively. For deaths, the R2s for fixed effects only were .499, .577, and .499 for Models 1, 2, and 3, respectively, and the R2s for fixed and random effects were .969, .970, and .969 for Models 1, 2, and 3, respectively. The only covariate included in Model 1 was total population (referred to here as “population”). Model 2 included all demographic covariates. Model 3 included only the covariates that proved at least marginally significant in Model 2. The results are based on all 39 countries, except in Model 2, which is based on 38 countries because of a missing value for tourism in one of the countries (Taiwan).
Results
Main analysis
Confirmed cases
Results for confirmed cases are summarized in the top half of Table 1. The main effect of day was significant, b = 0.121, p = .006, showing an increase in COVID-19 cases over time. Importantly, it was qualified by a significant Day × Relational Mobility interaction, b = 0.112, p = .002. Figure 1a shows the growth of confirmed cases in the natural log scale. Countries higher in relational mobility showed a faster growth of confirmed cases over time compared with countries low in relational mobility. The main effect of relational mobility was also significant, b = 1.80, p = .010. This main effect, however, is a necessary consequence of the steeper slope in countries with high relational mobility than in those with low relational mobility. Hence, in and of itself, it does not carry any theoretical significance. The beta coefficients indicating the growth rate are plotted in Figure 1b, which shows that the relationship between the growth rate and relational mobility is robust and unlikely to be due to any outliers. Among the demographic variables, total population (designated below as “population”), migration, and tourism had an impact on the growth rate. Countries with larger populations had a faster rate of the growth of confirmed cases, as indicated by the Day × Population interaction, b = 0.021, p = .003. Moreover, countries with more migration and tourism had a faster rate of the growth of confirmed cases, as indicated by the Day × Migration and Day × Tourism interactions, b = 0.014, p = .017, and b = 0.024, p = .001, respectively. The remaining covariates had no significant effect on the growth rate of confirmed cases.
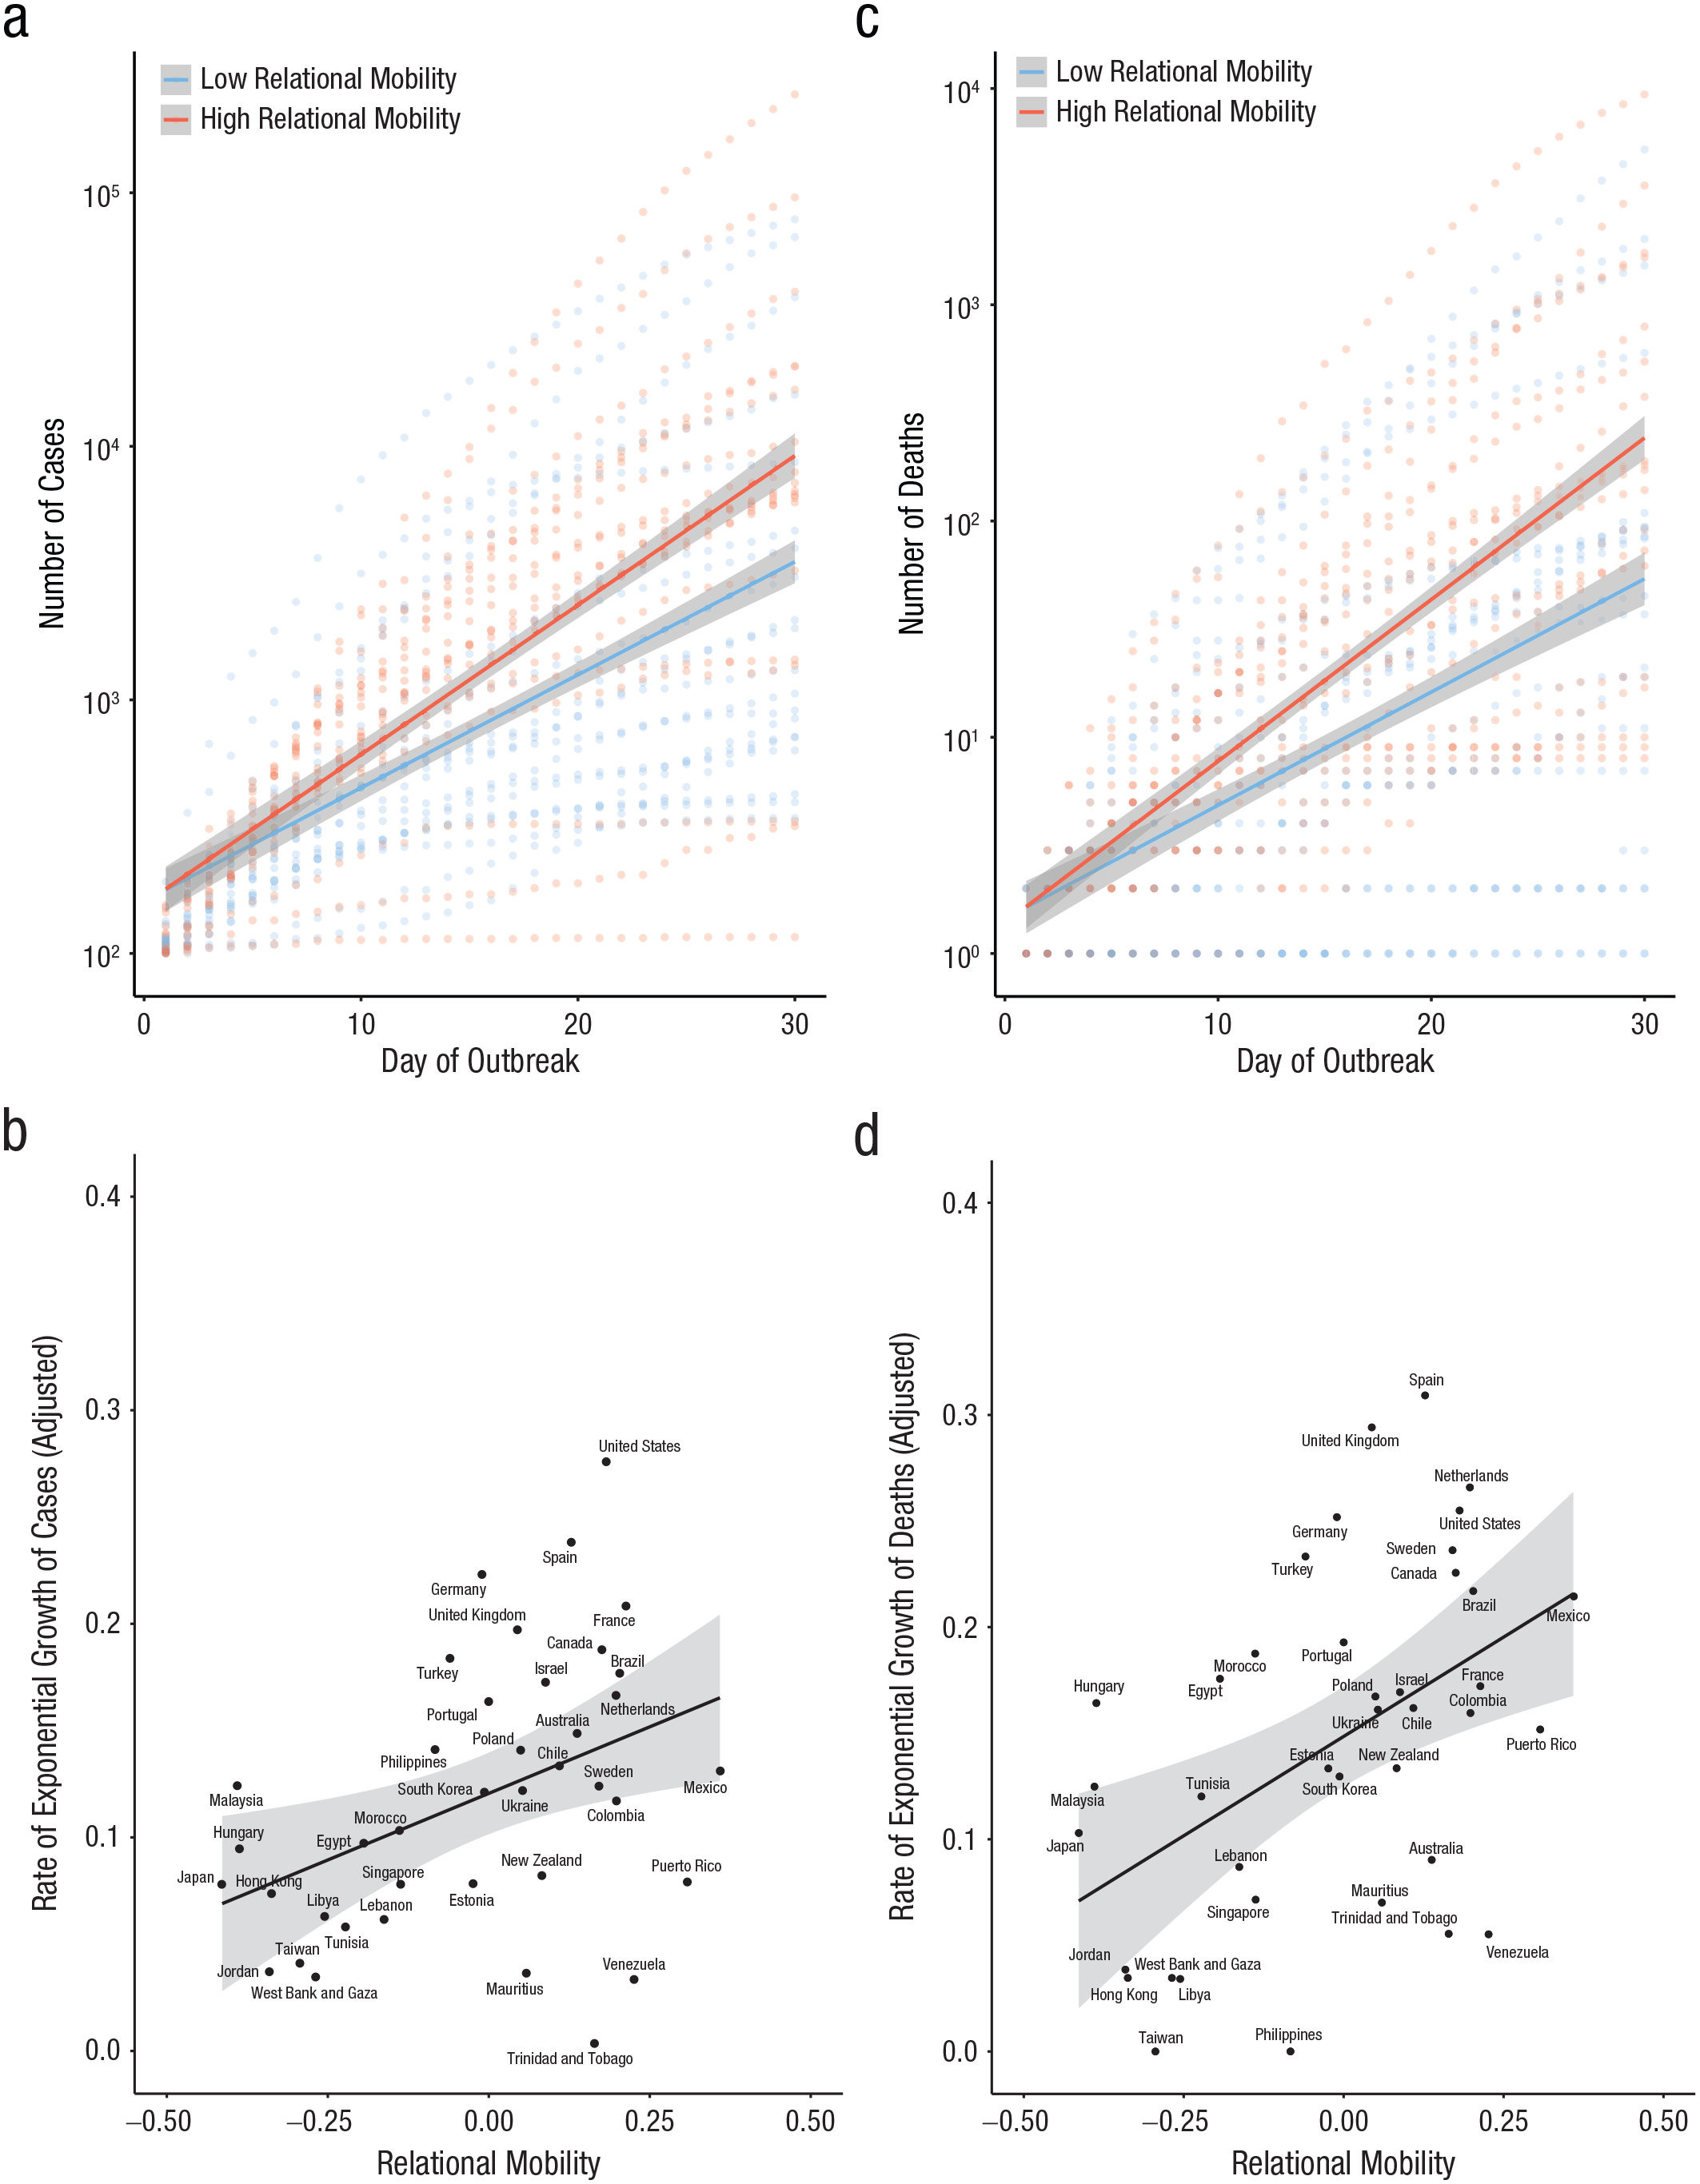
Rate of growth of confirmed cases of and deaths by COVID-19 during the first 30 days of country-wise outbreaks. Growth curves for (a) confirmed cases and (c) deaths are shown on a log scale as a function of day from the beginning of the country-wise outbreak and relation mobility. The solid lines designate the growth estimated for the country 1 SD above (red) and 1 SD below (blue) the grand mean of relational mobility. The dotted lines show day-by-day growth rates for individual countries that are higher (red) and lower (blue) than the grand mean of relational mobility. Country-wise growth rates for (b) confirmed cases and (d) deaths are shown as a function of relational mobility for each country. The black line indicates the best-fitting regression. All shaded regions represent standard errors.
Relational mobility accounted for a sizable amount of variance in the number of confirmed cases. We hypothesize that relational mobility fostered a higher rate of the increase by day (as captured by the Day × Relational Mobility interaction) and, by so doing, increased the number of cases by the end of the study period. Hence, the total amount of variance explained by relational mobility is the sum of the variance explained by the Day × Relational Mobility interaction and the main effect of relational mobility (obtained by subtracting the variance explained by a model including day only from a model including day, relational mobility, and Day × Relational Mobility). This combined variance was 8.4%.
Deaths
Results for deaths are summarized in the bottom half of Table 1. The main effect of day was significant, b = 0.149, p = .002, showing an increase in the number of deaths across time. The Day × Relational Mobility interaction was also significant, b = 0.144, p = .010. Deaths increased over time and were greater for countries high in relational mobility (Fig. 1c). This effect was statistically significant in both Models 1 and 3, although it was marginal in Model 2. As shown in Figure 1d, the effect is not due to any outliers. As in the analysis of confirmed cases, the Day × Population interaction was significant, b = 0.031, p = .004, showing that countries with larger populations had a higher growth rate of deaths. Other demographic variables had no effect. Relational mobility accounted for 7.5% of the variance in the number of deaths.
Analyses controlling for other cultural variables
Individualism
In an analysis performed on 35 of the 39 countries, the Day × Relational Mobility interaction for confirmed cases was significant after controlling for individualism, b = 0.084, p = .010 (Table S2-A in the Supplemental Material). This interaction was marginal for deaths, b = 0.101, p = .063 (Table S2-B in the Supplemental Material).
Government efficiency
In an analysis performed on 34 of the 39 countries, the Day × Relational Mobility interaction remained significant for both confirmed cases and deaths after controlling for government efficiency, b = 0.116, p = .001, and, b = 0.115, p = .032, respectively (see Tables S3-A and S3-B in the Supplemental Material).
Tightness
In an analysis performed on 23 of the 39 countries, the Day × Relational Mobility interaction was significant for confirmed cases, but it was no longer significant for deaths after controlling for tightness, b = 0.100, p = .014, and b = 0.096, p = .113, respectively (Tables S4-A and S4-B in the Supplemental Material). The weaker Day × Relational Mobility interaction may be due to a diminished sample size (n = 23).
BCG
In an analysis performed on 37 of the 39 countries, the Day × Relational Mobility interaction was significant for confirmed cases after controlling for BCG policy status, b = 0.088, p = .004 (Table S5-A in the Supplemental Material). This effect was no longer significant for deaths, b = 0.083, p = .160 (Table S5-B in the Supplemental Material).
Robustness checks
Underreporting of cases
In an analysis performed on confirmed cases on 29 out of the 39 countries, with the Russell et al. (2020) underreporting index as a weighting factor, the Day × Relational Mobility interaction remained significant, b = 0.095, p = .004 (Table S6-A in the Supplemental Material). When the underreporting index was used as an additional covariate, the Day × Relational Mobility interaction remained significant, b = 0.080, p = .025 (Table S6-B in the Supplemental Material).
Testing availability
In an analysis performed on confirmed cases for 29 out of the 39 countries, with the testing-availability index as a weighting factor, the Day × Relational Mobility interaction remained significant, b = 0.085, p = .015 (Table S7-A in the Supplemental Material). When it was used as an additional covariate, the Day × Relational Mobility interaction remained significant, b = 0.076, p = .026 (Table S7-B in the Supplemental Material).
The first 20 cases
In an analysis performed on 39 countries, with the 20 (rather than 100) cases as the cutoff, the Day × Relational Mobility interaction remained significant for confirmed cases, b = 0.131, p = .010 (Table S8 in the Supplemental Material).
The first 15 days of country-wise outbreaks
When the data from the first 15 (rather than the first 30) days were analyzed, the Day × Relational Mobility interaction remained significant for confirmed cases, b = 0.118, p = .031 (Table S9-A in the Supplemental Material). This interaction was no longer significant for deaths, b = 0.135, p = .176, likely because of the reduced amount (one half) of data included in this analysis (Table S9-B in the Supplemental Material).
The first 60 days of country-wise outbreaks
When the data from the first 60 (rather than the first 30) days were analyzed, the Day × Relational Mobility interaction remained significant for confirmed cases, b = 0.039, p = .038 (Table S10-A in the Supplemental Material) and deaths, b = 0.086, p = .001 (Table S10-B in the Supplemental Material).
Interpolation of relational-mobility data with cultural-distance scores
Lastly, we examined whether the same results were present when we increased the number of countries from 39 to 85 by using the interpolated relational-mobility scores for 46 countries for which the relational-mobility scores were unavailable. As shown in Table S11 in the Supplemental Material, the Day × Relational Mobility interaction was significant for both confirmed cases and deaths, b = 0.090, p = .007, and b = 0.113, p = .022, respectively. See Figures S2-A and S2-B for the scatterplots of country-wise growth rates for cases and deaths in this analysis.
Discussion
Our findings show that each country’s social openness (called relational mobility) positively predicted the growth rate of both confirmed cases of and deaths due to COVID-19 during an early period of country-wise outbreaks. The results for cases were robust across a number of analyses that controlled for underreporting, testing availability, demographic variables, and cultural traits such as individualism, tightness, and government efficiency. Although a comparable effect for deaths was less robust when the inclusion of covariates necessitated a reduction of the number of countries that could be included, it was significant in the main analysis that included all the 39 countries. The relational-mobility effect was sizable. Relational mobility accounted for approximately 8% of variance for both cases and deaths. To illustrate, the United States is among the highest countries in relational mobility. If it had been low in relational mobility, comparable with Japan (one of the lowest countries in relational mobility), the deaths at the end of the 30-day study period would have been 8.2% (281) of the actual number reported (3,417).
The COVID-19 pandemic has proven extremely difficult to contain. Without any vaccines available, the only viable defense against the virus is to keep sufficient physical distance from other people, particularly strangers. Our data suggest that this practice of social distancing could prove indispensable in countries high in relational mobility. In such countries, individuals might seek new friends and acquaintances outside of their primary groups (Thomson et al., 2018), they might be more outgoing (Kim, Schimmack, Oishi, & Tsutsui, 2018), and they might not easily suppress emotions in face-to-face encounters (Kraus & Kitayama, 2019). These psychological propensities could make social ecologies particularly vulnerable to infectious disease.
Some limitations must be noted. First, we focused only on an early period of outbreaks to minimize various confounds. Second, country is admittedly a crude unit of analysis. Third, our sample size was limited by the availability of relational-mobility scores. Nevertheless, our data are the first to show a substantial effect of sociocultural ecologies on the peril of infectious disease.
In closing, because relational mobility is an important expression of the values of independence, egalitarianism, and freedom of movement and choice (Inglehart & Baker, 2000; Markus & Kitayama, 1991), the present findings may pose a fundamental challenge to all countries aspiring to promote these values. Expertise in the social and behavioral sciences (Van Bavel et al., 2020) may therefore be strongly called for to devise strategies to fight against infectious disease without compromising the core values of democracy.
Supplemental Material
Salvador_Figures_S1_and_S2 – Supplemental material for Relational Mobility Predicts Faster Spread of COVID-19: A 39-Country Study
Supplemental material, Salvador_Figures_S1_and_S2 for Relational Mobility Predicts Faster Spread of COVID-19: A 39-Country Study by Cristina E. Salvador, Martha K. Berg, Qinggang Yu, Alvaro San Martin and Shinobu Kitayama in Psychological Science
Supplemental Material
Salvador_PSCIOpenPracticesDisclosure_v5.1_CS – Supplemental material for Relational Mobility Predicts Faster Spread of COVID-19: A 39-Country Study
Supplemental material, Salvador_PSCIOpenPracticesDisclosure_v5.1_CS for Relational Mobility Predicts Faster Spread of COVID-19: A 39-Country Study by Cristina E. Salvador, Martha K. Berg, Qinggang Yu, Alvaro San Martin and Shinobu Kitayama in Psychological Science
Supplemental Material
Salvador_Tables_S1-S11 – Supplemental material for Relational Mobility Predicts Faster Spread of COVID-19: A 39-Country Study
Supplemental material, Salvador_Tables_S1-S11 for Relational Mobility Predicts Faster Spread of COVID-19: A 39-Country Study by Cristina E. Salvador, Martha K. Berg, Qinggang Yu, Alvaro San Martin and Shinobu Kitayama in Psychological Science
Footnotes
Transparency
Action Editor: Karen Rodrigue
Editor: Patricia J. Bauer
Author Contributions
All authors conceived and designed the study. C. E. Salvador, M. K. Berg, and Q. Yu carried out the statistical analysis. C. E. Salvador and S. Kitayama drafted the manuscript, and M. K. Berg, Q. Yu, and A. San Martin provided critical revisions. All of the authors approved the final version of the manuscript for submission.
References
Supplementary Material
Please find the following supplemental material available below.
For Open Access articles published under a Creative Commons License, all supplemental material carries the same license as the article it is associated with.
For non-Open Access articles published, all supplemental material carries a non-exclusive license, and permission requests for re-use of supplemental material or any part of supplemental material shall be sent directly to the copyright owner as specified in the copyright notice associated with the article.