
Abstract
As children age, they can learn increasingly complex features of environmental structure—a key prerequisite for adaptive decision-making. Yet when we tested children (N = 304, 4–13 years old) in the Children’s Gambling Task, an age-appropriate variant of the Iowa Gambling Task, we found that age was negatively associated with performance. However, this paradoxical effect of age was found only in children who exhibited a maladaptive deplete-replenish bias, a tendency to shift choices after positive outcomes and repeat choices after negative outcomes. We found that this bias results from sensitivity to incidental nonrandom structure in the canonical, deterministic forms of these tasks—and that it would actually lead to optimal outcomes if the tasks were not deterministic. Our results illustrate that changes in decision-making across early childhood reflect, in part, increasing sensitivity to environmental structure.
Children, as they age, become increasingly competent at recognizing structure in their environment and adapting decision-making strategies accordingly (Nussenbaum & Hartley, 2019; Raab & Hartley, 2018). Such competence is a prerequisite for adaptive decision-making—selecting actions or options that reliably lead to preferred outcomes and avoiding actions or options that lead to unwanted outcomes (Daw & O’Doherty, 2014; Glimcher, 2014). Here, we identified a surprising condition under which older children perform more poorly than younger children on a common test of decision-making: when they maintain a false belief about the structure of the environment. We also found that this false belief reflects sensitivity to incidental environmental structure and that performance is negatively associated with age only among children who learn this structure.
Researchers use sequential-choice tasks to investigate how children learn the associative structures required for adaptive decision-making and how these processes change with age (da Mata et al., 2011; Nussenbaum & Hartley, 2019). Broadly, participants in these tasks choose between multiple available actions and learn to select optimal actions on the basis of feedback. For example, participants may repeatedly choose among several slot machines or decks of cards that have different reward and probability contingencies. The most impactful sequential-choice paradigm in psychology and neuroscience has been the Iowa Gambling Task (IGT; Bechara et al., 1994), along with its variants for other populations such as the Children’s Gambling Task (CGT; Kerr & Zelazo, 2004). In both gambling tasks—the IGT and the CGT—participants receive an initial endowment and then make choices between decks of cards, attempting to maximize utility by selecting decks that typically result in desirable outcomes. The IGT and CGT have been used extensively to study development of decision-making processes over childhood through young adulthood (Beitz et al., 2014; Crone & van der Molen, 2004; da Mata et al., 2011; Garon, 2016; Garon & Moore, 2004; Mata et al., 2011; Prencipe et al., 2011; Smith et al., 2012) as well as decision-making in a wide variety of populations including individuals with autism spectrum disorder (Zeif & Yechiam, 2020), schizophrenia (Betz et al., 2019), obesity (Rotge et al., 2017), alcohol use disorder (Kovács et al., 2017), gambling disorder (Kovács et al., 2017), Parkinson’s disease (Evens et al., 2016), and bipolar disorder (Edge et al., 2013).
Both the CGT and IGT assess how participants learn distributions of outcomes that differ in gains and losses. Each task contains advantageous decks with small wins, small losses, and a positive overall expected value as well as disadvantageous decks with large wins, large losses, and a negative overall expected value. Both tasks were designed to determine whether individuals could learn the higher expected value of the advantageous decks despite the appeal of the larger wins in the disadvantageous decks. In the original studies using this task, patients with lesions in their ventromedial prefrontal cortex continued to choose the disadvantageous decks over the course of the task, despite large losses, at significantly higher rates than healthy control participants (Bechara et al., 1994). Thus, the convention for what has been (historically) deemed an advantageous choice as opposed to a disadvantageous choice follows from these original clinical findings and the difference in expected value between the decks; however, risk-seeking individuals could prefer the higher variance of the disadvantageous decks. In our study, a large sample of children (N = 304, 4–13 years old) completed the CGT; we found that older children were more likely to make maladaptive decisions. To determine why age was negatively associated with performance, we first examined the structure of the experimental environment and then assessed how different decision strategies corresponded to age and overall performance.
An optimal learner on the CGT—someone who perfectly tracks the difference in expected value and always chooses the deck with the higher expected value—would quickly identify the advantageous deck, select it consistently regardless of the outcome, and on average more than triple their initial endowment. However, it is well established that participants exhibit decision biases that are nonoptimal on sequential-choice tasks such as this one (Chiu & Lin, 2007; Fellows & Farah, 2005; Steingroever, Wetzels, Horstmann, et al., 2013; Worthy et al., 2013). One of the most commonly evoked biases is the tendency to repeat choices following a good outcome but to change choices following a bad outcome; at its limiting case, this bias generates a win-stay-lose-shift choice pattern. We hereafter refer to this as abundance bias, the belief that a good outcome signals an abundance of good future outcomes (and that a bad outcome signals a scarcity of good future outcomes). This bias is analogous to that seen in foraging behavior: For example, bees determine whether to continue probing flowers on a plant or to shift to another plant on the basis of the amount of nectar found in the first flower they visit (Hodges, 1985). In this research, we replicated prior work demonstrating that a subset of participants did not exhibit any meaningful bias in decision-making, whereas a second subset expressed an abundance bias.
Statement of Relevance
Psychological scientists use experimental measures to examine how individuals differ in their cognitive function or cognitive development. Some of the most common measures for understanding variation in risky decision making are the Iowa Gambling Task and its age-appropriate alternative, the Children’s Gambling Task. Among young children, researchers expect to see performance on these tasks improve with age. On the contrary, our findings showed that older children performed worse—but not because they failed to learn the task structure. Instead, a subgroup of children identified hidden nonrandom structure in the game, leading to sophisticated patterns of decision-making. Our study provides insights into the decision-making competences of young children and provides important caveats for interpretations of behavior elicited via some of the most widely used experimental paradigms in psychology and neuroscience.
However, we also observed a large subset of children who exhibited an ostensibly maladaptive choice bias—hereafter labeled deplete-replenish bias. They were more likely to repeat choices following a bad outcome but to change choices following a good outcome. Deplete-replenish bias can also be seen in natural settings; for example, hummingbirds return to flowers where they had previously found nectar only after that flower has had adequate time to replenish its nectar supply (Healy & Hurly, 1995). We show, however, that this bias does not arise from a pathological tendency to minimize rewards; rather, it represents an optimal strategy based on a false assumption that outcomes are determined probabilistically. Unbeknownst to participants, the outcomes of their choices in the canonical CGT (like the IGT) always occur in the same predetermined sequence (Bechara et al., 1994; Kerr & Zelazo, 2004)—and that sequence alternates excessively between wins and losses. In a truly probabilistic task, the existence of this alternating pattern would indicate that good outcomes can be depleted and then replenished after one trial. We found through simulations that although deplete-replenish bias appears maladaptive on the CGT, it would represent an optimal response if those outcomes were truly probabilistic. We also found that age is negatively associated with performance only among children who learn this structure and maintain this false belief. These results indicate that both age and beliefs about the structure of the environment shape children’s ability to make adaptive choices.
Method
Study sample
Study participants were part of the Newborn Epigenetics Study (NEST), a longitudinal cohort assembled to examine the effects of prenatal and early childhood exposures on epigenetic and developmental outcomes. Enrollment procedures have been described elsewhere (Hoyo et al., 2011; Liu et al., 2012). Pregnant women were recruited from prenatal clinics within a university health system from April 2005 to June 2011. Children were eligible for the present follow-up study if their mother had been enrolled in NEST, they had been the product of a singleton birth, and they were at least 4 years old (Dozmorov et al., 2018).
The current analyses included 304 children (child age: M = 7.43 years, SD = 1.95, range = 4–13; 52% female; 62.5% African American, 30.9% Caucasian, 1.3% Asian, and 4.9% identified as being more than one race). Mothers who had participated in NEST were contacted by study staff and informed of their child’s eligibility for the follow-up study. All children who completed the follow-up study were included in the analysis. Study visits were conducted at a clinical research lab embedded within a university medical center. Mothers were informed of the study procedures and signed a consent form. All children provided verbal assent; children age 12 years and older also provided written assent. Mothers completed surveys via Research Electronic Data Capture (REDCap; Harris et al., 2009, 2019) regarding demographic characteristics, and children participated in a laboratory-based decision-making task. The NEST study, the follow-up study, and all procedures were approved by the Duke University Medical Center Institutional Review Board.
Experimental procedure
The materials and experimental procedure (Fig. 1) were adapted from the work by Kerr and Zelazo (2004). Alongside a trained research assistant, participants sat down at a table and were presented with a set of face-down laminated cards, a bowl of M&M’s Minis, and a 10-mL graduated cylinder with an initial endowment of 10 M&M’s already inside. The set of cards contained two decks: One deck was backed with black and white stripes; the second deck was backed with black dots on a white background. Participants were instructed to make 50 choices between the two decks of cards; the research assistant added or removed M&M’s from the cylinder on the basis of the outcomes of the cards. At the end of the task, the participants got to eat or take home all M&M’s remaining in the cylinder. To demonstrate the impact of wins and losses, the research assistant first showed participants three examples from each deck of cards.
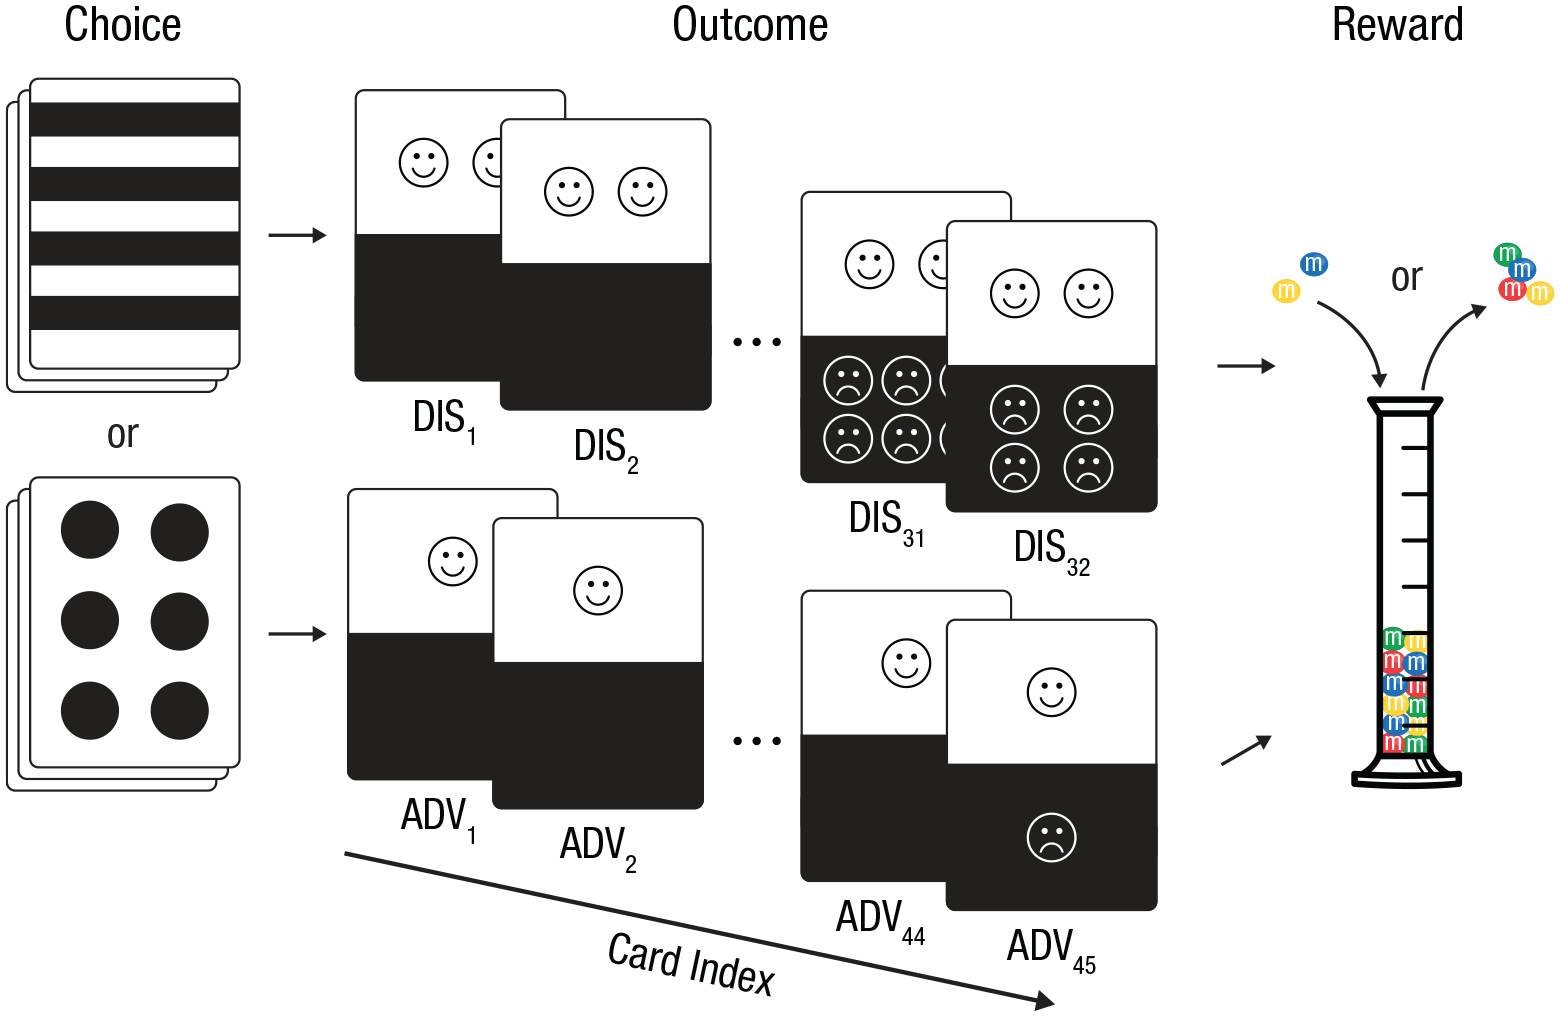
Illustration of the Children’s Gambling Task. During the Children’s Gambling Task, kids choose between two decks of cards. The deck is either advantageous (ADV) or disadvantageous (DIS). In the advantageous deck, the set of possible net outcomes (faces on the top half of the card – faces on the bottom half of the card) includes +1 (win) and 0 (loss). In the disadvantageous deck, the set of possible net outcomes includes +2 (win), –2 (loss), –3 (loss), and –4 (loss). The cards in each deck are always presented in the same order; this means that wins and losses always occur in the same order within each deck. Participants see three examples from each deck (Cards 1–3) and then make 50 choices. Participants win or lose M&M’s Minis on the basis of the net outcome of the card that they choose.
Decks of cards: advantageous versus disadvantageous
Each set of cards contained one deck of cards with advantageous outcomes and one deck of cards with disadvantageous outcomes. The identity of the deck (stripes vs. dots) was randomly assigned to advantageous outcomes or disadvantageous outcomes. The decks were named according to their expected values: .5 for the advantageous deck and −.5 for the disadvantageous deck. Each deck contained 50 cards with 25 wins and 25 losses. For the advantageous deck, there were 25 cards with a net outcome of +1 and 25 cards with a net outcome of 0; for the disadvantageous deck, there were 25 cards with a net outcome of +2, 10 with a net outcome of −2, five with a net outcome of −3, and 10 with a net outcome of −4. Consistent with canonical versions of this task, the order of cards within each deck was fixed such that card n in each deck (i.e., the card index) was the same for every participant. For example, when participants saw the three examples from each deck, they all saw advantageous outcomes +1, +1, 0 and disadvantageous outcomes +2, +2, –2.
Results
Age is negatively associated with canonical measures of task performance
We first examined how well children learned the differential expected value of the decks using canonical performance metrics. We fitted a mixed-effects logistic regression to determine the probability that participants would choose the advantageous deck as a function of trial and age. The significant main effect of trial showed that the children successfully learned to choose the advantageous deck over time; however, there was also a significant negative interaction between age and trial (see Table S1 in the Supplemental Material available online). This result indicated that age was negatively associated with learning (Fig. 2). Given the paradoxical behavior of older children, we sought to understand why older children were more likely to make suboptimal choices. To do this, we first examined the features of the task structure and then assessed heterogeneity in decision strategies across age.
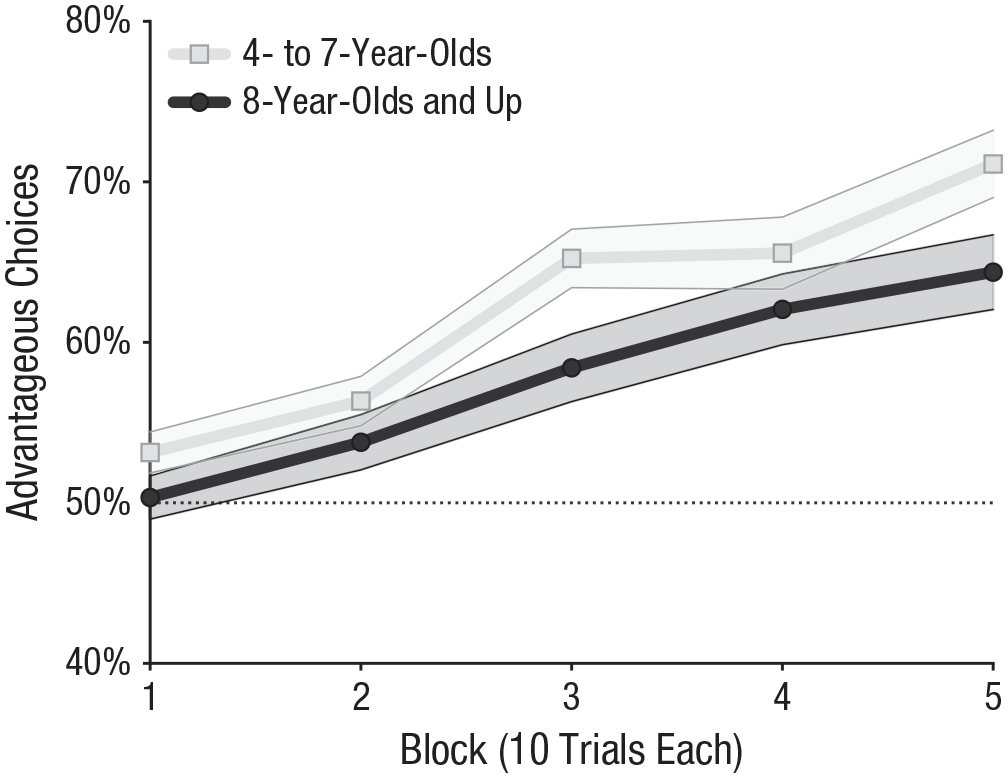
Percentage of choices of the advantageous deck in each block, separately for older and younger children. Participants were split into groups on the basis of the median age of the entire sample. Points are group means, and shading represents standard errors. The dotted line indicates chance responding.
The sequence of CGT outcomes has incidental nonrandom structure
We first examined the structure of the CGT, which shares a fixed card order with the IGT. Because of that fixed order, the probability of any one outcome in the task is conditional on a participant’s choices. This means that the decks of cards are nonuniformly and differentially sampled; less than 10% of participants sampled the last five cards in the advantageous deck (Cards 46–50), whereas less than 10% of participants sampled the last 18 cards in the disadvantageous deck (Cards 33–50; Fig. 3a). Accordingly, our analyses focused on the sets of cards seen by at least 10% of participants: Cards 1–45 in the advantageous deck and Cards 1–32 in the disadvantageous deck. Note that both the advantageous and disadvantageous decks begin with an identical pattern of outcomes (i.e., good, good, bad, good, bad, good . . .) that overrepresents alternations compared with repetitions (Fig. 3b). The excess alternations between wins and losses in these decks (Fig. 3c) provide strong evidence that the alternating pattern is an intentional feature of the decks. For example, after seeing the first six cards in each deck, the probability of that many alternations in a random deck is just 3.1%; thus, the assumption that a deck beginning with that sequence has nonrandom structure is both well justified and validated by the following sequence of cards.

The sequence of Children’s Gambling Task outcomes. The percentage of participants who chose each card in the deck (i.e., the card index) is shown in (a), separately for the advantageous and disadvantageous decks. Our analyses focused on the sets of cards chosen by at least 10% of participants: Cards 1 to 45 in the advantageous deck and Cards 1 to 32 in the disadvantageous deck. Cards that were chosen by fewer than 10% of participants (below the dotted line) were not included in the analyses. The pattern of wins and losses in the advantageous and disadvantageous decks is shown in (b). This pattern was identical in both decks through the first 12 cards. The cumulative number of alternations between wins and losses in each deck relative to chance is shown in (c), given by Card 1 . . . card n. The number of alternations in each deck is laid over a binomial distribution
Hereafter, we separate two forms of structure in the decks of cards that can be learned and acted on. The first is the intended structure—the advantageous deck has a higher expected value (.5) despite offering only small wins (+1); the disadvantageous deck has a lower expected value (–.5) despite offering large wins (+2). The second is the incidental nonrandom structure—both the advantageous and disadvantageous decks have a very high number of alternations between wins and losses; thus, one outcome is predictive of the opposite outcome on the next card.
Participants learn the incidental alternating structure in the decks
To determine whether participants were sensitive to the incidental alternating structure in the decks, we first defined a logistic regression model predicting switching between decks:
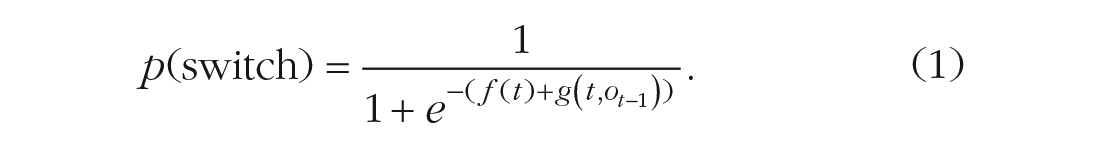
The function f(t), where t is the trial number, is defined as follows:
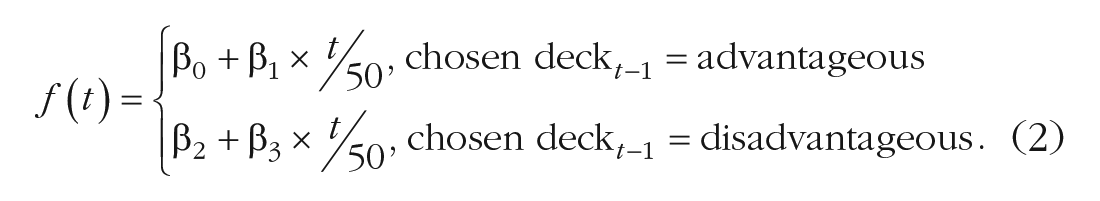
The function

where
We then fitted Equation 1 in two separate ways. First, we fitted the logistic regression assuming that participants would exhibit only choice patterns shown in previous work (Chiu & Lin, 2007; Fellows & Farah, 2005; Steingroever, Wetzels, Horstmann, et al., 2013; Worthy et al., 2013); this includes abundance bias and no bias at all. To do this, we bounded the values of the free parameters from Equation 3, b4 and b5 between –100 and 0. Thus, following a win, Equation 3 could be less than or equal to 0, decreasing the model estimate of switching; following a loss, Equation 3 could be greater than or equal to 0, increasing the model estimate of switching. Second, we fitted the same logistic regression assuming that participants could exhibit abundance bias or deplete-replenish bias. To do this, we centered the bounds of the free parameters in Equation 3 (β4 and β5) over zero, so they were both bounded between –50 and 50. Thus, Equation 3 could be inverted relative to abundance bias; in this case, a win would increase the model estimate of switching (Equation 3 would be greater than or equal to 0), and a loss would decrease the model estimate of switching (Equation 3 would be less than or equal to 0). This allowed the model to capture deplete-replenish bias in addition to abundance bias. We then compared the overall model fit, using each optimization strategy, to determine whether a subset of participants’ choices showed deplete-replenish bias in addition to abundance bias. We compared each of these two models with a null model that guesses on every trial, that is,
Next, we used the model optimized for both biases to estimate each participant’s bias on each deck. For each participant, we estimated their mean bias over the course of the task, using the following formula:

where
These groups corresponded to distinct patterns visible in choice behavior (Fig. 4). Individuals in the no-bias group (Fig. 4, gray line) switched away from the advantageous deck less over time and switched away from the disadvantageous deck at a rate above chance; these patterns indicate that they were learning and exploiting the intended structure of the decks. Individuals in the deplete-replenish-bias group (Figs. 4a and 4b) were more likely to stay after losses and switch after wins than the no-bias group; that is, their choices were sensitive to the incidental nonrandom structure of the task. Individuals in the abundance-bias group (Figs. 4c and 4d) were more likely to stay after wins and switch after losses, relative to the no-bias group. Individuals categorized in the abundance-bias group but with relatively low Θ values—and thus relatively weak abundance bias—switched after losses at the same rate as the no-bias group (see Fig. S2 in the Supplemental Material). These results are consistent with the interpretation that children in the abundance-bias group formed the false belief that a win signals a higher probability of future wins than a loss does, a belief inconsistent with the structure of the CGT.

Choice behavior. The top row shows the percentage of participants in the deplete-replenish-bias group (low Θ; n = 90) who switched away from the advantageous deck (a) or disadvantageous deck (b) after choosing each card, relative to the no-bias group (medium Θ; n = 136). The bottom row shows the percentage of participants in the abundance-bias group (high Θ; n = 78) who switched away from the advantageous deck (c) or disadvantageous deck (d) after choosing each card, relative to the no-bias group. The length of each colored bar indicates the distance between the percentage in the bias group and the percentage in the no-bias group for each choice. Darker colors indicate choices suggesting deplete-replenish bias, and lighter colors indicate choices suggesting abundance bias. In all graphs, a star above the gray line indicates that more participants in the bias group (relative to the no-bias group) switched to the other deck following the win on that card, whereas a star below the gray line indicates that more participants stayed with the same deck. An × indicates a loss on that card, and the position of the × above or below the line indicates that more participants switched or stayed, respectively, relative to the no-bias group. In all graphs, the x-axis starts at 4 because all participants were shown the first three cards as examples; it ends at Card 30 for the advantageous deck or Card 25 for the disadvantageous deck so that at least 25 participants are represented in each point. Participants were binned into groups using Equation 4. Error bars show standard errors. The dotted line shows chance responding.
Deplete-replenish bias is an optimal response to the incidental alternating structure
Deplete-replenish bias indicates that participants were learning the incidental alternating structure; however, because of the fixed order of outcomes on the CGT, this bias appears maladaptive. As an illustration, consider deplete-replenish bias at its limiting case, which predicts a win-shift-lose-stay choice pattern. Given that the probability of winning on both decks is 50%, a person exhibiting the maximal deplete-replenish bias on the CGT would choose the advantageous deck exactly 24 times and lose 70% of their initial endowment. On the CGT, deplete-replenish bias and abundance bias are opposite and equally nonoptimal choice patterns.
Whereas the outcomes on the CGT were predetermined, the task was designed to mimic the uncertainty of real-life decision-making by making outcomes unpredictable (Bechara et al., 1994, 1997). Thus, we assumed that participants would treat outcomes on the CGT and IGT as probabilistic; they had no reason to believe that the outcomes were predetermined and had no way of knowing that fact. Thus, we hypothesized that deplete-replenish bias represented an optimal response to the incidental alternating structure if outcomes were probabilistic instead of deterministic. In other words, participants who extracted the incidental alternating structure may have formed the (incorrect) belief that they were playing a probabilistic task that had a pattern of alternating wins and losses.
To test that hypothesis, we ran a series of four simulations (see Simulations in the Supplemental Material). In each of the four simulations, we calculated how much participants would earn if they exhibited maximal deplete-replenish bias (i.e., win-shift-lose-stay) versus maximal abundance bias (i.e., win-stay-lose-shift). As a reference point, we compared these biases with optimal learning of the differential expected value of each deck (i.e., always choosing the deck with the higher observed expected value). In each of the four simulations, we calculated performance of each strategy on a version of the CGT. For Simulation 1, we used the standard CGT. For Simulations 2 to 4, we used a version of the CGT that contained the intended structure but had probabilistically determined outcomes. Each simulation represents a possible belief that a participant could have about the structure of the game. For Simulation 2, outcomes did not contain the incidental alternating structure. This represents a failure to learn or act on the alternating pattern between wins and losses. For Simulation 3, the probabilistic outcomes alternated jointly across both decks between wins and losses. This represents a belief that winning predicts an increased chance of losing on the next trial (or vice versa), regardless of a person’s choice. For Simulation 4, the probabilistic outcomes alternated independently within each deck between wins and losses. This represents a belief that winning predicts an increased chance of losing on the next trial (or vice versa) if a person repeats their choice.
Our simulations show that in Simulations 1 to 3, maximal abundance bias and maximal deplete-replenish bias perform equally poorly relative to the perfect learner. However, in Simulation 4, maximal deplete-replenish bias performs as well as the perfect learner and significantly better than maximal abundance bias (Fig. 5). This means that if a participant believed that they were playing a probabilistic task in which the decks alternated independently between wins and losses, maximal deplete-replenish bias would optimize outcomes on the task without learning any information about the differential expected value of the decks of cards. This indicates that although deplete-replenish bias appears maladaptive on the CGT, it represents an optimal response to observed outcomes given the false belief that those outcomes were probabilistic.

Estimated earnings given maximal abundance bias and maximal deplete-replenish bias across four simulations. As a reference point, the graph also shows perfect learning of the differential expected value of each deck (i.e., always choosing the deck with the higher observed expected value). For Simulation 1, we used the standard Children’s Gambling Task (CGT). For Simulations 2 to 4, we used a version of the CGT that contained the intended structure but had probabilistically determined outcomes. Each simulation differs in the way in which decks alternated between wins and losses. For Simulation 2, outcomes did not contain the incidental alternating structure. For Simulation 3, the probabilistic outcomes alternated jointly between wins and losses. For Simulation 4, the probabilistic outcomes alternated independently within each deck between wins and losses (see Simulations in the Supplemental Material available online). Points are the mean earnings across 1,000 simulations, and error bars represent ±1 SD of the mean estimate.
Age is negatively associated with performance only in the deplete-replenish-bias group
Given that deplete-replenish bias and abundance bias are both nonoptimal on the CGT, we hypothesized that older children would perform worse on the task because they were more likely to exhibit either bias. However, the age distribution of each group did not differ: median age = 8.1 for the deplete-replenish-bias group, 7.9 for the no-bias group, and 7.7 for the abundance-bias group, Kruskal-Wallis χ2(2, N = 304) = 0.81, p = .67. Next, we assessed the relationship between Θ group, age, and canonical performance metrics (Fig. 6). Within the deplete-replenish-bias group, age was negatively associated with learning. When we modeled learning for all other children (no-bias and abundance-bias groups), age was no longer negatively associated with learning (see Table S2 in the Supplemental Material). To determine whether this relationship within the deplete-replenish-bias group was attributable to the extent to which children exhibited deplete-replenish bias, we assessed the relationship between age and Θ. Within the deplete-replenish-bias group, age was not associated with Θ, Spearman’s r(88) = −0.10, p = .36.
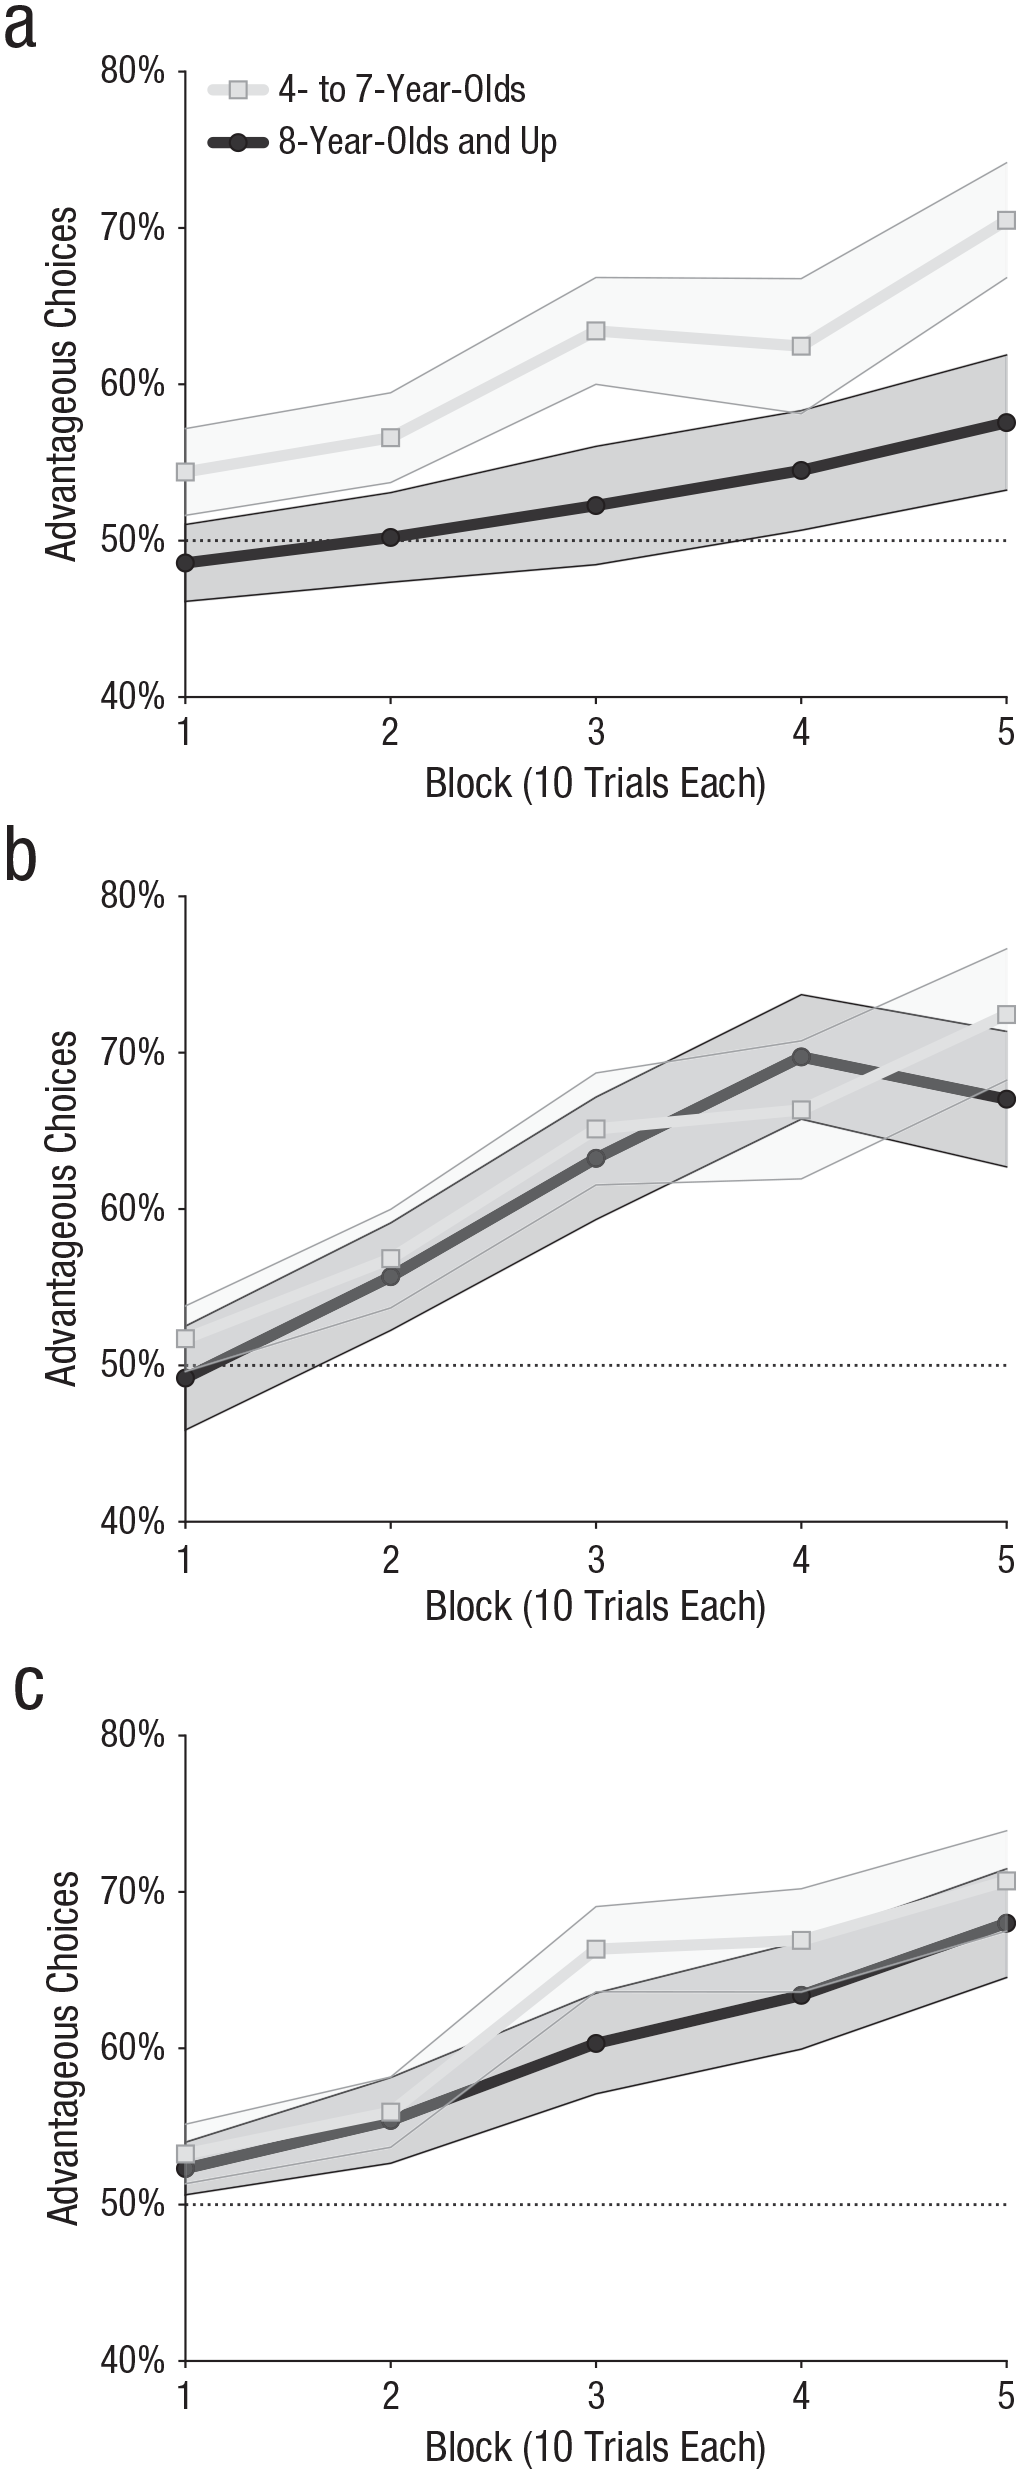
Percentage of choices of the advantageous deck in the deplete-replenish-bias group (a), abundance-bias group (b), and no-bias group (c) in each block, separately for older and younger children. Participants were split into groups on the basis of the median age of the entire sample. Points are group means, and shading represents standard errors. The dotted lines indicate chance responding.
Discussion
We found that younger children outperformed older children on canonical metrics of learning on the CGT. However, the fixed card order in the CGT (a feature shared with the IGT) introduced incidental nonrandom structure (excessive alternations between wins and losses) that was learned by children and affected performance. Their resulting choice pattern, here labeled deplete-replenish bias, was characterized by repeating choices that lost and shifting away from choices that won. We then demonstrated through simulations that this bias, although leading to poor performance on the CGT, would represent an optimal response to the incidental alternating structure given the false belief that task outcomes are probabilistic. The existence of deplete-replenish bias indicates that a subset of participants was learning and making choices using mechanisms previously undescribed in the CGT or IGT; these mechanisms, although maladaptive on the CGT and IGT, represent an adaptive response in more ecologically valid circumstances. Finally, we found that age was negatively associated with performance only among children who learned the incidental alternating structure.
The presence of deplete-replenish bias in a subset of our sample indicates that participants were using a learning mechanism that was computationally distinct from previously described processes. Learning the difference in expected value between decks is typically assumed to be retrospective and described using model-free reinforcement-learning algorithms—a process often contrasted with maximal abundance bias (i.e., a win-stay-lose-shift heuristic; Ahn et al., 2008; Haines et al., 2018; Steingroever, Wetzels, & Wagenmakers, 2013; Worthy et al., 2013). Deplete-replenish-bias choices mirror those of abundance bias, but they represent a distinct underlying process. Abundance bias is a strategy that is simpler than deplete-replenish bias; it is a heuristic that does not require learning and is based on the belief that wins signal future wins, which is not a feature of the CGT (i.e., both decks have a 50% chance of winning). Deplete-replenish bias represents prospective (model-based) learning that leads to the incorrect belief that choices affect the state of the game (i.e., a winning outcome temporarily depletes a deck of good outcomes). Model-based learning, which is computationally more complex than model-free learning (and abundance bias), gives rise to more flexible decision-making strategies (Gillan et al., 2015). Prior work has shown that model-based learning was absent in 8- to 12-year-old children and began to significantly influence decisions only in 13- to 17-year-old adolescents (Decker et al., 2016). Here, we found that children as young as 4 years enact decision-making strategies that indicate model-based learning. Although further research is needed to test this directly, this discrepancy may arise because of differences in the complexity of each task (Nussenbaum & Hartley, 2019). The incidental structure of the CGT may be more readily learned than the more complex probabilistic transitions in paradigms designed to separate model-free and model-based learning (e.g., the two-step task; Decker et al., 2016).
The decision-making strategy that results from this form of learning—deplete-replenish bias—is a previously undescribed choice strategy on the CGT or IGT. Previous models of choices on the CGT and IGT assumed that choices reflect the intended task structure: Heuristic models (e.g., abundance bias) assume that participants respond to the last outcome (e.g., win-stay-lose-shift), whereas learning models assume that individuals compare estimates of the decks’ expected values (Ahn et al., 2008; Haines et al., 2018; Steingroever, Wetzels, & Wagenmakers, 2013; Worthy et al., 2013). Deplete-replenish bias differs from these canonical models by revealing that participants learn and use the task’s incidental alternating structure.
Whereas our findings demonstrate that children learn multiple features of these gambling tasks, acting on the incidental alternating structure is suboptimal on the canonical CGT relative to strategies that use its intended structure (i.e., choosing the deck with the greatest expected value). However, our simulations showed that deplete-replenish bias would be an optimal response to observed outcomes in the CGT if those outcomes were in fact probabilistic—an assumption likely made by the children in our sample. Because these data were collected as part of a larger longitudinal study with measures maintained across collection points, children’s beliefs could not be assessed directly. However, their behavior supports the conclusion that—contrary to typical assumptions about these tasks (Bechara et al., 1994, 1997)—children do learn the predetermined structure of the CGT and make choices that would be nearly optimal given plausible assumptions about that structure.
The ambiguous nature of disadvantageous choices—which may be suboptimal or optimal depending on one’s beliefs about task structure—challenges the validity of prior interpretations of CGT and IGT outcomes. Performance on the CGT and IGT has been used broadly to assess potential deficits in decision-making and/or executive function (Kerr & Zelazo, 2004; Steingroever, Wetzels, Horstmann, et al., 2013); advantageous choices represent successful learning, whereas disadvantageous choices represent a failure to learn (Buelow & Suhr, 2009; da Mata et al., 2011). Thus, when canonical metrics of performance on these tasks are examined, a person who exhibits deplete-replenish bias would be considered a nonlearner who makes suboptimal choices. Yet children exhibit that bias precisely because they are sensitive to the incidental structure of the task, a capacity that would be otherwise adaptive in natural environments and everyday decision-making (Glimcher, 2014). Our results demonstrate that even young children show considerable heterogeneity in the strategies they apply to complex decision problems—and that a single performance metric (e.g., percentage of choices of the advantageous deck) may obscure that heterogeneity.
Critically, our results support the conclusion that children’s performance on sequential-choice tasks such as the CGT should not be considered a simple marker of individual differences in decision preferences (Ahn & Busemeyer, 2016; Steingroever, Wetzels, Horstmann, et al., 2013), particularly of economic risk (Hertwig et al., 2019). By design, the disadvantageous deck contains more variance in potential outcomes, losses on the advantageous deck do not take away from participants’ initial endowment, and the advantageous deck does not show first-order stochastic dominance over the disadvantageous deck. For example, someone who is relatively risk seeking but not loss averse might derive more utility from disadvantageous choices than from advantageous choices. These caveats do not undermine our conclusions about individual differences in strategy usage, however, because those strategies were identified from trial-to-trial variation in choices driven by sequences of outcomes.
Our results provide insight into how children learn and use the structure of their environments. Given the limitations of our sample, future research should explore how sensitivity to that structure develops over childhood and the extent to which it differs among unique populations. By demonstrating how a seemingly maladaptive strategy such as deplete-replenish bias could become optimal under different beliefs about environmental structure, our simulations provide an initial road map for testing the boundaries and generalizability of our findings. For example, if you randomize the order of outcomes—thus removing the alternating pattern of wins and losses—children should not exhibit deplete-replenish bias. Introducing (or removing) different forms of structure (Fig. 5) could tap cognitive capacities that develop over different trajectories. Further, studies are necessary not only to establish the boundary conditions under which children adopt (or do not adopt) deplete-replenish bias and other strategies but also to assess how the ability to identify the best strategy for a given task develops over childhood. Most importantly, a better understanding of children’s sensitivity to task structure will be necessary to integrate decades of work on probabilistic decision-making (Chiu et al., 2018) with new research on how children develop into adaptive problem solvers (Hartley & Somerville, 2015; Nussenbaum & Hartley, 2019) seeking to understand the structure of their world.
Supplemental Material
sj-docx-1-pss-10.1177_09567976211042007 – Supplemental material for Shuffle the Decks: Children Are Sensitive to Incidental Nonrandom Structure in a Sequential-Choice Task
Supplemental material, sj-docx-1-pss-10.1177_09567976211042007 for Shuffle the Decks: Children Are Sensitive to Incidental Nonrandom Structure in a Sequential-Choice Task by Alexander D. S. Breslav, Nancy L. Zucker, Julia C. Schechter, Alesha Majors, Tatyana Bidopia, Bernard F. Fuemmeler, Scott H. Kollins and Scott A. Huettel in Psychological Science
Footnotes
Transparency
Action Editor: Leah Somerville
Editor: Patricia J. Bauer
Author Contributions
A. D. S. Breslav and S. A. Huettel developed the study concept, with input from S. H. Kollins, B. F. Fuemmeler, and N. L. Zucker. S. H. Kollins, B. F. Fuemmeler, and N. L. Zucker developed and executed the parent study from which these data are derived. T. Bidopia and A. Majors collected the data under the supervision of J. C. Schechter. A. D. S. Breslav analyzed and interpreted the data under the supervision of S. A. Huettel. A. D. S. Breslav drafted the manuscript, and S. A. Huettel and J. C. Schechter provided critical revisions. All the authors approved the final manuscript for submission.
References
Supplementary Material
Please find the following supplemental material available below.
For Open Access articles published under a Creative Commons License, all supplemental material carries the same license as the article it is associated with.
For non-Open Access articles published, all supplemental material carries a non-exclusive license, and permission requests for re-use of supplemental material or any part of supplemental material shall be sent directly to the copyright owner as specified in the copyright notice associated with the article.