
Abstract
Social pain is a common experience that has potent implications for health. However, individuals differ in their sensitivity to social pain. Recent evidence suggests that sensitivity to social pain varies according to a biological factor that modulates sensitivity to physical pain: resting (tonic) blood pressure. The current studies extended this evidence by testing whether blood pressure relates to sensitivity to imagined (Study 1: N = 762, 51% female adults) and acute (Study 2, preregistered: N = 204, 57% female adults) experiences of social pain and whether associations extend to general emotional responding (Studies 1–3; Study 3: N = 162, 59% female adults). In line with prior evidence, results showed that higher resting blood pressure was associated with lower sensitivity to social pain. Moreover, associations regarding blood pressure and sensitivity to social pain did not appear to be explained by individual differences in general emotional responding. Findings appear to be compatible with the interpretation that social and physical pain share similar cardiovascular correlates and may be modulated by convergent interoceptive pathways.
Keywords
Individuals differ in their sensitivity to social pain—the unpleasant subjective experience evoked by potential or actual damage to one’s sense of social connection or social value. Although social pain may be a fundamental part of everyday life, it may also confer risk for poor health for some people. Hence, some people describe experiences of social pain as the most negative experiences of their lives (Jaremka et al., 2011). And acute experiences of social pain—interpersonal loss, exclusion, rejection—often precede negative health outcomes, including cardiovascular disease, the most prevalent chronic illness worldwide (Everson-Rose & Lewis, 2005). Identifying factors that account for individual differences in sensitivity to social pain is, therefore, important for a holistic understanding of social pain and efforts to reduce the impact of such social factors on health. Based on theoretical perspectives that social pain may be processed similarly to physical pain (Eisenberger, 2012; Macdonald & Leary, 2005; Panksepp, 2004), the current studies examined associations between resting (tonic) blood pressure—an established modulator of sensitivity to physical pain—and sensitivity to social pain.
Resting Blood Pressure and Sensitivity to Physical Pain
A consistent but perplexing finding from the physical-pain literature is the association between resting blood pressure and sensitivity to physical pain: Higher resting blood pressure is associated with lower sensitivity to physical pain. Findings span correlational and experimental approaches, are replicated across acute physical-pain manipulations in animals and humans, and are seen even below thresholds for clinical hypertension (Makovac et al., 2020). Furthermore, among normotensive individuals who have not yet developed hypertension, those with a family history of high blood pressure show lower sensitivity to acute physical pain (compared with those without such history), suggesting that reduced sensitivity to pain may be an early precursor to the development of hypertension (al’Absi et al., 1996; France et al., 2009). The reasons and precise mechanisms underlying the association between resting blood pressure and pain remain unclear. One possibility is that higher resting blood pressure blunts the affective intensity of experiences induced by pain (e.g., Dworkin et al., 1994). By this logic, high resting blood pressure may be functional for some acute experiences, even if there are long-term negative implications for health (e.g., clinical hypertension and consequent risk for myocardial infarction; Gianaros & Jennings, 2018).
Parallels to Sensitivity to Social Pain
Maintaining social connections throughout the life span is critical to survival and short- and long-term well-being, possibly in ways similar to monitoring, avoiding, and recovering from physical injury (Eisenberger, 2012). Theoretical perspectives from psychology and behavioral neuroscience suggest that experiences of social pain, including monitoring for potential threats to social connection and responding to acute experiences of social pain, may thus be processed similarly to experiences of physical pain (Macdonald & Leary, 2005; Panksepp, 2004).
Primary evidence for this perspective comes from neuroimaging studies in which acute experiences of social pain elicit activity in brain regions that are also engaged by affectively distressing experiences of physical pain—such as the dorsal anterior cingulate cortex (DACC) and anterior insula (AI; Eisenberger, 2012). For example, an acute experience of social rejection (vs. inclusion) elicits activity in the DACC and AI, and greater feelings of social pain are associated with greater activity in these regions (Eisenberger et al., 2007; Kross et al., 2007). Medication developed to reduce physical pain likewise reduces daily feelings of social pain (Dewall et al., 2010), and greater sensitivity to acute physical pain relates to greater sensitivity to an acute experience of social pain (Eisenberger et al., 2006).
If physical and social pain share similar processing streams, resting blood pressure may also be relevant for sensitivity to social pain. Consistent with this hypothesis, preliminary evidence suggests that higher resting blood pressure, principally systolic blood pressure (SBP), is associated with lower trait-level reports of sensitivity to social pain (Inagaki et al., 2018; Umeda et al., 2021). Further, the association remains when analyses adjust for emotional indices also related, albeit inconsistently, to resting blood pressure (e.g., negative affect, hostility; Inagaki et al., 2018). Whether resting blood pressure similarly relates to responses to an acute in vivo experience of social pain, however, has not been examined.
Statement of Relevance
Everybody experiences social pain—interpersonal loss, rejection, snubs, exclusion, discrimination. Indeed, social pain is an unavoidable consequence of social connection. But who is most sensitive to experiences of social pain, and why, remain open research questions. Combining findings from psychology, medicine, public health, and neuroscience indicating that higher resting blood pressure reduces sensitivity to acute physical pain (i.e., hypoalgesia), the present studies tested whether resting blood pressure exhibits similar effects in the domain of social pain. Results indicate that higher resting blood pressure—across a broad range of resting blood pressure—is associated with lower sensitivity to imagined and acute experiences of social pain but not with general emotional responsivity. These replicated findings provide novel evidence for a cardiovascular correlate of lower sensitivity to social pain, elevated resting blood pressure, which is a leading risk factor for heart disease.
Resting Blood Pressure and General Emotional Dampening
Further support for an association between resting blood pressure and social pain comes from conceptually related research on blood pressure and general emotional responsivity. According to the emotional-dampening hypothesis, resting blood pressure may dampen emotional responsivity not only toward physical pain but also toward emotionally meaningful stimuli in general, regardless of valence (McCubbin et al., 2014). Thus, higher resting blood pressure is linked to lower responses to an acute emotional experience (McCubbin et al., 2014, 2018) and perceived stress (Hassoun et al., 2015). Studies comparing individuals with higher and lower resting blood pressure have found similar results for other emotional outcomes (e.g., Duschek et al., 2017; Yoris et al., 2020). At a minimum, experiences of social pain are emotional, meaningful experiences (Jaremka et al., 2011). Therefore, it could be that higher resting blood pressure relates to less sensitivity to all emotional outcomes, including social pain. An alternative hypothesis that has yet to be systematically tested is whether resting blood pressure exhibits unique associations with certain emotional outcomes—in this case, experiences of social pain—apart from others.
The Current Studies
The current studies were designed to replicate and extend previously published preliminary findings (Inagaki et al., 2018; Umeda et al., 2021) by assessing responses to an acute experience of social pain and specificity for sensitivity to social pain. Study 1 examined associations between resting blood pressure and sensitivity to imagined experiences of social pain using publicly available data. Study 2 was a preregistered experimental study in which participants completed a resting blood pressure protocol followed by a paradigm to induce feelings of social pain (Cyberball). Study 3 assessed associations between resting blood pressure and responses to an acute emotional experience. Given the literature on resting blood pressure and sensitivity to physical pain, we expected higher resting blood pressure to relate to lower sensitivity to imagined (Study 1) and acute (Study 2) experiences of social pain. Further, we explored whether associations can be explained by those factors reflecting general emotional responding unspecific to social pain per se (Studies 1–3).
Study 1
Method
Overview
Secondary data analyses were conducted on a publicly available data set: Midlife in the United States (MIDUS) Study (MIDUS Refresher: Biomarker Project, 2012–2016; Weinstein et al., 2017). In this part of the MIDUS study, participants completed a resting blood pressure protocol and trait-level affective measures, including a well-known predictor of sensitivity to social pain.
Participants
The MIDUS Refresher Biomarker study obtained data from 863 respondents. After data exclusions to maintain the integrity of the resting blood pressure and emotional measures, noted below, the analytic sample we used to test our hypotheses consisted of 762 participants—age: M = 51.01 years, SD = 13.52, range = 25–76; 51.0% female; 83.5% not Hispanic/Latinx, 3.4% Hispanic/Latinx (13.1% refused to answer or did not complete); 70.1% White, 6.8% Black/African American, 2.0% Native American/Aleutian, 1.4% Asian, 6.4% other (13.3% refused to answer, did not know, or did not complete).
Resting blood pressure
Resting blood pressure was collected by a General Clinical Research Unit nurse or trained technician during an initial physical exam. Participants were seated for three separate blood pressure readings. Per the MIDUS protocol description, the two most similar readings were averaged for the measure of resting blood pressure. An SBP reading over 180 and a diastolic blood pressure (DBP) reading over 120 suggests hypertensive crisis (American Heart Association, 2022). Therefore, individuals with mean blood pressure readings over these thresholds were excluded from analyses (SBP: n = 7; DBP: n = 1). In addition, current smokers (n = 94) were removed from analyses because smoking blunts emotional responding (Hall et al., 2015), and there are no indications within the MIDUS protocol that participants were instructed to refrain from smoking prior to the protocol. Mean blood pressure readings were in the elevated range (SBP: M = 126.74, SD = 15.65, range = 88–178, missing: n = 9; DBP: M = 77.40, SD = 9.89, range = 48–111, missing: n = 2). More than 50% of the sample reported taking one or more medications for chronic illness, including antihypertensive medication (35.2%) and analgesic medication (50.5%). Removing such participants would reduce statistical power and the generalizability of results to this age group (midlife adults). Therefore, we retained participants regardless of medication status, but we addressed these limitations in Studies 2 and 3.
Sensitivity to imagined experiences of social pain: social anxiety
Though not the same as sensitivity to acute experiences of social pain, social anxiety—defined as fear of social experiences in which embarrassment may occur or where there is a risk of being negatively evaluated—is relevant to the current premise (e.g., Fung & Alden, 2017). Indeed, a core component of social pain is the monitoring of potential threats (including imagined future experiences) to social connection. Most relevant to current aims, individual differences in social anxiety predict how sensitive one is to imagined experiences of social pain (Breen & Kashdan, 2011) and an acute experience of social pain (i.e., Cyberball; Oaten et al., 2008). Therefore, resting blood pressure may be associated with levels of social anxiety—and higher resting blood pressure may be related to less social anxiety.
In MIDUS, participants completed an abbreviated nine-item version of the Liebowitz Social Anxiety Scale (LSAS; Fresco et al., 2001), during which they imagined how “painful” it would feel when participating in hypothetical social experiences. Instructions were to “circle the number that best describes how much fear or anxiety [you] generally feel in the following situations.” Example social situations included going to a party, talking with people they do not know very well, and expressing disagreement or disapproval to people they do not know very well. Some of the questions included in the LSAS were also included in measures that assess sensitivity to social pain, including the scale most consistently related to resting blood pressure (Inagaki et al., 2018; Umeda et al., 2021). Feelings were rated on a four-point scale (1 = none, 2 = mild, 3 = moderate, 4 = severe). Responses were averaged across the nine experiences. Higher scores indicate greater sensitivity to social pain (M = 1.85, SD = 0.55; n = 761, missing: n = 1; α = .86).
General emotional responding
Previous findings suggest that higher resting blood pressure may dampen general emotional responding (e.g., McCubbin et al., 2014). Accordingly, associations were assessed between resting blood pressure and additional emotional outcomes that have previously been related to resting blood pressure. These include perceived stress (Perceived Stress Scale [PSS]; Cohen et al., 1983), and positive affect (Mood and Anxiety Symptom Questionnaire, High Positive Affect subscale; Clark & Watson, 1991).
Data analysis
Associations between resting blood pressure and sensitivity to imagined experiences of social pain were evaluated with Pearson correlations in SPSS (Version 28). Significant associations were tested again, adjusting for body mass index (BMI) and age—established modifiers of resting blood pressure (Franklin et al., 1997). Parallel analyses were run linking resting blood pressure with general emotional responding.
Nonsignificant associations based on p values do not provide statistical evidence favoring the null hypothesis (Dienes, 2014). Moreover, nonsignificant associations (e.g., between resting blood pressure and sensitivity to social pain or general emotional responding) could also reflect a condition in which the data are insensitive to true associations (i.e., cannot distinguish between support for the alternative vs. the null hypothesis). As noted, frequentist statistics are not suitable for inferences regarding null associations or data insensitivity. Therefore, Bayesian correlation analyses and linear multiple regression analyses were executed in JASP (JASP Team, 2020, Version 0.14.1) to further evaluate statistical associations and data sensitivity. For Bayes factors (BFs), BF10 values reflect the probability of the alternative relative to the null hypothesis, and BF01 values reflect the inverse of BF10 values, corresponding to evidence for the null relative to the alternative hypothesis. BFs greater than 3 indicate support for hypotheses—for example, that higher resting blood pressure is associated with lower sensitivity to social pain. Values less than 0.33 indicate support for the null hypothesis (e.g., that the association is absent), and values between 0.33 and 3 indicate data insensitivity. JASP output for Bayesian analyses in Study 1 are posted on OSF at https://osf.io/vf9s2/.
Results
Men displayed higher resting blood pressure (SBP: M = 130.54, SD = 14.50; DBP: M = 80.16, SD = 9.77) than women (SBP: M = 123.09, SD = 15.87, DBP: M = 74.76, SD = 9.26), for SBP: t(758) = 6.75, p < .001, bias corrected and accelerated (BCA) 95% confidence interval (CI) for the mean difference between men and women = [−9.60, −5.27], d = 15.21; for DBP: t(758) = 7.83, p < .001, BCA 95% CI for the mean difference between men and women = [−6.75, −4.00], d = 9.52, consistent with established literature (Ji et al., 2020). However, there were no interactions with sex when blood pressure was evaluated as a predictor of social anxiety, and so analyses were collapsed across sex (ps > .35).
Resting blood pressure and sensitivity to imagined experiences of social pain
As hypothesized, higher resting blood pressure was associated with lower anxiety or fear of imagined social experiences (i.e., lower scores on the social-anxiety scale: SBP: r = −.15, p < .001, BCA 95% CI = [−.21, −.09]; DBP: r = −.11, p = .004, BCA 95% CI = [−.19, −.02]).
BFs comparing the alternative hypothesis (higher resting blood pressure would be associated with lower sensitivity to social pain) with the null hypothesis (no association) indicated strong support for the current hypothesis (Table 1).
Results From Bayesian Correlation Analyses of the Association Between Resting Blood Pressure and Sensitivity to Socioemotional Outcomes (Social Pain and General Emotional Responding)
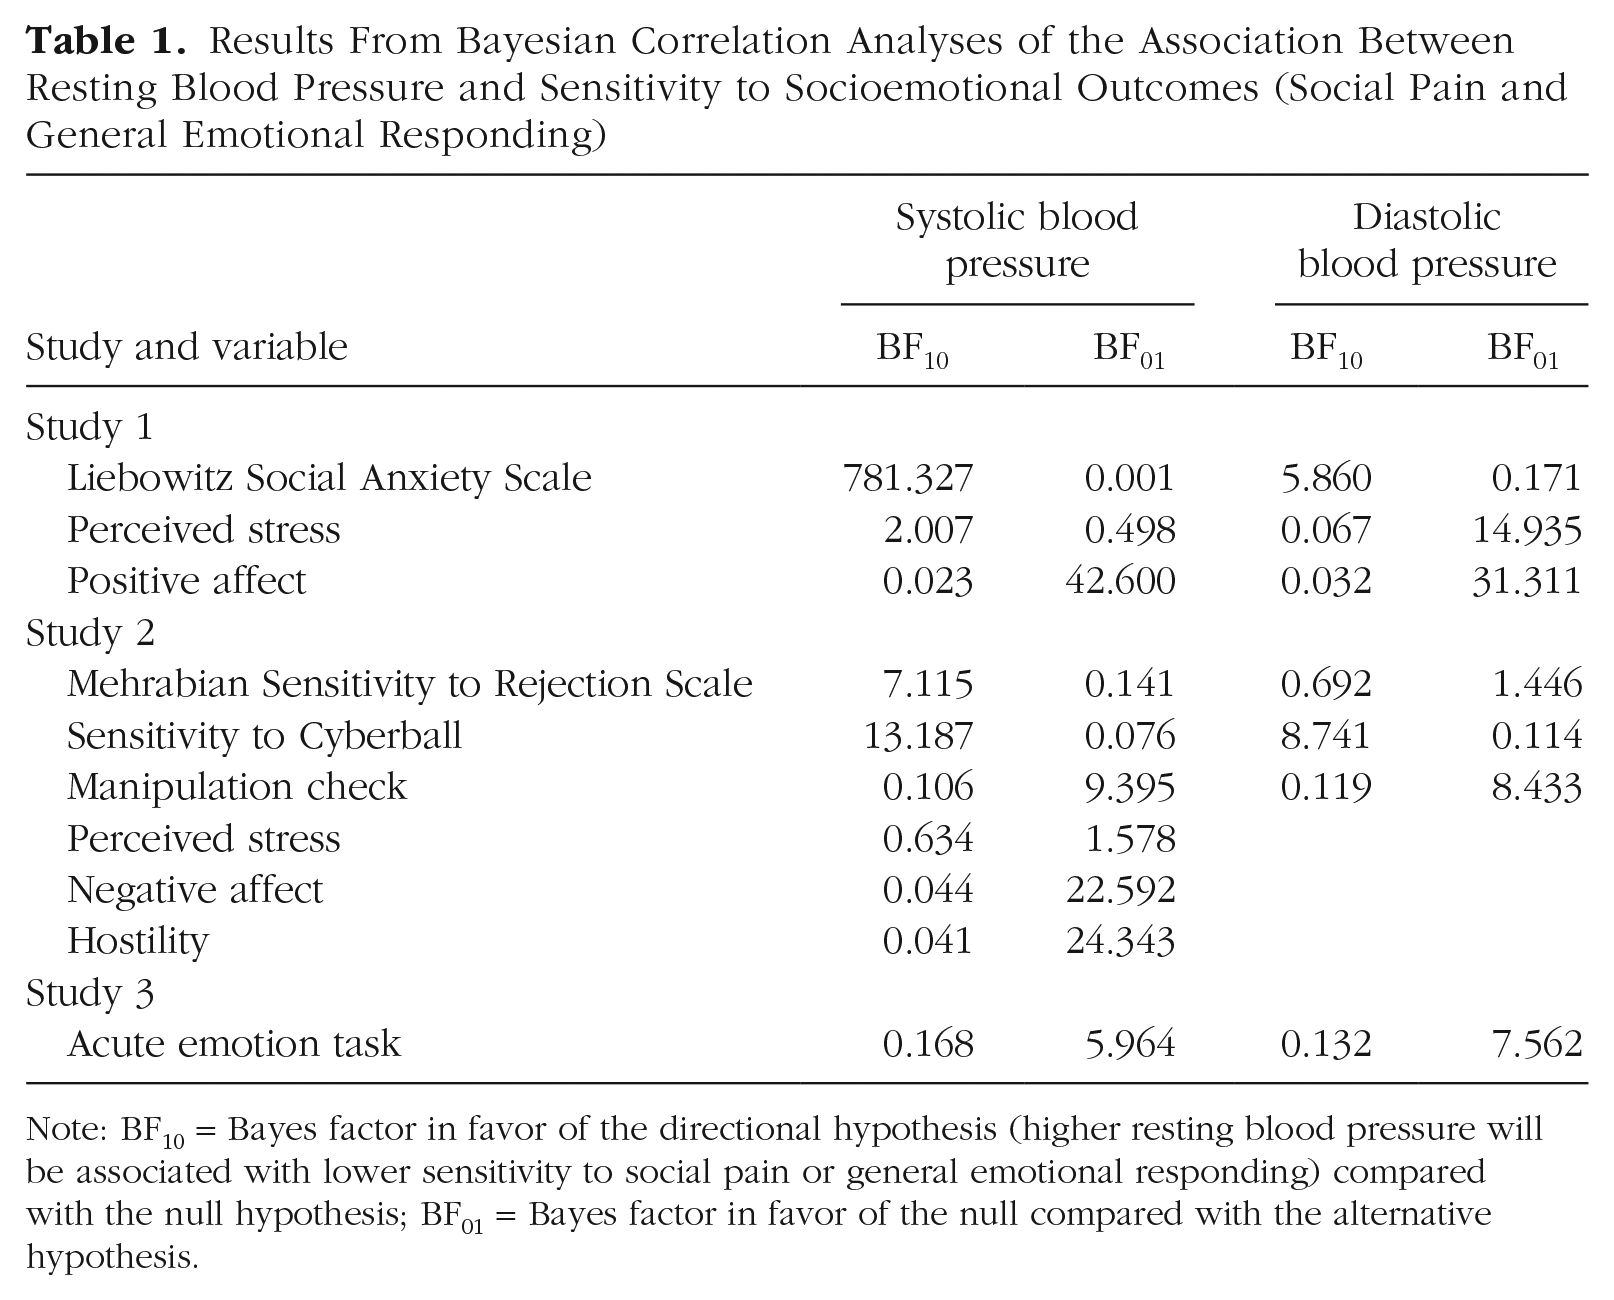
Note: BF10 = Bayes factor in favor of the directional hypothesis (higher resting blood pressure will be associated with lower sensitivity to social pain or general emotional responding) compared with the null hypothesis; BF01 = Bayes factor in favor of the null compared with the alternative hypothesis.
Resting blood pressure and sensitivity to imagined experiences of social pain, adjusted for BMI and age
Consistent with the current literature, results showed that BMI and age were correlated with resting blood pressure: Higher BMI and older age were associated with higher resting blood pressure. When adjusting for these factors, we found that the association between resting blood pressure and sensitivity to imagined experiences of social pain remained (SBP: r = −.09, p = .01, BCA 95% CI = [−.16, −.03]; DBP: r = −.10, p = .01, BCA 95% CI = [−.17, −.03]).
Bayesian multiple regression analyses were also conducted to compare models with blood pressure (SBP and DBP separately) as predictors of sensitivity to social pain with a null model in which BMI and age were predictors. An uninformed uniform prior, P(M), of .50 was set for each of the two possible models. The posterior inclusion probability (PIP) values accompanying BMI suggested that the variable was a poor predictor of sensitivity to social pain (SBP: PIP = .38, DBP: PIP = .50), so the variable was dropped for better model fit. Results of this analysis suggested evidence for a regression model with SBP predicting sensitivity to social pain compared with the null model with only age predicting sensitivity to social pain (BF10 = 6.30, BF01 = 0.16). Similarly, the model including DBP, compared with the null model, indicated evidence for an association only with age (BF10 = 6.58, BF01 = 0.15). For comparison, and given precedent in the field to account for BMI, results including BMI in the null model are as follows: BF10 = 2.57, BF01 = 0.39 (for SBP); BF10 = 4.84, BF01 = 0.21 (for DBP).
Resting blood pressure and general emotional dampening
Resting blood pressure has previously been associated with sensitivity to general emotional content. Indeed, higher resting SBP was linked to lower perceived stress (SBP: r = −.09, p = .01, BCA 95% CI = [−.17, −.01]), although the association did not remain after models adjusted for BMI and age (SBP: r = −.04, p = .27, BCA 95% CI = [−.11, .03]). Further, there were no associations between resting DBP and perceived stress (DBP: r = −.02) or SBP (SBP: r = .04) or DBP and positive affect (DBP: r = .02; ps > .29). Associations between resting blood pressure and sensitivity to imagined experiences of social pain were stronger than most of those between resting blood pressure and perceived stress (SBP: z = 1.68, p = .09; DBP: z = 2.32, p = .02) and positive affect (SBP: z = 3.25, p = .001; DBP: z = 2.09, p = .04). In other words, within participants, some associations were specific to sensitivity to imagined experiences of social pain.
To clarify the nonsignificant associations, BFs indicated no support for an association (i.e., support for the null hypothesis) between resting blood pressure and positive affect or between resting DBP and perceived stress, but they did indicate potential data insensitivity to detecting a negative association between SBP and perceived stress (Table 1). Therefore, a Bayesian multiple regression analysis was carried out to compare a model with SBP as a predictor of perceived stress with a model in which BMI and age were predictors. Results of this analysis suggested that SBP should be dropped as a predictor (PIP = .17). Indeed, BFs suggested no support for SBP as a predictor of perceived stress compared with a null model with BMI and age as predictors (BF10 = 0.24, BF01 = 4.26).
Study 2
Method
Overview
Study 2 was a preregistered experimental study that addressed some limitations of Study 1 (https://aspredicted.org/xw9sd.pdf). In particular, participants were screened for medication status and other confounds related to resting blood pressure or emotional responding. The protocol followed best practices for resting blood pressure measurement in the psychophysiology laboratory setting (Shapiro et al., 1996) and extended potential associations to an acute experience of social pain.
Screening and prestudy instructions
Recruitment occurred through an online scheduling system for research participants (Sona Systems; www.sona-systems.com/) for a study titled, “Individual Differences in Social and Affective Processing.” Screening criteria included age (18 years or older) and enrollment in an introductory psychology course. Thus, participants came from a pool of young adults. Procedures were run in accordance with the University of Pittsburgh’s Institutional Review Board. All participants provided written consent prior to participation and were given two research credits in exchange for their time.
Sessions took place between 9:00 a.m. and 2:00 p.m. to control for the possible influence of time-of-day effects on blood pressure. Three days prior to the study session, participants received instructions to refrain from exercising, drinking alcohol, and taking over-the-counter medications (e.g., Ibuprofen, Claritin) at least 24 hr prior to the visit and to refrain from drinking caffeinated beverages, smoking, and eating for at least 2 hr prior to the visit. They were also asked to wear short sleeves so that experimenters could place the blood pressure cuff directly onto the arm (rolled sleeves can artificially increase resting blood pressure). Compliance with prestudy instructions was assessed after written consent but prior to the start of study procedures.
Participants
The sample size of 200 was determined a priori via a power analysis in G*Power (Version 3.1; Faul et al., 2007) with an α of .01, power of .80, and a medium effect size (Cohen’s d between 0.3 and 0.5, based on the desired effect size). The stopping rule for data collection was to cease when we reached 200 testable participants (defined as participants who complied with prestudy instructions and completed all phases of the experimental session). The final sample included 204 individuals (56.86% female; age: M = 19.00 years, SD = 1.59, range = 18–34; 19.6% Asian/Asian American, 4.4% Black/African American, 68.1% White, 7.8% other).
Resting blood pressure
Experimenters collected height and weight in order to calculate BMI (M = 23.69, SD = 3.90) and then placed the blood pressure cuff over the brachial artery of the nondominant arm, positioned at the level of the heart. Participants sat quietly for 10 min in order to acclimate to the lab environment and cuff. An oscillometric device (GE Dinamap PRO Monitor) was set to automatically record every 3 min for a total of four readings (i.e., 12 min). We used an average of the four readings to determine resting blood pressure, following recommended best practices (Shapiro et al., 1996). Resting blood pressure was in the normal to elevated range (SBP: M = 108.54, SD = 9.09, range = 87.75–137.25; DBP: M = 63.58, SD = 6.76, range = 51.25–94). Oral and tympanic temperatures were also collected to test a different aim, but those values are not reported here.
Acute experience of social pain: Cyberball
Participants then completed Cyberball, a computer task meant to elicit social pain (Williams et al., 2000). Participants were told that they would play the computer equivalent of “catch” over the Internet with two other players who were playing at other locations on campus (these players were named “Julie” and “Amy” or “David” and “Michael”—matched to the gender of the participant). On the screen, three hands were shown in a triangle formation; the bottom hand was controlled by the participant, and the other two hands were controlled by the two other supposed participants. A computer ball was then thrown among the hands. When the ball landed in the participant’s hand, they could press one button to throw the ball to the player on the left and another button to throw the ball to the player on the right. In reality, the other two players on the screen were controlled by the computer and operated according to parameters set by the experimenters. Prior to playing Cyberball, participants were encouraged to immerse themselves in the game as much as possible by creating a mental picture of what might be going on during the game, as if they were playing in real life (e.g., “think about what the other players might look like, what sort of people they are, are you playing outside? inside?, etc.”).
Participants played two rounds of the game, the first of which was described as a practice round to become familiar with the interface and test the Internet connection. During a second round of the game, participants were first included in the game and then excluded such that the other two players continued to throw the ball back and forth between themselves but not to the participant.
Sensitivity to acute experience of social pain
After completing the game, participants completed a standard posttask questionnaire about their feelings of social pain in response to the exclusion round of the game (Brief Need-Threat Scale, α = .87; Williams et al., 2000). Using a scale from 1 (not at all) to 5 (extremely), participants indicated “the extent to which [they] felt the following feelings during the last round of the Cyberball (ball-throwing) game.” Sample items included “feeling disconnected,” “rejected,” “invisible,” and “liked” (the last was reverse scored). Higher scores indicated greater sensitivity to social pain (M = 3.59, SD = 0.64).
In addition, participants estimated the percentage of time they received the ball to make sure they were aware of the exclusion in the second round of Cyberball: “Assuming that the ball should be thrown to each person equally (33% if three people), what percentage of throws was directed to you during the last round of the ball-tossing game?” All participants received a full oral and written debriefing after completion of the posttask questionnaire.
Trait-level sensitivity to social pain
In an attempt to replicate previous findings and following the preregistered plan, we also asked participants to complete Mehrabian’s Sensitivity to Rejection (MSR) scale, which assesses negative social expectations such as fear that a social interaction will result in rejection (M = 127.35, SD = 22.26, α = .81; Mehrabian, 1970). Using a scale from 1 (strongly disagree) to 9 (strongly agree), participants responded to items such as “I enjoy going to parties where I don’t know anyone,” “I am cautious about expressing my opinions until I know people quite well,” and “I am very sensitive to any signs that a person might not want to talk to me.” We reverse-scored negatively worded items before computing the average of all 24 items. Higher scores reflected greater sensitivity to social pain.
General emotional responding
Finally, participants completed measures of general emotional responding that may plausibly relate to resting blood pressure or account for any observed associations with experimentally induced social pain. Following the preregistration plan, we included measures of state negative affect (Positive and Negative Affect Schedule [PANAS]; M = 21.03, SD = 7.89, α = .89; Watson et al., 1988), trait hostility (Cook-Medley Hostility Scale; M = 21.98, SD = 7.23, α = .80; Cook & Medley, 1954), and perceived stress over the past month (PSS; M = 1.82, SD = 0.70, α = .87; Cohen et al., 1983).
Data analysis
Pearson correlations were run in SPSS (Version 28) to assess associations between resting blood pressure and sensitivity to social pain. Significant associations were tested again, adjusting for BMI and age following the analysis approach from Study 1. Bayesian correlational analyses were also run in JASP.
According to the preregistration plan, the next analysis step was to examine the association between resting blood pressure and sensitivity to acute social pain after adjusting for individual differences in general emotional responding and confounding health covariates. Therefore, two-stage hierarchical multiple regressions were run with sensitivity to social pain as the dependent variable. BMI, negative affect, hostility, and perceived stress were entered at Step 1, followed by blood pressure (SBP and DBP as separate regressions). Age was not specified as a covariate in the preregistration plan but was added as a covariate to remain consistent with analyses for Study 1.
In addition to frequentist statistics, Bayesian multiple regression analyses with resting blood pressure (SBP and DBP separately) as predictors of sensitivity to social pain were compared with null models in which BMI, age, negative affect, hostility, and perceived stress were predictors. Uninformed uniform priors, P(M)s, of 0.50 were set for each of the two possible models.
Results
Men displayed higher resting blood pressure (SBP: M = 114.38, SD = 8.23; DBP: M = 65.51, SD = 7.91) than women (SBP: M = 104.11, SD = 6.98; DBP: M = 62.11, SD = 5.31), for SBP: t(202) = 9.631, p < .001, BCA 95% CI for the mean difference between men and women = [−12.44, −8.13], d = 7.54; for DBP: t(202) = 3.68, p < .001, BCA 95% CI for the mean difference between men and women = [−5.51, −1.25], d = 6.56. Despite sex differences in resting blood pressure, there were no interactions with sex in sensitivity to an acute experience of social pain, the MSR, or general emotional-responding measures (ps > .07). Therefore, analyses were collapsed across sex. Data and JASP output from Bayesian analyses for Study 2 are posted on OSF at https://osf.io/vf9s2/.
Replicating the association between resting blood pressure and trait-level sensitivity to social pain
Replicating previous findings (Inagaki et al., 2018; Umeda et al., 2021), we found that higher resting SBP was associated with lower sensitivity to social pain, as measured by the MSR scale (r = −.19, p = .01, BCA 95% CI = [−.31, −.07]). The association remained when models adjusted for BMI and age (r = −.16, p = .02, BCA 95% CI = [−.28, −.04]). Parallel associations with resting DBP were not significant (r = −.12, p = .09, BCA 95% CI = [−.26, .03]).
BFs from unadjusted correlation analyses indicated moderate evidence for a relation between higher SBP and lower MSR scores but insensitivity for an association between DBP and MSR scores (Table 1). Bayesian regression analyses were then conducted to assess the contribution of SBP to MSR scores over and above BMI and age. Options under model prior were set to uniform for the two possible models, P(M) = .50. Comparing a model in which BMI and age predicted MSR scores with a model with SBP suggested that BMI was a poor predictor and should be dropped in order to obtain better model fit (PIP = .21). After BMI was dropped, the regression model with SBP predicting MSR scores suggested moderate evidence for the current hypothesis compared with the null hypothesis with only age as a predictor (BF10 = 3.45, BF01 = 0.29). For comparison, BFs when BMI was added back into the model were as follows: BF10 = 2.72, BF01 = 0.37.
Resting blood pressure and sensitivity to acute experience of social pain
The percentage of time that participants reported receiving the ball was examined as a manipulation check on the exclusion round of Cyberball. All participants reported receiving the ball less than 33% of the time, suggesting that they were aware of the rejection (M = 9.6%, SD = 5.8%). There were no associations between resting blood pressure and the manipulation check (SBP: r = −.02, p = .82, BCA 95% CI = [−.16, .14], DBP: r = −.03, p = .73, BCA 95% CI = [−.17, .14]; see Table 1 for BFs), nor between the manipulation check and sensitivity to social pain (MSR: r = −.02, p = .83, BCA 95% CI = [−.15, .12], BF10 = 0.11, BF01 = 15.01; Cyberball: r = .03, p = .71, BCA 95% CI = [−.11, .18], BF10 = 0.07, BF01 = 69.87).
The primary hypothesis is that resting blood pressure would relate to sensitivity to an acute experience of social pain. As confirmation of this hypothesis, results showed that higher resting SBP was associated with lower sensitivity in response to Cyberball (r = −.21, p = .003, BCA 95% CI = [−.34, −.06]; adjusted for BMI and age, r = −.17, p = .02, BCA 95% CI = [−.30, −.02]; see Fig. 1). Associations between DBP and sensitivity to Cyberball were in a similar direction as those with SBP (r = −.20, p = .005, BCA 95% CI = [−.33, −.05]; adjusted for BMI and age, r = −.13, p = .07, BCA 95% CI = [−.26, .00]).

Scatterplots showing the association between resting blood pressure and sensitivity to an acute experience of social pain (Cyberball) in Study 2. Results are shown separately for systolic blood pressure (top) and diastolic blood pressure (bottom). Solid lines represent the best-fitting regression, and dotted lines represent 95% confidence intervals. Rating of social pain sensitivity were made on a 5-point scale; lower numbers represent lower sensitivity to social pain.
BFs indicated strong to moderate associations between resting blood pressure and sensitivity to Cyberball (Table 1). Indeed, Bayesian correlational analyses suggested that resting blood pressure was 13.19 times (SBP) and 8.74 times (DBP) more likely to predict sensitivity to Cyberball compared with the null hypothesis, which was only 0.07 times (SBP) and 0.11 times (DBP) as likely as the alternative hypothesis.
Resting blood pressure and general emotional responding
Associations between resting blood pressure (SBP and DBP separately) and sensitivity to social pain were further evaluated after adjusting for BMI, age, and general emotional responding. Results from frequentist statistics are presented first, followed by results of Bayesian multiple regression analyses.
BMI, age, negative affect, hostility, and perceived stress accounted for 11.4% of the variance in sensitivity to an acute experience of social pain, F(5, 197) = 5.20, p < .001. Adding SBP to the regression model explained an additional 2.4% of the variance in sensitivity to social pain, and this R2 change was significant, F(1, 196) = 5.40, p = .02 (see Table 2). Adding DBP to a separate regression model explained an additional 1.6% of the variance in sensitivity to social pain, but this R2 change was not significant, F(1, 196) = 3.64, p = .06 (see Table 3).
Results From the Frequentist Hierarchical Regression Analysis of the Association Between Resting Systolic Blood Pressure and Sensitivity to an Acute Experience of Social Pain, Apart From Other Variables (Study 2, N = 204, 57% Female)

Note: Resting blood pressure was assessed in millimeters of mercury (mm Hg). Confidence intervals (CIs) are bias-corrected and accelerated; CIs that exclude zero are given in boldface.
Results From the Frequentist Hierarchical Regression Analysis of the Association Between Resting Diastolic Blood Pressure and Sensitivity to an Acute Experience of Social Pain, Apart From Other Variables (Study 2, N = 204, 57% Female)

Note: Resting blood pressure was assessed in millimeters of mercury (mm Hg). Confidence intervals (CIs) are bias-corrected and accelerated; CIs that exclude zero are given in boldface.
Bayesian regression analyses then assessed the contribution of resting blood pressure (SBP and DBP separately) to sensitivity to social pain over and above BMI, age, and general emotional responding. For the model with SBP, BMI (PIP = .23), negative affect (PIP = .24), hostility (PIP = .62), and perceived stress (PIP = .56) were all deemed weak predictors that should be dropped in order to obtain better model fit. After these predictors were dropped, the regression model with SBP predicting sensitivity to social pain suggested evidence for the current hypothesis compared with the null hypothesis with only age as a predictor (BF10 = 4.07, BF01 = 0.25). For comparison, BFs when we added BMI and the three general emotional-responding predictors back into the model were as follows: BF10 = 3.41, BF01 = 0.29.
For the model with DBP as the predictor of sensitivity to social pain, values indicating the PIP for DBP (PIP = .63) as well as BMI (PIP = .28), negative affect (PIP = .24), and hostility (PIP = .47) suggested the variables should be dropped. Indeed, keeping all predictors in the model to assess whether DBP was associated with sensitivity to social pain over and above the other variables suggested that the data were insensitive to detecting an association (BF10 = 1.57, BF01 = 0.64).
Though not specified in the preregistration plan, an additional way to probe the specificity of the association between resting blood pressure and social pain is to take the approach from Study 1 and relate resting blood pressure with the general emotional outcomes using frequentist statistics and then test the difference between the correlations. Based on the results reported above, SBP was consistently associated with sensitivity to social pain. Therefore, analyses were constrained to SBP. Resting SBP was not associated with general emotional responding: negative affect (r = .10), hostility (r = .10), or perceived stress (SBP: r = −.12, ps ≥.10, BCA 95% CI = [−.01, .08]). Further, the association between resting SBP and sensitivity to social pain was greater than parallel associations with negative affect (z = 2.77, p = .01) and hostility (z = 2.89, p = .004), but not perceived stress (z = 0.55, p = .58). Still, such differences further suggest some specificity for sensitivity to social pain.
BFs suggested evidence consistent with the null hypothesis (i.e., no association between resting SBP and general emotional responding) for negative affect and hostility (Table 1), which clarifies the nonsignificant associations between resting SBP and general emotional responding. But the BF for the association between SBP and perceived stress suggested that the data might be insensitive to detecting an association.
Study 3
Method
Overview
Although there were no associations between resting blood pressure and general emotional responding in Studies 1 and 2, this could be because participants were not responding in real time to any emotional content, as participants have in previous studies that found evidence for emotional dampening (e.g., McCubbin et al., 2014, 2018). Further, whereas the measures from Studies 1 and 2 assessed sensitivity to self-relevant experiences of social pain in ways similar to those in the physical-pain literature (i.e., acute physical pain is harm directed to the self), sensitivity to social pain could extend to viewing physical pain directed at other people. Therefore, an exploratory analysis was conducted on an existing data set within the lab from a separate sample of participants who completed a resting blood pressure protocol and then responded to a task designed to induce empathy for physical pain. The task is also an acute emotional experience, similar to those previously used to test the emotional-dampening hypothesis, in which participants recognize the emotional experience of strangers.
Participants
Procedures (recruitment, screening, scheduling, and resting blood pressure protocol) were similar to those in Study 2, and participants came from a pool of young adults. Sample size was determined in order to test the original study’s primary aims (Inagaki et al., 2018). One hundred sixty-three participants (BMI: M = 23.22, SD = 4.21) completed the resting blood pressure protocol and acute emotional experience. SBP (average over four readings; M = 108.07, SD = 9.37, range = 81–134) and DBP (M = 63.89, SD = 6.43, range = 51.75–87) were in the normotensive range. Demographic information, specifically sex and age, were mistakenly left out of data collection. Information was partially recovered after data collection concluded, when the error was caught in 2017. Thus, 58.9% of the sample was female (n = 11 missing sex information). However, experimenters were unable to verify the accuracy of the information for most participants. This means that researchers guessed the sex of participants on the basis of name or memory, but, at the time, participants could not be contacted to confirm sex or age (e.g., participants had graduated, there was no link between the participant ID and the participant’s identifying information).
Acute emotional experience
Participants completed a task that was originally designed to test empathy for other people’s experience of physical pain (Lamm et al., 2007). Importantly, the task differed from the current conceptualization of social pain, which in Studies 1 and 2 was focused on potential or actual damage to social connection (i.e., damage relevant to the self) as opposed to the pain of unknown strangers. Thus, participants viewed 24 brief video clips of people (12 females) making emotional facial expressions in response to aversive auditory stimulation. Clips began with a neutral facial expression (0.5 s) transitioning to a strong negative emotion (3.0 s). Instructions were to decide how much pain the person was in. Additional instructions focused on the affectively distressing side of the experience. In particular, participants were reminded that “there are two different aspects of pain – one is how intense or strong the pain feels, and the other is how unpleasant or disturbing it is.” Therefore, participants were instructed to focus on the second aspect of discomfort and to make ratings based on how distressed or unpleasant they thought the person was feeling. Responses were made from 0 to 20 using a Gracely box scale, a validated measure used to assess experimental pain (Gracely et al., 1978). Participants were given as much time as they needed in order to make ratings (i.e., the task was self-paced). Responses were averaged across the 24 ratings such that higher numbers indicated greater sensitivity to the task. One participant’s data were missing for this task, which left a final analytic sample of 162.
Data analysis
Pearson correlations linking resting SBP and DBP to responses to the task were run in SPSS (Version 28). To obtain BFs for the current associations, we used JASP to run correlation analyses linking resting blood pressure to responses to the task. Some findings from this study have been published previously (Inagaki et al., 2018), but results from the current task have not been published. Findings have been divided because each test was related but had separate aims (i.e., an aim in the current article is to assess whether associations extend to general emotional responding, which departs from the aims of the previous publication). Given the exploratory nature of the current analysis and the missing demographic information, we emphasize results should be interpreted in view of the study’s limitations regarding age and sex. For interested readers, potential sex differences and interactions with sex are reported in the Supplemental Material available online. Data and JASP output from Bayesian analyses for Study 3 are posted on OSF at https://osf.io/vf9s2/.
Results
Mean ratings on the task corresponded to “very annoying” on the scale, suggesting that participants recognized the emotional experience as unpleasant for the people in the video clips (M = 11.27, SD = 3.30, range = 2.04–17.67, α = .98). However, there were no associations between resting blood pressure and sensitivity to the acute emotional experience (SBP: r = −.05, p = .56, BCA 95% CI = [−.20, .12]; DBP: r = −.03, p = .73, BCA 95% CI = [−.63, .11]).
Bayesian correlation analyses were run in order to clarify whether nonsignificant associations indicated evidence against the emotional-dampening hypothesis or merely reflected insensitivity of the data to detect a true association. BFs suggested moderate evidence against general emotional dampening, instead suggesting that the null hypothesis of no association was between 5.96 times (SBP) and 7.56 times (DBP) more likely than the alternative hypothesis (Table 1).
Discussion
The current studies show that higher resting blood pressure, previously linked to sensitivity to physical pain, also relates to lower sensitivity to imagined social pain (Study 1) and acute experiences of social pain (Study 2), potentially apart from general emotional responding (Studies 1 and 2) and pain experiences directed at strangers (Study 3). Hypothesized associations emerged across multiple measures of social pain, a range of resting blood pressure (i.e., normotensive through Stage 2 hypertension), and age (18–76 years). Thus, higher resting blood pressure, traditionally framed as a poor outcome (e.g., “silent killer”), may be functional under some circumstances insofar as it may constrain or limit the magnitude (or variability) of social pain.
Our findings are consistent with reemerging perspectives about how psychological experience might be shaped by the body. Indeed, there is renewed interest in interoception—the sense of the body’s internal physiological state—as well as “body-to-mind” pathways by which afferent (visceral sensory) feedback from internal organs (e.g., heart and blood vessels) alter not only socioemotional experiences but also risk for chronic diseases (Gianaros & Jennings, 2018). As a source of interoceptive input, resting blood pressure may shape the meaning ascribed to experiences of social pain, including its contextual salience and its relevance to the self, which may contribute to the global sensitivity measures in the current studies (Koban et al., 2021). Future research is needed to test this particular causal chain of events, especially as it unfolds over time.
There are at least three interrelated biological pathways by which associations might occur: the baroreceptor reflex arc, vascular stiffness, and endogenous opioids. Reduced functioning of the baroreflex and increased vascular stiffness, for example, may not only impair blood pressure control but also alter interoceptive information from the cardiovascular system conveyed to brain systems implicated in social pain (e.g., the cingulate and insular cortices; Inagaki et al., 2018; Scudder et al., 2021). The central action of opioids also confers sensitivity to social pain (Inagaki, 2018) and, separately, may underlie associations between resting blood pressure and sensitivity to physical pain (McCubbin et al., 2006). To our knowledge, these pathways are yet to be tested in relation to the association between resting blood pressure and sensitivity to social pain.
On the surface, the pattern of results might appear inconsistent with an emotional-dampening hypothesis (McCubbin et al., 2014). Resting blood pressure was not related to hostility, to positive or negative affect, or to responses to an acute emotional experience. However, the emotional-dampening hypothesis proposes that resting blood pressure will dampen the most salient emotional response in the environment—a defining feature of experiences of social pain. That is, to the extent that experiences of social pain are more meaningful (e.g., more self-relevant) than general emotional experiences, the current findings could be viewed as consistent with emotional dampening. Further, BFs indicated that although some nonsignificant associations (i.e., those based on p values and a CI excluding 0) were inconsistent with emotional dampening, others suggested that the data were insensitive to detect associations, principally those linking resting SBP with perceived stress (Studies 1 and 2). Future experimental research that measures responses to multiple emotional experiences within participants—for example, Cyberball and tasks traditionally used to test the emotional-dampening hypothesis—may clarify both the emotional-dampening hypothesis and the current theoretical perspective regarding cardiovascular correlates of social and physical pain.
Resting blood pressure measures were taken on one occasion. Future studies could examine blood pressure in daily life aggregated across days for more accurate estimates. Our findings are cross-sectional and therefore limit the ability to make causal conclusions. Understanding of causal direction could be helped by longitudinal research with resting blood pressure as a predictor of real-time sensitivity to social pain (or the reverse) or with pharmacological manipulation of resting blood pressure. For instance, starting, stopping, or altering the dose of antihypertensive medication might show parallel effects on sensitivity to social pain (e.g., reducing resting blood pressure via antihypertensive medication could lead to increased sensitivity to social pain) and could be explored in future clinical trials. On a related note, more than half of the sample from Study 1 reported medication use. Hypothesized associations emerged in Study 1 and were replicated in Study 2 after screening for medication, suggesting that the association is robust and potentially generalizable; accounting for medication status is important in future research. Finally, Study 2 was limited to young adults, and Study 3 was limited by missing demographic information. Future efforts at replication should include a broader age range and complete demographic information. And although the findings of Study 3 help dissociate the type of pain that might be most relevant to resting blood pressure—that is, self-directed social or physical pain, as shown in previous literature (Makovac et al., 2020), as opposed to the pain of strangers—additional research that assesses other experiences of social pain is necessary in order to understand boundary conditions.
A final point relates to the relevance of the current findings for cardiovascular disease, the leading cause of premature morbidity and mortality worldwide (Virani et al., 2020). The findings suggest the testable possibility that less sensitivity to social pain is a biobehavioral risk marker that forecasts hypertension. Whether sensitivity to social pain, as measured in the current studies, also predicts cardiovascular disease outcomes, such as stroke and atherosclerosis (potentially mediated or moderated by blood pressure) when examined simultaneously with conventional psychosocial risk factors (e.g., hostility), however, remains to be tested either cross-sectionally or longitudinally. A second possibility is that sensitivity to social pain is a consequence, rather than a cause, of higher resting blood pressure, in which case it may be an underappreciated psychological manifestation of cardiovascular physiology and pathophysiology that could be monitored and targeted in prevention and intervention efforts. Regardless of the direction of effects, the current results provide a basis to test novel hypotheses about the interassociations between established threats to physical health (hypertension) and social health (social pain).
Supplemental Material
sj-docx-1-pss-10.1177_09567976211061107 – Supplemental material for Resting (Tonic) Blood Pressure Is Associated With Sensitivity to Imagined and Acute Experiences of Social Pain: Evidence From Three Studies
Supplemental material, sj-docx-1-pss-10.1177_09567976211061107 for Resting (Tonic) Blood Pressure Is Associated With Sensitivity to Imagined and Acute Experiences of Social Pain: Evidence From Three Studies by Tristen K. Inagaki and Peter J. Gianaros in Psychological Science
Footnotes
Acknowledgements
We thank J. Richard Jennings for invaluable feedback on hypotheses and methods in this line of work and Sareen Ali, Belen Best, Kerry Owusu, and Sabine Janssen for their assistance with Studies 2 and 3.
Transparency
Action Editor: Eddie Harmon-Jones
Editor: Patricia J. Bauer
Author Contributions
T. K. Inagaki and P. J. Gianaros developed the study concept and designed Studies 2 and 3. Data for Studies 2 and 3 were collected under the supervision of T. K. Inagaki. T. K. Inagaki analyzed the data and drafted the manuscript, and P. J. Gianaros made critical revisions. Both authors approved the final manuscript for submission.
References
Supplementary Material
Please find the following supplemental material available below.
For Open Access articles published under a Creative Commons License, all supplemental material carries the same license as the article it is associated with.
For non-Open Access articles published, all supplemental material carries a non-exclusive license, and permission requests for re-use of supplemental material or any part of supplemental material shall be sent directly to the copyright owner as specified in the copyright notice associated with the article.