



Abstract
The psychophysical laws governing the judgment of perceived numbers of objects or events, called the number sense, have been studied in detail. However, the behavioral principles of equally important numerical representations for action are largely unexplored in both humans and animals. We trained two male carrion crows (Corvus corone) to judge numerical values of instruction stimuli from one to five and to flexibly perform a matching number of pecks. Our quantitative analysis of the crows’ number production performance shows the same behavioral regularities that have previously been demonstrated for the judgment of sensory numerosity, such as the numerical distance effect, the numerical magnitude effect, and the logarithmical compression of the number line. The presence of these psychophysical phenomena in crows producing number of pecks suggests a unified sensorimotor number representation system underlying the judgment of the number of external stimuli and internally generated actions.
Different animal species from diverse taxa discriminate perceived numerosity, the sensed number of objects or events (Agrillo et al., 2017; Benson-Amram et al., 2018; Bortot et al., 2019, 2020; Nieder, 2021; Skorupski et al., 2018). This perceptual ability builds on a primordial, nonsymbolic number estimation system (termed number sense; Burr et al., 2018; Dantzig, 1930; Dehaene, 2011), which is crucial for an animal’s survival and reproductive fitness (Nieder, 2020b). However, animals also need to be able to enumerate motor output when producing a specific number of self-generated actions (Anobile et al., 2021). In the wild, the production of specific numbers of actions has been shown to convey vital information in animal communication systems. For instance, some songbirds are known to utter defined numbers of syllables in their mobbing calls to signal the dangerousness of predators (Suzuki, 2016; Templeton et al., 2005; Templeton & Greene, 2007). Similarly, the males of some frog species match or surpass the number of call syllables of competitors to attract female mating partners (Gerhardt et al., 2000; Rand & Ryan, 1981). Despite its vital importance, the behavioral principles of numerical representation of action are still elusive.
Number production behavior of animals have only rarely been tested experimentally. The few existing studies, however, bear mainly two shortcomings. First, controls for timing behavior during number production were absent, leaving open the possibility that animals performed on the basis of elapsed time rather than number of actions. Second, individual animals were typically trained to perform only one fixed number of actions (the conditioned stimulus, or CS+) but were rarely tested to flexibly produce different numbers of actions on a trial-by-trial basis. Rats and mice, for instance, were trained to press a lever a certain number of times to obtain a reward (Çavdaroğlu & Balcı, 2016; Mechner, 1958). Similarly, macaques learned to move a manipulandum exactly five times (Sawamura et al., 2002). With this approach, a conceptual understanding of number of self-generated actions beyond the conditioned number cannot be addressed. More informative are protocols in which animals flexibly had to produce different numbers of actions. In one of the rare studies pursuing such a protocol, pigeons have been trained to produce specific numbers of (one to six) pecks in response to learned signs as instruction stimuli (Xia et al., 2000). In another study, two chimpanzees have been trained to produce a certain number of cursor movements (from one to six) based on learned signs (Beran & Rumbaugh, 2001). However, in none of these studies were attempts made to control for confounding temporal factors, so non-numerical timing behavior of the animals during number production could not be ruled out. In fact, evidence in pigeons suggests that time is a confounding factor (Tan et al., 2007).
Whether number representations in the sensory and motor domains show the same psychophysical characteristics is currently unknown. Given that perceived number relates to external (exogenous) stimuli whereas goal-directed motor routines are internally (endogenously) generated, the two enumeration mechanisms may differ. After all, mechanistic differences are seen for other exogenous versus endogenous cognitive processes, such as attention (Dugué et al., 2020) and emotion regulation (Kühn et al., 2014). Moreover, the number of sensory events and the number of self-generated actions seem to be represented in partly overlapping but not identical brain areas, which could give rise to different behavioral representations. In human functional imaging, the brain areas that showed activation in motor counting, but not sensory counting, were the supplementary motor area, the left anterior parietal cortex, and the bilateral parietal operculum, irrespective of which body part was executing the movement (Kansaku et al., 2006). Similarly, evidence from monkey electrophysiology suggests differences in neuronal representation of motor enumeration and sensory enumeration. Neurons that were tuned to the number of (one to five) self-generated hand movements in monkeys were found in a confined area in the superior parietal lobule (part of Area 5; Sawamura et al., 2002), and inactivation of this brain area caused specific action enumeration deficits of monkeys (Sawamura et al., 2010). In contrast, neurons in this Area 5 do not respond to numerosity of visual displays (Nieder et al., 2002; Nieder & Miller, 2004). These findings suggest that the number of sensed items and the number of self-generated actions capitalize on different brain areas and neuronal mechanisms, which possibly give rise to distinct behavioral number representations. Alternatively, if number representations in the sensory and motor domains evolved from the same unified cognitive system, the same psychophysical laws witnessed for perceived numerosity should hold for the numerical representation of action (Anobile et al., 2021; Nieder, 2004). Recent psychophysical adaptation studies on humans provide evidence for common mechanisms supporting both the number of externally generated events and self-produced actions (Anobile et al., 2016).
Statement of Relevance
Whereas the laws governing the judgment of perceived numbers of objects by the “number sense” have been studied in detail, the behavioral principles of equally important number representations for action are largely unexplored. We trained crows to judge numerical values of instruction stimuli from one to five and to flexibly perform a matching number of pecks. Our quantitative behavioral data show an impressive correspondence of number representations found in the motor domain with those described earlier in the sensory system. We report that nonsymbolic number production obeys the psychophysical Weber-Fechner law. Our report helps to resolve a classical debate in psychophysics. It suggests that this way of coding numerical information is not constrained to sensory or memory processes but constitutes a general principle of nonsymbolic number representations. Thus, logarithmic relationships between objective number and subjective numerical representations pervade not only sensation but also motor production.
The laws governing the representation of sensed number, originally formulated for sensory intensity discrimination, are well understood. Animals sense numerosity not in a precise way but approximately, such that discrimination performance systematically enhances the more different (or distant) two numbers are (numerical distance effect). In addition, numerical judgments become systematically less precise in proportion to increasing numbers (numerical magnitude effect). Both numerical effects are captured by Weber’s law: the just-noticeable difference (JND), ΔI, divided by the reference value, I, is a constant, c (that is, ΔI / I = c) (Weber, 1846). Consequently, discriminability depends on the ratio of the difference between numbers, not the absolute difference (Dehaene, 1992; Moyer & Landauer, 1967; Shepard et al., 1975). Weber’s law has been shown multiple times for judgments of sensed numerosity across the animal kingdom, from monkeys (Beran, 2012; Brannon & Terrace, 1998; Cantlon & Brannon, 2006; Jones & Brannon, 2012) and birds (Bogale et al., 2011; Emmerton & Renner, 2006; Kirschhock et al., 2021; Rugani et al., 2016; Scarf et al., 2011) to fish (Gómez-Laplaza & Gerlai, 2016; Potrich et al., 2022) and bees (Bortot et al., 2019; Howard et al., 2018).
As a corollary of Weber’s law and the continuously increasing numerical distance (and thus the JND) required to discriminate one number from the next larger one, subjective perception of numbers does not scale linearly with objective number. Rather, the subjective sensation of number, S, is proportional to the logarithm of the objective number, I. This relationship is known as Fechner’s law (S = k * log[I]) (Fechner, 1860). As Fechner’s law is intimately related to Weber’s law, judgments on sensed number are collectively said to obey the Weber-Fechner law. The principles of this law can be seen for animals’ subjective perception of objective numerical magnitudes: Performance accuracy results in bell-shaped performance functions (centered on a target number), which mirrors the numerical distance effect, and the continuing broadening of the functions in proportion to increasing numerical magnitude reflects the numerical magnitude effect. In addition, and due to Fechner’s law, the performance functions are asymmetric when plotted on a linear number scale but become symmetric on a logarithmic number line (for a depiction of these principles, see Nieder, 2020b). Fechner’s law in addition to Weber’s law has also been demonstrated for nonsymbolic number perceptions in animals such as monkeys (Merten & Nieder, 2009; Nieder & Miller, 2003; Piantadosi & Cantlon, 2017) and birds (Ditz & Nieder, 2016; Roberts, 2006).
Here, we address, first, whether crows can flexibly produce numbers of actions when timing strategies are prevented and, second, whether behavioral representations of such behavior resemble processes of sensory number judgments. To this end, we trained crows, corvid songbirds known for their sophisticated behavioral flexibility (Nieder, 2017, 2023), on a well-controlled number production task (Kirschhock & Nieder, 2022). The crows first judged the number of items (from one to five) and then dynamically produced a matching number of pecks. First, the results demonstrate that crows flexibly assess different numbers of self-generated actions when temporal factors during motor production are controlled for. Second, our quantitative analysis of the crows’ performance shows common psychophysical phenomena between sensory and motor numerical cognition, such as the numerical distance effect, the numerical magnitude effect, and the logarithmically compressed number line.
Method
Animals
We trained and acquired data from two male carrion crows (Corvus corone) from the institute’s facility. Crows were housed in small social groups in large indoor aviaries (for details, see Hoffmann et al., 2011). The crows were kept on a controlled feeding protocol during the experiments and earned food as a reward during training. If necessary, food was supplemented after the daily sessions. Water was always provided ad libitum. All procedures were conducted according to the national guidelines for animal experimentation and approved by the national authority, the Regierungspräsidium Tübingen, Germany.
Experimental apparatus
Daily training sessions were conducted in a darkened operant conditioning chamber. The crows were loosely strapped to a wooden perch by leather jesses and placed in front of a 15-inch touchscreen monitor (3M Microtouch; 60 Hz refresh rate). A light barrier was used to ensure the crows maintained a central head position in front of the monitor at a viewing distance of 14 cm. The light barrier consisted of an infrared light emitter/detector fixed on the ceiling of the chamber and a reflector foil attached to the crow’s head. An automated feeder used for reward delivery was positioned below the monitor. Birdseed pellets (Beo Special, Vitakraft) and mealworms (Tenebrio melitor larvae) were used as rewards. Loudspeakers (Visation WB10) for auditory feedback, as well as an infrared camera (Genius iSlim 321R) for observational control, were also installed in the chamber. Presentation of stimuli and collection of behavioral responses was managed by the CORTEX system (National Institute for Mental Health).
Number production task
The two crows were trained on a computerized task to produce a visually instructed number of peck responses (Kirschhock & Nieder, 2022). A trial started with a ready cue (small white circle in the center of the touchscreen) that indicated to the crows that a trial could be initiated. To initiate a trial, the crows had to position their heads centrally in front of the monitor, thereby closing an infrared light barrier. Moving out of this predefined position before the start of the motor execution period terminated the ongoing trial. Once a trial was initiated, an empty gray background circle was displayed for the duration of the baseline period (300 ms). Next, an instruction stimulus (600 ms) cued the number of one to five pecks to produce. After a delay period (1,000 ms), the appearance of a second, smaller gray circle (confirmation stimulus, or “Enter key”; size 11.4 degrees of visual angle) below the empty background circle (now serving as enumeration stimulus; size 26.1 degrees of visual angle) marked the end of the motor planning period and the beginning of the motor execution period. In this motor execution period, the crow had to sequentially produce the cued number of pecks in a defined way. The crow had to produce each unitary response by pecking within 600 ms at the enumeration stimulus. The enumeration stimulus disappeared after each peck, followed by a short and variable waiting period after which the enumeration stimulus would reappear for as often as the crow would continue to add more pecks. The crow signaled it had made the requested number of responses by pecking at the confirmation stimulus (serving as an Enter key). Both types of pecking responses (to the enumeration stimulus and the confirmation stimulus) were accompanied by specific sounds (250-ms duration) serving as auditory feedback for registered responses.
A trial was deemed correct if the number of pecks produced by the crow prior to the confirmation response matched that cued by the instruction stimulus. Correct trials triggered dispensation of a food reward accompanied by a reward tone. If the crow gave a premature confirmation response or exceeded the requested number of enumeration responses by one (n + 1), an error was recorded. If the crow exited the light barrier before the onset of the response period, reacted prematurely during the waiting interval, missed the pecking time interval, or missed the monitor location of the enumeration or confirmation stimuli, the trial was aborted but not counted as error. All errors and trial abortions resulted in the withholding of reward accompanied by a specific sound, a visual feedback signal, and a brief time-out period in which initiation of the next trial was delayed.
As specified next, two instruction stimulus protocols with a standard and a control condition for each numerical value ranging from one to five were used in each session. In addition, two out of three possible temporal arrangements of the motor execution period were used per session. The numerical values, protocols, and conditions were presented in a pseudorandomized and balanced order.
Instruction stimuli
Two numerical presentation protocols that represented values one to five as instruction stimuli were used. The first protocol (dot protocol) showed a numerosity dot display with one to five pseudorandomly positioned black dots; the second protocol (sign protocol) consisted of five different visual shapes (Arabic numerals) that the crows had learned to associate as signs with the number of actions one to five. Both the dot and sign displays were shown on a gray circular background. For both dot and sign stimulus protocols, we used two stimulus conditions (standard and control) to control for non-numerical factors. In the standard dot condition, dot displays consisted of one to five dots of pseudorandomized size (1.2 to 5.5 degrees of visual angle) presented at pseudorandom locations on the gray background circle, with the only requirement that dots were not overlapping or touching. In the dot control condition, total dot area and dot density were kept constant across numerical values. For the sign protocol, black Arabic numerals 1 to 5 of pseudorandom size (15 to 26 points, 2.9 to 4.9 degrees of visual angle) were placed at pseudorandom locations on the background circle. Arial was used as the standard font type; Times New Roman, Souvenir, and Lithograph Light were used as control fonts. To prevent the animal from memorizing or rote-learning individual stimuli, the stimuli for every combination of protocol, condition, and numerosity were generated anew before each session using MATLAB functions (Version R2020b, MathWorks Inc).
Temporal arrangements
The temporal organization of the motor execution period was predefined and controlled by systematically varying the duration of individual wait intervals between two peck responses. This was done to prevent the crows from solving the task using timing strategies. We applied three temporal arrangements: one standard and two control arrangements. In the standard timing arrangement, the duration of each wait interval was chosen pseudorandomly between 300 ms and 1.2 s (in steps of 300 ms). Each of the interval durations had an equal probability per wait interval; therefore, rhythmicity was suspended. Although overall duration of the motor execution period inevitably increased with instructed numerosity, it overlapped between neighboring numerosities. In the first control arrangement (fixed wait-interval arrangement), all wait intervals had a fixed duration of 300 ms. In the second control arrangement (fixed overall-duration arrangement), wait-interval durations varied according to the requested numerosity, such that the total duration of the response period was the same across target number. Therefore, wait-interval durations were shorter for larger numbers and vice versa; that is, trials with instructed number 2 had one 2.8-s wait interval, number 3 had two 1.2-s intervals, number 4r had three 600 ms intervals, and number 5 had four 300 ms intervals. Because trials with numerosity one had no wait interval, these trials had the same temporal organization in all three temporal arrangements. For each session, the standard timing arrangement and one of the two control timing arrangements were presented in pseudorandom and balanced order; the control timing arrangements were alternated daily.
Data analysis
All data analyses were carried out using MATLAB (Version R2020b, MathWorks Inc). Values reported in main text and figures refer to the mean ± standard error of the mean (SEM) if not stated otherwise. SEM was calculated as the standard deviation divided by the square root of sample size.
Overall performance accuracy (percentage correct) was calculated as the number of correct trials divided by the sum of correct and incorrect trials for each session. To construct performance curves (the crows’ response distributions), the relative frequency of number of pecks were calculated for each target number (separately for dot and sign protocols) and averaged over sessions.
We fitted Gaussian bell curves to the performance functions on different numerical scales. Gauss curves were fitted to individual performance curves using the Curve Fitting Toolbox (MATLAB, MathWorks Inc.); the center of the fitted curve was fixed to the respective target number, and all other parameters (width and height) were fitted to minimize the overall residual error. We used four numerical scales: Next to the linear scale, we used two power functions with exponents 0.5 and 0.33, respectively, and the base2 logarithm for nonlinear transformations of the number scale. The goodness of fit (r2) was taken as a measure of symmetry of the crows’ response distributions.
Weber fractions were calculated to assess the JND between two stimuli, that is, produced numbers of pecks. We used the following formulas to calculate the “smaller,” right-hand and the larger, left-hand slope of the performance functions, respectively:
With n being the center, or target number, nS is the number smaller than the target, which the crow discriminated at a 50% rate. Likewise, nL is a number larger than the target number, which is discriminated 50% of the cases.
Results
Controlled numerical production task
We trained two carrion crows (Corvus corone) on a computer-controlled numerical production task that required them to flexibly judge the numerical value of instruction stimuli and to subsequently produce the cued target number via pecking responses (Fig. 1a). Instruction stimuli were presented in two protocols (Fig. 1c): The “dot protocol” comprised one to five dots in a numerosity pattern display cuing for the respective number of pecks; in the “sign protocol,” the crows had learned to associate the Arabic numerals 1 to 5 with the corresponding target number. To prevent the crows from discriminating non-numerical low-level visual features and to promote generalization across appearance, we showed each type of stimulus in two conditions (standard and control conditions; Fig. 1c). For the dot protocol, the standard condition showed dots of variable sizes and at pseudorandom locations, whereas in the control condition, the total dot area and dot density remained constant across numerosities. For the sign protocol, numerals were shown at variable locations and sizes but in different font types between the standard and control conditions.
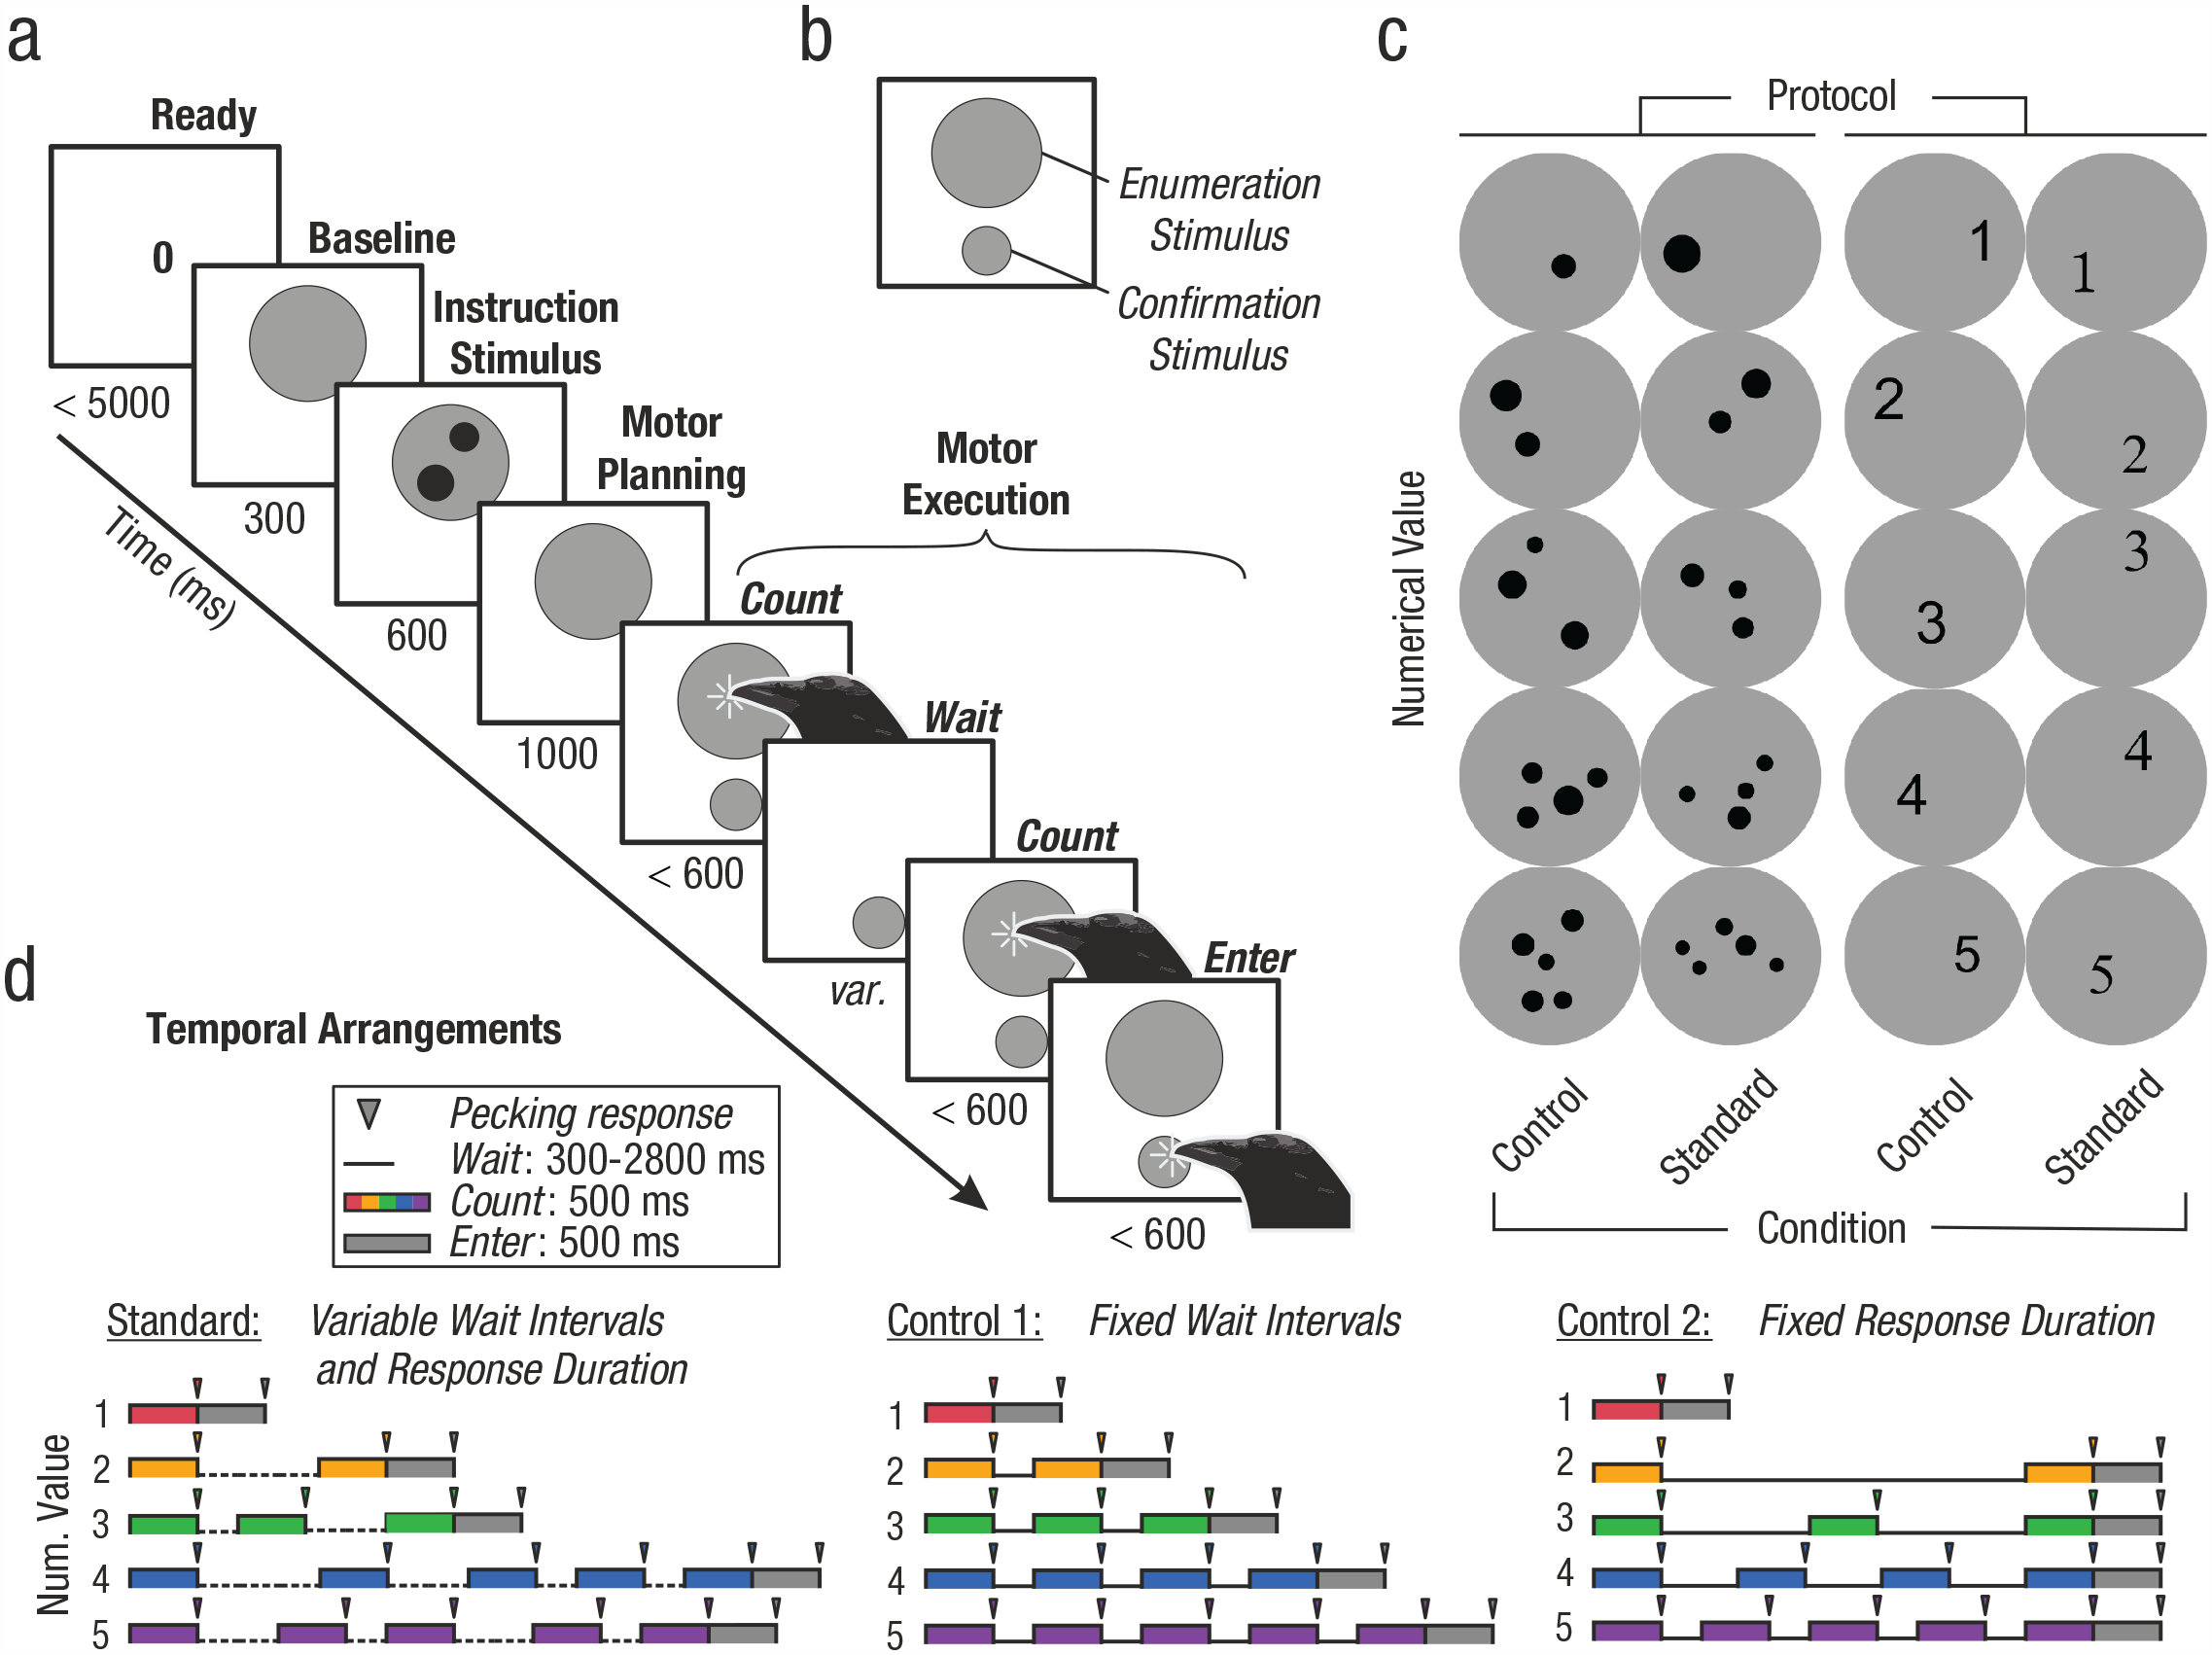
Instructed number production task with stimuli and controls. (a) Computer-controlled number production task on a touch-sensitive monitor. Crows were instructed to flexibly produce one to five pecking responses (target number 2 shown). The crows indicated the end of their response sequence by a final response to the confirmation stimulus. (b) Layout of the touchscreen during the motor execution period. Enumeration stimuli were presented in the top half and the confirmation stimulus in the bottom half of the screen. (c) Exemplary instruction stimuli. Each of the numerical values 1 to 5 was indicated by two stimulus protocols, random dot arrays and Arabic numerals (signs). Standard and control stimuli controlled for non-numerical factors in the dot numerosities (position, size, density, and total dot area) and shape appearance (position, size, and different font types) of the signs. (d) Temporal arrangements of the motor execution period. The use of three temporal arrangements of the motor execution period (standard, Control 1, and Control 2) prevented the crows from solving the task by timing. Pecking responses had to be delivered during systematically varied epochs (see Method for details). The standard and one of the control arrangements were shown pseudorandomly shuffled in each session.
Following the instruction stimulus and a brief planning period, the crows produced the instructed number in the upcoming motor execution period. To do so, the crows had to peck as many times at the touch-sensitive monitor as cued by the instruction stimulus. To ensure discrete and temporally controlled pecking actions, each peck had to be delivered to a spatially and temporally predefined enumeration stimulus presented in sequence (Fig. 1b). Each peck to an enumeration stimulus counted as one response and was followed by a brief waiting period. To prevent the crows from using timing strategies to solve the task, we structured the presentation of enumeration stimuli within the motor execution period according to three predefined temporal arrangements (Fig. 1c). For the standard temporal arrangement, individual wait intervals between enumeration stimuli were of pseudorandom duration. Thus, rhythmicity of the response period was suspended. The Control 1 temporal arrangement consisted of wait intervals of equal length to prevent execution periods that systematically varied with produced number. Finally, the Control 2 temporal arrangement presented wait intervals of different durations so that all overall response periods for target numbers 2 to 5 were equally long. Thus, both control temporal arrangements controlled for the overall response period duration and the duration of individual pecking/wait intervals. Importantly, the crows themselves signified the endpoint of their pecking sequence, that is, the last peck amounting to the instructed target number, by a final peck to a confirmation stimulus (Enter key below the enumeration stimulus in Fig. 1b).
Number production performance
We tested the crows over 71 (Crow 1) and 55 sessions (Crow 2), respectively. Mean accuracy (percentage correct) was 74.7% ± 0.6% for Crow 1 and 72.0% ± 0.5% for Crow 2. On average, Crow 1 completed 410 trials and Crow 2 completed 310 trials per session. We derived behavioral performance functions over sessions for each target number separately for dot and sign protocols (Fig. 2). The curves depict the probability of produced numbers of pecks in response to each instructed target number (color coded). Peak values of performance functions show the frequency of trials in which the number of pecks matched the target numbers. The off-peak values signify the error rates of incorrectly produced numbers, that is, too few or too many pecks.
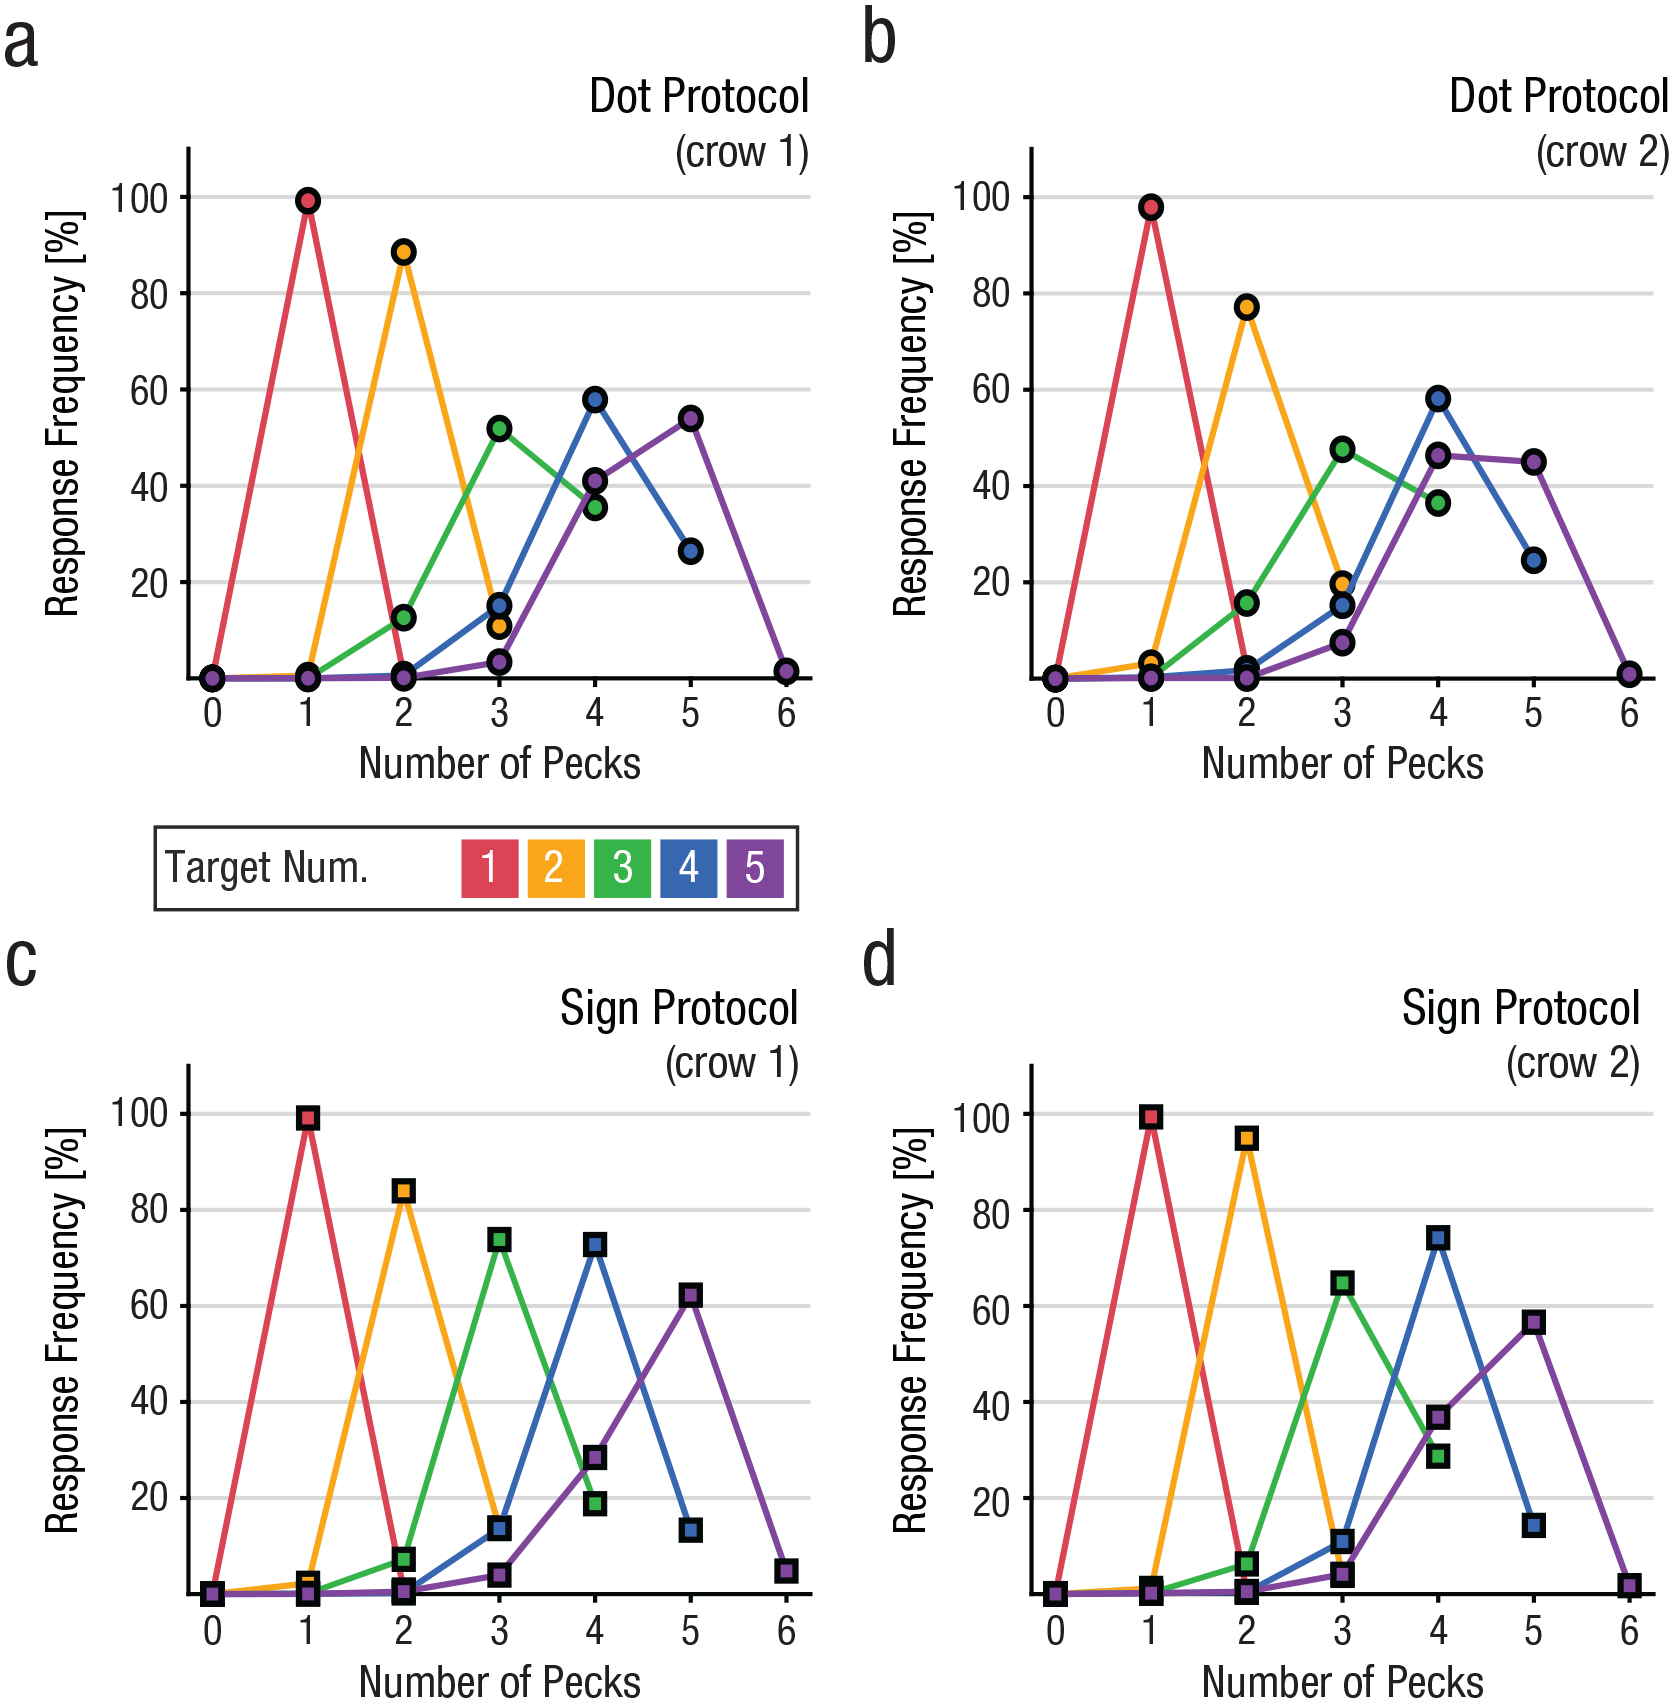
Number production behavior of (a, c) Crow 1 and (b, d) Crow 2 on (a, b) dot and (c, d) sign trials. For every instructed target number, indicated by line color, behavioral response functions are plotted. Peak values correspond to the correct production rate of target number, whereas off-peak values demark rate of enumeration errors, that is, too few or one exceeding response to the enumeration stimulus prior to the “enter peck.” Note that curves are truncated at n + 1 for target number n due to the task design. Error bars denoting the standard error of the mean are too small to be displayed.
Overall, both crows proficiently produced the instructed, that is, correct, number of pecks for each target number (Fig. 2). The crows exhibited 10% better overall accuracy in the sign protocol (78%) (Figs. 2c and 2d) compared with the dot protocol (68%) (Figs. 2a and 2b), t(125) = −19.43, p < .001 (paired t-test for both crows). This difference was also found for each crow separately, t(70) = −11.53, p < .001; t(54) = −20.56, p < .001 (paired t-tests for Crow 1 and Crow 2, respectively).
In both protocols, error rates were highest close to the instructed number but decreased systematically with increasing numerical distance, thus giving rise to bell-shaped production performance functions reflecting the psychophysical numerical distance effect. Further, the production performance functions became systematically wider for larger instructed target numbers as a signature of the numerical magnitude effect.
Scaling of numerical representation of action
We quantified which scaling scheme underlies the numerical representation of action. To that aim, we focused on performance to target numbers 2, 3, and 4. Target numbers 1 and 5 were excluded from following analyses due to distorting border effects, that is, 1 always being the smallest and 5 always being the largest instructed number, respectively. First, we analyzed error rates. The Weber-Fechner law predicts that error rates to numbers smaller and larger than the target number n are unequal. More specifically, at a given numerical distance of −1, it should be easier to discriminate numbers smaller than the target number (n – 1) compared with numbers larger than the target number (n + 1). We tested this prediction separately for the dot and the sign protocols with data from both crows combined. We found that error rates for n – 1 were significantly smaller than error rates for n + 1 for both dot and sign protocols: Z = −14.8, p < .001; Z = −9.76, p < .001; n = 378 for three target numbers and 126 sessions (Wilcoxon signed-rank tests for dot and sign protocols, respectively). In the dot protocol, error rates for n – 1 were on average 15% lower than n + 1 error rates. In the sign protocol, error rates for n – 1 were on average 8% lower than n + 1 error rates. As a reflection of this effect, the performance functions decay more strongly for numbers smaller than the target number (n – 1) (Fig. 2). This significant difference in n – 1 versus n + 1 error rates also held for each of the crows individually for dot and sign protocols: Z = −11.0, p < .001; Z = −6.54, p < .001; n = 213, for dot and sign protocol of Crow 1, respectively; Z = −9.92, p < .001; Z = −7.35, p < .001; n = 165, for dot and sign protocol of Crow 2, respectively (Wilcoxon signed-rank tests).
In addition to error rates, we analyzed the crows’ bell-shaped performance functions. When plotted on a linear number scale, the performance functions were asymmetric, with shallower slopes for numbers larger than the respective target number than for numbers smaller than the target number. This asymmetry was present in both the dot (Fig. 3a) and sign protocol (Fig. 3b; see also individual curves in Fig. 2). However, when the same performance functions were plotted on a logarithmically compressed number scale, the distributions were more symmetric (Figs. 3c and 3d). To quantify this effect, we explored whether linear or nonlinearly compressed scaling models provided a superior fit to the performance functions. For that, we plotted the behavioral tuning functions along four different number scales (with increasing compression): a linear scale, a power function with an exponent of 0.5, a power function with an exponent of 0.33, and a logarithmic (log2) scale. Next, we fitted a Gaussian normal distribution as a standard symmetric peak function to the measured data to evaluate the symmetry of the behavioral functions. From the Gauss fits, we derived the goodness-of-fit value r2. We reasoned that the scale that better describes the data would result in more symmetric performance distributions and thus better fits with higher r2 values.

Mean response functions of (a, c) dot and (b, d) sign protocols on (a, b) linear and (c, d) logarithmic number scales. Average response curves of both crows plotted in the same layout as in Figure 2. Bottom panels contain identical behavioral response values as top panels but plotted on a nonlinearly (log2 scale) compressed number line. For target numbers 2 to 4, Gauss curves (red, mean curve; light red, standard error of the mean [SEM]) were fitted separately on the two scales (see Method for details). Error bars denoting the SEM are too small to be visible.
The goodness-of-fit values (r2) were significantly different for the four different scaling schemes and for both dot and sign protocols separately (Figs. 4a and 4b), χ2(3) = 361.71, p < .001; χ2(3) = 74.92, p < .001 (Friedman tests for dot and sign protocol, respectively). This difference also held for individual crows, χ2(3) = 222.97, p < .001; χ2(3) = 17.87, p < .001; for dot and sign protocol of Crow 1, respectively; χ2(3) = 139.96, p < .001; χ2(3) = 72.91, p < .001; for dot and sign protocol of Crow 2, respectively (Friedman tests). The goodness-of-fit values were lowest for the linear scale but increased with the degree of compression of nonlinear scales. In the dot protocol, mean r2 values for the linear scale, the power(0.5) scale, the power(0.33) scale, and the log2 scale were 0.906, 0.938, 0.944, and 0.946, respectively. In the sign protocol, mean r2 values for the linear scale, the power(0.5) scale, the power(0.33) scale, and the log2 scale were 0.951, 0.965, 0.968, and 0.968, respectively.
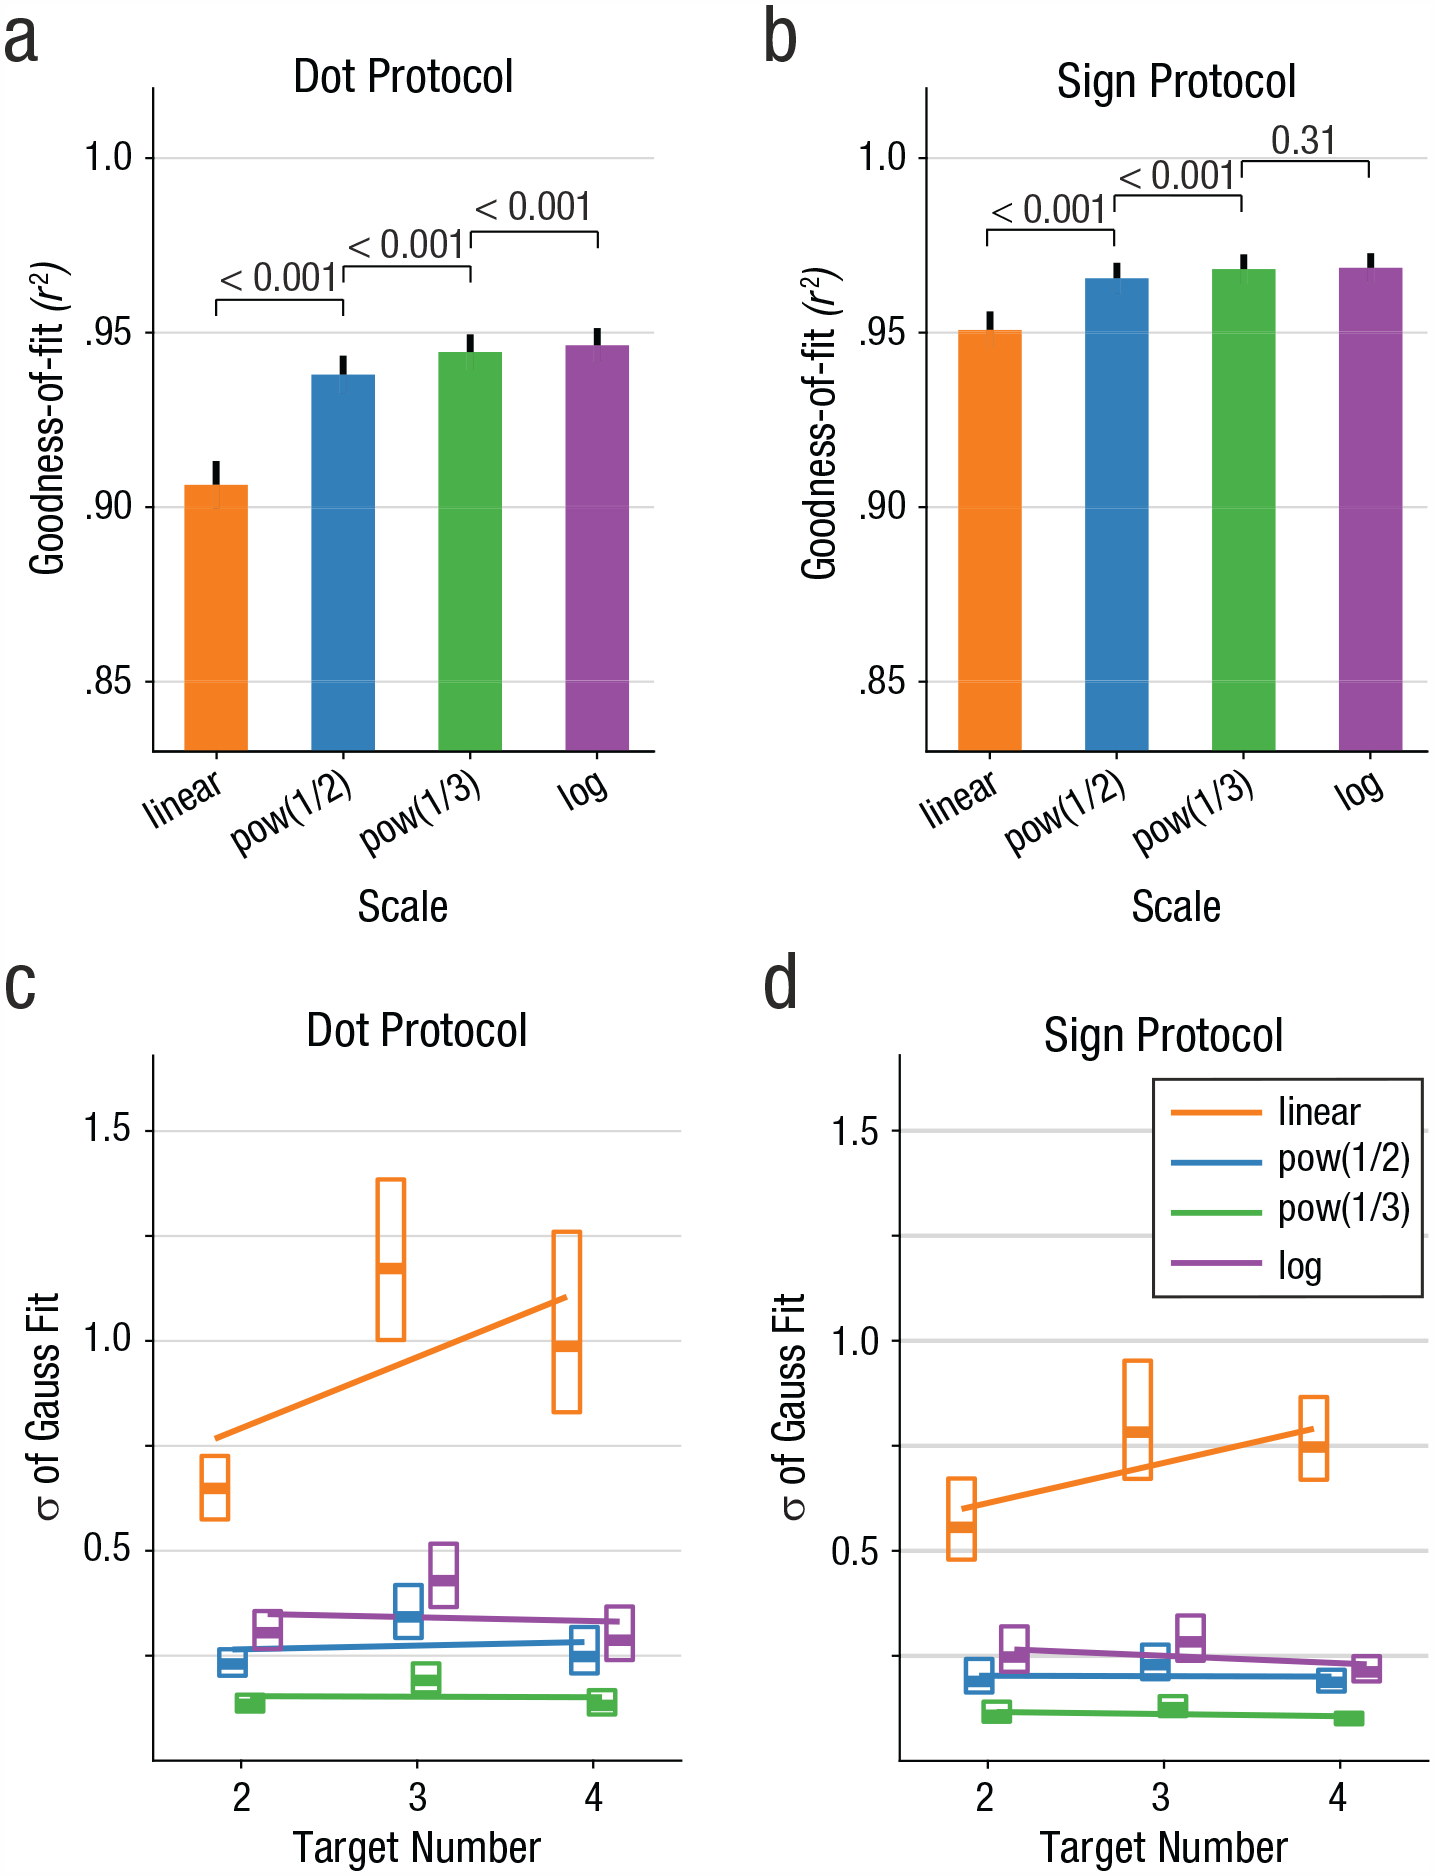
Number line scaling parameters. (a) Comparison of goodness of fit of the Gauss curves fitted to the performance functions plotted on different scales for the dot protocol. Average goodness-of-fit values (r2) of fitted Gaussians for different numerical scaling schemes are shown (bars show mean values, error bars the standard error of the mean). Values above horizontal bars represent p values of pairwise comparisons (Wilcoxon signed-rank tests). (b) Goodness of fit of the Gauss curves to the data plotted on different scales for the sign protocol. Same layout as in Figure 4a. (c) Widths of Gaussians fitted to behavioral functions as a function of target number for different scales in the dot protocol. Distributions of widths (σ of fitted Gauss curves) for each target number 2 to 4 on numerical scaling schemes (indicated by color) are plotted as box plots (box outlines the interquartile range Q1 to Q3; the thick, horizontal line indicate the median values). Colored lines show the linear fit of Gauss width as a function of target number for the respective scaling scheme. (d) Widths of Gaussians fitted to behavioral functions as a function of target number for different scales in the sign protocol. Same layout as in Figure 4c.
Post hoc pairwise comparisons of data from both crows combined showed that the r2 values for each of the scaling schemes were significantly different from one another: linear versus power(.5), Z = −15.76, p < .001; linear versus power(.33), Z = −14.78, p < .001; linear versus log2, Z = −14.19, p < .001; power(.5) versus power(.33), Z = −10.35, p < .001; power(.5) versus log2, Z = −9.34, p < .001; power(.33) versus log2, Z = −3.15, p = .002 (Wilcoxon signed-rank tests). The same was true when we tested the r2 values of the linear versus all nonlinear scaling schemes, individually for each crow and the dot and the shape protocol separately: for Crow 1 in the dot protocol, linear versus power(.5), Z = −10.36, p < .001; linear versus power(.33), Zˆ= −9.91, p < .001; linear versus log2, Z = −9.61, p < .001; and the sign protocol, Z = −4.70, p < .001; Z = −4.05, p < .001; Z = −3.71, p < .001 (same order of preceding tests); as well as for Crow 2 in the dot protocol, Z = −9.26, p < .001; Z = −8.82, p < .001; Z = −8.63, p < .001; and sign protocol, Z = −6.21, p < .001; Z = −5.79, p < .001; Z = −5.48, p < .001 (all Wilcoxon signed-rank tests). The goodness of fit and therefore the symmetry of the performance functions significantly increased from the linear to the power(0.5) to the power(0.33) and finally to the log2 scale.
The variance of the distributions for each numerosity is predicted to be constant by nonlinear coding models of numerosity (Dehaene, 2001; Dehaene & Changeux, 1993; van Oeffelen & Vos, 1982). Indeed, the variance of the performance functions (i.e., parameter sigma, σ, of the Gauss fit to the performance functions) increased with target number (slope of linear fit in dot protocol = 0.195; in sign protocol = 0.107) but stayed essentially constant for the three nonlinearly compressed scales: dot protocol, power(0.5) = 0.016, power(0.33) = 0.002, log2 = −0.001; sign protocol, power(0.5) = 0.000, power(0.33) = -0.008, log2 = −0.018 (Fig. 4c). In sum, the crows’ performance data for numerical representation of action are better described by increasingly nonlinearly compressed scales as opposed to a linear scale.
Weber fractions
Last, we analyzed Weber fractions (JND divided by target number, ΔI / I = c) that quantify the discriminability of produced number functions. If number production obeys Weber’s law, the Weber fractions remain constant across target numbers. To account for the asymmetrical performance functions, we calculated Weber fractions separately towards smaller (WS, Fig. 5a) and for larger (WL, Fig. 5b) numbers relative to the target number. This was again done for the middle target numbers 2 to 4 and for both stimulus protocols. (The WL fraction for target number 3 in the dot protocol had to be derived from extrapolation due to the accuracy for number 4 not falling below 50% of the maximum value; see Fig. 3A and Method.) The average Weber fractions were 0.33 (±0.09) and 0.24 (±0.06) for dot and sign protocol, respectively. WL and WS values were quite similar across the analyzed number range and for both stimulus protocols.
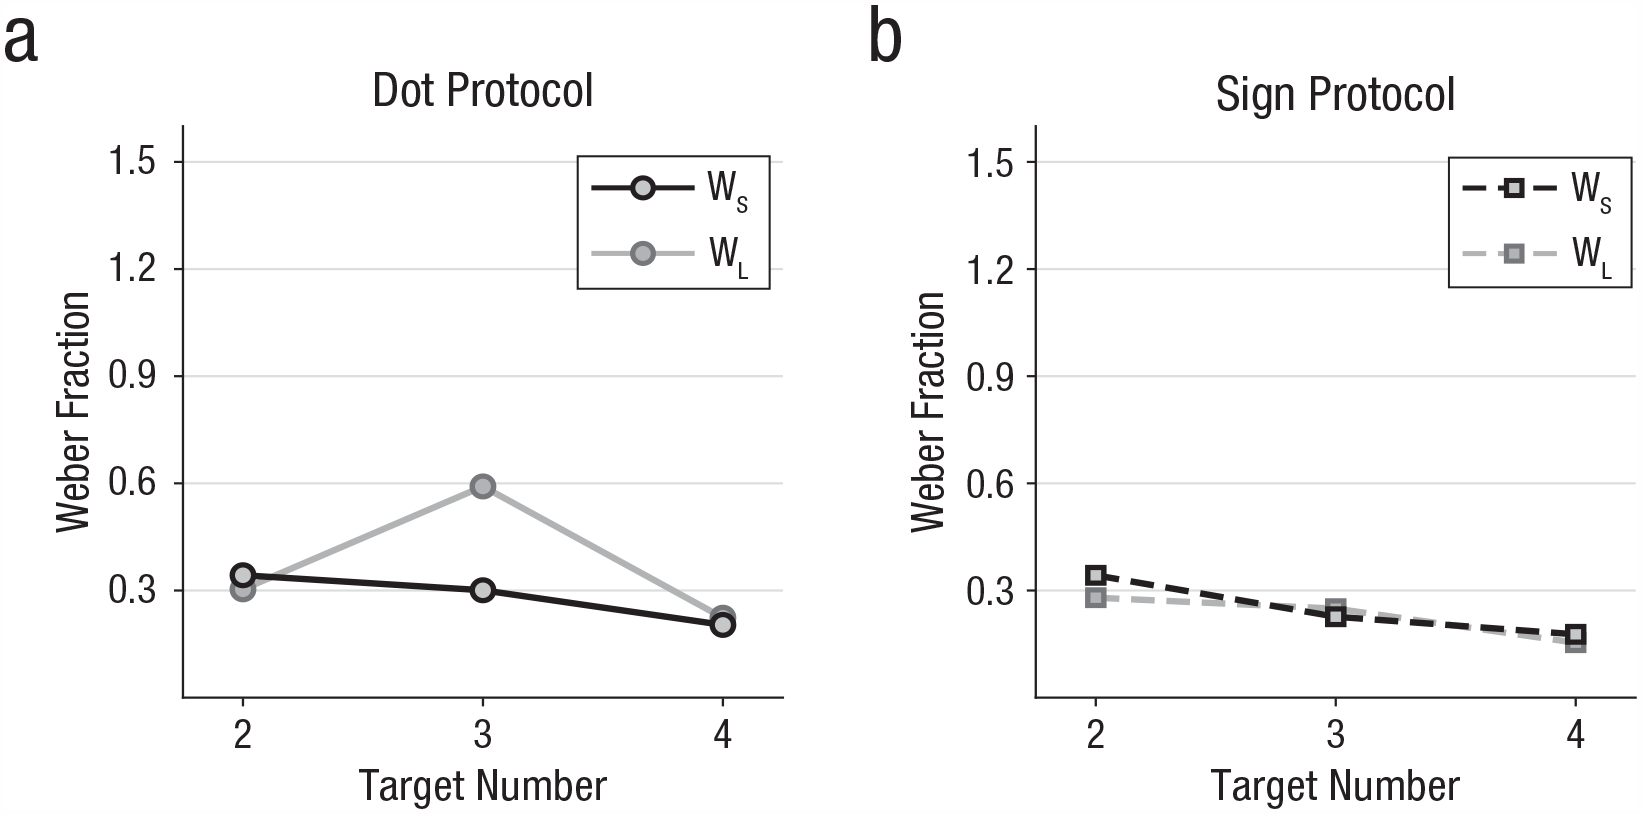
Weber fractions for (a) dot and (b) sign protocols. Mean Weber fractions for smaller (WS, black) and larger (WL, gray) target number discriminations, separately for both stimulus protocols.
Discussion
In the current study, we addressed two main questions. We first asked whether crows can flexibly produce cued numbers of self-generated actions when timing of action sequences is prevented. Our data demonstrate that crows can cognitively control the production of different instructed numbers of actions beyond simple stimulus-response conditioning. Moreover, preventing the crows from exploiting temporal factors during motor production had no detrimental effect, indicating that performance was genuinely based on numerical information rather than timing. The finding that the crows performed better in the sign condition relative to the dot condition may be explained by reduced variability in numerical input; extracting numerosity from dot arrays may be more error-prone compared with extracting it from associated signs because the signs are perceptually less ambiguous. So, the production of the number of actions seemed to have benefited from the increased precision of number-conveying signs.
The second main question was whether the psychophysical characteristics during the production of the number of actions would resemble those found for perceived number. We found evidence for fundamentally similar representations. Both the observed numerical distance and magnitude effects are clear signatures of Weber’s law in numerical representation of action in crows. In addition, the superiority of a logarithmically compressed number line for the characterization of crows’ ability to produce number of self-generated actions agrees with Fechner’s law. This is a novel finding even with respect to human nonsymbolic motor enumeration (of key presses), which has been shown to follow Weber’s law, whereas Fechner’s law has never been explored (Cordes et al., 2001; Whalen et al., 1999). Both Weber’s and Fechner’s law are clear signatures of the approximate number system (ANS). We thus conclude that the ANS is underlying the crows’ number production behavior.
With the current study in which non-numerical factors were controlled, the signatures of the ANS could be retraced for numerical representation of the crows’ actions. As expected by Weber’s law, the crows’ Weber fractions (0.33 for the dot and 0.24 for the sign protocol) were virtually constant for the small number of pecks produced within each protocol. The crows showed higher precision for the sign protocol, as indicated by the smaller Weber fraction. This enhancement could be due to a more precise assessment of the instruction number enabled by signs as compared with noisy numerosities in dot displays. The Weber fractions for numerical representation of action are comparable in magnitude to those obtained for discriminating sensory numerosities in the same species. Crows trained in a delayed match-to-numerosity task to discriminate the visual numerosity 1 to 5 in dot patterns show a Weber fraction of 0.49 (Ditz & Nieder, 2015), which was reminiscent of the value of 0.31 for rhesus macaques (Nieder, 2020a; Nieder & Miller, 2003). When discriminating the visual numerosity of sequentially presented dots, crows showed a Weber fraction of 0.59 (Ditz & Nieder, 2020), which as higher compared with the value of 0.31 for macaques (Nieder, 2012, 2020a). The crows’ number production performance is also similar to the performance of adult humans enumerating key presses in a nonsymbolic fashion. When humans are prevented from symbolic counting by saying “the” at every press or produce target numbers of key presses at rates that make symbolic counting impossible, a coefficient-of-variation (CV, the ratio of the standard deviation and mean) value of 0.2 is seen (Cordes et al., 2001; Whalen et al., 1999). It should be noted, however, that the CV is only a proxy for the Weber fraction, as the CV assumes symmetric performance functions on a linear number scale. Our logarithmic scaling results in crows calls for a reevaluation of human nonsymbolic motor counting, including the formal model suggested for the mapping of numerical symbols to mental magnitudes (Cordes et al., 2001; Whalen et al., 1999). Although the observed effects were very robust across individual crows, future work is needed to test whether these findings generalize to a larger population of crows or other animals.
Fechner’s law has previously been observed when different animal species sense and perceptually judge number, for example, pigeon (Roberts, 2006), crow (Ditz & Nieder, 2016), macaque (Merten & Nieder, 2009), and baboon (Piantadosi & Cantlon, 2017). The logarithmic relationship for approximately sensed numbers is present even in humans: children prior to formal number training in school (Siegler & Booth, 2004; Siegler & Opfer, 2003), indigenous people without formal number training (Dehaene et al., 2008), and adults prevented from symbolic counting (Merten & Nieder, 2009) all show the nonlinearly compressed number line. Moreover, computational networks representing numerosity also show logarithmic scaling for the representation of sensed numerosity (Dehaene & Changeux, 1993; Nasr et al., 2019; Nasr & Nieder, 2021).
Given that crows show a logarithmic compression for representing perceived numerosities (Ditz & Nieder, 2016), the logarithmic relationship for the number of pecks could reflect crows assessing numerosity in instruction dot displays before reproducing the matching target number. To exclude this possibility, we included learned signs as a second set of instruction stimuli. Even though performance was slightly more precise, the nonlinear scale compression was still clearly detectable with signs as instruction stimuli. This argues that the Fechner law signature is a genuine feature of number production. The presence of these psychophysical principles in crows during number production suggests that a unified sensorimotor number representation system processes the numerosity of external stimuli but also internally generated actions. Psychophysical findings based on numerosity adaptation aftereffects came to a similar conclusion of a close interaction between numerosity perception and production in humans (Anobile et al., 2016, 2020; Togoli et al., 2020).
Collectively, these findings argue that the nonsymbolic sensorimotor number representation system is deeply rooted in phylogeny and probably inherited by Homo sapiens. The advantages of such a coding scheme based on the Weber-Fechner law may be twofold: First, it allows animals (and humans) to better discriminate very dissimilar numbers, and clearly dissimilar numbers are behaviorally more relevant. For instance, the dangerousness of a predator is similar for four or five syllables in a chickadee’s alarm call but drastically different for only one syllable (Templeton et al., 2005). Second, discrimination of absolute numerical differences in small numbers of actions compared with large ones is enhanced. In the previous example, the signaled dangerousness or a predator by four or five syllables is negligible, whereas the dangerousness indicated by one versus two syllables is vital. Because communication depends on production of efficient signals by a sender, both advantages are vital. Exploration of the scaling schemes of numerical representations is not just a statistical exercise; it helps to reveal relationships that are crucial to understand animal decision-making (Akre & Johnsen, 2014; Glazier, 2021; Nieder, 2020a).
Footnotes
Transparency
Action Editor: Sachiko Kinoshita
Editor: Patricia J. Bauer
Author Contributions
M. E. Kirschhock contributed to data curation, formal analysis, investigation, methodology, resources, software, validation, writing the original draft, and review and editing. A. Nieder contributed to conceptualization, data curation, formal analysis, funding acquisition, investigation, methodology, project administration, supervision, validation, visualization, writing the original draft, and review and editing. Both authors approved the final manuscript for submission.
