



Abstract
A major challenge in assessing psychological constructs such as impulsivity is the weak correlation between self-report and behavioral task measures that are supposed to assess the same construct. To address this issue, we developed a real-time driving task called the “highway task,” in which participants often exhibit impulsive behaviors mirroring real-life impulsive traits captured by self-report questionnaires. Here, we show that a self-report measure of impulsivity is highly correlated with performance in the highway task but not with traditional behavioral task measures of impulsivity (47 adults aged 18–33 years). By integrating deep neural networks with an inverse reinforcement learning (IRL) algorithm, we inferred dynamic changes of subjective rewards during the highway task. The results indicated that impulsive participants attribute high subjective rewards to irrational or risky situations. Overall, our results suggest that using real-time tasks combined with IRL can help reconcile the discrepancy between self-report and behavioral task measures of psychological constructs.
Keywords
Self-report and behavioral task measures are among the most frequently used methods for assessing psychological constructs. A prevalent issue across multiple domains such as impulsivity (Sharma et al., 2014), self-control (Saunders et al., 2018), and risk preference (Frey et al., 2017) is that self-report and behavioral task measures consistently show weak correlations with each other, even when they are assumed to tap the same construct (Dang et al., 2020). Weak associations between measures of the same construct foster ambiguity and confusion in assessment, making it challenging to integrate findings across different measures.
We address this problem using impulsivity as a test bed because it is one of the psychological constructs that is notably affected by the weak association between self-report and behavioral measures. Extensive studies of impulsivity in relation to mental disorders and maladaptive behaviors (Whiteside & Lynam, 2001) have utilized a range of self-report and behavioral task measures that are believed to assess the same construct termed “impulsivity.” However, large-scale investigations and meta-analyses have consistently reported weak correlations between different measures of impulsivity (Bernoster et al., 2019; Cyders & Coskunpinar, 2012; White et al., 1994). There is no consensus on whether different measures of impulsivity represent the same construct, and researchers continue to develop their own models and measures of impulsivity (Sharma et al., 2014).
A widely accepted approach is to view impulsivity as a multidimensional construct with distinct aspects that do not necessarily overlap. For example, MacKillop et al. (2016) suggested that measures of impulsivity can be categorized into three distinct domains: impulsive choice, impulsive action, and impulsive personality traits. According to this categorization, behavioral task measures, which reflect impulsive choice (e.g., delay-discounting task; Green & Myerson, 2004) and impulsive action (e.g., go/no-go task; Hartung et al., 2002), do not need to correlate with self-report measures that typically reflect trait impulsivity (e.g., Barratt Impulsiveness Scale; Patton et al., 1995). A competing explanation for the inconsistency between self-report and behavioral task measures of impulsivity is that they tap the same construct, but the association between them are obscured by differences in measurement methods (Cyders & Coskunpinar, 2012). Self-reports measure individuals’ overall tendencies over a longer duration of time (e.g., for the past week/month), whereas laboratory behavioral tasks usually measure specific behaviors in some discrete states (e.g., go and no-go conditions in the go/no-go task) in highly controlled settings at the time of testing. Thus, behavioral task measures may capture state-specific phenomena that only partly reflect self-reported tendencies of behaviors across situations in real life.
Building on this methodological explanation, we postulate that a laboratory task conducted in real time that mimics real-life situations would yield impulsivity measures that are strongly correlated with self-reported impulsivity. Specifically, we developed and implemented a real-time driving task called the “highway task” (Fig. 1) in which participants control a car on a simulated highway to drive as fast as possible without crashing into other cars. The performance in the task may reflect the traits that contribute to reckless driving, which is frequently associated with impulsivity (Hatfield et al., 2017). Unlike traditional trial-based laboratory tasks with a predefined list of discrete states, the highway task provides trajectories of states that continuously interact with participants’ actions (e.g., accelerating, changing lanes), with a number of possible states being virtually boundless (for details, see the Method section). Behaviors in this task can be a better reflection of trait impulsivity than traditional behavioral task measures because the task environment resembles complex real-world situations in which impulsive behaviors occur (Verdejo-Garcia et al., 2021).
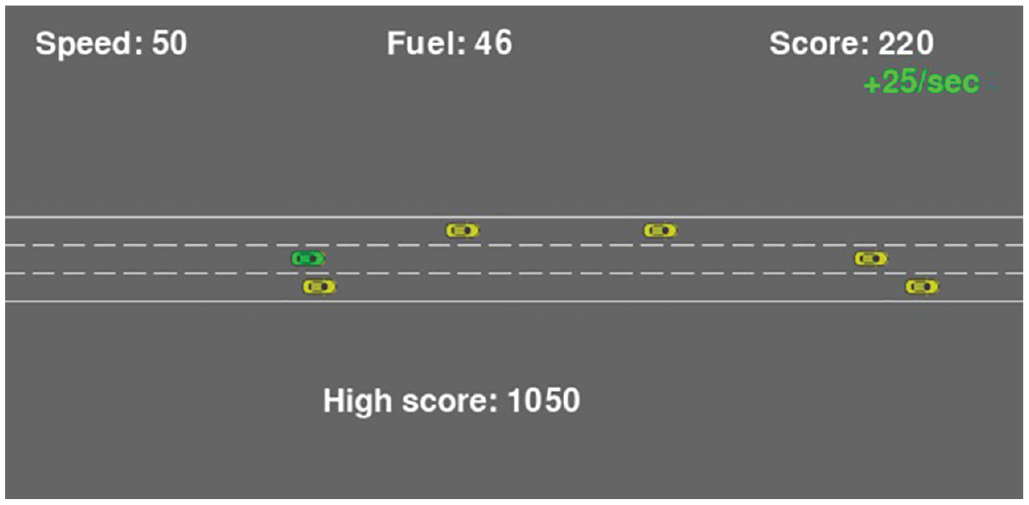
Screenshot of the highway task. Participants control the green car to drive as fast as possible without crashing into the yellow cars. Score per second increases with speed. An episode (or trial) continues until the car crashes or runs out of fuel. High score indicates the highest score achieved in an episode during the highway task.
A challenge is how to describe complex data from the highway task beyond simple summary statistics of observed behaviors (e.g., mean speed, number of crashes). Computational modeling is widely recognized as a valuable tool for assessing neurocognitive characteristics underlying behaviors (Palminteri et al., 2017). However, traditional computational models may not be readily applicable to data from real-time tasks (e.g., virtual reality, arcade-style games) because such models are not typically designed to describe multidimensional behaviors with an immense number of possible states inherent in a real-time task.
Statement of Relevance
An important question in neuropsychological assessment is whether findings in laboratory experiments represent how people function in everyday life. In psychological and neuroscience research, measures derived from behavioral tasks often exhibit weak association with self-reported measures of the same construct, presumably because of the limited capacity of simplistic laboratory tasks in capturing dynamic behavioral patterns in real-world environments. Here, we show that a real-time task that captures real-world dynamics of impulsive behaviors provides valid measures of impulsive traits, with an inverse reinforcement learning algorithm integrated with deep neural networks revealing dynamic changes of subjective rewards during the task. This highlights the importance of using realistic tasks and advanced algorithms for characterizing individual traits.
We pose this problem as an inverse reinforcement-learning (IRL) problem in which the learning algorithm infers the reward function that underlies observed behaviors (Arora & Doshi, 2021). The objective of IRL is opposite to the conventional “forward” approach of reinforcement learning (RL; Sutton & Barto, 2018); IRL learns a reward function on the basis of observed behaviors without any observed reward, whereas RL learns a behavioral policy on the basis of observed rewards. Recent advances in algorithmic techniques have made IRL well suited for explaining behaviors in complex environments (Fu et al., 2017; Wulfmeier et al., 2015). One of the breakthroughs is the use of deep neural networks (DNNs), which can represent complex associations between states and actions in real-time tasks (Mnih et al., 2015) to approximate complex, nonlinear reward functions (Wulfmeier et al., 2015). By integrating DNNs with IRL (i.e., deep IRL), we are not restricted to any particular functional form of rewards for observed behaviors. Once learned from the observed data, DNNs can calculate rewards for given states and actions. The rewards derived by IRL can be interpreted as a participant’s internal reward or preference, making it a valuable tool for modeling human decision-making (Zhang et al., 2018).
In the current study, we aim to find indicators of impulsivity in the highway task by comparing IRL-inferred reward functions among participants with varying levels of trait impulsivity. To our knowledge, this is the first study to use deep IRL to capture individual differences in a psychological construct among human participants. Although a few studies have modeled human decision-making using simpler IRL algorithms using a restricted class of functional forms (Zhang et al., 2018), no other studies have utilized deep IRL to investigate individual differences in reward functions in real-time tasks.
If the behaviors exhibited in the highway task align with the hypothesized trait impulsivity, we would expect the task performance and the rewards inferred by IRL to correlate with measures of trait impulsivity. In our experiment, we assessed trait impulsivity using the Barratt Impulsiveness Scale (BIS; Patton et al., 1995), which is a widely used self-report measure of impulsivity. The experiment consisted of three behavioral tasks, including the highway task and two traditional behavioral tasks measuring impulsivity: delay discounting and go/no-go tasks. Whereas the latter two tasks measure impulsive choice and impulsive action, respectively, the highway task was chosen to examine its correlation with the BIS score compared with other measures.
In the following analysis, we evaluate the credibility of IRL in explaining individual differences in behavior by assessing its accuracy in predicting actions on the highway task. We then investigate the IRL-inferred reward for each state in the task as well as the real-time trajectory of the rewards to find indicators of impulsivity. Finally, the behavioral performance measures (e.g., task score) of the highway task and the output of the IRL are used together to predict the BIS score.
Open Practices Statement
All data, code, and materials for this study have been made publicly available on GitHub and can be accessed at https://github.com/CCS-Lab/project_highway_irl_public. This study was not preregistered.
Method
Participants
Forty-seven undergraduate and graduate students (26 males and 21 females) aged 18 to 33 years from Seoul National University participated. A Bayesian power analysis determined the number of participants (for details of the power analysis, see the Supplemental Material available online).
Procedure
Participants completed one questionnaire (the BIS) and three behavioral tasks (highway task, delay-discounting task, and go/no-go task) in a dimly lit room. They could take a break between the tasks as long as they desired. An experimenter gave instructions to the participants at the beginning of each task. The questionnaire was controlled by Qualtrics on a web browser. Behavioral experiments were controlled by a Python script. The experiment was approved by the Seoul National University Institutional Review Board.
Barratt Impulsiveness Scale
We used a Korean version (Lee et al., 2012) of the BIS (Patton et al., 1995) to measure trait impulsivity. Participants answered the questions on a four-point scale from 1 (rarely/never) to 4 (almost always/always), with 4 indicating the most impulsive response. The BIS score was calculated by summing the scores across questions. The subscales of BIS (i.e., motor, nonplanning, and attentional impulsivity) were the sums of the scores across subsets of questions (for the analysis using the BIS subscales, see the Supplemental Material).
Highway task
The highway task was built on a collection of OpenAI Gym (Brockman et al., 2016) environments for driving tasks (Leurent, 2018). Task display and action input were controlled by the pygame package in Python (Version 3.9.7). The goal of the highway task is to drive the green car on the screen as fast as possible without crashing into the yellow cars (for the task display, see Fig. 1). Participants control the green car by pressing the arrow keys on the keyboard. The left and right arrow keys decrease and increase the speed by 10 distances/s, respectively. The up and down arrow keys move the green car to the upper (left) lane and the lower (right) lane, respectively. The score in an episode increases by
Traditional behavioral tasks
For details of the delay-discounting task and the go/no-go task, see the Supplemental Material.
IRL algorithm
We inferred the reward functions underlying the trajectories of states and actions in the highway task using adversarial IRL (AIRL; Fu et al., 2017), which is an IRL algorithm that achieves state-of-the-art performance. IRL is a challenging problem because multiple policy and reward functions can explain a given set of observed behaviors, leading to ambiguity in the learned reward function (Arora & Doshi, 2021). AIRL is built on maximum-entropy IRL (Wulfmeier et al., 2015; Ziebart et al., 2008), which mitigates the ambiguity in a solution by identifying a single reward function that maximizes the entropy of the policy derived from the rewards (Snoswell et al., 2020). AIRL also addresses the complexity of behaviors in a real-time task by using DNNs to approximate nonlinear reward functions, whereas many previously proposed IRL methods (e.g., Abbeel & Ng, 2004; Ziebart et al., 2008) assume linear reward functions that might be too simplistic in complex tasks (for details of the algorithm, see the Supplemental Material).
Results
We first assessed the validity of the highway task by correlating task-performance measures with the BIS scores, which we used as the benchmark measure of trait impulsivity in the current study. The focus is on the total BIS score rather than the three subscales of the BIS. Almost all measures that correlated with one of the BIS subscales also correlated with the total BIS score throughout the analyses in the current study (for results with the BIS subscales, see the Supplemental Material). Using the total BIS score was a comprehensive approach for identifying indicators of impulsivity while making the interpretation of the results straightforward.
We derived five intuitively important and easily interpretable performance measures from the highway task: two indicators of risky driving in real life (mean speed and mean distance from the closest car ahead; Boyce & Geller, 2002), frequencies of two events related to the task goal (number of overtakes and number of crashes), and the mean task score, which assesses overall performance in the task (for score calculation, see the Method section). The credibility of correlation was assessed using the Bayes factor (BF10) in a Bayesian correlation test (Wetzels & Wagenmakers, 2012). Following the classification scheme in Wagenmakers et al. (2018), we interpreted BF10 values of 1 through 3, > 3 through 10, > 10 through 30, > 30 through 100, and > 100 as anecdotal, moderate, strong, very strong, and extreme evidence, respectively.
Among the five measures, only the mean task score (M = 1,183, SD = 363, range = 533–2,174) showed strong statistical evidence for the Pearson correlation with the BIS score (r = −.46, BF10 = 28.41), suggesting that the overall task performance improves as the BIS score (i.e., impulsivity) decreases (see Fig. 2). The mean speed (r = .08, BF10 = 0.21), the mean distance from the car ahead (r = .08, BF10 = 0.21), the number of overtakes (r = −.35, BF10 = 2.96), and the number of crashes (r = .15, BF10 = 0.3) did not show substantial evidence for correlation with the BIS score. This suggests that focusing on specific aspects of behaviors might not be sufficient to elucidate impulsivity in a complex behavioral task. The task score, which showed the strongest correlation, was also reliable within the task. The split-half reliability between the scores in the first half and the second half of the task assessed by the intraclass correlation coefficient (Koo & Li, 2016) was .72, which is acceptable.
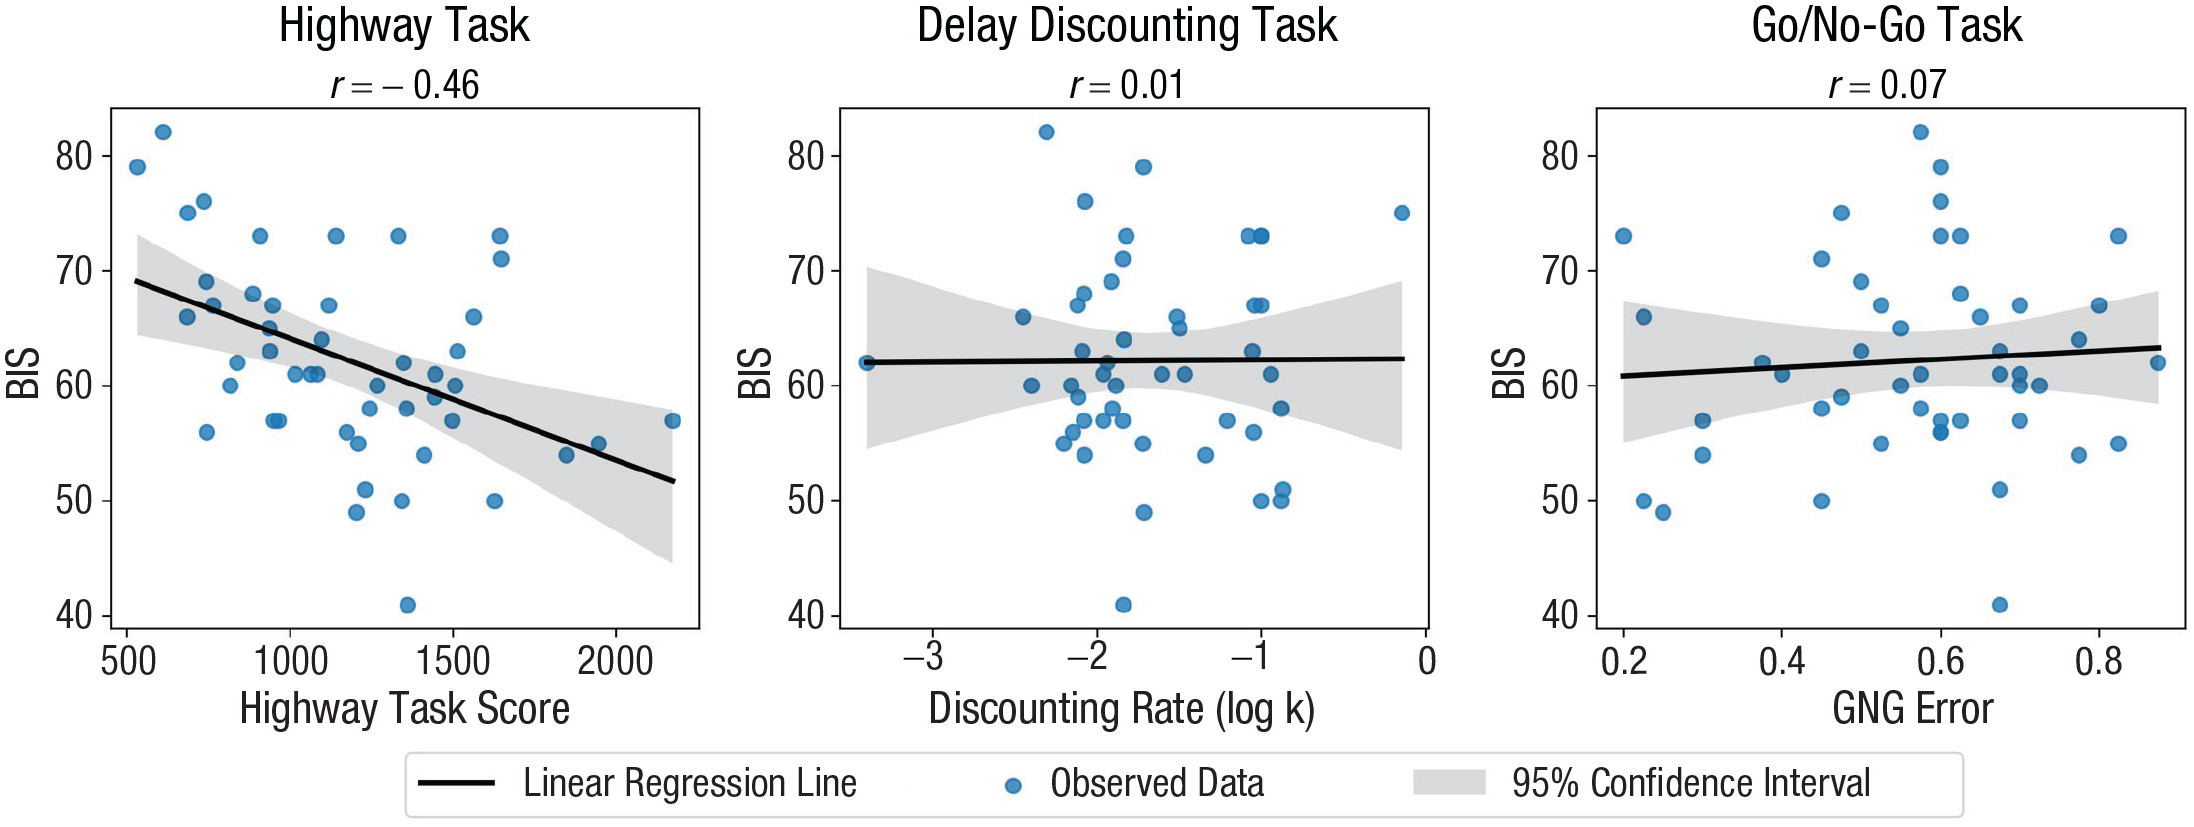
Correlation between the BIS score and behavioral task measures of impulsivity. BIS = Barratt Impulsiveness Scale.
The BIS score did not correlate with widely used behavioral measures of impulsivity from the two traditional laboratory tasks—the delay-discounting rate parameter (log k; for a description of the model, see the Supplemental Material) in the delay-discounting task (r = .01, BF10 = 0.182) and the no-go error rate in the go/no-go task (r = .07, BF10 = 0.203). A Bayesian statistical test for comparing correlation coefficients (Mulder & Gelissen, 2023) indicated that the correlation coefficients between the BIS score and the two traditional measures differed from the correlation coefficient between the BIS score and the highway-task score (BF10 = 3.53). The two traditional measures also showed weak associations with the five measures derived from the highway task in general. Only two combinations, the no-go error rate with the mean speed (r = −.38, BF10 = 4.87) and the number of overtakes (r = −.37, BF10 = 4.27), exhibited moderate evidence for correlations (for the full correlation matrix, see Fig. S1 in the Supplemental Material).
The results support our hypothesis that a real-time task in a realistic environment would better reflect impulsivity than traditional trial-based tasks. The association between the performance on the highway task and the BIS score suggests that aspects of impulsivity observed in behavioral tasks (e.g., impulsive choice and action) may not be inherently distinct from self-report measures of trait impulsivity.
IRL model evaluation
In the preceding analysis, the BIS score correlated with an overall performance in the highway task but not with a more specific summary of behaviors (e.g., mean speed). We hypothesized that reward functions inferred by IRL might provide state-specific indicators of impulsivity, which are not captured by simple summary statistics. IRL inferred a reward function for each individual on the basis of the individual’s observed trajectories of behaviors in the highway task (for details of the algorithm, see the Supplemental Material). We investigated the individual differences in the reward functions learned via IRL to identify latent indicators of impulsivity.
Before interpreting the reward functions, we evaluated the models trained by IRL in terms of goodness of fit and interpretability. The model fit was assessed by comparing observed participants’ actions with artificial agents’ actions generated by the behavioral policies of IRL. If IRL learned the reward functions that accurately explain the data, the actions produced by the agent should closely resemble the participants’ behaviors. Figure 3a shows the mean accuracy of the IRL agents in predicting five possible actions in the highway task: moving up, no action (i.e., no-op), moving down, acceleration, and deceleration. The accuracy was much higher than the chance level (mean accuracy = .64; chance-level accuracy = .2) for all actions except the deceleration.
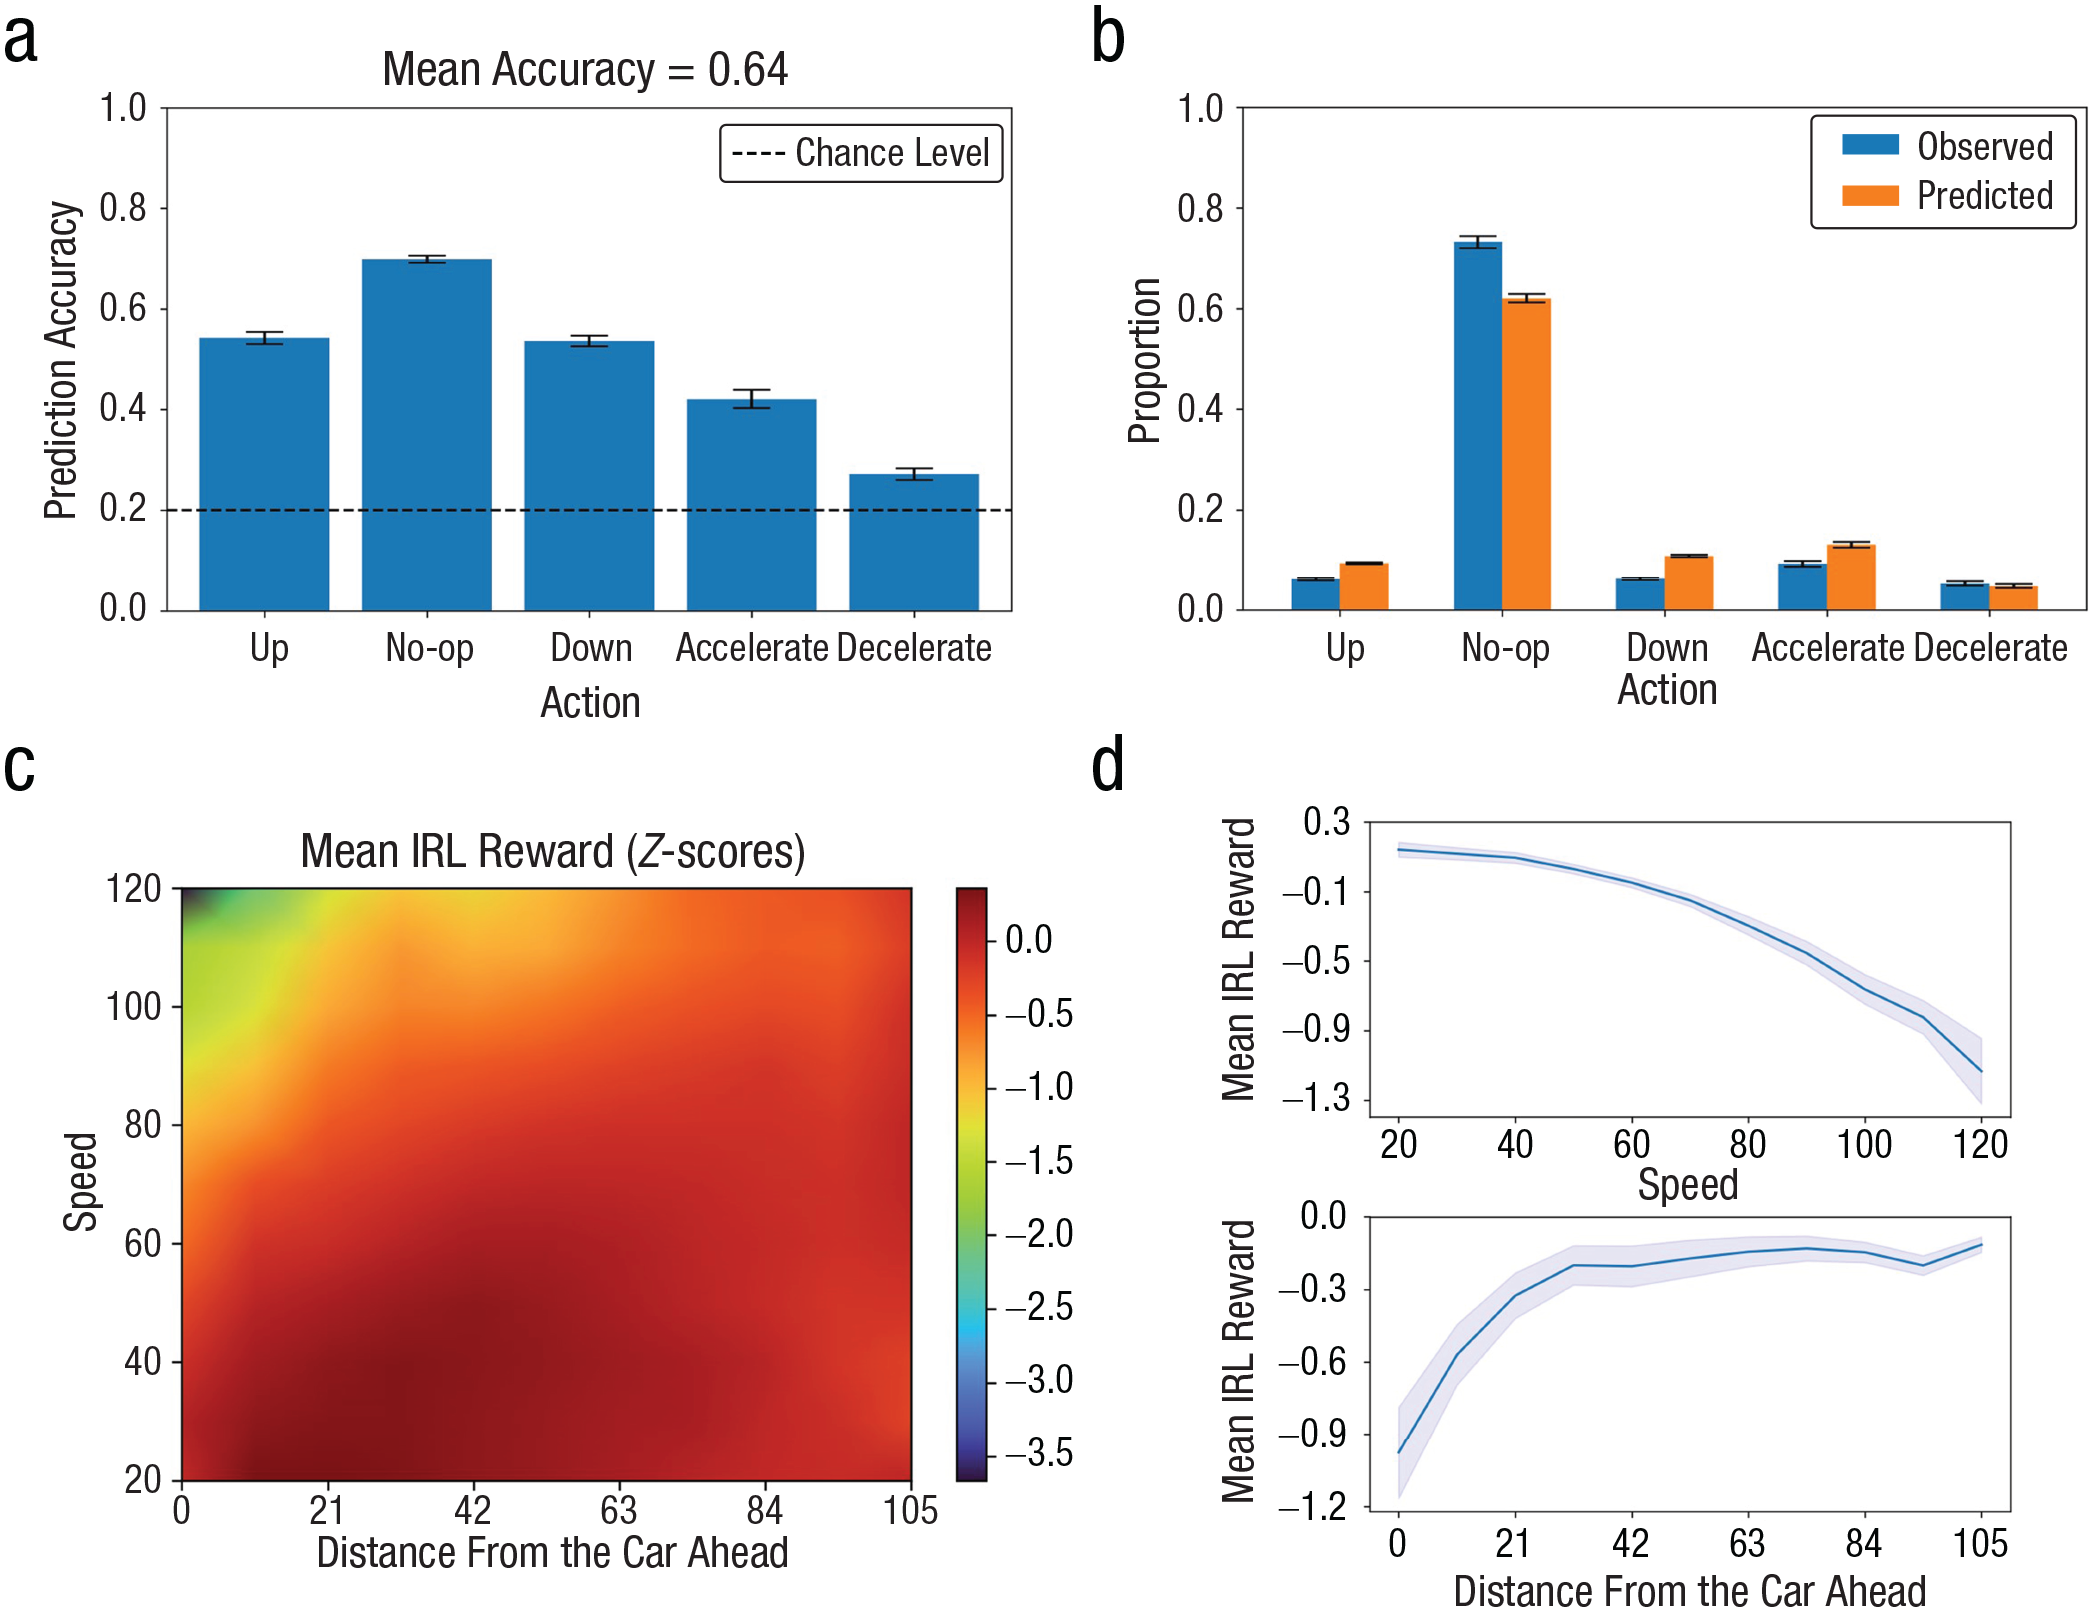
Performance of the IRL algorithm. The graphs show the (a) mean accuracy of the five possible actions produced by the IRL agents, (b) mean proportions of actions in the observed data (blue) and the action trajectories generated by the IRL agents (orange), (c) mean IRL rewards in a state space defined by the combination of the speed of the green car (y-axis) and the distance from the closest car in the same lane (x-axis), and (d) mean IRL rewards marginalized over the speed and distance axes. The error bars in (a) and (b) and the blue areas in (d) indicate standard errors of the means. IRL = inverse reinforcement learning.
The IRL agents also showed similar proportions of actions throughout the action trajectory (Fig. 3b) to observed human actions. A noticeable difference between the IRL agents and the participants was that the participants showed a higher mean proportion of no actions. Cross et al. (2021) found comparable differences in actions between humans and artificial agents trained by a forward RL. In their study, the policy learned via deep Q-learning (Mnih et al., 2015) showed a lower proportion of no actions in Atari games (classic video games such as Pong and Space Invaders) compared with human participants. The authors postulated that humans are more inclined to abstain from taking action because of metabolic costs and physical constraints (e.g., response speed). Although the IRL agents learn from human demonstrations that reflect constraints on human behaviors, they might not replicate infrequent inaction because of fatigue or inattention in situations in which the participant typically took action.
The similarity between the participants’ actions and those of the IRL agents suggests that the reward functions derived from IRL reflect subjective rewards underlying observed behaviors. We then assessed whether the IRL reward functions were sensible and interpretable by visually examining the reward functions. The DNNs trained by IRL approximated subjective rewards for all possible states in the task. The state in the task was defined as a combination of 11 manually annotated features: the speed of the own car, the lane in which the own car is located, the speed of other cars in each of the three lanes (three features for three lanes), the distance from the closest car ahead in each lane (three features), and the distance from the closest car behind in each lane (three features). Figure 3c illustrates the mean reward function (averaged across participants) in a simplified state space. To visualize and interpret reward functions in a feasible way, we used mean rewards across the two intuitively important features selected in the task-performance analysis: own speed (Fig. 3c, y-axis) and the distance from the closest car ahead in the own lane (Fig. 3c, x-axis). The high-reward states (i.e., dark red area) in the reward function suggests that the participants generally favored driving at a low to moderate speed (20−60) and a close to moderate distance (10.5−63) from the closest car ahead. This reflected a rational strategy of avoiding a crash while attempting to overtake a car ahead (i.e., decreasing the speed when the distance between the own car and the car ahead is small). By contrast, the state with the smallest distance and the highest speed was associated with extremely low rewards in that the state would likely result in a crash in the next step. The propensity to avoid a crash, which is the most punishing event in the task, is also reflected in the reward functions marginalized over the speed and distance axes (Fig. 3d). The mean reward tended to increase with the distance from the car ahead and decrease with the speed, suggesting that the participants generally used a safe strategy.
The results suggest that IRL successfully inferred sensible reward functions from the participants’ behaviors as we proposed. Nonetheless, our primary objective was to identify indicators of impulsive behaviors that may deviate from rational strategies in the highway task. To achieve this goal, we tested the correlation between the BIS score and the IRL reward within the simplified state space shown in Figure 3c. In this analysis, both the speed and the distance were divided into 11 equally spaced intervals, resulting in an 11 × 11 discretized state space. The mean IRL rewards within four cells in the discretized state space showed statistical evidence for correlation with the BIS score. A higher BIS score (i.e., increased impulsivity) corresponded to higher rewards for apparently irrational states: maximum speed (120) at close distances (0–21) and relatively low speed (50) at far distances (74–84; r = .35–.39, BF10 > 3; for the correlation coefficients across the state space, see Fig. S2 in the Supplemental Material).
Analysis of IRL reward trajectories
The reward function generated by IRL provides a simplified representation of how the participants’ behaviors were interpreted, but it does not depict changes in rewards over time. A real-time task involves trajectories of states and actions. The reward functions inferred by IRL can map these states into reward trajectories that reveal real-time changes in rewards around significant events. We investigated the reward trajectories and hypothesized that there might be indicators of impulsivity specific to a particular point in time during an event.
The analysis of reward trajectories focused on two salient events in the task: overtaking and crashing. These events are closely related to the task goal of achieving the highest possible score by quickly overtaking other cars without crashing into them. Video replays of task performance with a real-time display of the IRL reward revealed noticeable changes in rewards at the moments of overtaking and crashing (for a link to a video replay, see the Supplemental Material). This implies that the IRL algorithm identified these events as particularly critical. A subsequent analysis of reward trajectories indicated that IRL rewards during overtaking and crashing moments reflected participants’ impulsivity.
The moments of overtaking and crashing were manually specified in the state space. Overtaking was defined as the moment at which a car from an adjacent lane went behind the participant’s car. The distances from other cars ahead and behind the participant’s own car were the state features used to identify overtaking moments. Further, two types of overtaking were distinguished: “active” overtaking, which occurred within 1 s of changing lanes; and “passive” overtaking without a lane change. The screenshots at the bottom of Figure 4 depict an example of each event. Active overtaking is more hazardous than passive overtaking because changing lanes for overtaking at a close distance can lead to a collision with a car ahead. We hypothesized that success in this risky behavior would be highly rewarding for impulsive individuals. A crash was straightforward to define because it was the moment at which the distance from a car ahead became zero.

Reward trajectories before and after overtaking moments. The red points on the lines indicate the time points at which the rewards credibly correlated with the BIS score (BF10 > 3). The pictures along the bottom are examples of passive and active overtaking in the highway task; red arrows illustrate the movement trajectories of the own (green) car. BIS = Barratt Impulsiveness Scale; BF = Bayes factor.
Figure 4 shows the reward trajectories before and after overtaking (−3 to 1 s from the onset). To visually compare the reward functions between the participants with high and low impulsivity, we grouped the participants into two categories on the basis of their BIS scores: a “high-BIS” group and a “low-BIS” group (i.e., participants in the highest and lowest quartiles of the BIS score, respectively). This grouping was used solely for visually representing the reward trajectories; it was not used for statistical comparisons between groups. Statistical analysis was performed by correlating the reward value at each time point with the BIS score, using the data from all participants.
The reward trajectories for passive overtaking (Fig. 4a) did not differ between the high- and low-BIS groups, with the IRL rewards showing no correlation with the BIS score at any of the 21 time points (−3 to 1 s with a 0.2-s interval). By contrast, active overtaking revealed noticeable differences in the rewards between low- and high-BIS participants (Fig. 4b). Compared with the low-BIS group, the high-BIS group showed a more rapid increase in IRL rewards before overtaking. Statistical evidence supported the correlation between the BIS score and the IRL reward at −1.8 to −1.2 s (r = .46 and BF10 = 29.5 using the mean rewards across the four time points) and −0.2 s (r = .38, BF10 = 5.6) from the moment of active overtaking (red dots in Fig. 4b show the time points). The positive correlations suggest that impulsive participants favored the states with opportunities for active overtaking within a brief time frame (−1.8 to −1.2 s), as well as the moment just before (−0.2 s) successfully accomplishing it.
Reward trajectories for overtaking are likely to reflect the participants’ intention because participants should overtake as many cars as possible to maximize the task score. Another salient event, crashing, is different in that it is an abrupt and unintentional event that should be avoided. Therefore, the analysis of crashing focused on how the participants reacted shortly before a crash to avoid it. We classified the reward trajectories for crashing into three types on the basis of the action immediately before a crash: no action, lane changing, and deceleration. Acceleration was not considered because it rarely occurred (1.3%).
For each type of reward trajectory, we tested the correlation between the BIS score and the reward values at 11 time points (−2 to 0 s from a crash with a 0.2-s interval). Only one specific occasion, the moment of crashing in which the participants decelerated, showed statistical evidence for the correlation (r = .38, BF10 = 4). Impulsive participants (i.e., high-BIS group) heavily discounted the reward for deceleration immediately before (−0.2 to 0 s) a crash, whereas nonimpulsive participants (i.e., low-BIS group) showed relatively steady rewards until the occurrence of a crash (for the reward trajectories for crashing, see Fig. S3). This suggests that impulsive participants disliked the states in which they had to decelerate to avoid crashing.
To summarize, the rewards inferred by IRL provided specific indicators of impulsivity as we hypothesized. The correlation between the rewards and the BIS score was selective yet sensible and interpretable. The results suggest that IRL can identify specific instances when participants exhibit impulsivity in real-time tasks, which may not be apparent in the summary of behaviors.
Regression analysis with indicators of impulsivity
The preceding analyses found several indicators of impulsivity, one from a performance measure (i.e., task score) and others from rewards inferred by IRL. The variables that respectively correlate with the BIS score raise a question of whether using them altogether would help explain individual differences in impulsivity. To compare the informativeness of different types of variables, we predicted the BIS scores across individuals with regression analysis (i.e., lasso; Tibshirani, 1996) using performance measures in the highway task and IRL measures. Performance measures in the highway task included the score, mean speed, mean distance from the car ahead, number (n) of overtakes, and number (n) of crashes. In the models that used IRL rewards, only the rewards that correlated with the BIS score were included. They were the mean of the rewards for the subset of states that correlated with the BIS score in the two-dimensional state space depicted in Figure 3c (IRL speed × distance), mean of the rewards marked by red points in the reward trajectory for active overtaking (IRL overtaking), and the reward for deceleration at the moment of a crash (IRL crash).
Figure 5 shows the results from lasso, which was conducted using the glmnet (Friedman et al., 2010) and easyml package (Ahn et al., 2017) in Python. Model prediction was evaluated by the correlation between predicted and observed values of the BIS score in the test set. The histograms in Figure 5 illustrate the distribution of the correlation coefficients. The performance measures in the highway task showed a correlation similar to the correlation between the task score and the BIS score (Fig. 5a; r = .48 vs. .46), with the task score explaining most of the variance (see beta coefficients depicted on the right-hand side of Fig. 5). The selected variables from the IRL reward function were better than the performance measures at predicting the BIS score (Fig. 5b; r = .72). Finally, a model with both performance measures and IRL measures did not show a better correlation score than the “IRL-only” model (Fig. 5c; r = .72), suggesting that the behavioral performance measures do not explain additional variance in the BIS score beyond the variance explained by IRL rewards.

Model fit and beta coefficients of the lasso models that predicted the BIS score using different independent variables. The histograms show the distributions of the correlation score, which is the correlation coefficients between observed and predicted values of the BIS score. The graphs on the right depict the beta coefficient for each variable. The error bars represent mean ± 1.96 SD intervals of the beta coefficients. BIS = Barratt Impulsiveness Scale.
Discussion
The lack of correlation between self-report and behavioral task measures of psychological constructs has long been a puzzle. We hypothesized that this discrepancy may be attributed to the simplicity of traditional behavioral tasks rather than to behavioral task measures assessing aspects of impulsivity that are inherently distinct from self-reported trait impulsivity. Our findings regarding impulsivity demonstrate that measures derived from a real-time behavioral task do indeed correlate with a relevant self-report measure. This suggests that behavioral task measures can represent individual traits measured with a self-report questionnaire if the task offers a wide range of states in which participants can exhibit diverse behaviors as they do in real-world situations.
The novelty of the current study stems from using a deep IRL algorithm to extract participants’ reward functions and individual differences in a real-time task. Past studies that associated impulsivity with driving behavior in real-world and simulated environments typically focused on simple summary statistics of behaviors such as speeding, crashing, and traffic violations (Bıçaksız & Özkan, 2016; Jongen et al., 2011), which often showed weak correlations with measures of impulsivity (Hatfield et al., 2017). However, we found stronger indicators of impulsivity from IRL rewards than from summary statistics (e.g., mean speed, number of crashes). This suggests that IRL offers more than just a descriptive analysis because the reward functions can provide insights into participants’ characteristics that may not be apparent in their behaviors.
The successful application of IRL in this study highlights the potential of IRL as a modeling framework for addressing the discrepancy between behavioral task measures and self-report measures using real-time tasks. The measures derived from IRL outperformed the simple performance measures in predicting the BIS score in the regression analysis (Fig. 5), suggesting that a real-time task may not fully utilize its capacity to reflect a self-reported trait if the analysis method does not align with the complexity of the task.
Black-box machine learning models, which include DNNs in the current IRL algorithm (Fu et al., 2017), have demonstrated high predictive performance but often lack interpretability in their predictions (Rudin, 2019). This absence of explanatory power has restricted the use of black-box models in human-behavior research, in which explanation is as important as prediction (Yarkoni & Westfall, 2017). IRL addresses this issue by providing each participant’s rewards, which can be interpreted similarly to subjective values in computational models of decision-making (e.g., Kable & Glimcher, 2007). Participants would choose actions of the highest subjective values (or IRL reward) or actions leading to the states with the highest subjective values. This approach enhances the interpretability of the model, making it more suitable for studying human behaviors.
Having behavioral task measures of trait impulsivity might help address some concerns about self-report measures. Concerns regarding the credibility of self-report measures exist because of potential response biases, which include responses influenced by social desirability, a consistent response tendency toward affirmative or negative responses, and a propensity for extreme or midpoint responses (Furnham & Henderson, 1982). In a naturalistic paradigm such as the highway task, participants are less likely to mask their traits or intentionally influence the assessment because they are not directly questioned about their real-life tendencies and behaviors.
Although we used the BIS score to assess trait impulsivity in the current work, it might not comprehensively represent all aspects of trait impulsivity. Trait impulsivity, as measured by self-report questionnaires, might exhibit multiple facets. Factor analyses of self-report measures of impulsivity often produce multiple factors (Sharma et al., 2014; Whiteside & Lynam, 2001), with some factors not aligning with any subscale of the BIS (e.g., sensation seeking). Future research may use other questionnaires (e.g., Whiteside & Lynam, 2001) to associate additional facets of impulsivity with measures obtained from the highway task or other real-time tasks.
Future research should also assess the validity of the highway task with clinical populations, addressing the significant challenge of a lack of behavioral tasks with clinical utility in mental health (Ahn & Busemeyer, 2016). A naturalistic paradigm such as the highway task is a great candidate given that the task is emotionally engaging and easily understandable because of its real-life parallels. Our follow-up study aims to investigate whether patients with psychiatric disorders characterized by impulsivity (e.g., substance use disorders, attention-deficit hyperactivity disorder) exhibit reduced performance scores and altered IRL reward functions during the highway task compared with healthy individuals.
A remaining question is whether the rewards inferred by IRL truly represent the internal rewards experienced by participants as hypothesized. A promising approach to address this question would be to investigate the associations between reward functions learned via IRL and brain activities related to reward (or value) processing. Rewards inferred by IRL might correspond to the representation of subjective values of predicted outcomes in the brain, which has been shown to correlate with functional MRI activity in regions such as the orbitofrontal cortex (Gottfried et al., 2003), ventromedial prefrontal cortex (Paulus & Frank, 2003), and ventral striatum (Kable & Glimcher, 2007). Predicting real-time changes in brain activities in these areas using the IRL rewards would help interpret IRL reward functions as subjective value functions that underlie human decision-making. This approach would also validate the use of IRL in understanding the relationship between rewards and their neural correlates.
The current study focused on impulsivity measures, but our approach can be applied to other real-time tasks assessing different constructs (Anguera et al., 2013). The use of the highway task aligns with recent studies using realistic and real-time tasks to enhance the ecological validity of neuropsychological assessment (Robertson & Schmitter-Edgecombe, 2017). The adoption of real-time tasks and data has increased because recent technological advances (e.g., virtual reality, mobile devices) have facilitated experiments in realistic settings (Parsons, 2015). Our work suggests that deep IRL serves as a practical modeling framework that enables researchers to fully utilize complex data from real-time tasks without being restricted to simple descriptive analysis. Reward functions inferred by a deep IRL algorithm might reflect participants’ subjective rewards or intentions in the task, which are central variables in the theories and models of decision-making. In summary, the combination of real-time tasks and deep IRL offers a promising novel approach to improving the assessment of psychological constructs underlying human behaviors and decision-making.
Supplemental Material
sj-docx-1-pss-10.1177_09567976241228503 – Supplemental material for Bridging the Gap Between Self-Report and Behavioral Laboratory Measures: A Real-Time Driving Task With Inverse Reinforcement Learning
Supplemental material, sj-docx-1-pss-10.1177_09567976241228503 for Bridging the Gap Between Self-Report and Behavioral Laboratory Measures: A Real-Time Driving Task With Inverse Reinforcement Learning by Sang Ho Lee, Myeong Seop Song, Min-hwan Oh and Woo-Young Ahn in Psychological Science
Footnotes
Acknowledgements
We thank Adam Gazzaley, Jay Myung, Mark Pitt, and Robert Whelan for their constructive feedback on an earlier version of the manuscript.
Transparency
Action Editor: Daniela Schiller
Editor: Patricia J. Bauer
Author Contributions

References
Supplementary Material
Please find the following supplemental material available below.
For Open Access articles published under a Creative Commons License, all supplemental material carries the same license as the article it is associated with.
For non-Open Access articles published, all supplemental material carries a non-exclusive license, and permission requests for re-use of supplemental material or any part of supplemental material shall be sent directly to the copyright owner as specified in the copyright notice associated with the article.
