
Abstract
The capacity to leverage information from others’ opinions is a hallmark of human cognition. Consequently, past research has investigated how we learn from others’ testimony. Yet a distinct form of social information—aggregated opinion—increasingly guides our judgments and decisions. We investigated how people learn from such information by conducting three experiments with participants recruited online within the United States (N = 886) comparing the predictions of three computational models: a Bayesian solution to this problem that can be implemented by a simple strategy for combining proportions with prior beliefs, and two alternatives from epistemology and economics. Across all studies, we found the strongest concordance between participants’ judgments and the predictions of the Bayesian model, though some participants’ judgments were better captured by alternative strategies. These findings lay the groundwork for future research and show that people draw systematic inferences from aggregated opinion, often in line with a Bayesian solution.
Much of our knowledge about the world is grounded in others’ testimony (Rabb et al., 2019). This requires distinctive sociocognitive mechanisms highly attuned to others’ expertise, social standing, and intentions (e.g., Harris et al., 2018; Mercier & Sperber, 2011). For example, sensitivity to the reliability of others’ testimony emerges early in childhood (Langenhoff et al., 2023), and both children and adults track who is likely to know what (Lutz & Keil, 2002; Wilkenfeld et al., 2016). However, we are increasingly called upon to make inferences about the world not from the testimony of a few known informants, but from the aggregated opinions of many unknown individuals: For example, we need to learn about the quality of products on online marketplaces through the aggregated reviews of previous customers (Hayes et al., 2021), and we need to learn about the popularity of electoral candidates through polls that aggregate the opinions of thousands (Stoetzer et al., 2024).
Decades of work in psychology (e.g., Kruglanski, 2004), politics (e.g., Huckfeldt et al., 2004), and economics (e.g., Golman et al., 2016) have shed light on the general problem of how people respond to others’ opinions. However, work on the more specific problem of how people draw inferences from aggregated opinions offers conflicting results. When learning about novel issues from the aggregated opinions of a few correlated sources, people seem to overweight others’ opinions (Desai et al., 2022; Enke & Zimmermann, 2019; Yousif et al., 2019). When drawing inferences about real-life controversies (e.g., climate change) from disagreeing millions, people seem to underweight others’ opinions (Oktar & Lombrozo, 2022; see also Hartman et al., 2022; Iyengar et al., 2019). In other cases, people’s inferences seem to accord with Bayesian expectations (Orchinik et al., 2023; Orticio et al., 2022; Stoetzer et al., 2024).
Are people simply bad at drawing reliable inferences from aggregated opinion? Prior work fails to answer this question, as it has not experimentally isolated the inference process nor conducted formal model comparisons across opinion distributions to assess whether, when, and why people go wrong. We address this gap by proposing a Bayesian model of inference from aggregated opinion and presenting three behavioral studies that isolate these inferences and compare them to the Bayesian model and to alternative formalizations from epistemology (Easwaran et al., 2016) and economics (Romeijn & Atkinson, 2011).
Formalizing Inference from Opinion: Bayes, Updating on the Credences of Others, Competence
Imagine learning about a poll of
Bayesian analysis
Our goal is to use aggregated opinions,
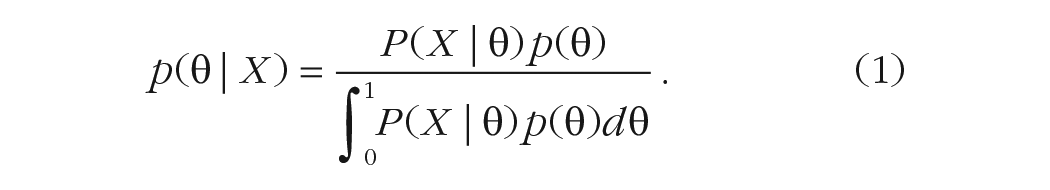
To make predictions using the Bayesian model, we need to specify how opinions relate to truth and what people already know about
Combining the binomial likelihood with a uniform prior—that is, absent additional information, such that

Statement of Relevance
When judging the quality of products on online marketplaces or the popularity of political candidates, we increasingly rely on the aggregated opinions of many others (in the form of likes, ratings, and polls). Despite the importance of the issue, how we learn from such aggregated opinion is unclear: Some studies suggest that people overweight aggregated opinions, whereas others propose that people underweight them. To reconcile these findings, we investigated inferences from aggregated opinion using three behavioral experiments and computational models. Across these studies, we found that participants’ judgments were best predicted by an ideal model that justifies a simple strategy for combining prior beliefs with the proportion of people who support a particular opinion. Our approach offers a route to reconciling past findings and clarifying the sources of harmful opinion dynamics.
In Experiments 1 and 2, we will use “Bayes” to correspond to this update rule. We describe how we incorporate informative priors to this model in Experiment 3. Intuitively, Bayes is sensitive to the proportion of opinions that support S, being a linear function of the proportion
Updating on the credences of others
There are many alternative rules for drawing inferences from opinions. One such rule, termed UPCO (short for “updating on the credences of others”), is a multiplicative combination of the opinions of every individual in a group (Easwaran et al., 2016). UPCO is a heuristic that mimics Bayesian inference in some cases and respects the results of Condorcet’s jury theorem (Condorcet, 1785). It is given by

Intuitively, UPCO is sensitive to the absolute margin of opinion that supports S. For example, the margin in the case in which 15 people believe S is true and 5 think it is false is 10. Thus, [15T, 5F] leads to a similar prediction to [110T, 100F]. Note that in the case of binary opinion,
Competence
Another recently proposed formalism aims to estimate the competence of informants (reflected in a reliability rate,
We call this algorithm Competence. Intuitively, Competence interpolates between UPCO and Bayes: It is sensitive to both the margin and the proportion and converges quickly.
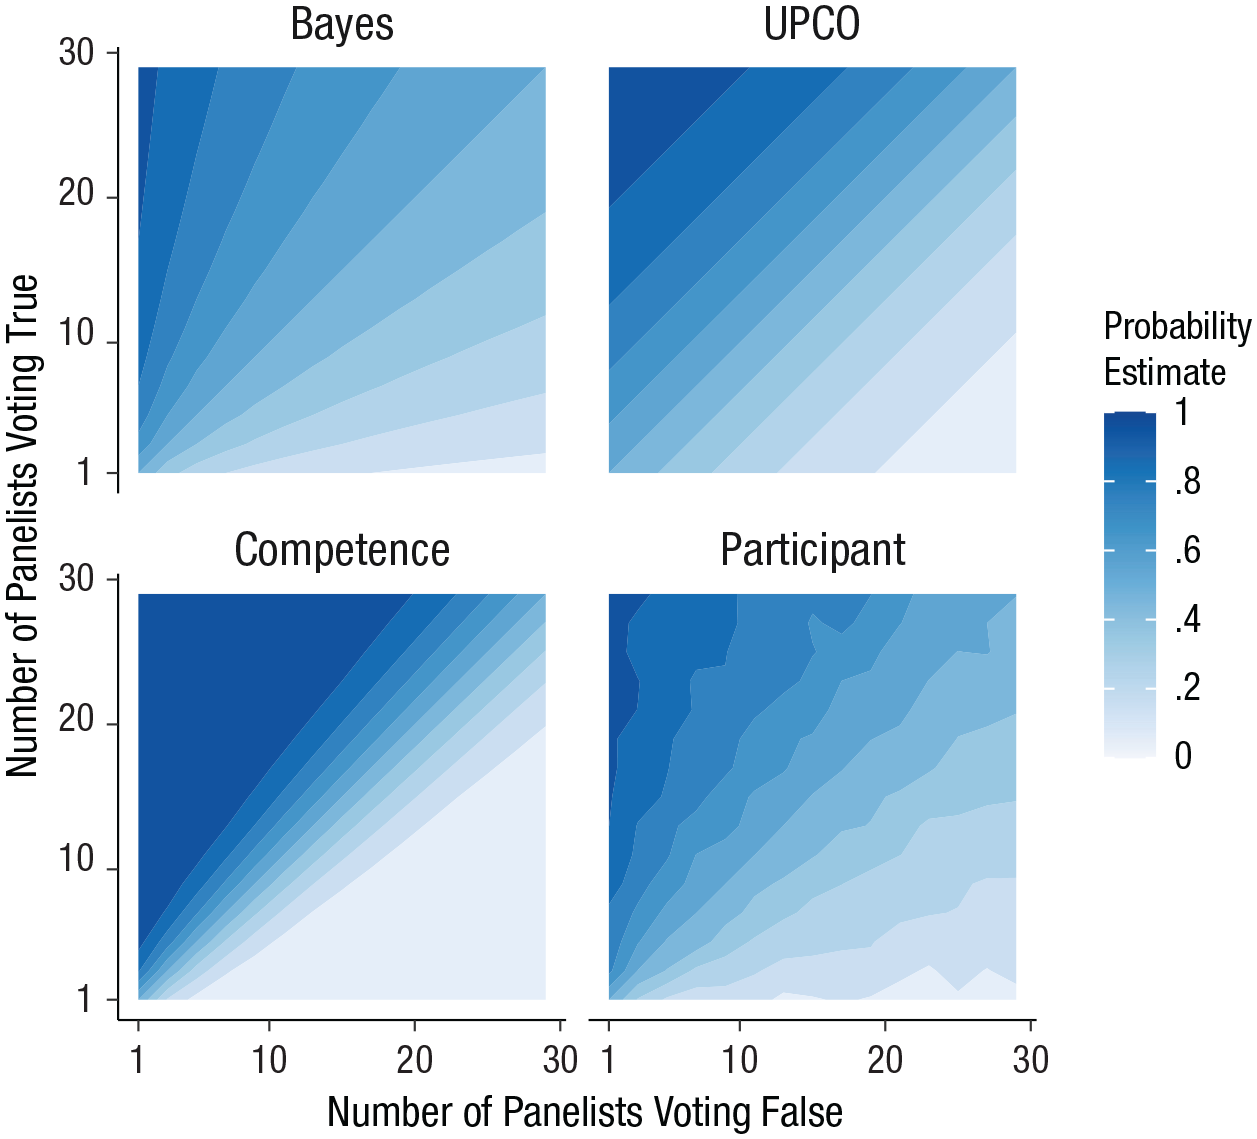
These models make convergent predictions for some opinion distributions (e.g., when a panel of people is split on an issue) and divergent predictions on others, with variation across pairs of models in which distributions maximally differentiate predictions (see Fig. 1).
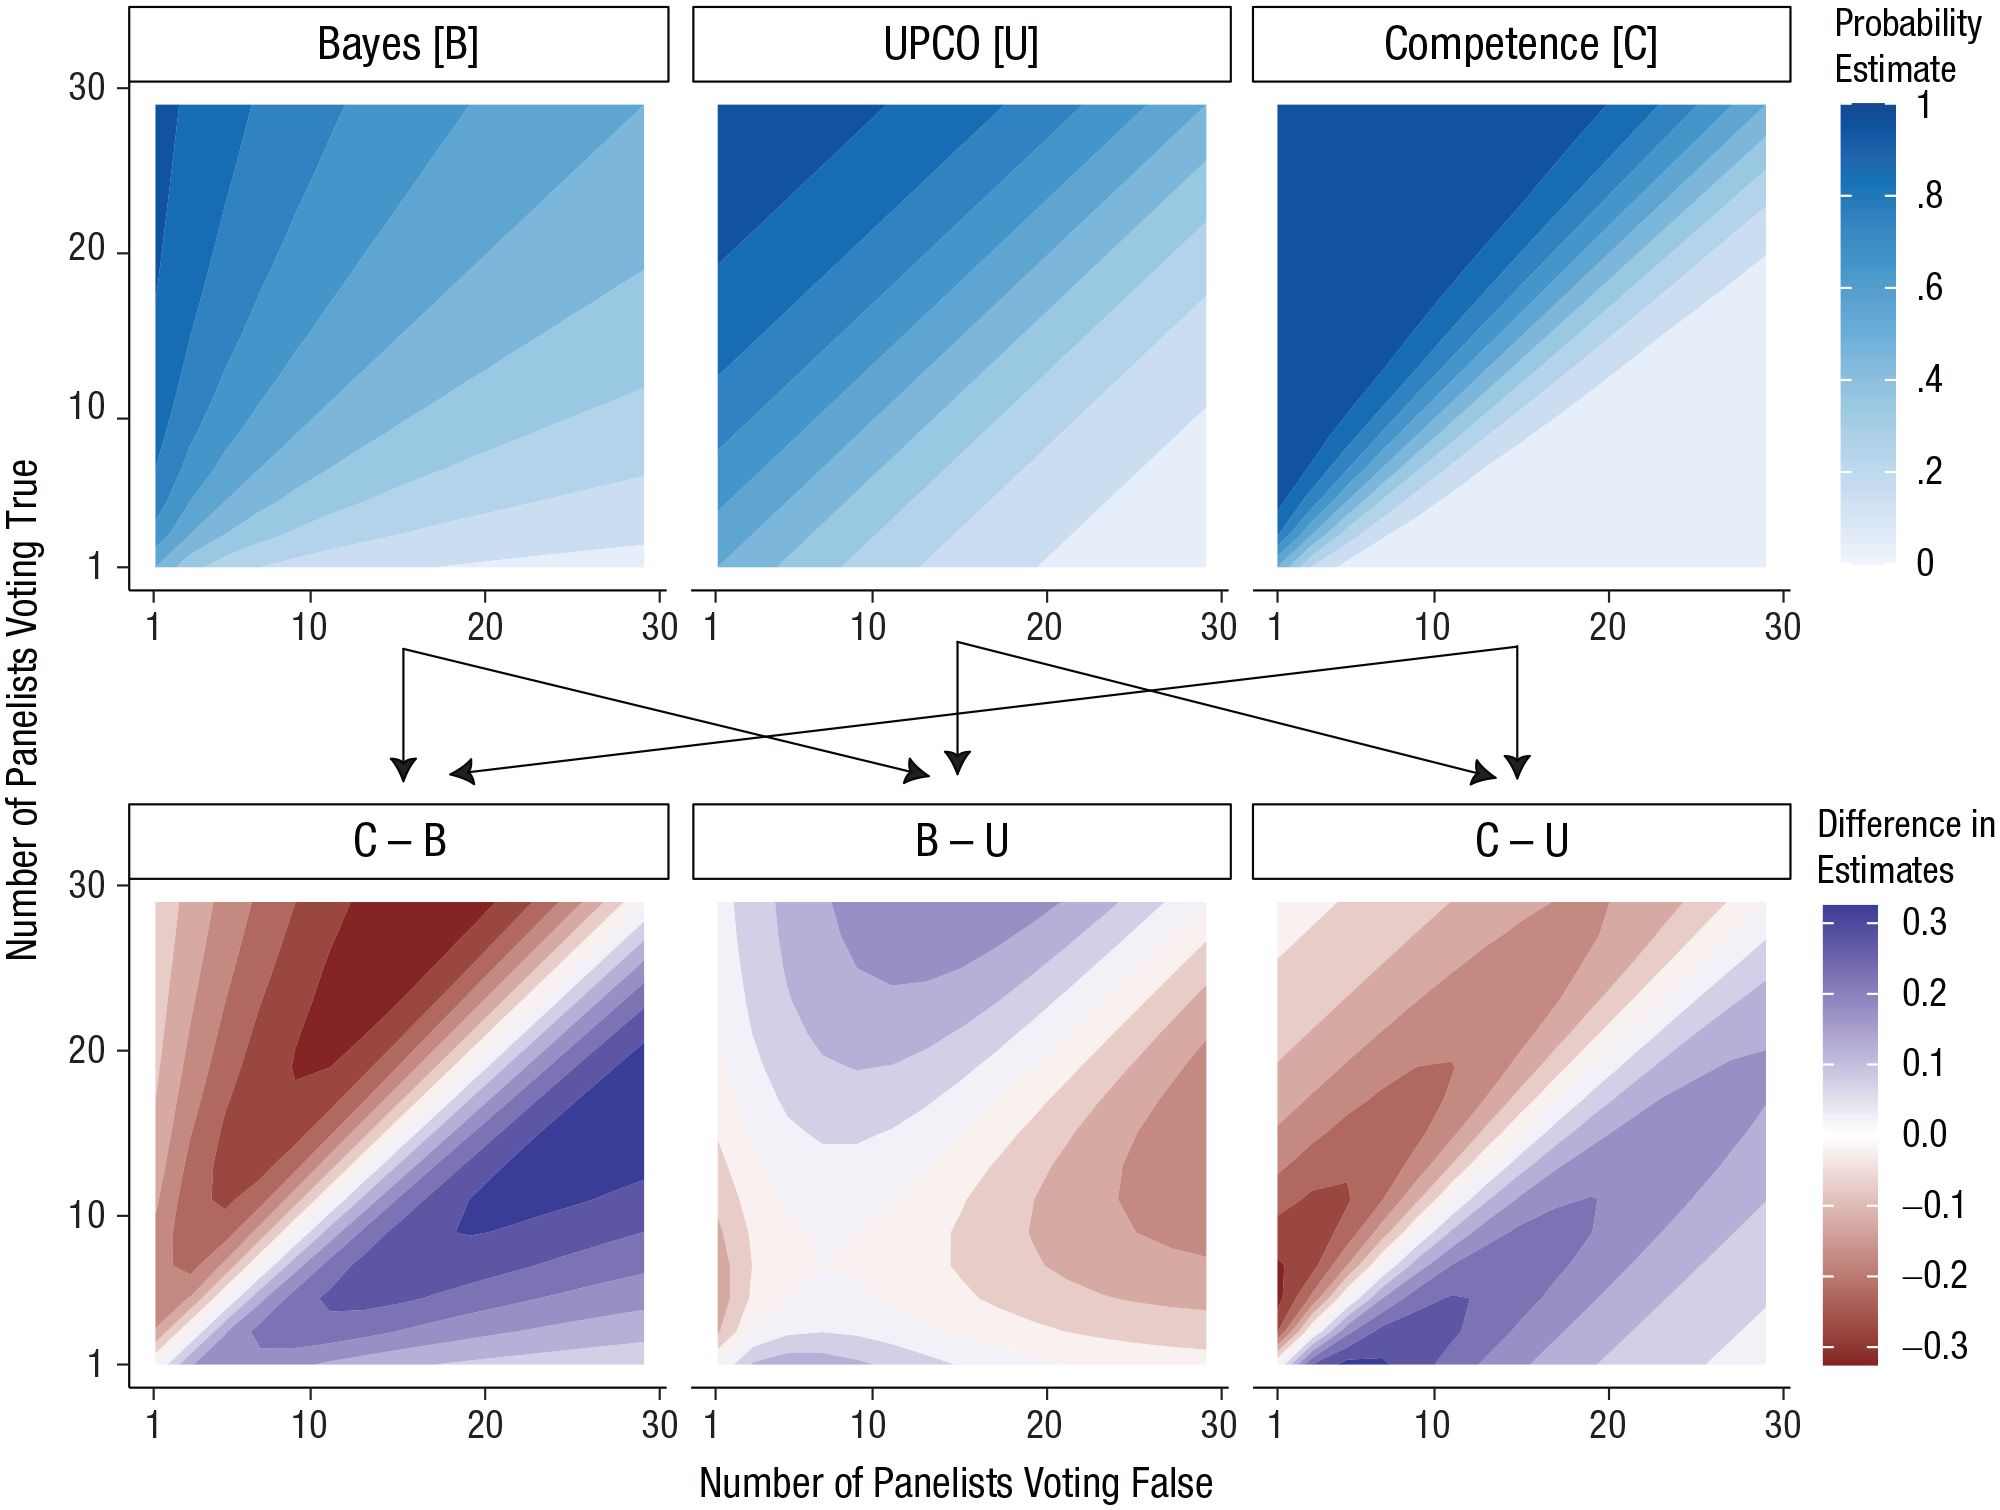
Model predictions across opinion distributions. The top row illustrates model predictions as a function of the number of people in a panel voting true or false on a given issue. The bottom row illustrates pairwise differences in model predictions. Each point corresponds to a particular opinion distribution (e.g., 5 voting true, 15 voting false), and the color indicates the probability that a model assigns to that point (top row) or differences in model predictions for that point (bottom row). Note that the contour plot discretizes continuous model predictions into bins for ease of visual comparison. B = Bayes; U = UPCO, or updating on the credences of others; C = Competence.
Experiment 1: Comparing Models Through Discriminative Points
To empirically compare human inferences with the predictions of these models, we conducted three experiments. In our first experiment, participants made judgments about the truth of 18 unknown statements on the basis of others’ opinions in a game-show setting.
Method
Participants
Following a power analysis with pilot data (see Supplemental Materials E), we recruited 133 adults (46 male, 84 female, 3 other; mean age = 34) on Prolific in exchange for monetary compensation ($1.00 for a 5-min study). Participation across all studies was restricted to users currently residing in the United States with an approval rating of at least 98% on at least 100 tasks. Repeat participation within and across studies and pilots was restricted using the Prolific platform. Seventeen participants were excluded from analyses on the basis of preregistered exclusion criteria (completing the experiment too quickly or failing a comprehension check). This study’s design, hypotheses, and key analyses were preregistered; see https://aspredicted.org/L3D_G4Q. All three experiments were approved by the Princeton University Institutional Review Board. This research complies with the Declaration of Helsinki (2023).
Materials and procedure
In this study, participants were asked to make a series of 18 truth judgments integrating the conflicting opinions of varying panels of informants in a game show. It is important to note that participants drew inferences about propositions that were masked (e.g., participants read, “For this question, [NX] members of the audience were chosen as members of the jury,” but they were not told what the question in fact was); they formed their judgments purely on the basis of the distribution of others’ opinions.
Participants first read a description of the game show that specified how the jury was selected randomly from the audience and answered a basic comprehension check (see Supplemental Materials B for details). They then encountered 18 trials with the following measure (the variables in square brackets were replaced with trial-specific numbers):
For this question, [NX] members of the audience were chosen as members of ‘the jury.’
Participants provided these judgments on a slider scale ranging from 0, completely impossible, to 100, definitely true.
Three aspects of this paradigm are worth noting for their role in controlling central features of inferences from aggregated opinion. First, the game-show setting provides us with an opportunity to designate participants’ goals in the task, decoupling inferences from motivations. Second, we are able to specify the distribution, reliability, and interdependence of opinion that participants learn from, decoupling inferences from assumptions about informants. Finally, the use of masked propositions brackets the role of priors, allowing us to focus on the role of evidence from aggregated opinion (in Experiment 3, we reintroduce a role for priors). Varying these features experimentally enables systematic exploration of the large space of inferences from aggregated opinion (see Almaatouq et al., 2022; Oktar, 2024). In our studies, we explored inferences when priors are weak (Experiments 1 and 2) and informative (Experiment 3), when informants are independent and randomly sampled, and when the inference context is purely focused on accuracy.
We generated 18 trials in this paradigm that maximally discriminated between our three models. To choose the opinion distributions (e.g., 12 jury members voted true, 17 jury members voted false) used in these trials, we computed model predictions for every possible opinion distribution (for juries up to 100 members). These models converge on some points and diverge on others (see Fig. 1). For example, when a large jury overwhelmingly votes “false,” all three models predict low probability of truth. Other cases (e.g., small split juries) are more likely to induce differing predictions. We identified the opinion distribution that led to the most divergent predictions for each pair of models, which led to three maximally discriminative points (i.e., opinion distributions).
We then used these three key points to generate 15 other points by sampling five additional opinion distributions per model with the same predicted probabilities. For instance, if the point [1, 11] most clearly distinguished UPCO from Bayes, and UPCO predicted .40 for that point, we would sample five other points in opinion space (e.g., [3, 13]) for which UPCO also predicted .40. Half of the trials were inverted (to have more judges voting “false” than “true”), and they were reverse scored in later analyses. After providing these 18 judgments, participants answered demographic questions and were debriefed.
Results
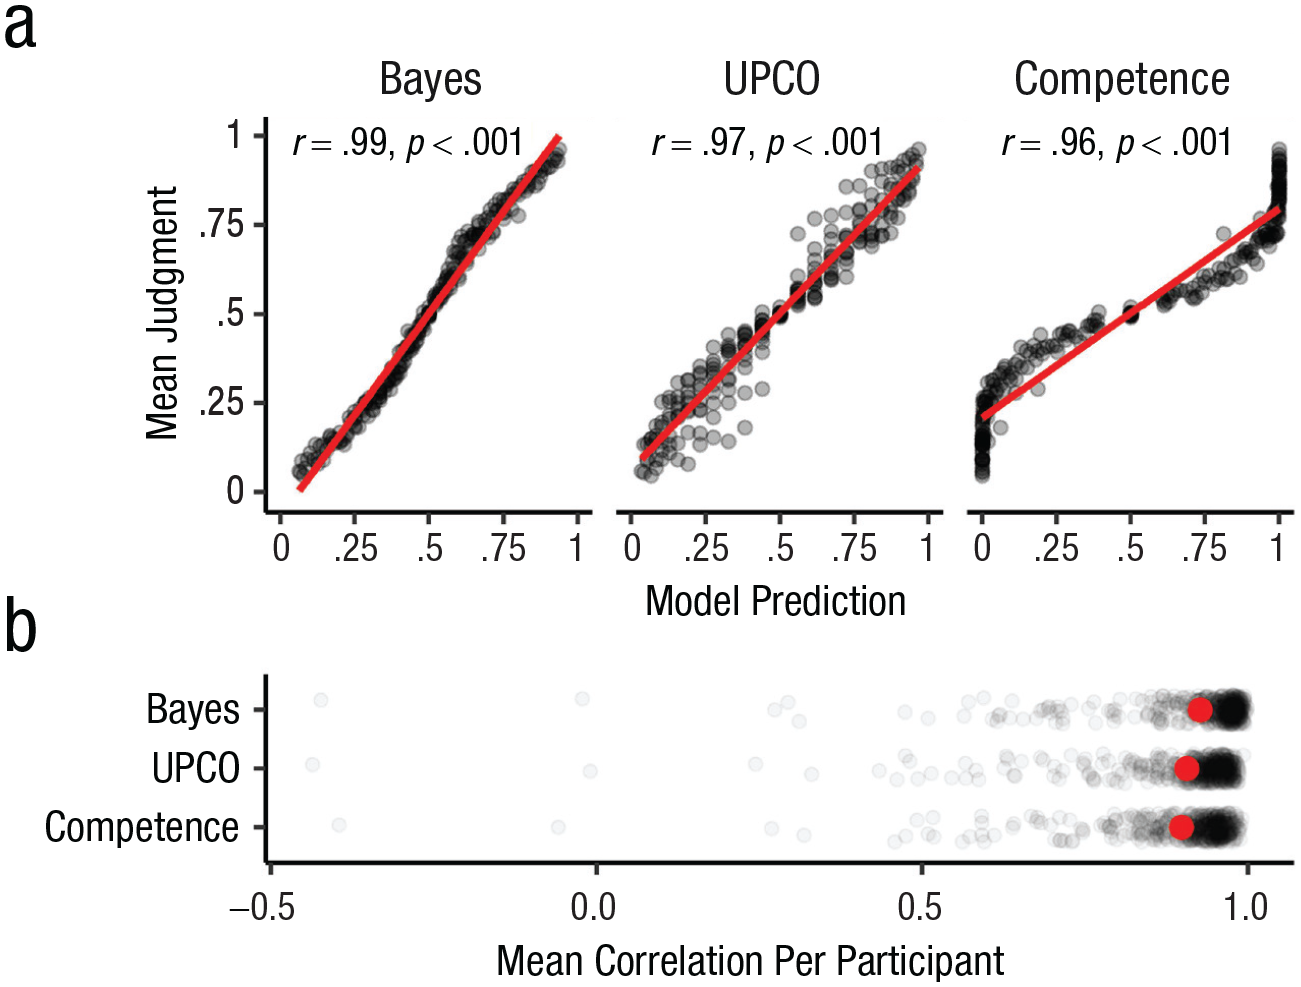
We had three main predictions. On the basis of past work showing that people often approximate Bayesian inferences (e.g., Griffiths & Tenenbaum, 2006), we first predicted that the Bayesian model’s estimates would be significantly correlated with mean participant judgments across our 18 key points. Second, we predicted that the correlation between model and human judgments would be strongest for the Bayesian model. Finally, beyond correlations at the population level, we also predicted that the Bayesian model would capture individual judgments better than the heuristic models. That is, we expected that the mean correlation across participants’ judgments and the predictions of the three models would be highest for Bayes. Our data support all three predictions (see Fig. 2).
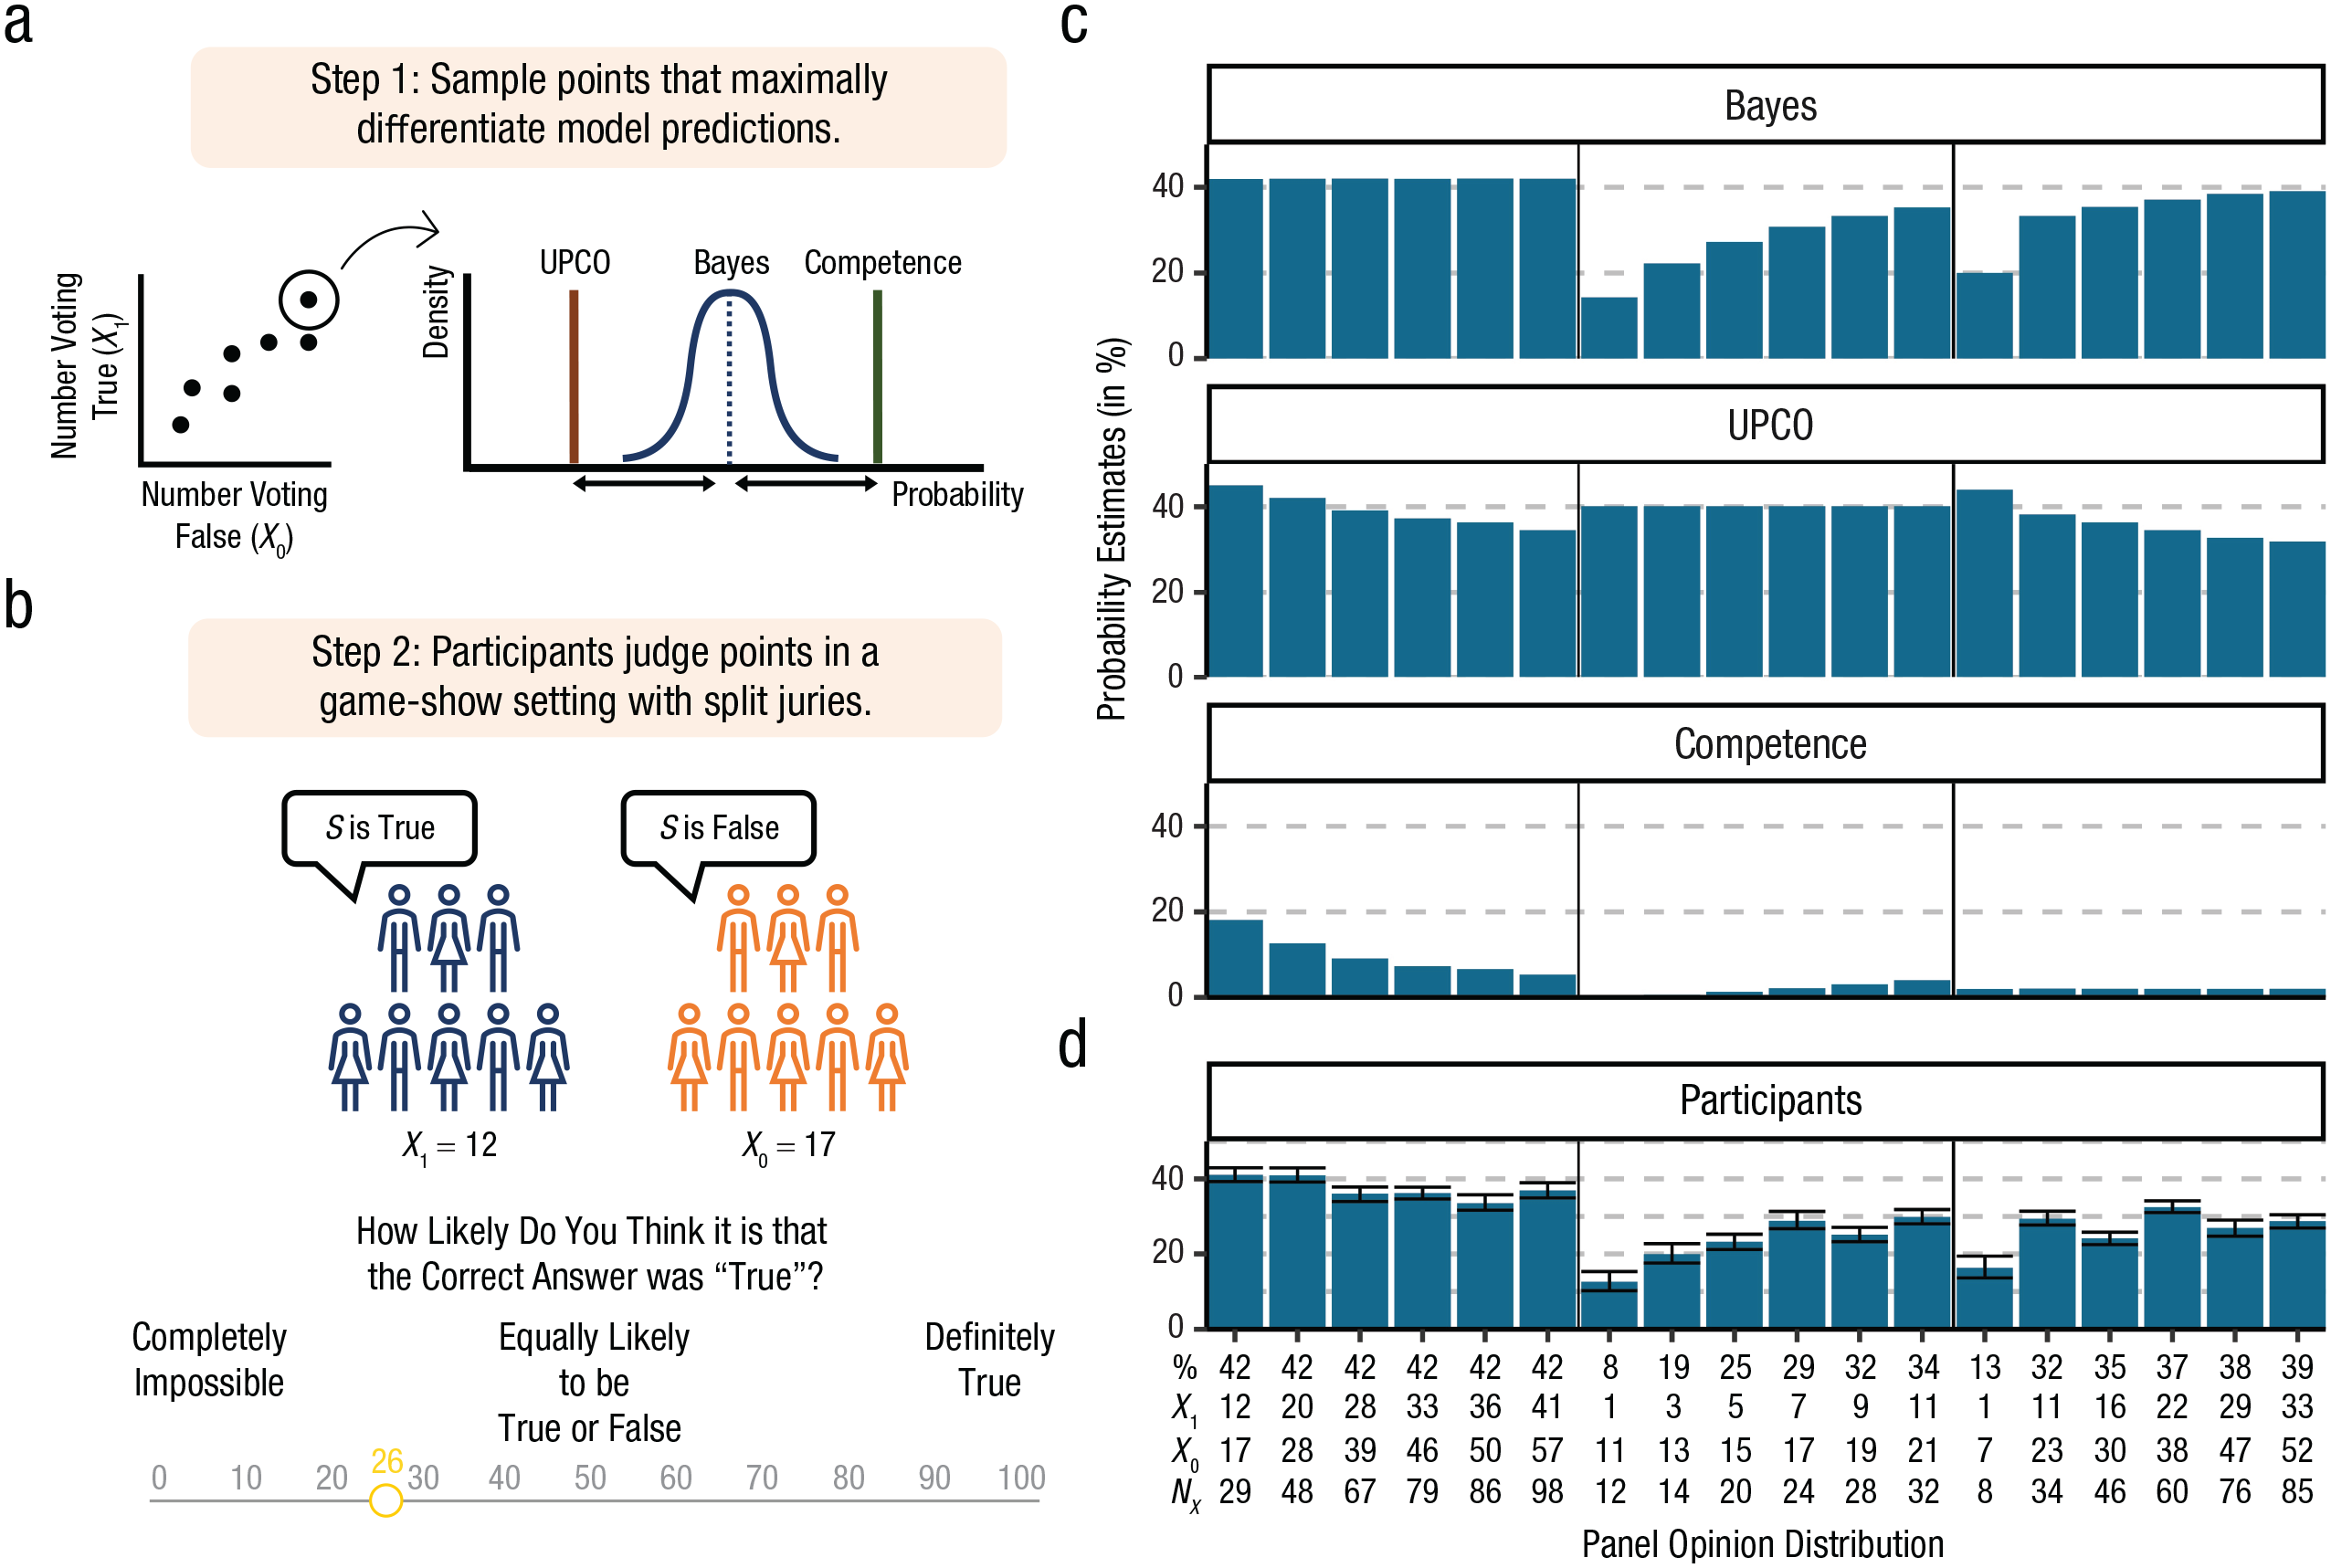
Comparison of model predictions and mean participant judgments in Experiment 1. In (a) we depict the stimulus-selection procedure. For each pair of models, we calculated the opinion distribution (e.g., 12 jury members voted true, 17 jury members voted false) that led to the most divergent predictions, and we used these three key points to sample the remaining 15 points. In (b) is shown our experimental task. Participants were told that randomly chosen juries of 2 to 100 members evaluated trivia statements and reached diverging conclusions—with opinion distributions matching the stimuli described in (a)—and made inferences about the truth of these statements. These points ranged from juries of 8 to 98 members. Model predictions are shown in (c), where Bayes corresponds to the binomial posterior mean, and a plot of mean participant judgments across points is shown in (d); the horizontal axis shows opinion distributions, with the top row indicating the percentage voting true (%), the second row indicating the number voting true (X1), the third row indicating the number voting false (X0), and the last row showing the total number of judges (NX); error bars show bootstrapped 95% confidence intervals. We found stronger evidence at the level of individual participants: Mean correlations between each individual participant’s judgments and model predictions were significantly higher for Bayes than for updating on the credences of others (UPCO)—

Correlations between human judgments and model predictions from Experiment 1. Correlations across mean participant estimates and model predictions are shown in (a); the shaded area represents 95% confidence intervals. The correlations between each participant’s judgments and model predictions are illustrated in (b), and the red point represents the mean. UPCO = updating on the credences of others.
In support of our first prediction, the Bayesian model’s predictions were highly correlated with participant judgments,
We can also ask which model best predicts the judgments of each individual participant. Conducting this exploratory analyses revealed that
Discussion
The results of Experiment 1 suggest that Bayes is the best predictor of people’s judgments for stimuli that most strongly discriminate between our models. However, there are important limitations to this analysis.
First, though we sampled informative points, we sampled just a few (our 18 points comprise
Second, our analysis compared the three models against each other. Beyond finding the best model, however, our goal is to best characterize people’s inferences, and it is possible that a combination of our models could outperform individual predictions. To conduct more sophisticated model comparisons, we need greater statistical power.
Experiment 2: Densely Sampling Opinion Space
In Experiment 2, we extended our prior findings by densely sampling opinion distributions for juries of up to 60 members. This allowed us to investigate model performance across the full space of opinion distributions and provided enough power to conduct fine-grained comparisons of our models with ensembles.
Method
Participants
Following a power analysis with pilot data (see Supplemental Materials E), we recruited 458 adults (204 male, 242 female, 12 other; mean age = 38 years), as in Experiment 1, for a slightly longer study. Participants were paid $1.20 for a 6-min study. We excluded 108 participants from analyses on the basis of preregistered criteria (33 for completing the experiment too quickly and 72 for failing an attention check—though including these participants did not change conclusions). This study’s design, hypotheses, and analyses were preregistered; see https://aspredicted.org/DKH_CWM.
Materials and procedure
Participants completed the same task as in Experiment 1—providing inferences about statements purely on the basis of the opinions of a jury, as participants were not shown the statements themselves.
Instead of rating 18 key points, however, they were randomly assigned 20 of 225 possible stimuli. Each of the 20 stimuli corresponded to a particular arrangement of the jury in the game show, from a split two-person jury to a split 58-person jury (i.e., 29 think it is false, 29 think it is true). The 225 stimuli were densely sampled to cover a quarter of all points from [1, 1] to [29, 29] in a square grid—alternately skipping a point on each jury (e.g., the first four points are [1, 1], [1, 3], [3, 1], [3, 3]; see Supplemental Fig. S4).
Results
Our data in this study show even stronger concordance between participants’ judgments and the predictions of the three models (see Fig. 4). That the correlations in this study are much higher should not be surprising: We picked 18 highly discriminative points in Experiment 1, but here we also included easier points on which models agree. This reduces the power to differentiate across our models from correlations.
Correlations between human judgments and model predictions from Experiment 2. Correlations across mean participant estimates and model predictions are shown in (a); the shaded area represents 95% confidence intervals. The correlations between each participant’s judgments and model predictions are illustrated in (b), and the red point represents the mean.
Importantly, this richer data set enabled us to investigate the relationship between participants’ judgments and the structure of model predictions in much finer detail than we could observe through correlations. We could compare—across all 225 opinion distributions—the relationship between model predictions and mean participant judgments. This constituted a much more stringent test of our models: Whereas correlations ask whether models capture the pattern of inferences, comparing model predictions in the original space allowed us to ask whether models provide accurate quantitative predictions of inference (see Fig. 5).
Human judgments and model predictions across opinion distributions in Experiment 2. This contour plot shows model predictions and participant judgments across all opinion distributions for juries up to 60 members. The participant plot shows a linear interpolation of mean judgments on the square grid. Visually, Bayes corresponded most closely to human judgments. Our first hypothesis was that the Bayesian model would be the best predictor of judgments (i.e., would produce the lowest Akaike Information Criterion score), and our analyses support this: Bayes once again best predicted mean judgments across opinion distributions (see Fig. 6 for comparisons of AIC scores, and see Fig. S5 in the Supplemental Material for a regression table). UPCO = updating on the credences of others.
To compare the relative performance of each model, we therefore adopted a more stringent predictive test than comparing correlations. We preregistered analyses comparing the Akaike Information Criterion (AIC) scores of three separate linear regressions—each regression predicting mean participant judgments from model predictions across the 225 points. Note that AIC is an estimator of prediction error that penalizes flexibility (i.e., models with more parameters but the same predictive performance have worse AIC scores). This is key, as we are not just interested in which individual model provides the best predictions but are also interested in comparing the performance of model ensembles, which combine multiple models to generate predictions. The penalties explain why ensembles, which have more parameters than individual models, would not necessarily have better AIC scores, even if they made more accurate in-sample predictions.
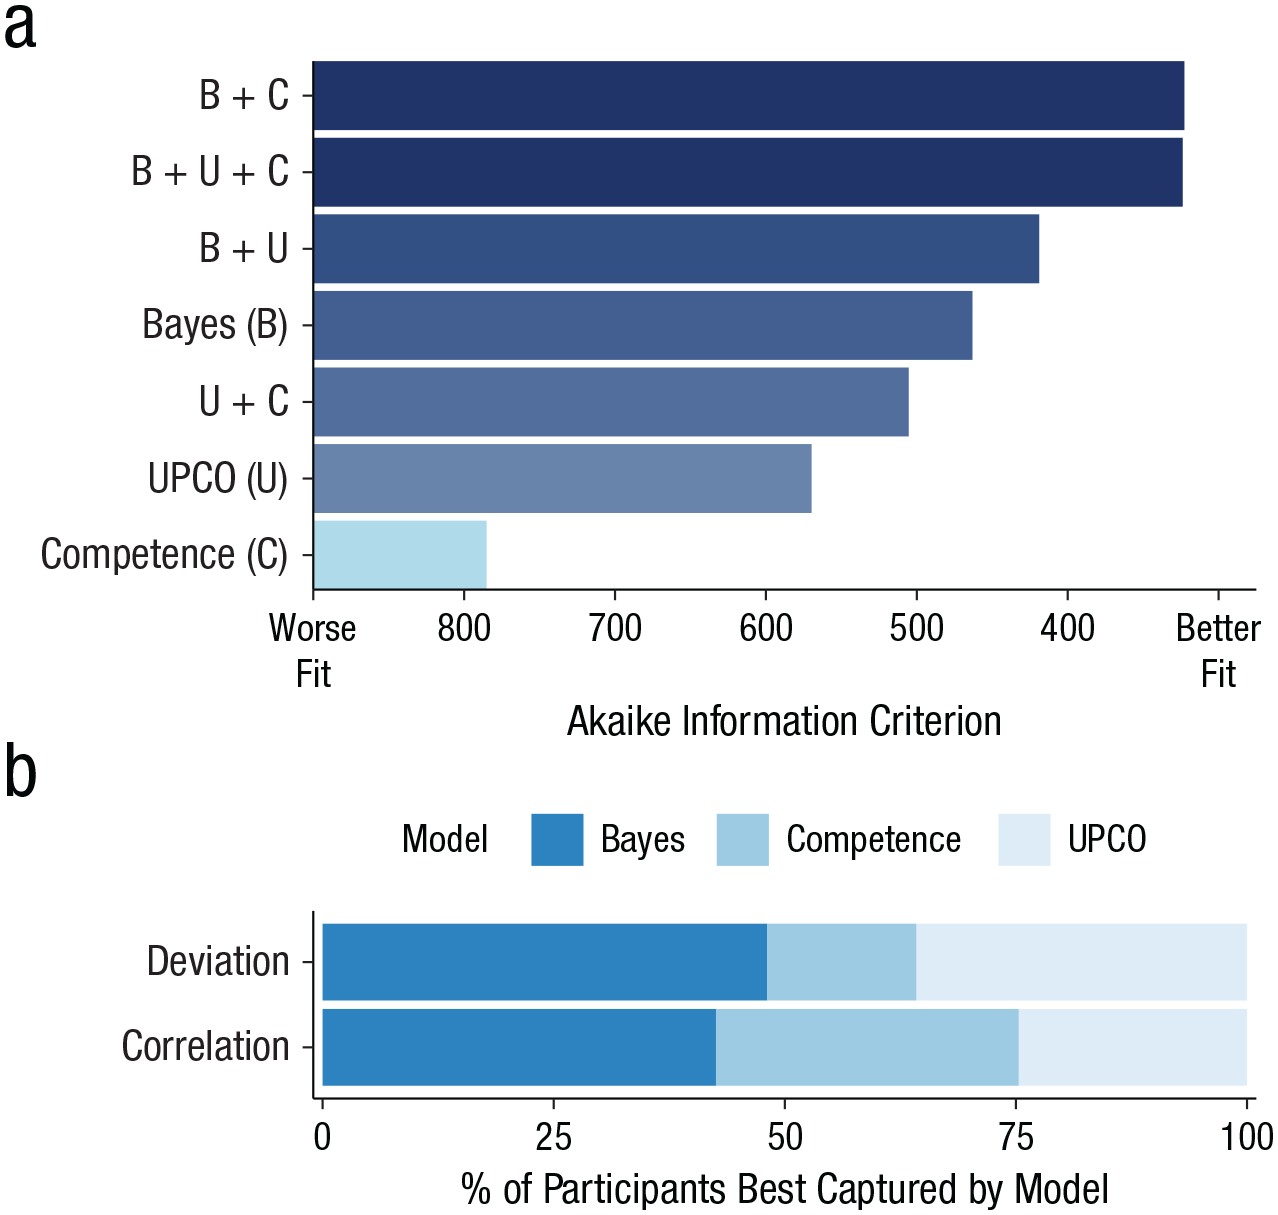
To investigate whether our models were better at explaining judgments cumulatively than individually, we compared the AIC scores of all ensembles (i.e., linear combinations of models) with the scores of individual models. We were uncertain whether the additional models would yield improvements in performance over the Bayesian model. This analysis revealed that ensembles outperform individual models—with the addition of Competence conferring a larger boost in prediction than UPCO (see Fig. 6a).

Model and ensemble comparisons from Experiment 2. In (a) we show Akaike Information Criterion (AIC) values for regressions predicting judgments from model predictions and linear combinations of models (because smaller AIC values indicate better fit, the horizontal axis has been flipped). Bayes was the best individual predictor, but it was outperformed by ensembles. In (b) we illustrate which model best captured inferences at the level of individual participants. B = Bayes; U = UPCO, updating on the credences of others; C = Competence.
One explanation for why ensembles outperform individual models is that there may be heterogeneity across participants’ inference strategies. Although Bayes best predicts judgments overall, some participants’ behavior could be better captured by heuristic models. To investigate this possibility, we conducted an exploratory participant-level analysis in which we calculated the proportion of participants whose responses were best captured by the three models. Using the same participant-level correlation and deviation analyses as in Experiment 1, we found that UPCO and Competence were better predictors of one quarter of our participants’ judgments (see Fig. 6b). These analyses thus revealed substantial heterogeneity in people’s inferences.
Discussion
The densely sampled stimuli in Experiment 2 extended our prior results by showing that Bayes not only performs well for points that differentiate between our models but also generalizes well to the broader space of opinion distributions. Moreover, our analyses reveal that people use a diversity of inference strategies.
Experiment 3: Integrating Prior Beliefs With Opinions
In our final study, we conducted a more stringent test of the Bayesian model by investigating (a) whether it continues to be the best predictor when there is variation in priors and (b) how it performs when participants evaluate real claims. To address these questions, we elicited participants’ prior beliefs about 18 trivia statements, provided them with aggregated opinions, and investigated their updated judgments. The Bayesian model predicts that people’s judgments should vary with the prior probabilities assigned to statements (see Supplemental Materials G).
Method
Participants
Following a power analysis with pilot data (see Supplemental Materials E), we recruited 295 adults (163 male, 126 female, 6 other; mean age = 42 years), as in Experiment 2, for a slightly longer study. Participants were paid $2.00 for a 10-min study; 60 participants were excluded from analyses on the basis of preregistered criteria (52 for completing the experiment in an unrealistic amount of time, 8 for failing an attention check). This study’s design, hypotheses, and analyses were preregistered; see https://aspredicted.org/PHZ_XDB.
Materials and procedure
Participants completed a task similar to that of Experiment 1. Instead of rating masked statements, however, each participant was assigned a random pairing of 18 actual trivia statements with the panel opinion distributions used in Experiment 1. All participants thus evaluated all 18 trivia items and panel distributions, but they received differing subsets of all possible trivia and panel combinations (18
To ensure that our stimuli spanned multiple domains and confidence levels, we sampled trivia from the General Knowledge Norms data set (GKN; S. K. Tauber et al., 2013), which provides updated information on the original set of 300 general-information questions from Nelson and Narens (1980). These questions span a wide variety of domains, including history, sports, art, geography, literature, and entertainment, and the GKN includes a variety of measures, such as people’s confidence in their beliefs about each item. We uniformly sampled 18 questions that evenly spanned the range of confidence to use in our study. This resulted in a diverse set of statements; participants would have very strong priors on some of them (hence, they would be able to easily identify the statements as true or false), but they would lack informative priors on others (and hence would not be confident). Using this diverse set increases the odds that the predictive comparisons of our models would generalize across issues on which people have weak and strong priors.
To generate true and false items, we used data in the GKN to rank questions by prior confidence. Starting with the most well-known item, we generated false answers to every other statement in the ranking, and the rest were paired with correct answers, resulting in nine true and nine false items. Some of the false answers were generated to be obviously false (e.g., that venison is the name of ox meat—when it is actually the name of deer meat), whereas others were false in more subtle ways (e.g., that the Bismarck is the name of a German battleship that was sunk in World War I—when it was actually sunk in World War II). This variance prevented falsity from being confounded with the strength of prior knowledge: If all statements were obviously false, even otherwise unknown trivia items would become obvious (e.g., if the warship item had read, “Bismarck is the name of the Saudi Arabian battleship sunk in World War I,” it would have become a trivially easy item).
The final set covered statements that are both well known (e.g., “POPEYE IS THE NAME OF THE COMIC STRIP CHARACTER WHO EATS SPINACH TO INCREASE HIS STRENGTH”), partially known (e.g., “CANBERRA IS THE CAPITAL OF AUSTRALIA”), and relatively unknown (“DITHERS IS THE LAST NAME OF DAGWOOD’S MAID IN THE COMIC STRIP ‘BLONDIE’”; see Supplemental Materials F for a list of all statements).
Participants first provided their prior truth judgments for the statements (“Based on your prior knowledge, how likely do you think it is that this statement is true?”) on a truth slider scale ranging from definitely false (0) to definitely true (100). They then provided their confidence in their prior judgments (“How confident are you in this response?”) on a scale ranging from not at all (0) to extremely (10). They then learned about the panel’s opinion distribution and provided their final judgments using the same truth scale:
In this round of Know-off, the following statement was shown to the contestant: [STATEMENT]. For this question, [NX] members of the audience were chosen as members of the jury. [X1] of them thought that the statement was true. [X0] of them thought that the statement was false. How likely do you think it is that the correct answer was true?
The 18 true/false combinations for the jury (corresponding to [NX], [X1], and [X0] above) were taken from Experiment 1. The order in which statements were presented was randomized both within each experiment (across the prior and posterior measures) and across participants. Participants then provided demographic information.
Note that we need to infer participants’ prior distributions from their judgments to fit the Bayesian model—we describe our preregistered method for fitting these distributions in Supplemental Materials G, and we also provide details on the fitting of all three models. Importantly, we explicitly emphasized in our instructions and comprehension checks for this study that the jury members deliberated independently (see Supplemental Materials F—Experimental Preamble).
Results
We first verified that the trivia we sampled spanned a range of prior beliefs, from statements generally known to be true or false to highly uncertain statements. The distribution of judgments indicates that we successfully sampled a diverse set of items (see Fig. 7).
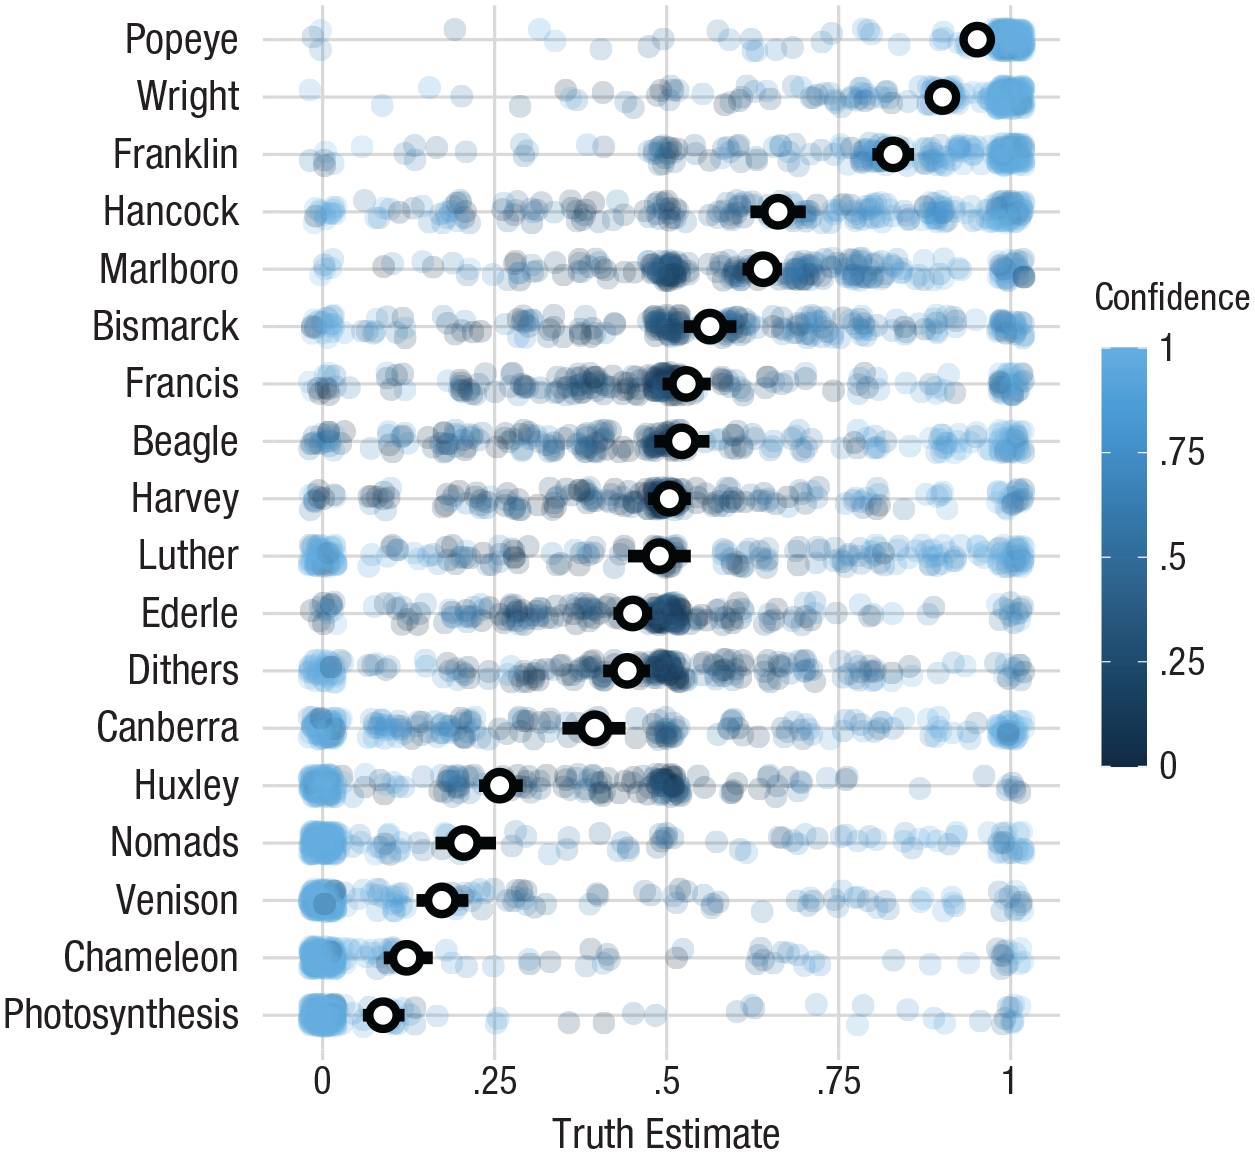
Prior truth judgments for trivia statements used in Experiment 3. Participants’ truth judgments for the chosen trivia statements show that our stimuli span truth inferences (from definitely false to definitely true) as well as confidence levels (from not at all confident to extremely confident). Points were slightly jittered to display overlapping data; black points show mean truth inferences with bootstrapped 95% confidence intervals. Each row plots responses to a particular item; Supplemental Materials F contains further details on these items.
We then investigated which models best predicted participants’ responses by conducting the same AIC-based comparisons of individual models and ensembles used in Experiment 2. We opted to conduct our analysis across all judgments because most participants received unique combinations of opinions and statements, which reduced the informativeness of mean comparisons. As with our prior studies, we hypothesized that the Bayesian model would best predict judgments but were agnostic with regard to whether ensembles would outperform individual models.
Our results supported this hypothesis, as the Bayesian model had the best individual predictive performance. Moreover, we obtained largely the same ordering of model performance as in Experiment 2, with ensembles boosting the performance of the Bayesian model (see Fig. 8 for comparisons of AIC scores and Supplemental Fig. S11 for a plot of all judgments).
Model and ensemble comparisons from Experiment 3. In (a) we show Akaike Information Criterion (AIC) values for regressions predicting judgments from model predictions and linear combinations of models (because smaller AIC values indicate better fit, the horizontal axis has been flipped). Bayes was the best individual predictor, but it was outperformed by ensembles. In (b) we show which model best captured inferences at the level of individual participants. B = Bayes; U = UPCO, or updating on the credences of others; C = Competence.
Note that the AIC scores in Figure 8 are estimates from a fixed-effects analysis with the three models as predictors. It is important to note that including random intercepts for items and participants in a more comprehensive mixed-effects model did not change the predictive ordering of models or any conclusions (see Supplemental Figs. S12 and S13 for both regression tables and a discussion of our preregistered analysis plan).
Beyond replicating comparisons across our three models, these data allowed us to investigate how the Bayesian model would compare to purely proportion- and prior-based heuristics. In our previous studies, the Bayesian model’s predictions were difficult to disentangle from proportion-based heuristics, because of the absence of prior information. We hypothesized that participants’ inferences would be better characterized by the Bayesian model than by heuristic strategies that did not integrate prior knowledge with the data.
Our results supported this prediction. The proportion heuristic
We also hypothesized that the Bayesian model would best characterize individual participants’ inferences. Our data supported this hypothesis as well, with Bayes best capturing 43% of participants’ estimates in terms of correlations and 48% in terms of deviations. In particular, Bayes outperformed the other models in cases of large updates (see Supplemental Fig. S14). Yet there is a decrease in the proportion of participants best characterized by Bayes from Experiment 2, which suggests that more participants utilize heuristics for the more complex judgments in Experiment 3.
Discussion
This experiment shows that the Bayesian model best predicts inferences even when participants must integrate prior beliefs with aggregated opinion. Once again, the best-performing model is an ensemble enriched by other models, because of heterogeneity across participants’ strategies.
General Discussion
How do our opinions reach beyond the horizon of our experiences? Past work has emphasized that we learn much of what we know from others—often through local, social interactions (Harris et al., 2018), and increasingly through exposure to the aggregated views of many others (through likes, polls, and reviews; Kozinets et al., 2010). Recent work has investigated learning from aggregated opinion and reached diverging conclusions—people seem radically insensitive to aggregated opinion in some cases, and overly sensitive in others. To reconcile these findings, we proposed a Bayesian model of learning from aggregate opinion and conducted three experiments to compare the predictions of this model with human judgments. Across all experiments, we found the strongest concordance between participants’ judgments and the predictions of the Bayesian model over two tested alternatives, though many participants utilized alternative strategies, and models performed best in predicting aggregate judgments. Importantly, the predictive success of the Bayesian model does not necessarily indicate that people are performing Bayesian inference, as this model results in a simple strategy for combining priors and proportions. The Bayesian analysis does explain, however, why people might follow this strategy: it corresponds to a reasonable statistical inference (for further discussion, see Marr, 1982; S. S. Tauber et al., 2017).
These results raise important questions. First, how can people’s inferences be best characterized by a Bayesian model, when prior work has found that people over- or underweight aggregated opinion? Our formal analysis highlights three factors as potential explanations for this discrepancy: prior beliefs about controversies, the reliability of disagreeing parties, and dependency structures across informants. For instance, strong prior beliefs about controversies (e.g., climate change) can lead people to persist in their views amid disagreement and hence appear insensitive to aggregated opinion (Oktar & Lombrozo, 2022). On the other hand, prior belief in the independence of news sources can lead people to draw strong conclusions from aggregated opinion (Desai et al., 2022). Relatedly, the complexity of the task may matter: We found that more participants relied on alternative heuristics in Experiment 3, potentially because of the increased demands of integrating prior information with opinion data. Whether people’s views are well calibrated can therefore be adjudicated only on a case-by-case basis, through modeling and measurement of factors such as informant reliability (Landrum et al., 2015) and dependency (Whalen et al., 2018). Future work could explore cross-cultural and contextual variance in inferences as well as departures from the assumption that the distribution of opinion directly maps onto the probability of truth.
Second, do our results generalize to real-world opinion-aggregation problems? The answer depends on the extent to which a particular problem matches our task. For instance, the results of Experiment 3 suggest that the Bayesian model will perform well in predicting how people utilize aggregate opinions in actual trivia contests, as our task is isomorphic to the inference problem posed in this case (e.g., the “ask the audience” lifeline in Who Wants to Be a Millionaire?). When it comes to real-life controversies such as abortion, however, generalizability is an open question, given differing assumptions about the reliability (Hartman et al., 2022) and dependence (Judd & Park, 1988) of disagreeing others, as well as variation in the aggregation and presentation of opinions (Fisher et al., 2018). Moreover, the psychology of controversy is clearly shaped by factors beyond the epistemic—such as inferences about an issue’s subjectivity (Oktar & Lombrozo, 2022). Our experimental paradigm can be adapted to investigate the influence of many such factors.
With widening rifts of opinion corroding the foundations of many democracies across the globe, elucidating when and why we learn from controversy (i.e., polarized aggregated opinion)—or fail to do so—is becoming an increasingly important goal. Our work advances this aim with both methodology and theory. Methodologically, our approach demonstrates how formal theories can be combined with experimental data to systematically investigate questions about mass opinion. Theoretically, we have identified key factors underlying inferences from aggregated opinion, and we have shown that in simple cases many people can draw Bayesian inferences across opinion distributions. This suggests that persistence amid controversy is grounded in rich inferences about reliability, dependence, and beyond, rather than an inability to draw inferences from aggregated opinion.
Supplemental Material
sj-pdf-1-pss-10.1177_09567976241251741 – Supplemental material for Learning From Aggregated Opinion
Supplemental material, sj-pdf-1-pss-10.1177_09567976241251741 for Learning From Aggregated Opinion by Kerem Oktar, Tania Lombrozo and Thomas L. Griffiths in Psychological Science
Footnotes
Acknowledgements
We are grateful to Shlomi Sher, Kenny Easwaran, and our anonymous reviewers for valuable feedback on this research.
Transparency
Action Editor: Yoel Inbar
Editor: Patricia J. Bauer
Author Contributions
Notes
References
Supplementary Material
Please find the following supplemental material available below.
For Open Access articles published under a Creative Commons License, all supplemental material carries the same license as the article it is associated with.
For non-Open Access articles published, all supplemental material carries a non-exclusive license, and permission requests for re-use of supplemental material or any part of supplemental material shall be sent directly to the copyright owner as specified in the copyright notice associated with the article.