
Abstract
The aggregation of many lay judgments generates surprisingly accurate estimates. This phenomenon, called the “wisdom of crowds,” has been demonstrated in domains such as medical decision-making and financial forecasting. Previous research identified two factors driving this effect: the accuracy of individual assessments and the diversity of opinions. Most available strategies to enhance the wisdom of crowds have focused on improving individual accuracy while neglecting the potential of increasing opinion diversity. Here, we study a complementary approach to reduce collective error by promoting erroneous divergent opinions. This strategy proposes to anchor half of the crowd to a small value and the other half to a large value before eliciting and averaging all estimates. Consistent with our mathematical modeling, four experiments (N = 1,362 adults) demonstrated that this method is effective for estimation and forecasting tasks. Beyond the practical implications, these findings offer new theoretical insights into the epistemic value of collective decision-making.
Keywords
The aggregation of many lay estimates often outperforms individual expert judgments (De Condorcet, 1785; Galton, 1907). This phenomenon, popularly known as the wisdom of crowds (Surowiecki, 2005), has been applied to a wide range of problems, such as improving medical diagnoses (Kurvers et al., 2016), forecasting geopolitical events (Mellers et al., 2014), predicting financial markets (Ray, 2006), reverse-engineering the smell of molecules (Keller et al., 2017), and fact-checking news (Allen et al., 2021), among many others. Given its practical relevance, understanding the conditions under which crowds produce accurate estimates has become a relevant issue in the psychological sciences (Kameda et al., 2022; Kao & Couzin, 2014; Karachiwalla & Pinkow, 2021; Navajas et al., 2018).
The collective judgments of nonexperts often yield remarkably accurate estimates—a phenomenon known as the wisdom of crowds. Two properties make a crowd wise: the accuracy of the individuals involved and their diversity of opinion. Although both are equally important, most efforts to enhance the wisdom of crowds have focused on increasing individual accuracy while neglecting opinion diversity. This study introduces an innovative alternative strategy: By leveraging a cognitive bias called the anchoring effect, we promote extreme opinions, increasing both individual error and diversity, which ultimately leads to enhanced collective accuracy. These findings offer new insights into the value of collective judgments, even when decisions proceed from individuals who hold extreme and erroneous views.Statement of Relevance
One important driver of collective accuracy is the diversity of opinions in the crowd (Becker et al., 2019; Hong & Page, 2004; Jönsson et al., 2015; Page, 2008; Shi et al., 2019). A simple intuition underlies this claim: when crowds produce diverse estimates, it is likely that some individuals will underestimate the correct answer, whereas others will overestimate it. Therefore, the more diverse the crowd, the higher the chance that individual errors will cancel out in the aggregation process. More formally, the diversity prediction theorem (Page, 2007) states that the crowd’s error (E) can be expressed as the mean individual error (ε) minus the crowd’s predictive diversity (δ, also known as the population variance):

One implication of this mathematical identity (proof can be found in the Supplemental Material available online) is that, in principle, the crowd’s accuracy could be increased either by reducing the individual error (ε) or, alternatively, by increasing the predictive diversity (δ). However, although these two strategies are equally valid in theory, most available studies aiming at increasing the wisdom of crowds have exclusively focused on reducing ε while neglecting the potential of increasing δ.
For example, previous studies have proposed aggregating information from select crowds composed of individuals who are more accurate across estimation problems (Mannes et al., 2014). Other studies have shown that individual error can be reduced by counteracting individual biases (Kao et al., 2018) or by exposing individuals to social information (Frey & Van de Rijt, 2021; Jayles et al., 2017; Lorenz et al., 2011; Madirolas & de Polavieja, 2015). A notable exception to this tendency demonstrated that collective accuracy can be increased by enhancing cognitive-process diversity (Keck & Tang, 2020), a construct that is different from predictive diversity. However, even in that case, it remains unclear whether the method actually increased opinion diversity, reduced mean individual error, or both. A few other works have focused on diversity, but in less direct ways. For example, a previous paper performed secondary analyses to evaluate increases in diversity through the lens of Equation 1, but without directly manipulating diversity or individual accuracy (Nobre & Fontanari, 2020). Similarly, the “crowd within” phenomenon (Vul & Pashler, 2008), in which experimenters ask participants to produce more than one estimate, relies on the idea of increasing diversity within individuals. Whether and how this procedure increases population diversity remains unknown, however.
Showing that it is possible to decrease collective error merely by increasing predictive diversity is nontrivial for several reasons. First, it would demonstrate that there are processes that simultaneously increase individual error and collective accuracy. Second, from a practical standpoint, it would provide practitioners with a novel approach to increase collective estimation accuracy. Third, given that the wisdom of crowds has been previously interpreted as empirical evidence for the epistemic value of democratic judgments, this putative dissociation between individual and collective accuracy should mitigate concerns about the increase of misinformed voters in recent elections.
Put together, one converges to a counterintuitive, albeit somewhat uncomfortable, possibility: If collective error is reduced by increasing diversity, this would suggest that the wisdom of crowds may be enhanced by persuading individuals to adopt erroneous divergent opinions. In this article, we present theoretical simulations and empirical evidence for this claim. We introduce a new approach to increasing collective accuracy by boosting the crowd’s predictive diversity at the expense of reducing individual accuracy, even when the truth is completely unknown and unavailable, including to the experimenters.
Increasing the Wisdom of Crowds Through Extremization
We propose to promote the adoption of extreme estimates, and therefore to increase diversity, by means of a cognitive bias known as the anchoring effect (Tversky & Kahneman, 1974). The proposed method consists of anchoring one half of the crowd to a small value (low anchor) and the other half to a large value (high anchor) and then averaging all estimates. We hypothesized that this technique should lead to an increase in the predictive diversity that surpasses the increase in mean individual error, thus leading to lower collective error. Using a simple mathematical model, we first demonstrated that this method is expected to enhance collective accuracy across a wide range of parameters. We then empirically tested the procedure across four different experiments and showed that it indeed leads to a substantial reduction of collective error. This research complies with the Declaration of Helsinki (2023) and received approval from a local ethics board (ID: 435-5).
Let us consider the scenario in which someone needs to estimate a numerical variable that is unknown; for example, the height of the Eiffel Tower. On the basis of the wisdom-of-crowds effect, one could obtain an approximate value by asking a large number of individuals to provide an estimate. Then, to estimate the height of the tower, the person would aggregate these values—for example, by averaging them (Fig. 1a). In this work, we propose an alternative approach that consists in dividing the crowd into two halves and extremizing opinions in opposite directions (Fig. 1b). We suggest doing so by using the anchoring effect: Before estimating the relevant variable, individuals are first asked to consider either an extremely low or high value. In the previous example, half of the individuals would be asked to consider whether the height of the Eiffel Tower is greater or less than 10 m (low anchor,

Wisdom of extremized crowds. The method for estimating a variable through the wisdom of crowds (a) consists in asking a crowd of individuals to estimate a given quantity and averaging all answers (averages represented by µ). The proposed alternative method consists in promoting the adoption of divergent opinions within a crowd by dividing it in two halves, asking an anchoring question with either a low (L) or a high (H) value to each half, and then averaging all answers (µ x ). A mathematical model of the anchoring effect in shown in (b). The anchored mean is a weighted average of the anchor and the wisdom-of-crowds value. The weight w depends on the difference between the anchor and the correct answer, reflecting an internal sensitivity to the correct answer. Simulations performed using the proposed model (c) show that the method is expected to outperform the wisdom of crowds. Mean individual error and predictive diversity on simulated data (d) show an increase in both individual error and predictive diversity. However, the increase in individual error (left side) is smaller than the increase in predictive diversity (right side), resulting in an overall reduction in collective error (“c” represents the control group and “x” the extremized crowd).
Although this procedure requires predefining two extreme values that will be used as anchors, the strategy does not require knowing the correct answer; however, its accuracy will depend on the specific choice of anchors. Therefore, to understand better the conditions under which the proposed approach is expected to increase collective accuracy, we developed a simple mathematical model of the anchoring effect.
Model
Consider a set of individuals who, being asked to estimate the variable

—where

where
Equations 2 and 3 imply that the anchored mean (either low or high) is a weighted average of the anchor and the mean of the original distribution of values µ. Following a variety of empirical findings linking the anchoring effect to the plausibility of the anchor (Mussweiler & Strack, 2001; Wegener et al., 2001), we propose that the weights

where
In this work, we propose averaging estimates from two populations of individuals, each of which is anchored to either a low or a high value (

Simulations (for a set of parameters, with
The method implicitly assumes that it is possible to select anchors in a way in which the correct value will be underestimated by the low anchor and overestimated by the high anchor. However, meeting this condition is neither sufficient nor necessary. For example, the method should also work when both anchors have the opposite bias from the nonanchored responses. Therefore, to understand the conditions under which the method is expected to work, we performed a fine-grained model-based analysis.
Analytically, we found that the key variable determining the success of the approach is the midpoint of the anchors, defined as

The expression derived in Equation 6 implies that the range of values where the method outperforms the wisdom of crowds is always equal to or larger than two times the collective error. This can be shown by examining two opposite extreme scenarios. If the sensitivity
Experiment 1: Estimation of Unbounded Quantities
Method
Participants and questions
In Experiment 1, 120 U.S. participants (48 female, mean age = 37.2 years, SD = 11.6 years), who were recruited online on Amazon Mechanical Turk, provided estimates about 14 general-knowledge quantities (see Table S3 in the Supplemental Material). All variables were positive and unbounded, like the example used in Figure 1 (e.g., “What is the height of the Eiffel Tower?”). Participants had monetary incentives to estimate these variables as accurately as possible. Participants were informed that their participation was completely voluntary and that they could withdraw their participation at any time. All data were completely anonymous. The protocol was reviewed and approved by a local Institutional Review Board (CEMIC 435-5).
Procedure
This experiment was developed using PsyToolkit (Stoet, 2010, 2017). One third of the sample was randomly assigned to a control condition where they simply estimated a variable. The other two thirds of the sample were randomly assigned to the experimental condition where, before estimating the quantity, they were asked to consider either an extremely low or extremely high value (e.g., “Is the number of bridges in Paris higher or lower than 349?”). Half of the anchored participants considered a low value, and the other half considered a high value (randomly assigned). Crucially, these extreme values were not manually chosen by the experimenters but set automatically as the 5th and 95th percentiles of the empirical values observed in the control condition (to this end, the data from the first third of the sample was collected prior to the remaining data). We collected data from 41 participants in the control condition and 79 participants in the experimental condition. Our motivation for collecting this number of participants per condition was related to the maximum crowd size that could be obtained for our resampling procedure (see the Data Analysis section). We aimed for a crowd size of at least 30. In all cases, the questions were randomly ordered. All participants had a maximum of 15 s to answer. Participants were paid a flat fee of USD$1.50 for their participation. Estimation accuracy was incentivized by rewarding a bonus payment of USD$0.50 to the most accurate respondents (the top 10%).
Data analysis
We discarded data from participants who completed the survey in less than 3 min, or those who failed to complete the survey. We also excluded participants with two or more exactly correct answers (which is likely to reflect cheating).
To compare different conditions in a properly balanced way, we developed a resampling bootstrapping strategy. For each crowd size, we randomly selected with replacement a fixed number of individuals and estimated the collective error, predictive diversity, and mean individual error for that crowd size and that iteration. We repeated that procedure 1,000 times for crowd sizes that varied from two to different maximum values in different experiments (i.e., n = 32 in Experiment 1, n = 50 in Experiment 2, n = 100 in Experiment 3, and n = 70 in Experiment 4). In all cases those values allow perceiving the asymptotic behavior of the collective error as a function of crowd size.
Results and discussion
By employing a simple bootstrapping resampling method, we estimated the collective error of differently sized groups for both the wisdom of crowds and the wisdom of extremized crowds (Fig. 2a). We observed that the average collective error of the latter was always smaller than the former. For example, the collective error of 34 individuals randomly taken from the control condition was substantially larger than the collective error of 34 extremized individuals— unpaired t test: t(998) = 29.7, p = 2 × 10−139; effect size: Cohen’s d = 1.8, 95% CI = [1.7, 1.9]. This collective error reduction was due to an increase in predictive diversity (Fig. 2b)—unpaired t test: t(998) = 54.8, p < 10−200; effect size: Cohen’s d = 3.3, 95% CI = [3.2, 3.4]—that was higher than the increase in mean individual error (Fig. 2b)—unpaired t test: t(998) = 24.2, p = 5 × 10−102; effect size: Cohen’s d = 1.4, 95% CI = [1.3, 1.5].
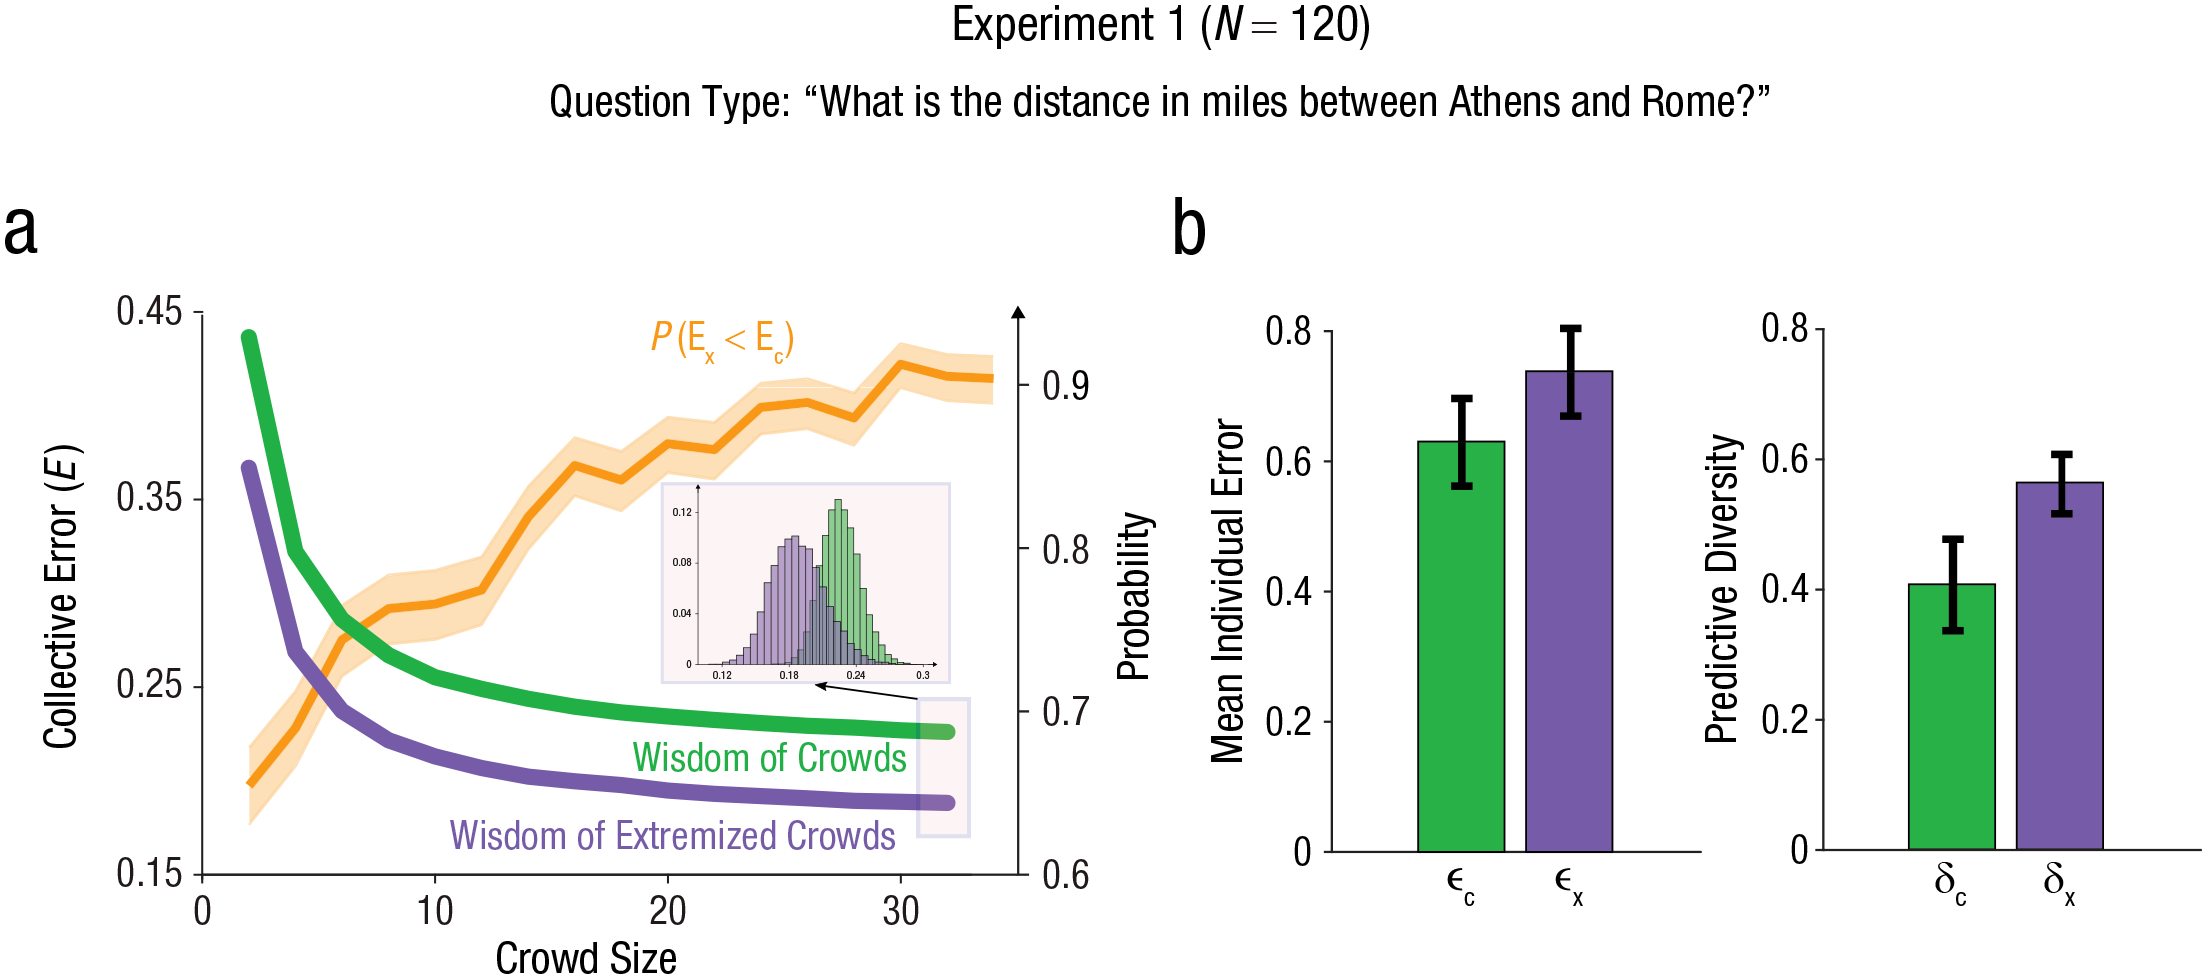
Empirical results for Experiment 1. Collective error as a function of crowd size is illustrated in (a) for the nonextremized wisdom of crowds (green) and for the wisdom of extremized crowds (purple). The standard error of each curve is within the line width. The inset shows the distribution of values from the resampling method for the largest crowd size (N = 34). The orange line depicts the probability of a sample from the distribution of collective errors of the extremized crowd (purple distribution, Ex) being smaller than a sample from the distribution of collective errors of the nonextremized crowd (green distribution, Ec). Mean individual error and predictive diversity are illustrated in (b) for both the nonextremized wisdom of crowds (green) and the wisdom of extremized crowds (purple). The error bars represent standard deviations of the mean.
One limitation of Experiment 1 is that the anchors were defined after we collected the data of the nonanchored population. Because this procedure may be inconvenient from a practical point of view, we performed a second preregistered experiment with bounded quantities—anchors were predefined and fixed across all questions (https://aspredicted.org/RYC_4Y5).
Experiment 2: Estimation of Bounded Quantities With Fixed Anchors
Method
Participants and questions
In Experiment 2, we recruited 396 participants online (235 female, aged 27.9 years, SD = 8.8 years), and asked them 30 general-knowledge questions that involved the estimation of a percentage. Therefore, all answers were bounded in the range [0, 100] (e.g., “What percentage of the population of Argentina is under 15 years old?”—see Table S4 in the Supplemental Material for the full list of questions used in Experiment 2). Unlike the previous study, here we used the same anchors for all questions, always set at either 5% (low anchor
Procedure
This experiment was also developed using PsyToolkit (Stoet, 2010, 2017). In order to reduce the length of the survey, we divided the questions into two subsets of 15 questions each. Each participant was randomly assigned to one of these sets of questions. In addition, following a very similar procedure to the previous experiment, we randomly divided the sample into two groups. Participants in the control condition were asked to directly estimate the answer to the 15 questions (e.g., “What percentage of the population of the [United States] is under 18 years old?”). Participants in the experimental condition answered the same questions but after an anchoring question (“Do you think the percentage of the population of the [United States] under 25 years old is above or below 95%?”). The assignment to the low-anchor or high-anchor condition was random across questions. Overall, we collected data from 119 participants in Group 1 and 277 participants in Group 2. In all cases, the questions were randomly ordered (within each subset of 15 questions). In this case, we estimated the number of participants per condition required from power analyses derived from our previous experiment (as per our preregistration, available at https://aspredicted.org/RYC_4Y5). All participants had 20 s to answer the questions. Estimation was not incentivized for accuracy.
Data analysis
For this experiment we followed the same exclusion criteria as for the previous one. In this case, the exclusion criteria were preregistered. For Experiment 2, we followed the same bootstrapping procedure as for Experiment 1.
Results and discussion
We observed very similar results to Experiment 1 (Fig. 3a and 3b). Collective error was lower for the extremized crowd (crowd size N = 50)—unpaired t test: t(998) = 19.1, p = 2 × 10−69; effect size: Cohen’s d = 1.2, 95% CI = [1.1, 1.3]. This was accompanied by an increase in mean individual error—unpaired t test: t(198) = 121.1, p < 10−200; effect size: Cohen’s d = 7.6, 95% CI = [7.3, 7.9]—as well as an increase in predictive diversity, unpaired t test: t(198) = 162.5, p < 10−200; effect size: Cohen’s d = 10.3, 95% CI = [10.0, 10.6].
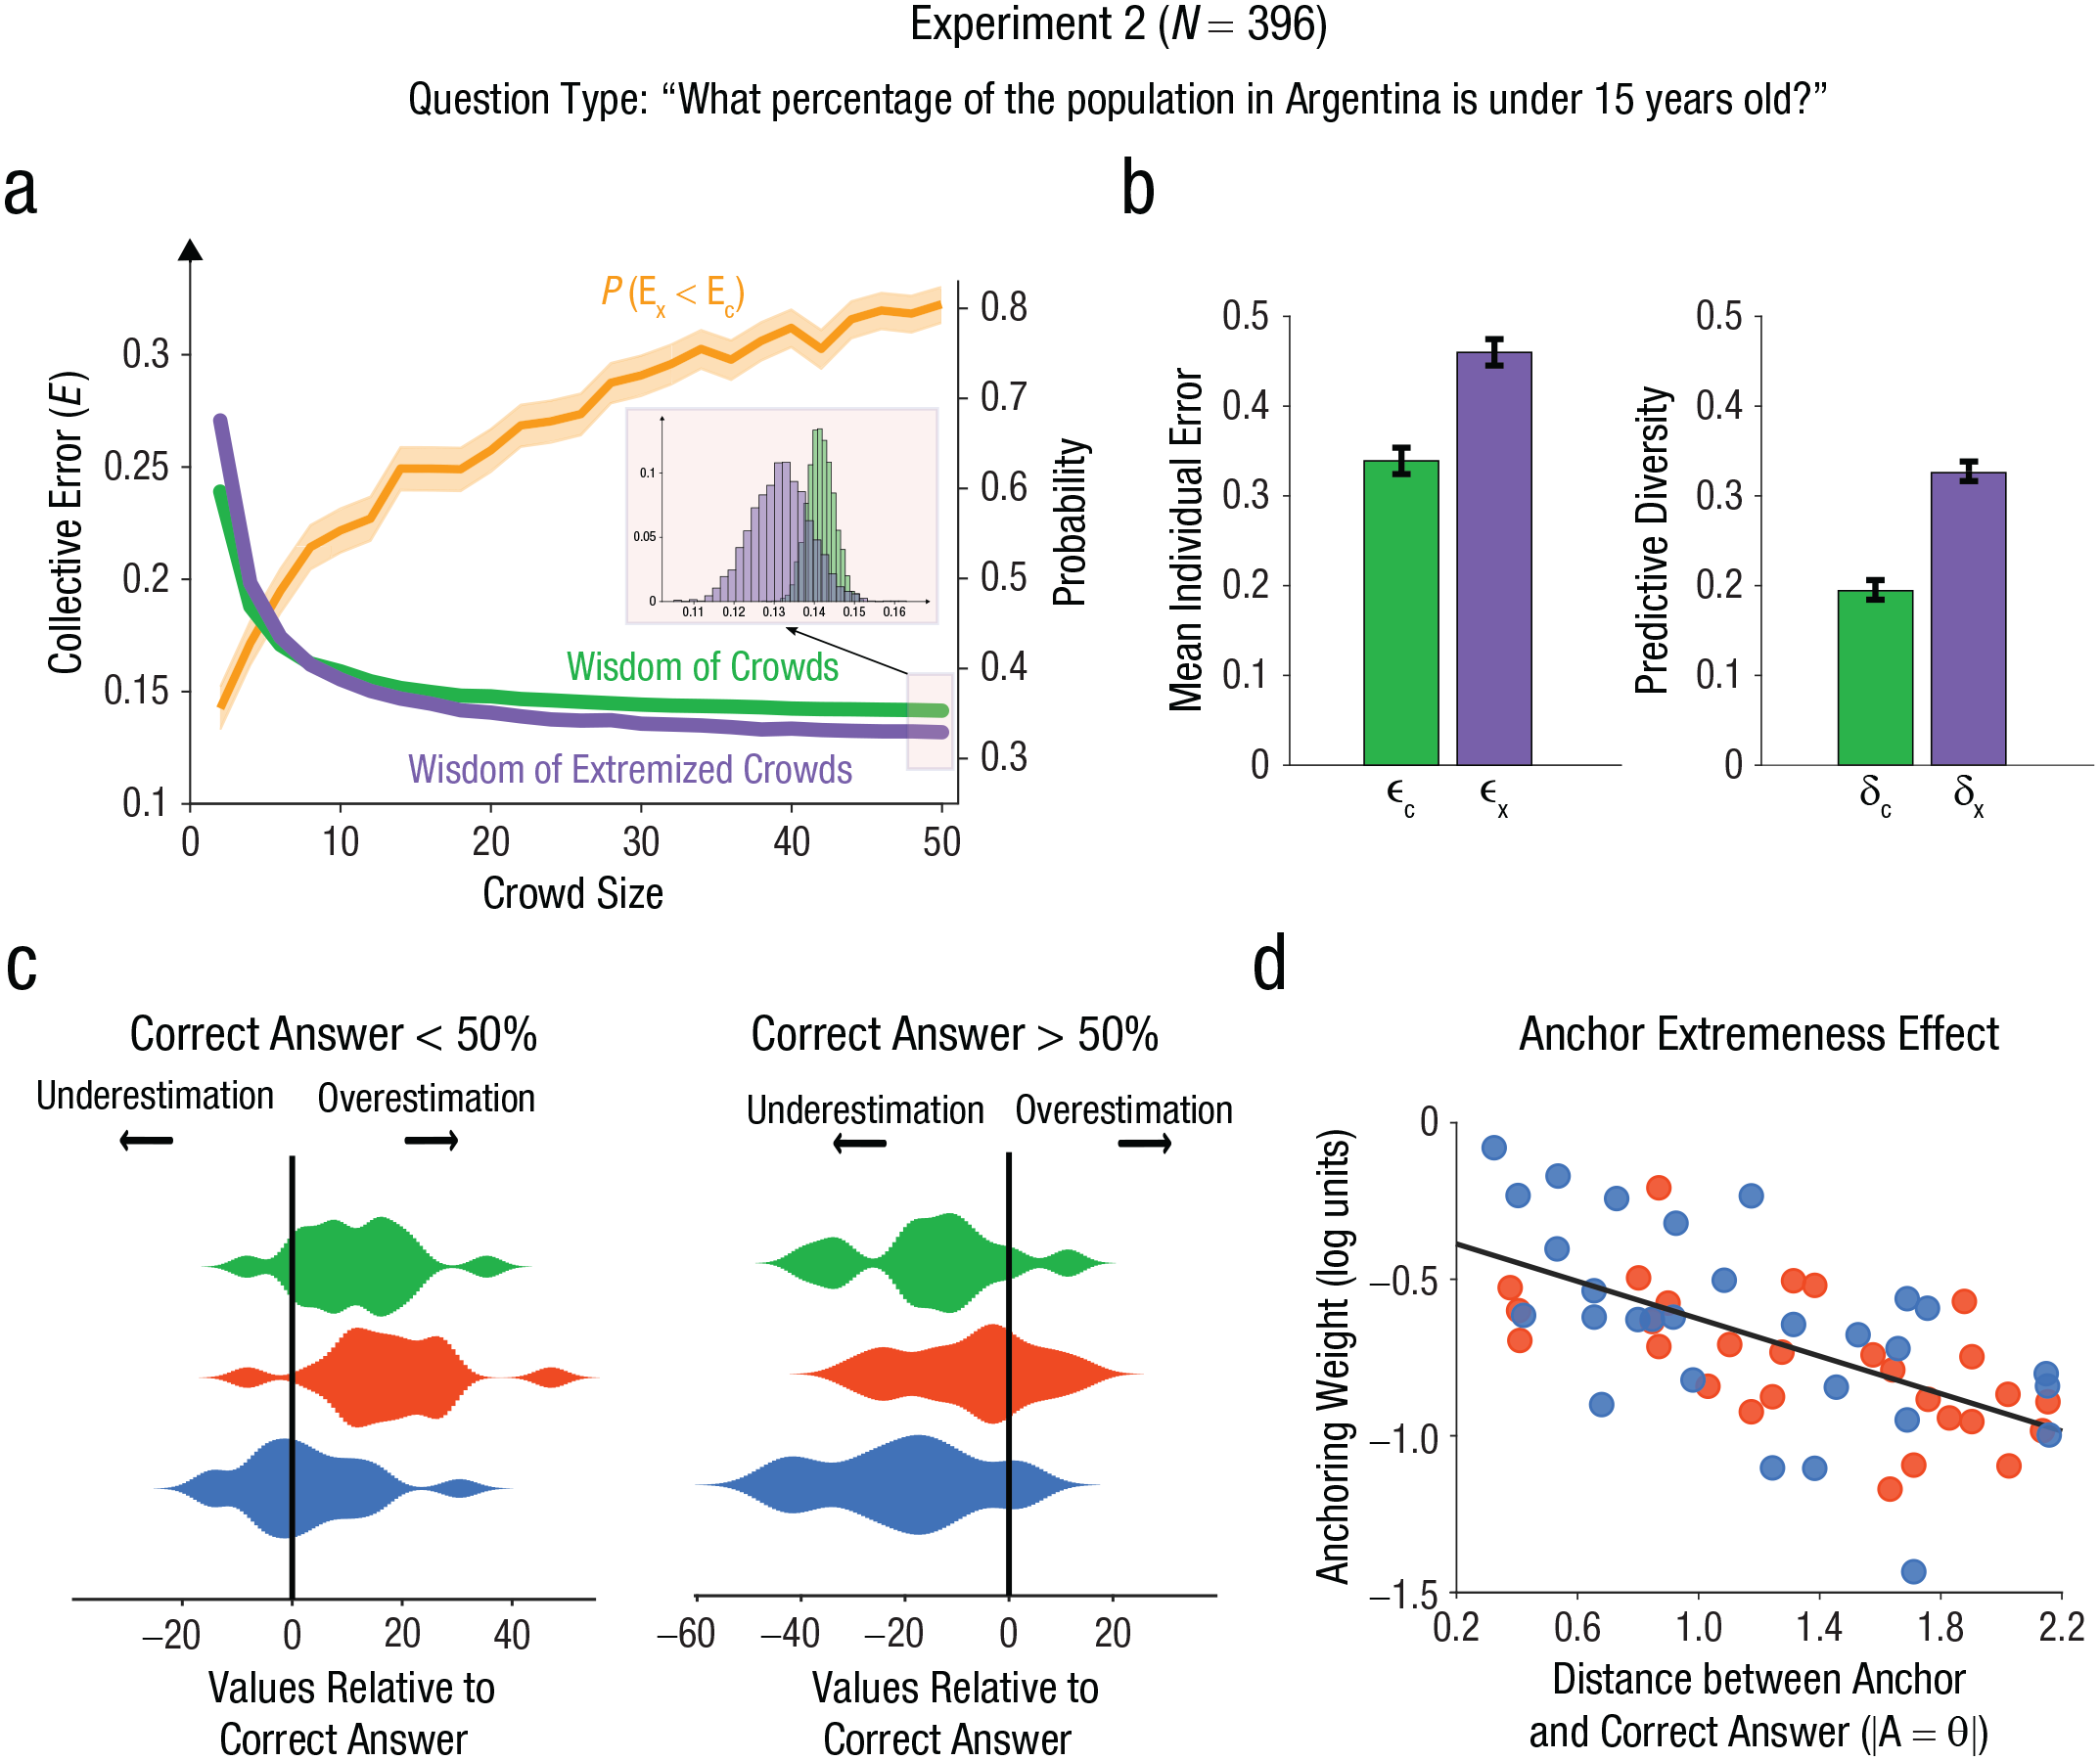
Empirical results for Experiment 2. Collective error as a function of crowd size is shown in (a) for the nonextremized wisdom of crowds (green) and for the wisdom of extremized crowds (purple). The standard error of the curves is within the line width. The inset shows the distribution of values from the resampling method for the largest crowd size (N = 50). The orange line depicts the probability of a sample from the distribution of collective errors of the extremized crowd (purple distribution, Ex) being smaller than a sample from the distribution of collective errors of the nonextremized crowd (green distribution, Ec). Mean individual error and predictive diversity are shown in (b) for both the nonextremized wisdom of crowds (green) and for extremized crowds (purple). The error bars show the standard deviations of the mean. In (c), we show distributions of values corresponding to the difference between the mean answers and the correct answer for each question for the nonextremized wisdom of crowds (green), the crowd extremized using a high anchor (red), and the crowd extremized using a low anchor (blue). We separate the cases where the correct answer is above 50% (left side) and where it is above 50% (right side). The black line depicts the case in which the mean value is equal to the correct answer. Empirical anchoring weight (w) for each question is illustrated in (d). Blue dots show estimates using low anchors, and red dots show the same with high anchors. The horizontal axis represents the distance between the corresponding anchor and the correct answer (logarithmic units on anchoring weight), and the black line shows the best linear fit of the data.
Given that this experiment used fixed anchors across all questions, it allowed us to test one key element of the model—the anchoring extremeness effect (Equation 4). We did so by performing two separate analyses. First, we examined the biases associated with each experimental condition. We reasoned that, if anchoring was sensitive to the distance to the correct answer, then the effectiveness of the procedure should be higher when the correct answer is close to the anchor. For example, we should see that participants considering a low value (5%) should be more attracted to the anchor when the correct answer is low (below 50%) compared to when the correct answer is high (above 50%). Consistent with this idea, when the correct answer was below 50% (17 questions), we did not observe any statistical difference between the distribution of estimates provided by the population considering the low anchor and the correct answer—paired t test: t(16) = 0.95, p = .36; effect size: Cohen’s d = 0.23, 95% CI = [−0.44, 0.90]. Bayes factor analysis provided moderate support for the null hypothesis (Bayes factor = 2.7). More importantly, both the nonanchored population—paired t test: t(16) = 4.16, p = 3 × 10⁻⁴; effect size: Cohen’s d = 1.11, 95% CI = [0.39, 1.83]—and the population anchored to a high value—paired t test: t(16) = 5.99, p = 2 × 10⁻⁵; effect size: Cohen’s d = 1.45, 95% CI = [0.69, 2.21]—provided a distribution of estimates that significantly overestimated the correct answer (Fig. 3c). Conversely, when the correct answer was above 50% (13 questions), we observed the opposite pattern: The population considering the high anchor provided a distribution of estimates that was not statistically distinct from the correct answer—paired t test: t(12) = 2.01, p = .07; effect size: Cohen’s d = 0.56, 95% CI = [−0.22, 1.34]—and Bayes factor analysis suggested very weak evidence in favor of the alternative hypothesis (Bayes factor = 0.77). Crucially, both the nonanchored population—paired t test: t(16) = 3.90, p = .001; effect size: Cohen’s d = 1.08, 95% CI = [0.26, 1.90]—and the population anchored to a low value—paired t test: t(16) = 4.90, p = 4 × 10⁻⁴; effect size: Cohen’s d = 1.36, 95% CI = [0.51, 2.21]—provided a distribution of estimates that significantly underestimated the correct answer.
Second, we directly examined the anchoring extremeness effect by studying the association between the strength of the anchoring procedure and the distance between the anchor and the correct answer (Equation 4). We estimated the strength of the anchoring effect by calculating the anchoring weight, which has very similar properties to the “anchoring index” of previous literature (Jacowitz & Kahneman, 1995). Both quantities take a value of 0 when the anchoring procedure does not produce any effect on the estimates and a value of 1 when the estimates are, on average, equal to the anchor (see Equation 7 in the Supplemental Material for details). Consistent with the existence of the anchoring extremeness effect (Röseler et al., 2022), we observed a significantly negative correlation between the anchoring weight and the distance between the anchor and the correct answer (Pearson correlation coefficient r = −0.56, p = 3 × 10⁻⁶). This empirical observation provides support to the proposed model of the anchoring effect used in Equations 2, 3, and 4.
To test the functional form of the proposed model, we compared it with two other monotonically decreasing functions. One is a linear function and the other one is a general hyperbolic function,

which is similar to the one used in the temporal-discounting literature (Ruggeri et al., 2022). We found that the exponential model led to better fits to the data as assessed by both the Akaike information criterion (AIC) and the Bayesian information criterion (BIC; linear model: ∆AIC = 1.9, ∆BIC = 1.9; hyperbolic model: ∆AIC = 0.59, ∆BIC = 0.59).
Another assumption of the proposed anchoring model is that low and high anchors elicit the same anchoring weights. Given that this feature of the model could be an oversimplification for specific problems (e.g., city populations), we compared the goodness of the fits achieved with a single anchoring weight per question with the one obtained with different weights for low and high anchors. Formal model comparison indicated that having a single weight per question led to better fits than the model with asymmetrical weights (∆AIC = 1.6, ∆BIC = 5.7).
Finally, this experiment allowed us testing if the proposed method is robust to the use of different aggregation procedures, like the simple average, the median, and a performance-weighted average (Collins et al., 2023; Mannes et al., 2014). We found evidence that, regardless of the specific aggregation procedure, crowds extremized through anchoring were always more accurate than nonextremized crowds (see Fig. S3; for details, see the Supplemental Material).
Experiment 3: Forecasting
Subsequently, we asked whether the proposed method can be useful to outperform the wisdom of crowds on forecasting tasks—that is, for domains where the truth is unknown and unavailable at the time of the experiment. To answer this question, we performed a third preregistered experiment that took place in the midst of the COVID-19 crisis (https://aspredicted.org/HZC_PTH). The protocol was reviewed and approved by a local Institutional Review Board (CEMIC 435-5).
Method
Participants and questions
We recruited 620 participants (312 female, mean age = 46.1 years, SD = 15.7 years) from the United States and asked them to estimate the total number of COVID-19 cases and deaths that would occur in the United States in the following week (from July 27 to August 2, 2020). Thus, the answers were positive (unbounded), resembling a typical wisdom-of-crowds experiment, but related to quantities that were unknown at the time of the experiment. Participants were recruited online by using Prolific (https://www.prolific.co/) and resided in the United States at the time of the experiment. Participants had monetary incentives to estimate these variables as accurately as possible. Anchors were selected as extreme values on the basis of historical data, namely, two orders of magnitude less or more than the number of COVID-19 cases and deaths reported in the 2 weeks before the beginning of the experiment (see Table S4 in the Supplemental Material for the questions used in Experiment 3).
Procedure
In Experiment 3, developed using Survey Monkey (https://www.surveymonkey.com/), we asked two questions related to the COVID-19 pandemic: We asked participants to forecast the number of COVID-19 deaths and cases in the week following the experiment. Anchors were selected as extreme values on the basis of the historical data mentioned above—namely, two orders of magnitude less or more than the number of COVID-19 cases and deaths reported in the 2 weeks before the beginning of the experiment. The correct answers to those questions were unknown at the time of the experiment. Because all participants answered both questions, there were six conditions in this experiment. In Condition 1, we used a low anchor on COVID-19 deaths. We asked participants whether they thought there would be more or less than 40 new deaths in the week following the experiment and then asked them to forecast the number of new deaths. In the next screen, participants also forecast the number of new COVID-19 cases in the week following the experiment. Condition 2 was the same as Condition 1, but with a high anchor (400,000) on COVID-19 deaths. In Condition 3, we did not anchor people’s expectations (which served as a control for Conditions 1 and 2). We first asked people to forecast the number of new deaths in the following week. In the following screen, participants forecast the number of new COVID-19 cases in the same week. Condition 4 was analogous to Condition 1, but we changed the order of the questions and set an anchor on cases, instead of on deaths. First, we asked participants whether they thought there would be more or less than 8,000 new cases in the following week; then we asked them to estimate the number of new cases. In the next screen, participants forecast the number of new COVID-19 deaths in the same week. Condition 5 was the same as Condition 4, but with a high anchor (8,000,000) on COVID-19 cases. In Condition 6 we did not ask any anchoring questions, and participants were directly asked to forecast the number of new cases and then the number of new deaths in the week following the experiment. This condition was analogous to Condition 3 (although we changed the order of the questions), and it serves as a control for Conditions 4 and 5.
We collected data from 117 participants in Condition 1, 105 participants in Condition 2, 97 participants in Condition 3, 92 participants in Condition 4, 97 participants in Condition 5, and 112 participants in Condition 6. The total sample of 600 participants, obtained through Prolific (https://www.prolific.co/), was representative of the U.S. population in terms of age, gender, and ethnicity. We aimed for 100 participants per condition, in order to have a maximum crowd size of 100 for our resampling analysis (as preregistered at https://aspredicted.org/HZC_PTH). This was done to further assess the asymptotic behavior of the collective errors with crowd size. All participants received a flat participation fee of USD$1.00, and, to incentivize forecasting accuracy, we paid a bonus of USD$2.00 to participants in the top 10%. There was no time limit to answer these questions.
Data analysis
For Experiment 3, given that it consisted in forecasting questions, and that every participant completed the survey, there was no need to exclude any of them. All of them answered both forecasting questions. We followed the same bootstrapping procedure as our previous experiments.
Results and discussion
Again, as in Experiments 1 and 2, we observed that the collective error was lower for the extremized crowd for all group sizes compared to the nonextremized wisdom of crowds (Fig. 4a). We found that the decrease in collective error (specifically, for the largest crowd size, N = 100)—unpaired t test: t(998) = 16.4, p = 7 × 10−54; effect size: Cohen’s d = 1.04, 95% CI = [0.95, 1.13]—was due to an increase in predictive diversity (crowd size N = 100)—unpaired t test: t(998) = 37.6, p = 7 × 10−193; effect size: Cohen’s d = 2.5, 95% CI = [2.4, 2.6]. This increase in predictive diversity was in turn greater than the increase in mean individual error (Fig. 4b; crowd size N = 100), unpaired t test: t(998) = 18.1, p = 1 × 10−64; effect size: Cohen’s d = 1.2, 95% CI = [1.1, 1.3]. This study demonstrates that the presented strategy is also useful for a forecasting task.
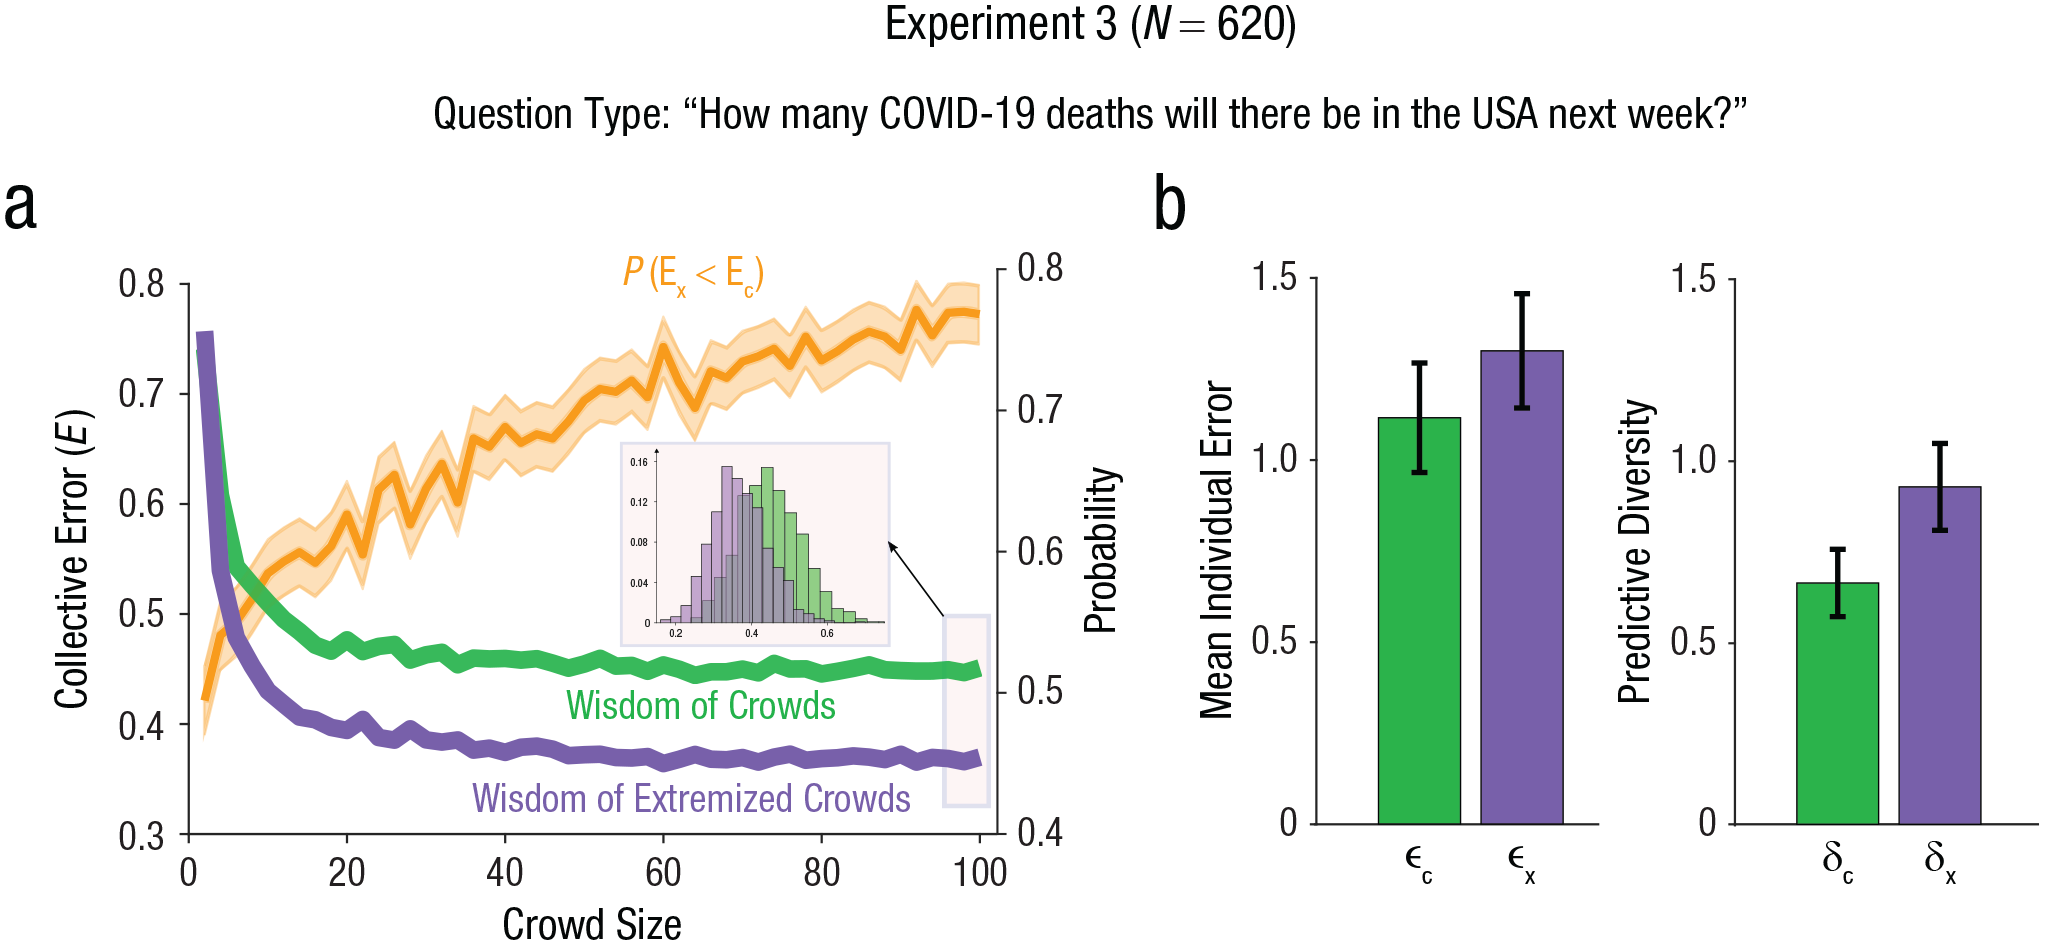
Empirical results for Experiment 3. Collective error as a function of crowd size is shown in (a) for the nonextremized wisdom of crowds (green) and for the wisdom of extremized crowds (purple). The standard error of the curves is within the line width. The inset shows the distribution of values from the resampling method for the largest crowd size (N = 100). The orange line depicts the probability of a sample from the distribution of collective errors of the extremized crowd (purple distribution, Ex) being smaller than a sample from the distribution of collective errors of the nonextremized crowd (green distribution, Ec). Mean individual error and predictive diversity are shown in (b) for both the nonextremized wisdom of crowds (green) and the extremized crowd (purple). The error bars represent standard deviations of the mean.
Experiment 4: Self-Generated Anchors
One limitation of Experiments 1 through 3 is that, in all cases, participants had access to additional information (either because anchors were predefined by the experimenters or because participants had access to responses given by other participants). Experiment 4 addressed that limitation by using self-generated anchors. The experiment was preregistered (https://aspredicted.org/YQ4_LYS) and used questions similar to those tested in Experiment 1. The key difference is that participants were prompted to generate their own anchors. The protocol was reviewed and approved by a local Institutional Review Board (CEMIC 435-5).
Method
Participants and questions
We recruited 226 participants (110 female, mean age = 37.2 years, SD = 12.1 years). All participants were residents of Argentina at the time of the experiment and were recruited online. We asked them 10 general-knowledge questions that involved the estimation of the height of a building (e.g., “What is the height of the Eiffel Tower?”). Unlike all the previous experiments, the anchors were self-generated, meaning that participants provided their own respective anchors (see Table S5 in the Supplemental Material for the full list of questions).
Procedure
This experiment was developed using PsyToolkit (Stoet, 2010, 2017). One third of the sample was randomly assigned to a control condition, in which they simply estimated a variable. After participants completed all 10 questions, we asked them to provide new, different estimates for each one of them. This procedure allowed us to compare whether the self-generation of anchors in the treatment conditions was different or not from the phenomenon of dialectical bootstrapping (Herzog & Hertwig, 2009).
The two other groups of participants, representing two thirds of the total, were randomly assigned to the experimental condition in which, before starting the main questionnaire, they were asked to estimate the height of the tallest building on Earth and the height of the shortest building on Earth. The values they provided were used as the high and low anchors, respectively, for all the estimation questions. We added 10% zero-mean uniform noise to these preliminary estimates so that each question with the same base anchor had a slightly different value. Thus, before estimating the quantity in question, they were asked to consider either an extremely low or an extremely high value (e.g., “Is the height of the Eiffel Tower higher or lower than 1,000 meters?”). For each question, half of the anchored participants considered a low value and the other half considered a high value (randomly assigned). Overall, we collected data from 75 participants in the control condition and 151 participants in the experimental condition. The sample size for each condition was determined through power analyses (as indicated in our preregistration, details are available at https://aspredicted.org/YQ4_LYS). In all cases, the questions were presented in random order. All participants had a maximum of 25 s to answer. Estimation was not incentivized for accuracy.
Data analysis
We discarded data from participants who completed the survey in less than 2 min and from those who failed to complete half or more of the questions in the survey. We also excluded participants with two or more exactly correct answers (which likely reflects cheating). These were the same exclusion criteria as for Experiments 1 and 2. These exclusion criteria were preregistered. For Experiment 4 we followed the same bootstrapping procedure as for our previous experiments.
Results and discussion
As with previous experiments, we observed that collective error was lower for the extremized crowd for all group sizes compared to the nonextremized wisdom of crowds (Fig. 5a). For the largest crowd size, N = 70, we found that the decrease in collective error—unpaired t test: t(998) = 58.4, p < 10−200; effect size: Cohen’s d = 3.7, 95% CI = [3.6, 3.8]—was due to an increase in predictive diversity—unpaired t test: t(998) = 78.5, p < 10−200; effect size: Cohen’s d = 4.9, 95% CI = [4.7, 5.1]. This increase in predictive diversity was in turn greater than the increase in mean individual error (Fig. 5b; crowd size N = 70), unpaired t test: t(998) = 33.9, p = 2 × 10−168; effect size: Cohen’s d = 2.2, 95% CI = [2.1, 2.3]. To summarize, we demonstrated in this study that the presented strategy is also useful when employing self-generated anchors. This means that the problem of choosing appropriate anchors can be easily solved by asking participants to provide their own anchors.
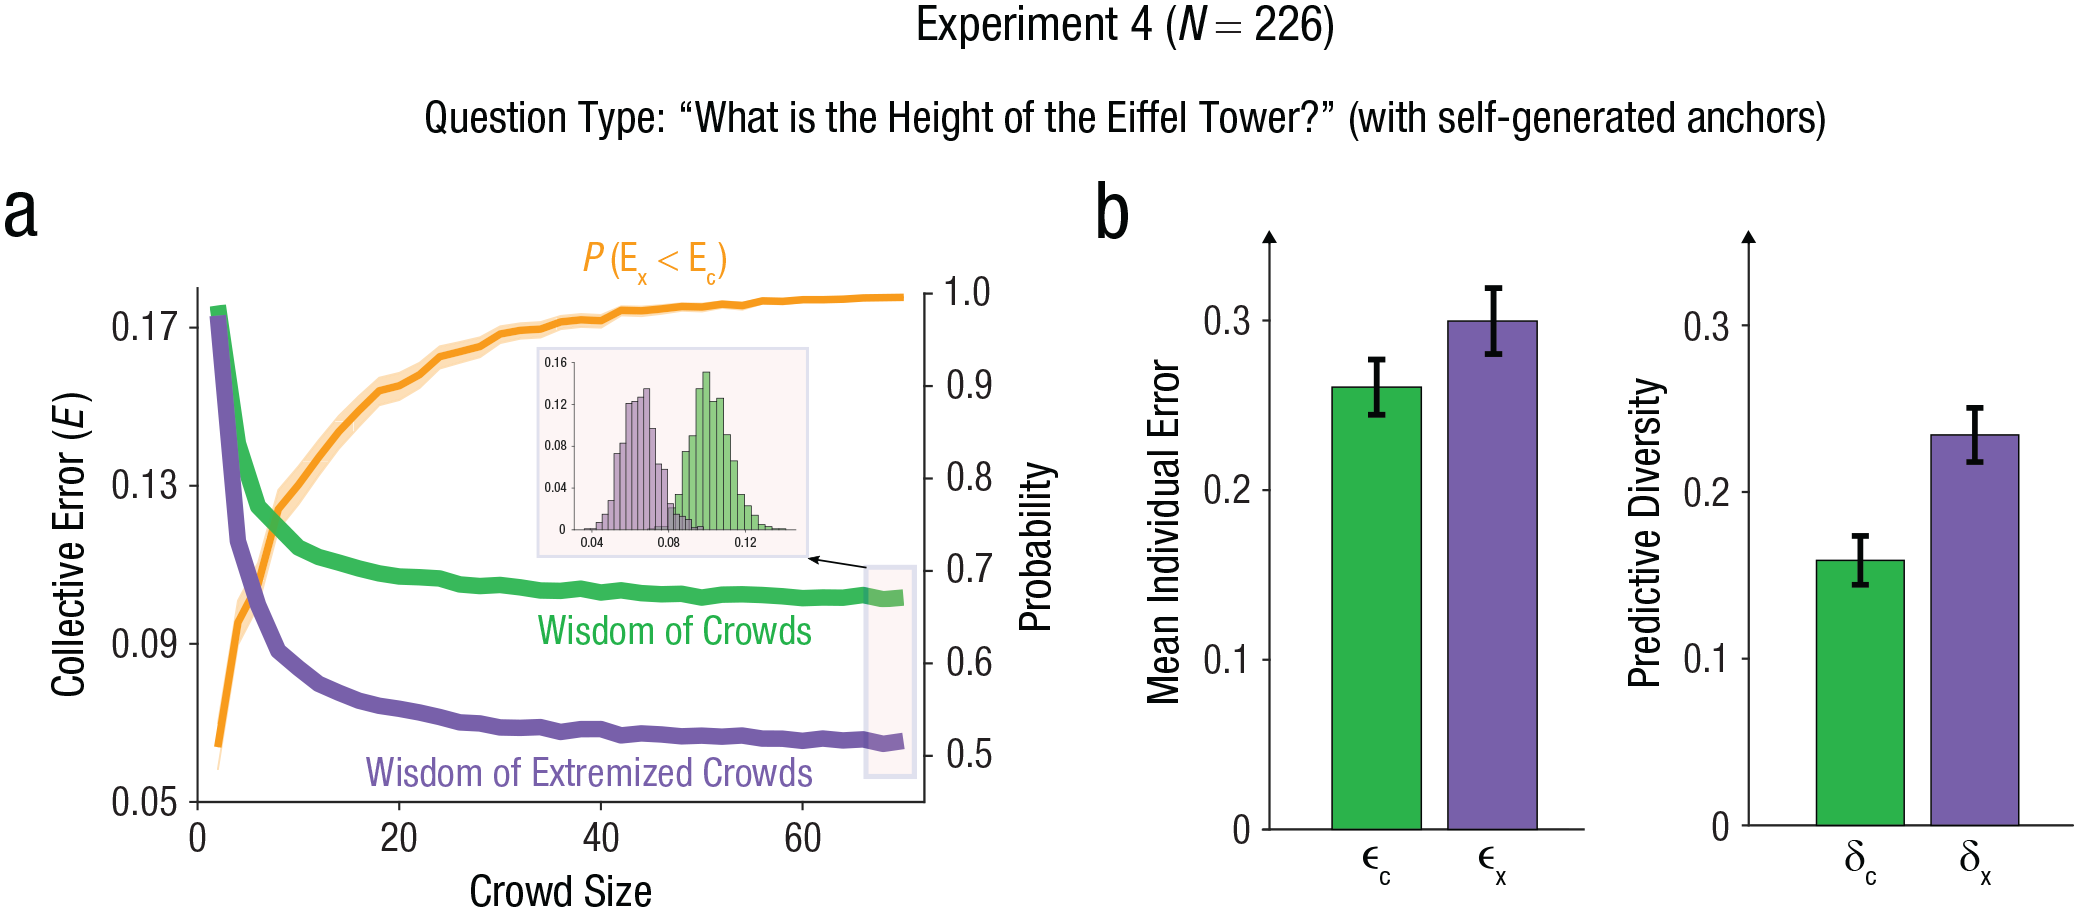
Empirical results for Experiment 4. Collective error as a function of crowd size is shown in (a) for the nonextremized wisdom of crowds (green) and the wisdom of extremized crowds (purple). The standard error of the curves is within the line width. The inset shows the distribution of values from the resampling method for the largest crowd size (N = 70). The orange line depicts the probability of a sample from the distribution of collective errors of the extremized crowd (purple distribution, Ex) being smaller than a sample from the distribution of collective errors of the nonextremized crowd (green distribution, Ec). Mean individual error and predictive diversity are shown in (b) for both the nonextremized wisdom of crowds (green) and the extremized crowd (purple). The error bars represent standard deviations of the means.
We then studied the relationship between this procedure and the wisdom-of-the-inner-crowd effect. Given that participants generated their own anchors, we reasoned that this effect could, in principle, partially explain the efficacy of the method. However, we were able to rule out this possibility, as the wisdom of extremized crowds produced much more accurate collective estimates than the wisdom of the inner crowd (for details, see “Self-generated Anchors and the Wisdom of the Inner Crowd” in the Supplemental Material).
General Discussion
In this work, we introduce a novel strategy to outperform the wisdom of crowds (Surowiecki, 2005) that has both practical and theoretical implications. By means of the anchoring effect (Tversky & Kahneman, 1974), we have shown that we can reduce collective error by increasing predictive diversity (Page, 2007). In previous literature, methods to increase the wisdom of crowds often involved strategies to reduce individual error (Madirolas & de Polavieja, 2015; Mannes et al., 2014). Theoretical analysis suggested this goal could also be achieved by increasing the predictive diversity (as seen in Equation 1), but that possibility remained unexplored. Here, we thoroughly studied this approach both theoretically and empirically: first, by developing a mathematical model of the anchoring effect and, second, by performing four behavioral experiments.
In all of the experiments, regardless of differences in sample size, country of implementation, use of bounded or unbounded quantities, anchor-setting procedure, and use of estimation or forecasting in the task, we observed very similar results. Extremized crowds always produced estimates with lower collective error, and this was always accompanied by an increase in both mean individual error and predictive diversity. This demonstrates that it is possible to increase collective intelligence while concurrently reducing individual accuracy, an approach that remained heretofore empirically untested. This should inspire future research aimed at increasing the wisdom of crowds by using a similar strategy.
One limitation of the proposed method is that the selection of appropriate anchors could potentially prove hard (for example, in forecasting problems). However, our model-based analyses as well as our empirical findings suggest that the range of values where this method improves the wisdom of crowds is large (Equation 4). We also showed that adequately selecting anchors is empirically feasible across four very different setups. In Experiment 1, the anchors were chosen on the basis of extremely high and low values (the 5th and 95th percentiles) of the nonanchored distribution. This procedure, however, has a disadvantage: It involves sharing information between different groups of participants, and this could partly explain changes in collective performance (e.g., Becker et al., 2017, 2022; Navajas et al., 2018). In Experiment 2, we studied the estimation of percentages while keeping anchors fixed at 5% and 95%. With this experiment we showed that the method still works in a condition in which anchors were predefined across all questions. This setup also allowed us to obtain empirical support for the proposed anchoring model. In Experiment 3, we shifted the focus of attention to forecasting problems. Anchors were defined a priori, using historical data. Given that the correct answer was unknown to the experimenters before conducting the study, this setup demonstrated that even in highly uncertain forecasting problems it is feasible to select anchors so that the method would still work. However, one limitation of Experiments 1 through 3 is that, in all cases, participants had access to additional information (either because anchors were predefined by the experimenters or because participants had access to the responses given by other participants). Experiment 4 addressed that limitation by using self-generated anchors. This demonstrates that this method is useful even in conditions in which anchors are not selected by the experimenters. As with most psychological research, these studies are not without their own limitations. For example, future studies should explore the generalizability of these findings to cross-cultural settings and more extended contexts.
The first study on the wisdom of crowds (Galton, 1907) was regarded as an empirical demonstration that democratic aggregation principles can be reliable and efficient. This was counterintuitive at the time, because it showed that erroneous individuals could make good collective choices. Nowadays, when political opinions tend to become extremized, these results seem to suggest that democratic decisions can still be surprisingly accurate, even if collective choices proceed from misinformed voters, as long as the voters are sufficiently diverse. Therefore, one interpretation of these findings is that opinion polarization, which may stem from the attraction toward political extremes (Goldenberg et al., 2023; Zimmerman et al., 2022), can potentially improve democratic judgment, as previously proposed (Shi et al., 2019).
Studies examining how diversity influences group performance have provided dissimilar results, with both positive (e.g., Mohammed & Ringseis, 2001) and negative (e.g., Navajas et al., 2022) effects present in the collective decision-making literature (for a review, see Sulik et al., 2022). This suggests that accumulating diverse evidence (Couch, 2022) may not be good or bad per se but is dependent on the interaction with variables such as group size (Pescetelli et al., 2021) and network structure (Baumann et al., 2024). This article adds to this literature by showing that increasing diversity may reduce accuracy at the individual level but increase it at the collective level. Crucially, we demonstrated this novel insight in a complex forecasting domain in which there is a longstanding tradition examining the epistemic value of combining diverse predictions (Bates & Granger, 1969). Although this work demonstrated the existence of this phenomenon and studied its robustness across different aggregation methods, we believe future work can refine the wisdom of extremized crowds by, for example, combining them with the use of debiasing through generative models (Lee & Danileiko, 2014; Lee et al., 2023).
Supplemental Material
sj-pdf-1-pss-10.1177_09567976241252138 – Supplemental material for Promoting Erroneous Divergent Opinions Increases the Wisdom of Crowds
Supplemental material, sj-pdf-1-pss-10.1177_09567976241252138 for Promoting Erroneous Divergent Opinions Increases the Wisdom of Crowds by Federico Barrera-Lemarchand, Pablo Balenzuela, Bahador Bahrami, Ophelia Deroy and Joaquin Navajas in Psychological Science
Footnotes
Transparency
Action Editor: Vladimir Sloutsky
Editor: Patricia J. Bauer
Author Contributions
References
Supplementary Material
Please find the following supplemental material available below.
For Open Access articles published under a Creative Commons License, all supplemental material carries the same license as the article it is associated with.
For non-Open Access articles published, all supplemental material carries a non-exclusive license, and permission requests for re-use of supplemental material or any part of supplemental material shall be sent directly to the copyright owner as specified in the copyright notice associated with the article.