
Abstract
Do individuals possess a “gaze fingerprint” that reveals how they uniquely look at the world? We tested this question by examining intra- and intersubject gaze similarity across 700 static pictures of complex natural scenes. Independent discovery (n = 105) and replication data sets (n = 46) of adults aged 18 to 50 years (sampled from Italy and Germany) revealed that gaze fingerprinting is possible at relatively high rates (e.g., 52%–63%) compared with chance (e.g., 1%–2%). We also identify gaze-fingerprint barcodes, which reveal a unique individualized code describing which stimuli an individual can be gaze-fingerprinted on. Preregistered longitudinal follow-up experiments have shown that gaze-fingerprint barcodes are nonrandom within an individual over short and long time fraframmes. Finally, we find that increased gaze fingerprintability for social stimuli is associated with decreased levels of autistic traits. To summarize, this work showcases the potential of gaze fingerprinting for isolating traitlike factors that may be of high neurodevelopmental and biological significance.
Human gaze patterns provide one of the most important signals regarding what individuals find most salient about their environments. Gaze behavior varies considerably within and between individuals and can be influenced by a variety of statelike and traitlike factors. Statelike factors can be broadly construed as factors extrinsic to the individual that are stimulus-dependent, context-dependent, or situationally dependent, or a combination of these (e.g., bottom-up salience of stimulus characteristics, viewing conditions, task or social constraints, reward environments, novelty; Borji et al., 2013; de Haas et al., 2019; Einhauser et al., 2008; Guy et al., 2019; Henderson & Hayes, 2017; Itti et al., 1998; Xu et al., 2014). In contrast, traitlike factors imply an intrinsic or individualized uniqueness to gaze behavior that may be invariant across situations and context and that show characteristics such as temporal stability and idiosyncrasy (Avni et al., 2020; Broda & de Haas, 2022; de Haas et al., 2019; Guy et al., 2019; Keles et al., 2022; Linka & de Haas, 2020; Linka et al., 2022). The existence of traitlike components can be supported by neurodevelopmental research in twin populations. Such work has revealed heritable common genetic variation to be one such powerful within-individual mechanism constraining gaze behavior in infants and children (Constantino et al., 2017; Kennedy et al., 2017; Portugal et al., 2023). Computational modeling of gaze behavior also indicates that it is possible to isolate traitlike idiosyncratic gaze-behavior tendencies. For example, some recent work has suggested that idiosyncratic gaze patterns can be predicted by computational models that learn how gaze relates to an individual’s intrinsic conceptual priorities (Haskins et al., 2025). Thus, combined evidence from prior neurodevelopmental, genomic, and computational modeling suggests that it may be possible to isolate individuating signatures, or “fingerprints,” in gaze behavior that are of high neurobiological and developmental significance.
Gaining a better understanding of intrinsic traitlike components explaining human gaze is also important for its implications on new technology and other translational endeavors. New technologies are emerging that routinely collect eye-gaze data at scale in very large quantities. The ability to identify individuals by what they look at merged with other personal data could have a very large impact and raise issues regarding privacy (Cantoni et al., 2018; Kröger et al., 2020; Liebling & Preibusch, 2014; Rigas et al., 2016). Gaze-fingerprint markers may also be of high translational relevance for conditions in which gaze is atypical, such as autism. Atypical gaze is evident in autism both in early development (Constantino et al., 2017; Jones & Klin, 2013) and at older ages (Wang et al., 2015). Such atypical social-visual engagement in autism is theorized to be a manifestation of genetically constrained, yet atypical, biological-niche construction (Johnson, 2017; Johnson et al., 2015; Klin et al., 2020; Lombardo et al., 2019; Shultz et al., 2018). Gaze-fingerprinting markers could provide an individualized metric for underlying differential biology (Lombardo et al., 2019) and for assessing change as a function of manipulations to an individual’s environmental niche (e.g., early intervention).
In this study we investigate the phenomena of gaze fingerprinting—that is, identifying individuals on the basis of repeatable but unique spatial distributions of gaze patterns. Prior work focusing on saccade-based metrics (e.g., velocity, acceleration, vigor) has shown some promise as an individuating biometric (e.g., Bargary et al., 2017; Choi et al., 2014; Juhola et al., 2013; Rigas et al., 2016). In contrast, utilization of gaze measures that better define where and what someone samples in the environment (i.e., spatial-gaze-distribution patterns) have been much less studied. Prior work examining spatial-fixation density, gaze heat maps, or both has shown that individualized spatial-gaze patterns can be quite stable and systematic (Avni et al., 2020; Broda & de Haas, 2022; de Haas et al., 2019; Guy et al., 2019; Linka & de Haas, 2020; Linka et al., 2022). However, such work does not address whether the target individuals can be accurately identified when their gaze patterns are compared with the gaze patterns of many other distractor individuals.
To our knowledge, three prior studies have directly attempted to address whether individuals can be successfully identified solely on the basis of spatial-gaze patterns that define what they sample in complex visual environments (Keles et al., 2022; Kennedy et al., 2017; Rigas & Komogortsev, 2014). These studies suggest that some, though not all, individuals may be gaze-fingerprintable and that such gaze fingerprints may be potentially driven in part by genetic similarity. For example, two independent studies examining dynamic movie stimuli have reported identification rates around 30 to 40% (Keles et al., 2022; Rigas & Komogortsev, 2014). Both studies noted utilization of a relatively small number of dynamic movie stimuli that do not allow for sampling gaze patterns across a large variety of possible stimulus categories or contexts. Furthermore, both studies also reported observations that increasing the amount of gaze data sampled can lead to an increase in identification accuracy. These key limitations may suggest that sampling from a larger array of visual stimuli within individuals could lead to marked increases in our ability to gaze-fingerprint an individual.
To the best of our knowledge, no studies thus far have directly examined gaze fingerprinting the same individual on static pictures of complex scenes. Unlike movie viewing—an activity of longer duration—a broad array of different categories and contexts can be sampled in a short period of time with rapid presentations of many static pictures of complex visual scenes (e.g., de Haas et al., 2019; Xu et al., 2014). A study that was closely related to the concept of gaze fingerprinting showed that twin pairs could be accurately identified at a rate of 29% from gaze patterns to a small set of static pictures of complex scenes (Kennedy et al., 2017). In contrast, identification accuracy of dizygotic twin pairs was substantially lower at 7%, but higher than nontwin pairs and chance accuracy of 1% (Kennedy et al., 2017). Given the near 30% accuracy rate for identifying twin pairs, it is possible that accuracy rates for static stimuli on the same individuals may be much higher than ~30%, particularly when sampled in a big-data context with a stimulus-rich experimental design. Because the study found a dissociation in identification rate between monozygotic and dizygotic twins, it is conceptually related to gaze fingerprinting by demonstrating that the degree of gaze-similarity scales with genetic similarity. Furthermore, this twin study suggests that gaze similarity and gaze fingerprinting together may be a eye-tracking biomarker of something biologically more insightful regarding how heritable polygenic genomic architectures build early neural circuitry in ways that prepare it to seek out, explore, and construct similar environmental niches in which to develop.
The current set of studies considerably expands our understanding of the concept of gaze fingerprinting when expanded at scale in a stimulus-rich experimental design. We used a stimulus-rich experimental design that samples gaze across 700 stimuli of static pictures of complex natural scenes that span a wide range of semantic categories (Xu et al., 2014). Spatial distributions of gaze patterns were measured with gaze heat maps in a relatively large sample of participants across discovery and replication sets (discovery n = 105; replication n = 46); all individuals were tested in two repeat sessions separated by about 1 to 2 weeks (Fig. 1a). The dense sampling of gaze across such a feature-rich stimulus set allows for gaze fingerprinting based on central tendencies of gaze similarity across a large array of stimuli, but also at scale for each individual stimulus. Gaze fingerprinting at scale on individual stimuli also allows for a novel concept we have dubbed gaze-fingerprint barcoding: Individuals are uniquely identifiable by their patterns of fingerprintable stimuli sets and the semantic features describing those sets. In a second set of preregistered follow-up experiments, we tested whether gaze-fingerprint barcodes are nonrandom within individuals after a short-term delay (e.g., 19–94 days) or a long-term delay (e.g., 1.87–5.16 years). Finally, because gaze similarity is linked to genetically sensitive phenotypes, such as autism (Avni et al., 2020; Constantino et al., 2017; Keles et al., 2022; Kennedy et al., 2017; Wang et al., 2015), we assessed whether gaze-fingerprinting metrics are related to phenotypes underpinned by heritable common genetic mechanisms, such as autistic traits.
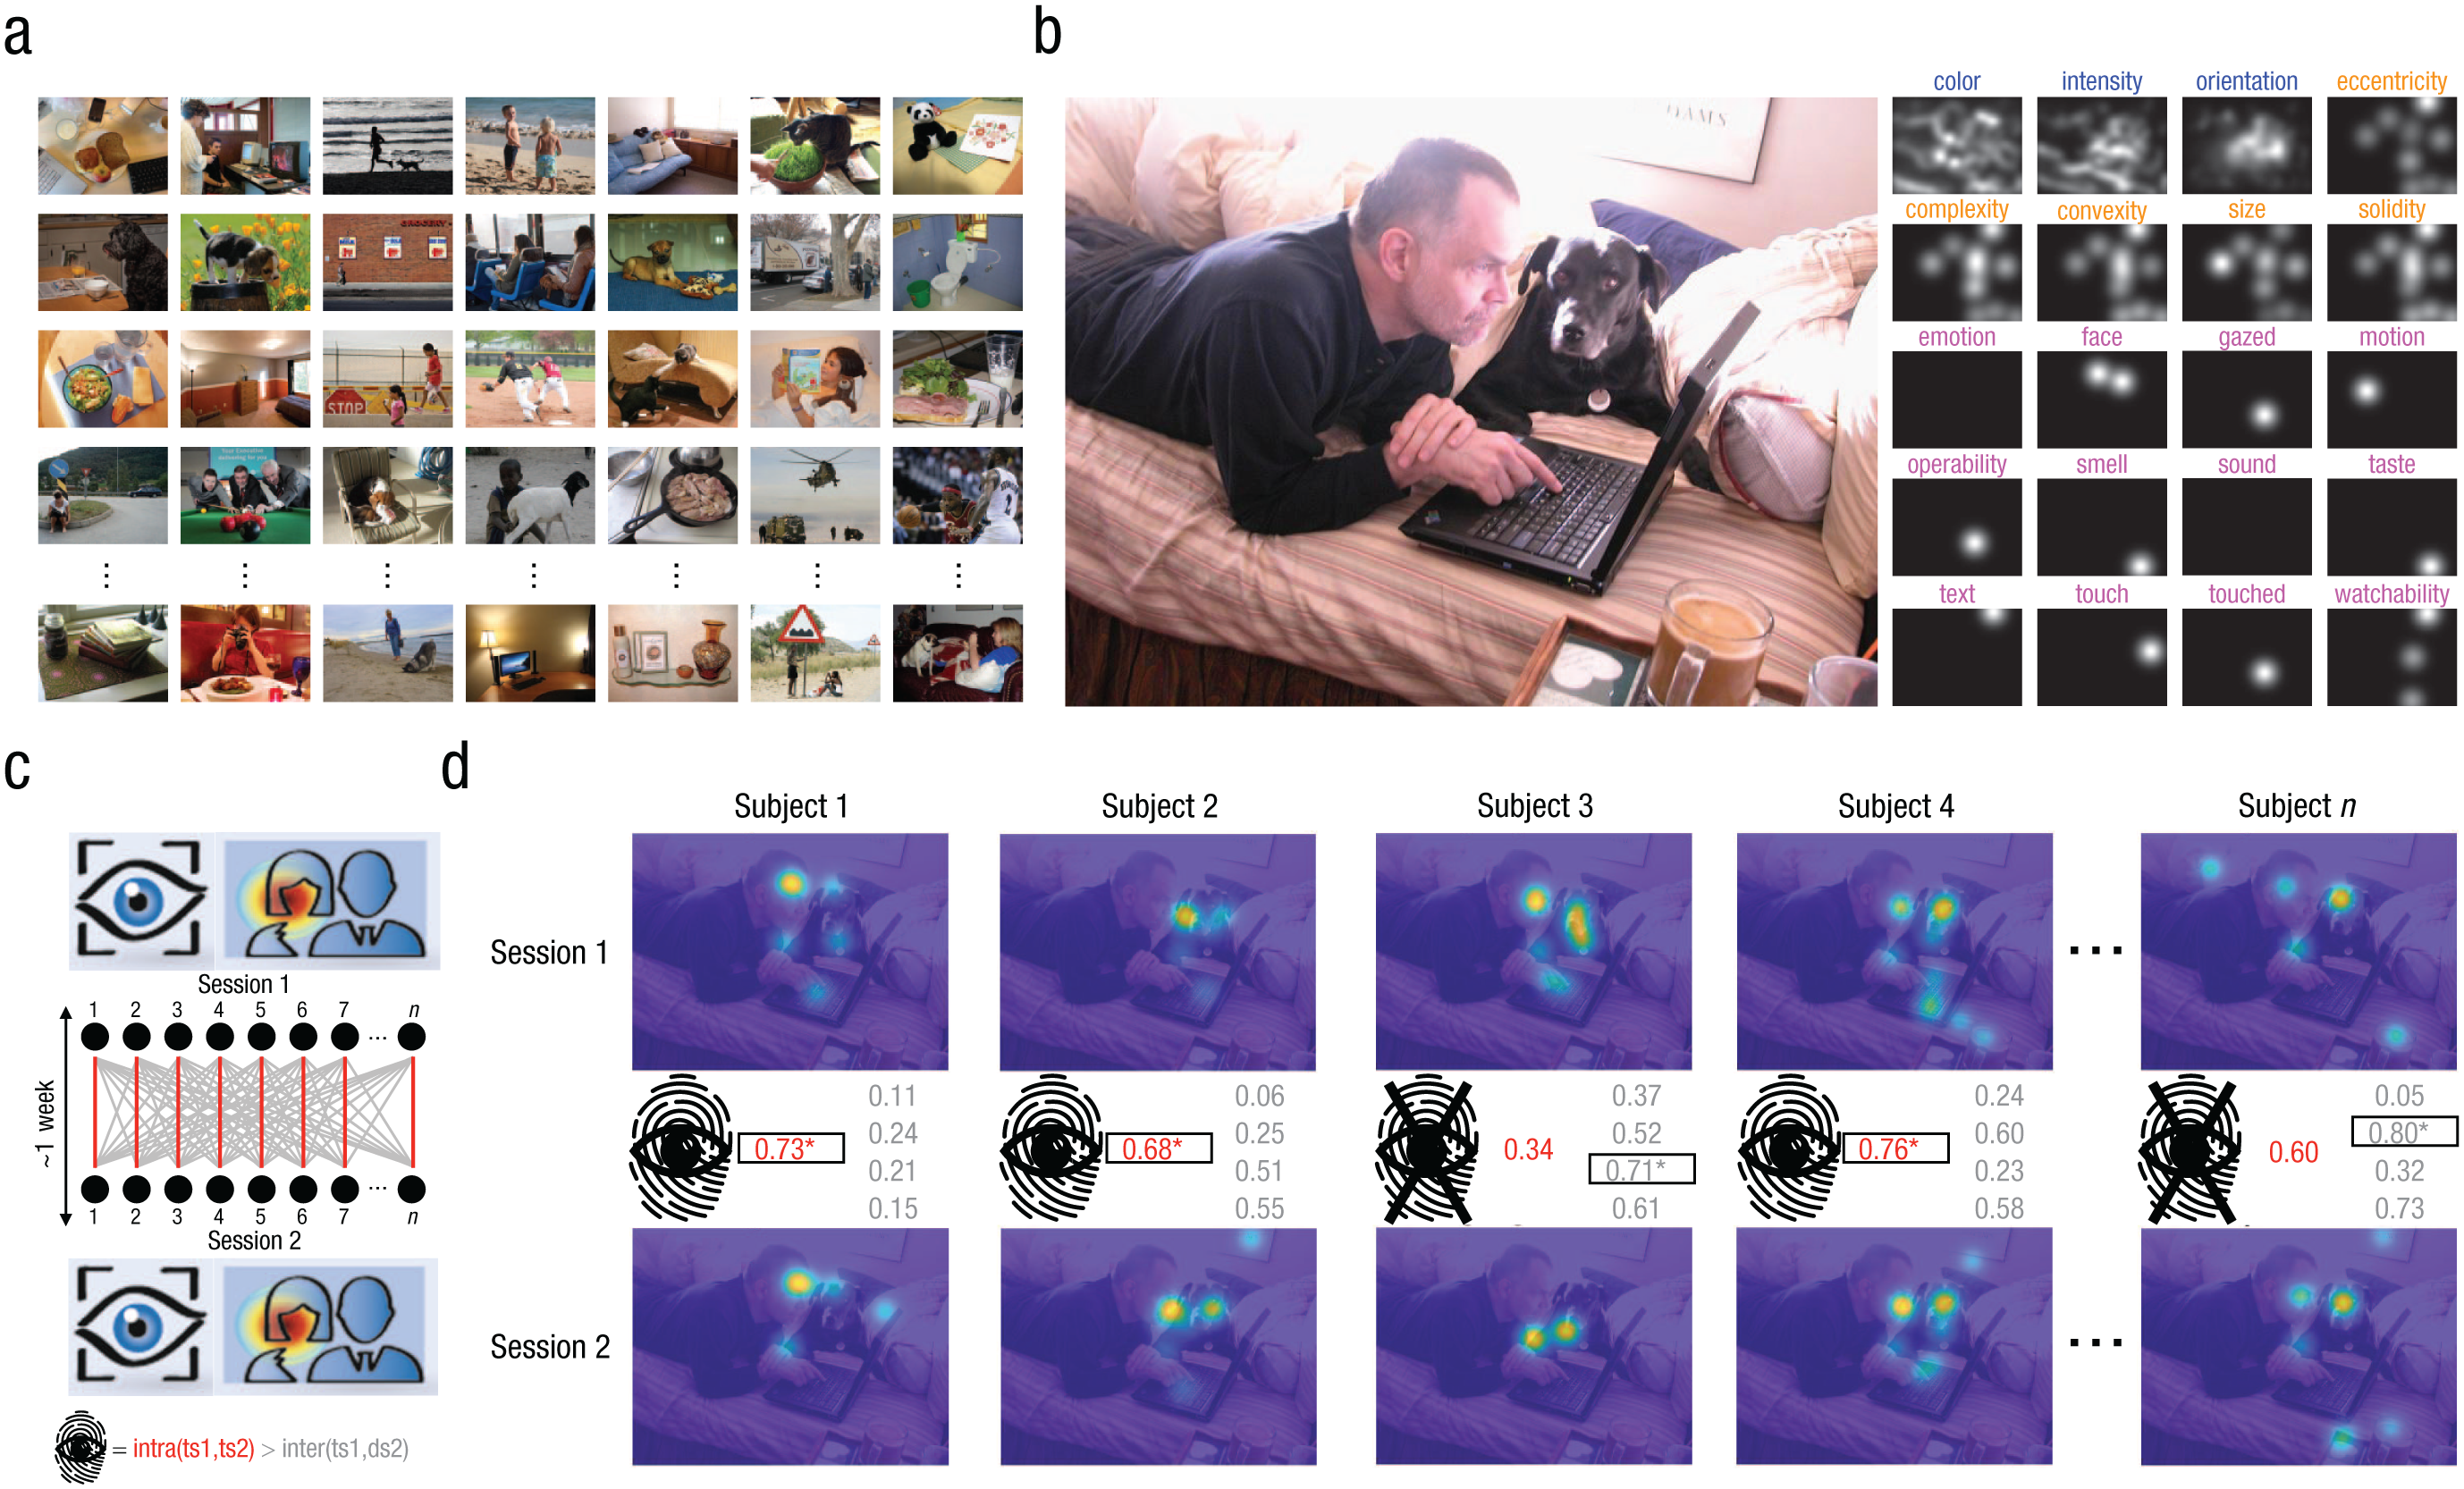
Experimental design and example of the gaze-fingerprinting approach. In (a) we show examples of the 700 stimuli in the Object and Semantic Images and Eye-tracking (OSIE) stimulus set (Xu et al., 2014). Participants were asked to freely view each of the 700 stimuli over a 3-s period in test and retest sessions separated by ~1 to 2 weeks. In (b) we show the rich annotation of the OSIE stimulus set across pixel-level (blue), object-level (orange), or semantic (pink) features. The example in (b) shows a stimulus on the left, whereas on the right are the various maps of different annotated features. In (c) we show a schematic example of the gaze-fingerprinting approach. Individuals (black dots) completing Session 1 (top) and Session 2 (bottom) are compared via their gaze heat maps for each stimulus. Red links between Session 1 and Session 2 represent the intrasubject gaze similarity between a target individual’s heat maps. The Session 1 heat maps for each target subject (ts) are also compared with Session 2 gaze heat maps for other distractor subjects (ds), and intersubject gaze similarity is computed (gray links). A gaze fingerprint is defined by a situation in which the target individual’s intrasubject gaze similarity (red) is higher than all other intersubject gaze similarity values (gray) between the target and distractor individuals, as shown in (c) at the bottom. In (d) we show a simple example of gaze fingerprinting in practice: the top row shows Session 1 heat maps, and the bottom row shows Session 2 heat maps. Intrasubject (red) and intersubject (gray) gaze-similarity values (e.g., Pearson’s r between vectorized heat maps) are shown in the middle. A gaze fingerprint occurs when the intrasubject (red) gaze-similarity value is the highest value among all intrasubject and intersubject gaze similarities for that target subject. Highest values per each subject are shown in bold and are outlined by a square. In this example scenario, gaze fingerprints are identified for 3 of the 5 example subjects (e.g., subject 1, subject 2, and subject 4, as indicated by the asterisks).
Research Transparency Statement
General disclosures
Study 1 disclosures
Study 2 disclosures
Materials and Method
Discovery data set (Study 1)
The discovery data set (henceforth “IIT”) comprised individuals tested in an eye-tracking study carried out within the Istituto Italiano di Tecnologia (IIT) Laboratory of Autism and Neurodevelopmental Disorders (IIT-LAND). This study was reviewed and approved by the local ethics committee (Comitato Etico per le sperimentazioni cliniche dell’Azienda Provinciale per Servizi Sanitari della Provincia Autonoma di Trento; APSS). All participants gave written informed consent and were reimbursed for their time participating in the study. Participants were primarily recruited through social media and convenience sampling within the University of Trento Center for Mind and Brain Sciences (CIMeC) department. A total of 120 typically developing adult participants (age range = 18–50 years) with normal or corrected-to-normal vision took part in this study. All participants participated in two sessions, and the separation between the two sessions was 7 days on average (SD = 1.46 days). Because of missing gaze data for some individuals on some stimuli (e.g., for participants who looked away from the screen), 13 individuals were excluded from analysis if more than 15% of the 700 stimuli were lacking gaze data for either Session 1 or Session 2. A further 2 participants were excluded because of delays of over 20 days between Session 1 and Session 2. The final sample utilized in all further analyses was 105 (52 female, 53 male). The sample had a mean age of 26.21 years (SD = 6.30) and was within the normal range on full-scale IQ (M = 108.65, SD = 13.09, range = 75–138). Although the main analyses on the IIT data set use all individuals, in follow-up analyses we split the IIT discovery data set by sex in order to evaluate how fingerprint accuracy varies in smaller sample sizes (n = 52 female, n = 53 male) that are on par with the size of the replication data set (e.g., n = 46; see Fig. S1 in the Supplemental Material available online).
Replication data set
As a replication data set, we reanalyzed anonymized publicly available test–retest eye-tracking data reported from de Haas et al. (2019; https://osf.io/n5v7t/). Henceforth, this replication data set is identified by the original acronym assigned by de Haas and colleagues (“Gi”). The experimental design and stimuli for both the IIT discovery and Gi replication data sets were identical in that both utilized the OSIE data set of 700 stimuli, and participants were instructed to freely view the stimuli over a 3-s period in both test and retest sessions. The primary difference between the IIT discovery and Gi replication data sets was the duration of time between test and retest sessions. Although the IIT data set had a delay of 7 days on average (SD = 1.46), the delay in the Gi replication data set was a little more than double this duration (M = 16 days, SD = 7 days). The sample size of the Gi data set was 48. However, 2 individuals were excluded from analysis if more than 15% of the 700 stimuli were missing gaze data for either Session 1 or Session 2. The sample characteristics of the Gi replication data set indicate that the sample size was smaller (n = 46) than that of the IIT discovery data set (n = 105). Furthermore, the Gi data set was primarily female (e.g., n = 11 male), whereas the sexes were relatively balanced in the IIT data set.
Eye-tracking task and stimuli
Participants were asked to freely watch 700 stimuli of complex natural scenes taken from the OSIE stimulus set (Xu et al., 2014). Stimuli in the OSIE set are annotated both for their low pixel- and object-level features as well as higher-level semantic features (Fig. 1b; Xu et al., 2014). Semantic features represented categories such as face, emotion, touched, gazed, motion, sound, smell, taste, touch, text, watchability, and operability. Further annotation beyond these 12 categories was done to label stimuli by presence or absence of humans or animals as well as a categorization of whether the stimuli had social (i.e., presence of human faces) or nonsocial (i.e., absence of humans or animals) content. Although all semantic features can be analyzed independently, they co-occur within the OSIE stimuli in a nonindependent manner (i.e., several semantic features can describe a stimulus). Therefore, to observe the emergent structure of co-occurrence of multiple semantic features as clusters, we utilized two-way agglomerative hierarchical clustering with Jaccard distance matrices and ward.D2 as the clustering agglomeration method to reveal data-driven clusters across all 700 stimuli and across all semantic features (Fig. 2a). This analysis reveals that there are two primary clusters among the 700 stimuli that largely define social versus nonsocial stimuli (Fig. 2a). Semantic features can be separated into six clusters (Fig. 2a).

Gaze-fingerprint identification rates computed on median gaze similarity across stimuli or for each individual stimulus. In (a) is shown a heat-map representation of the co-occurrence of various semantic features (columns) across all 700 stimuli (rows) in the OSIE stimulus set. Dark red indicates the presence of a stimulus in a particular semantic-feature category, whereas light yellow indicates the absence of a stimulus in a particular semantic-feature category. Colors for clusters of semantic features (underneath the column dendrogram) are also used in (b) and (d). Identification rates (i.e., accuracy) in the IIT discovery data set are illustrated in (b) through (d). The vertical black line in (b) shows accuracy (x-axis) when computing median intra- and intersubject gaze similarity over all 700 stimuli before classification of identity (dotted vertical black lines represent bootstrap 95% confidence intervals, or CIs). Each bar shows accuracy rates when computed as median gaze similarity on subsets of stimuli grouped by semantic features shown on the y-axis. In (c) we illustrate accuracy values (y-axis) for each of the 700 stimuli (each stimulus is a dot). The x-axis denotes stimuli that are fingerprintable (blue) or not (orange) based on whether accuracy rates were higher than chance at a false discovery rate (FDR) of q < 0.05. In (d) we show a bar graph of accuracy values when fingerprint accuracy is computed for each individual stimulus. The height of each bar reflects individual stimuli accuracy averaged for each semantic-feature category; the error bars depict ±1 standard error of the mean.
Procedure
Eye-tracking data in the IIT data set was collected on a Tobii Pro Spectrum machine—diagonal screen size = 24 in, aspect ratio = 16:9, resolution 1920 × 1080, screen size in degrees of visual angle (DVA) 47.7° horizontally × 28° vertically—with a sampling rate of 150 Hz. Participants sat in front of the eye-tracking monitor at a distance of approximately 60 cm with their chin on a chin rest. Stimuli were 800 × 600 pixels and were scaled to the size of the screen during stimulus presentation, resulting in stimuli size, in DVA, of 36.9° horizontally × 28° vertically. Within the Gi replication data set, eye-tracking data was collected on an EyeLink 1000 (SR Research, Ottawa, Canada) with a sampling rate of 1 kHz. Participants sat with their chin on a chin rest at a distance of 46 cm from the screen. Stimuli were presented at a resolution of 1,000 × 750 pixels with a size in DVA of 41.9 degrees horizontally × 32.1 degrees vertically. Each participant in both data sets completed two eye-tracking sessions separated by an average of 7 (IIT) to 16 (Gi) days. Within each session, participants viewed all 700 stimuli, broken into 7 blocks of 100 stimuli each. Each stimulus was shown for a duration of 3 s. Participants were given the instructions to watch the stimuli in a natural fashion (e.g., “look at the images in any way [they] want”). Stimulus presentation was randomized in such a way that within each session participants viewed the stimuli in a random order. Between the presentation of each stimulus was a fixation cross in the center of the screen. Between stimuli, the IIT data set used a jittered duration between 500 to 1,000 ms, whereas in the Gi data set proceeding to the next stimulus was self-paced; a button press was required to move on. At the end of each block, participants were given the opportunity to rest before starting the next block. The entire eye-tracking session with all seven blocks lasted approximately 60 min in the IIT data set. Stimulus presentation was implemented within MATLAB 2019b and the Psychophysics Toolbox (http://psychtoolbox.org/) Version 3.0.16 for the IIT data set, and MATLAB 2016b and Psychophysics Toolbox Version 3.0.12 for the Gi data set. Calibration was conducted using 5 (IIT) or 9 (Gi) calibration and validation points and was repeated if necessary. Within the IIT data set, we accepted an average calibration accuracy across points and across the two eyes of less than 2° of visual angle. There were no differences in calibration accuracy in the IIT data set between Session 1 and Session 2 (Session 1: mean = 0.47°, SD = 0.29°; Session 2: mean = 0.47°, SD = 0.22°; t(104) = 0.003, p = .99). Additionally, there were no associations between calibration data quality and gaze-fingerprinting measures or other behavioral variables (e.g., autistic traits; see Table S1 in the Supplemental Material). Calibration data quality for the Gi data set was not available and thus could not be explored further.
Behavioral measures
At the end of the first session in the IIT discovery data set, participants completed the Wechsler Abbreviated Scale of Intelligence (WASI) in order to characterize full-scale IQ. At the end of the second session, participants were asked to complete two self-report questionnaires measuring autistic traits, translated into Italian—the Autism Quotient (AQ; Baron-Cohen et al., 2001) and the adult self-report form of the Social Responsivity Scale, Second Edition (SRS-2; Constantino & Gruber, 2012). A small subset of individuals (n = 9) fell above clinically significant cutoffs of 26 on the AQ or a 2-SD cutoff from typically developing norms of the Italian translation of the SRS-2 adult self-report (i.e., total raw score > 80.81). These individuals are annotated in figures showing autistic traits in order to visually mark individuals with or without pronounced elevation in autistic traits.
Gaze-fingerprinting analysis
Fixations were defined using a velocity-based classification algorithm in which eye movements are identified on the basis of a threshold when the velocity of directional shifts of the eye exceed 30° of visual angle per second. Data below this velocity-based threshold are considered fixations. Fixations with a duration below 100 ms were excluded. These criteria for defining fixations were identical across IIT and Gi data sets. The x and y coordinates within a time epoch defined as a fixation are then averaged to get the fixation coordinates. The duration of each fixation is the time elapsed between onset of the first gaze data sample and offset of the last data sample included in the fixation epoch. Fixation data coordinates were used to compute gaze heat maps for each stimulus and participant. Gaze heat maps were constructed by taking fixation points and smoothing them by a Gaussian kernel equal to a radius of 1° of visual angle and then normalizing the final heat map by the maximum value (Xu et al., 2014). Heat maps were then utilized to compute intrasubject and intersubject gaze similarity. Gaze similarity is generally defined as the Pearson correlation between two vectorized gaze heat maps (Kennedy et al., 2017). Intrasubject gaze similarity corresponds to the similarity value between the heat maps in Session 1 and Session 2 for the target individual. Intersubject gaze similarity for a particular stimulus is the between-subject similarity when the target individual’s Session 1 heat map is compared with a distractor individual’s Session 2 heat map (Fig. 1c).
Gaze fingerprinting analysis utilizes both intrasubject and intersubject gaze similarity values. A symmetric gaze-similarity matrix of size [n_subjects, n_subjects] is first computed, and along the diagonal of this matrix are the intrasubject gaze-similarity values. The off-diagonal values of this matrix represent all other pairwise intersubject gaze-similarity values when the target individual’s Session 1 heat map is compared with the distractor individual’s Session 2 heat map. In this approach, the target individual’s gaze was always taken from Session 1 because this initial viewing session constitutes a primary baseline sample of traitlike individualized gaze tendencies that will not be affected by other statelike tendencies specific to repeat viewing contexts. Once this matrix has been computed, we implemented a find-the-biggest (i.e., argmax) algorithm (Finn et al., 2015; Haxby et al., 2001; Kennedy et al., 2017) that allowed us to loop through the rows of the gaze-similarity matrix and identify the subject index corresponding to the maximum gaze-similarity value. A “hit” is defined as a situation in which the max gaze-similarity value corresponds to the target individual in question. In contrast, a “miss” occurs when the max gaze-similarity value corresponds to some other distractor individual. Fingerprint accuracy can then be computed as the number of hits divided by the total number of participants. Null distributions for fingerprint accuracy are also computed by first permuting subject identifiers and then rerunning the fingerprint analysis pipeline 1,000 times. From these null distributions, p values can be computed by counting the number of times fingerprint accuracy was as large or larger than the real fingerprint accuracy and then dividing that number by 1,001. In addition to accuracy measures, the binary output of hits and misses can be summarized to one number per participant as a count of the number of fingerprintable stimuli within subjects. Because there are some stimuli within an individual for which no gaze data was collected, this count number was proportionalized to the total number of stimuli for which gaze data was collected and is called percentage of fingerprintable stimuli. Similar permutation testing on percentage of fingerprintable stimuli was done on a within-subject basis (e.g., 1,000 permutations) and with a similar derivation for computing the p value per subject. These p values are then used to compute the FDR, and individuals could be characterized as fingerprintable or not on the basis of FDR rate (q < 0.05).
Gaze-fingerprinting analysis, as defined above, was applied at scale to every stimulus. However, there were some situations in which no gaze data was collected for a specific stimulus. When this occurred, no fixation heat maps could be computed, and thus all further subsequent steps of the fingerprint-analysis pipeline were not completed for that stimulus. In addition to gaze fingerprinting applied at scale to every stimulus, we also applied gaze-fingerprinting analysis to gaze-similarity data (i.e., intra- and intersubject similarity) that was summarized by the median over all of the set or subsets of the stimuli set, grouped by semantic features. To mimic the gaze-fingerprinting analysis procedure of Kennedy et al. (2017), we first computed median gaze similarity by computing the median over all 700 stimuli. The median was chosen to better reflect central tendency of the distribution than the mean, particularly in situations in which the distribution is skewed. When distributions are not heavily skewed, the mean and median should be relatively similar. With a three-dimensional gaze-similarity matrix of size [n_subjects, n_subjects, n_stimuli], we computed the median over the third dimension of the 700 stimuli to get a median gaze-similarity matrix of size [n_subjects, n_subjects]. The fingerprint-analysis algorithm described above is then used to define hits or misses and compute accuracy. This same procedure of computing a median gaze-similarity matrix was also redone on subsets of stimuli that correspond to each of the 12 semantic features labelled in the OSIE data set (Xu et al., 2014). To get 95% CIs around accuracy, we utilized bootstrapping with 10,000 resamples. This allowed us to compare accuracy rates within semantic-feature categories to the lower-bound bootstrap CI on accuracy computed on median gaze similarity across all stimuli.
The hit or miss nature of the gaze fingerprinting output is binary in nature and may hide information regarding the continuous nature of fingerprintability or the degree of gaze uniqueness. That is, the fingerprint output may be a miss because the intrasubject similarity is not the maximum gaze similarity among all distractor individuals. However, in the instance in which the intrasubject similarity is still ranked as very large (e.g., second-highest gaze similarity), this would be a situation in which the individual’s gaze is unique to some high degree, though not maximally unique when compared with all distractor individuals. Thus, to derive a continuous metric of degree of gaze uniqueness, we developed a score we call the Z-diff score. This score is operationalized as a difference score between intrasubject and mean intersubject Fisher-transformed r-to-Z statistics—that is, Z-diff = Zintra – μ(Zinter). Higher values of Z-diff indicate more gaze uniqueness, because the individual’s intrasubject gaze similarity is higher than average intersubject gaze similarity. Z-diff values are computed at scale for all 700 stimuli and can also be summarized as one number per participant by taking the mean Z-diff value across all 700 stimuli. Hypothesis tests on mean Z-diff values per each subject are implemented with permutation testing, in which the subject’s identifier is randomly permuted and then Z-diff values are recomputed. This is done 1,000 times, and a p value is derived as the percentage of times out of 1,001 permutations that the permuted mean Z-diff values were greater than or equal to the real mean Z-diff value. We then use FDR multiple-comparison correction to identify individuals with an FDR of q < 0.05 who can be considered as gaze unique on the basis of this mean Z-diff measure. Stimulus-level Z-diff scores were also used to examine whether continuous metrics of gaze uniqueness allows for clustering of subjects by stimuli categorized by semantic features. To implement this analysis, we computed mean Z-diff values on a per-subject basis and a per-semantic-feature-category basis, resulting in a matrix of [n_subjects, n_semantic_features]. This matrix was then used in agglomerative hierarchical clustering (ward.D2 agglomeration method). The optimal number of clusters (k) was detected on the basis of the silhouette coefficient. Hypothesis testing was done to test how Z-diff could be explained by subtype and semantic-feature clusters using a linear mixed-effect model with fixed effects of subtype and semantic-feature cluster and their interaction, and a random effect of semantic-feature cluster modeled with random intercepts.
Gaze-fingerprint barcoding
Given the stimulus-rich nature of the OSIE data set (e.g., 700 stimuli), gaze fingerprinting at scale for each subject and stimulus allows for a binary output matrix [nsubs, nstimuli] of hits and misses. The rows of this matrix can be thought of as individualized barcodes that tell us which stimuli are fingerprintable for that individual. Given that there is no requirement for each individual’s barcode to be similar or different, it is an open question as to whether such gaze-fingerprinting barcodes are unique to individuals or are clustered into subsets of individuals with similar kinds of barcodes. To answer this question, we first cut barcodes to exclude stimuli for which no gaze data was collected. Among stimuli for which gaze data was collected, we then took the barcodes and computed a subject-by-subject Jaccard distance matrix to represent the between-subject dissimilarity between gaze-fingerprinting barcodes; we then utilized agglomerative hierarchical clustering (ward.D2 agglomeration method) on this distance matrix to identify how many clusters are represented in the data set. This analysis allowed us to determine the optimal number of clusters (k), using the silhouette coefficient over a range of k = 2 to k = n − 1 as the maximum number of clusters. In this situation, k = n − 1 is a practical upper bound of detectable clusters and would indicate that the clustering algorithm treats nearly every data point as its own unique cluster.
Association analysis with autistic traits
Robust linear regression modeling was utilized as the modeling strategy to test for association between gaze fingerprinting metrics and autistic traits. Autistic traits were considered the dependent variable in the model. Autistic traits were initially measured via two different questionnaires, the AQ and the SRS-2. These measures are highly correlated (r = .77, p = 1.72e-22), indicating that shared variance in both may best account for autistic traits as a latent variable. To isolate the shared component of variation in the AQ and the SRS-2, we used principal components analysis (PCA) and found that the first principal component accounts for 88% of the variance. The autistic trait PC1 was used as the dependent variable measuring autistic traits. Two gaze-fingerprinting metrics were utilized as independent variables in the model—(a) the percentage of fingerprintable stimuli and (b) mean Z-diff. Rather than plugging both variables into the model as separate independent variables, we first checked to see whether the two fingerprinting metrics were correlated and found that they were (r = .80, p = 5.77e-25). Consequently, we used PCA to decompose fingerprinting metrics into two orthogonal variables, of which PC1 captured around 90% of the variance and loaded equally onto both metrics, whereas PC2 accounted for the remaining 10% of the variance. Although these PC1 and PC2 gaze-fingerprinting metrics are computed on the basis of all 700 OSIE stimuli, we also recomputed such gaze-fingerprinting metrics stratified within social or nonsocial stimuli. This was done to test whether any relationships between autistic traits and gaze fingerprinting might be specific to social or nonsocial stimuli. Robust linear regression modeling, implemented with the lmrob function from the robustbase library in R (version 4.3.3), was used to assess how gaze-fingerprinting metrics may be associated with autistic traits. We utilized this robust linear modeling in order to guard against the influence of bivariate outliers. For these models, the dependent variable was autistic-traits PC1; the independent variables were the percentage of missing-gaze data and sex, which were covariates along with PC1 and PC2 gaze-fingerprinting metrics. The percentage of missing-gaze data was included to account for variability between participants in the number of stimuli for which no gaze data was collected. Participant’s sex was included as a covariate because prior research has shown robust sex differences in autistic traits on both the AQ and the SRS-2 (Baron-Cohen et al., 2001; Constantino & Todd, 2003; Frazier et al., 2014).
We also compared different models for predicting autistic-traits PC1. All of the models used percentage of missing-gaze data and sex as covariates. Model 1 utilized gaze-fingerprinting PC1 computed across all stimuli. Models 2 and 3 utilized gaze-fingerprinting PC1 as well, but stratified by social (Model 2) or nonsocial (Model 3) stimuli. Model 4 utilized the median intrasubject gaze similarity computed across all 700 stimuli. Finally, Model 5 utilized the median average intersubject gaze similarity computed across all 700 stimuli. Models 4 and 5 are helpful for understanding whether any relationships with the gaze-fingerprinting metrics (i.e., Models 1–3) are simply better explained by just intrasubject (Model 4) or intersubject (Model 5) gaze similarity. The total model percentage of variance explained (R2) was computed for each model and compared with each other, with the better model being the model that explained more variance (e.g., higher R2) in autistic-traits PC1.
Preregistered short-term and long-term delay follow-up experiments (Study 2)
The gaze-fingerprint barcodes reported from the Discovery data set are derived from two eye-tracking sessions, which were separated by about 7 days. With only one barcode per individual, it could be claimed that the barcodes derived from the Discovery data set are essentially a random sequence of hits and misses. If this were true, it would lead to a hypothesis that measuring barcodes on the same individual in further follow-up repeat eye-tracking sessions would lead to barcodes that are not similar to the original barcodes derived from the original sessions (Session 1 and Session 2). To test this null hypothesis (i.e., that gaze-fingerprint barcodes are random and not significantly similar within individuals), we embarked on two follow-up preregistered experiments in which we measured gaze-fingerprint barcodes within individuals after either short-term delays (19–90 days) or long-term delays (~ 1.87–5.16 years) and then evaluated whether those later follow-up barcodes are significantly similar to the original barcodes derived from individuals in the original Sessions 1 and 2. The long-term follow-up experiment included only one additional eye-tracking session after the long delay period on the order of years. This allowed for one comparison of barcode similarity between Sessions 1 and 2 (a separation of 7 days) and Sessions 1 through 3 (a separation of 1.87–5.16 years). In contrast, the short-term follow-up experiment was designed to have five repeat eye-tracking sessions, which allowed for three repeated measurements of barcodes and for similarity between Session 1 and 2 barcodes (a separation of 7 days) to be compared with barcodes for Sessions 1 through 3, 1 through 4, and 1 through 5 (a separation of 19–90 days). Although the long-term delay experiment allowed for only one measurement of a barcode, and thus does not allow for multiple repeat barcodes to be derived after such long-term delays, the five repeat eye-tracking sessions included in the short-term follow-up experiment allowed for examination of barcode similarity within individuals as a function of time on the order of months. This unique longitudinal characteristic of the short-term follow-up experiment allows for tests of how barcode similarity changes (or not) over time within an individual. For the preregistration on the Open Science Framework (OSF), please see https://doi.org/10.17605/OSF.IO/ATJ7B. Below we will explain the methods and analysis behind these follow-up experiments.
For the experiment testing barcode similarity over long-term delays, we aimed to test 10 participants from the original Discovery data set in a single eye-tracking session, Session 3, that was completed about 5 years after the original eye-tracking sessions (Sessions 1 and 2). After applying the same data-quality filtering as in the original Discovery data set experiment (i.e., including only individuals with missing gaze data in less than 15% of stimuli), we retained these 10 individuals for further analysis. These individuals repeated the same experimental paradigm and procedure as in Sessions 1 and 2 (e.g., viewing 700 static pictures of complex natural scenes from the OSIE stimulus set). Session 3 with these individuals was separated from earlier sessions by an average of 3.58 years (SD = 0.93 years, range = 1.87–5.16 years); this later session allowed us to compute a gaze-fingerprint barcode for these individuals using data from Sessions 1 and 3. The analysis pipeline to compute gaze fingerprints and gaze-fingerprint barcodes was identical to the Discovery experiment, and all individuals from the original Discovery data set were utilized as distractor individuals within the gaze-fingerprint classifier.
It is significant that for all computed barcodes employed in these follow-up experiment analyses, Session 1’s data was always used as a primary baseline data set, because it represented the only pure measure of an individual’s traitlike gaze tendencies not influenced by statelike factors introduced by repeat viewing contexts. In the long-term follow-up experiment, we computed two gaze-fingerprint barcodes derived from each individual—one barcode derived from Sessions 1 and 2, separated by approximately 7 days, and another barcode derived from Sessions 1 and 3, separated by 1.87 to 5.16 years. Using these two barcodes, we can test the null hypothesis that over long periods of time (e.g., years), gaze-fingerprint barcodes are random and not a repeatable individuating code signifying what is unique about individual gaze—that is, what an individual looks at within complex natural scenes of static pictures. To quantify the similarity between barcodes in Sessions 1 and 2 and Sessions 1 through 3, we computed Jaccard distance between these two barcodes, identical to the similarity metric used in the original Discovery data set clustering analyses. We then compared the real barcode similarity to a distribution of Jaccard distance values simulated under the null hypothesis: We did this by permuting the barcode for Sessions 1 through 3 and recomputing Jaccard distance with the barcode from Sessions 1 and 2. This permutation analysis was run 10,000 times to build the null distribution of Jaccard distance between barcodes. A p value can then be computed on a within-individual basis as the number of times barcode similarity was as low or lower than the real barcode similarity, divided by 10,001. Such hypothesis tests were done on all 10 individuals in the long-term follow-up experiment. We thresholded each individual’s test at an alpha level of .05 to get a count of the number of individuals within the long-term follow-up experiment with significantly similar barcodes after the long-term delay. This count was then used in a binomial test to test whether the number of identified significant individuals deviated from the number of significant individuals that would be expected under the null hypothesis.
The second preregistered follow-up experiment was conducted to examine barcode similarity over short-term delays of 19 to 90 days. This was done as a contrast to what occurs in the long-term delay experiment, but also to examine within-individual longitudinal change in barcode similarity over time. In this short-term follow-up experiment, we aimed to test 10 individuals over five repeat eye-tracking sessions that were identical to those in the original Discovery and long-term delay experiments. Although the aim was to collect 10 individuals, one participant was dropped because of lack of data on return sessions (Sessions 3–5). Furthermore, after applying data-quality filtering identical to that of the original Discovery data-set experiment (i.e., including only individuals who were missing gaze data for fewer than 15% of stimuli), the final sample sizes were 7 for the delay between Sessions 1 through 3, 6 for the delay between Sessions 1 through 4, and 7 for the delay between Sessions 1 through 5. The delay between Sessions 1 and 2 was similar to the delay in the original Discovery data set (e.g., M = 7.80 days, SD = 1.47 days, range = 7–11 days). Session 3 was separated from Session 1 by a delay of 25.43 days on average (SD = 5.89 days, range = 19–36 days), whereas Session 4 was separated from Session 1 by 36 days on average (SD = 1.47 days, range = 35–38 days), and Session 5 by 72 days on average (SD = 12.31 days, range = 56–94 days). In terms of analysis, we conducted identical permutation tests within-individual and a binomial test of counts of significant individuals, as described above for the long-term experiment. We additionally ran further longitudinal modeling, given that each subject had multiple repeat measurements of barcodes of time. This longitudinal analysis was added after preregistration and thus was not part of the original preregistered analysis plan. The variables used for longitudinal modeling were the time delay from Session 1, measured in days, and real barcode similarity versus mean permuted barcode similarity. (Real barcode similarity is the Jaccard distance between barcodes for Sessions 1 and 2 and Sessions 1 through 3.) This distinction between real versus mean permuted barcode similarity was a factor called “condition” in the model. Longitudinal modeling was implemented with linear mixed-effect models (e.g., the lmer function within the lmerTest library in R); the dependent variable was barcode similarity. The fixed-effect independent variables in the model were time (i.e., number of days of delay since Session 1) and condition (i.e., real versus permuted) and the Time × Condition interaction, whereas the random effect of time was modeled within individuals with random intercepts and slopes. The main effect of time allows for examination of whether barcode similarity changes as a function of the delay since Session 1. The main effect of condition allows for a test of whether barcode similarity is significantly different under real versus permuted conditions. The interaction between time and condition allows for a test of whether barcode trajectories over time significantly differ from each other.
Data and code availability
All code and data for reproducing the analyses can be found here: https://doi.org/10.5281/zenodo.17224834.
Results
In Study 1, we used the IIT discovery data set to test whether gaze fingerprinting is possible. If gaze fingerprinting is possible, we also examined how good it is at accurately detecting individuals as a function of semantic features within stimuli. As a first approach to answering these questions, we computed median intra- and intersubject gaze similarity across all 700 stimuli before running classification analysis to predict individual identity. The step of computing median gaze similarity over all stimuli is important as it emphasizes how similar individuals’ gaze is, either with themselves or with other people computed as a central tendency over all stimuli. Here we found fingerprint accuracy (i.e., identification rate) of 52.40% in the IIT Discovery data set (Fig. 2b) and 62.98% in the Gi replication data set (see Fig. S1c in the Supplemental Material). Both identification rates are well above the theoretical (e.g., ~1%–2%) and empirically derived (via permuting subject identifier) chance identification rate (p = 0.0009). In a sex-stratified analysis on the IIT discovery data set, identification rates fall within a similar range of approximately 48%–65% (e.g., 48% in females, 65% in males; see Fig. S1e).
We next reran the fingerprint-classification analysis for each of the different subsets of stimuli reflecting high-level semantic features. Again, identification rates for all semantic features were well above chance levels in both discovery and replication sets (IIT: 29%–54%, all ps = 9.99e-4, see Fig. 2b; Gi: 39–63%, all ps = 9.99e-4, see Fig. S1c in the Supplemental Material). Notably, identification rates for each semantic feature were within the 95% bootstrap CIs computed from the previous analysis on median gaze similarity over all stimuli. The exceptions to this are smell, sound, emotion, and animal features. These features are the most infrequently occurring stimuli, comprising < 22% of all stimuli. Thus, relatively lower identification rates on these features are likely due to the number of stimuli within the semantic-feature set. In summary, the relatively high identification rates when computing median gaze similarity across all stimuli can also be achieved by median gaze similarity within stimuli stratified by semantic features, provided that the semantic-feature category contains an adequate number of stimuli (e.g., > 22% of the stimulus set—that is, 154 stimuli).
Given the observation that identification rates tend to drop with decreased number of stimuli present within a semantic-feature category, it is likely that identification rate at the level of individual stimuli would also result in relatively low rates. Indeed, we found that individual stimuli identification rates were heavily reduced (e.g., IIT: ~2%–11%, Fig. 2c; Gi: ~4%–21%, Fig. S1b) compared with rates observed for median gaze similarity. Despite this attenuation, identification rates are still much higher than chance levels for the majority of stimuli. For example, around 94.2% (660/700) of stimuli in the IIT discovery data set (Fig. 2c) and 62.2% (436/700) of stimuli in the Gi data set (Fig. S1b) are identified above chance rates (FDR q < 0.05). Finally, when we collapsed individual stimuli-identification rates by semantic-features categories, we also saw similar attenuated identification rates compared with analysis on median gaze similarity (IIT: 3.9%–5.1%, Fig. 2D; Gi: 5.2%–6.6%, Supplementary Fig. 1D). Overall, the results of these first sets of analyses generally suggest that gaze fingerprinting is possible and that utilizing median gaze similarity over a sufficiently large range of different stimuli (e.g., 154 stimuli) can enhance detection rates more than using individual stimuli. Although most individual stimuli show statistically higher-than-chance identification rates, these rates are typically much lower than when median gaze similarity is utilized across many stimuli.
Although the 52% to 63% identification rate for median gaze similarity is already impressive and much higher than previous work on twins or during movie viewing (e.g., ~29%–40% accuracy; Keles et al., 2022; Kennedy et al., 2017; Rigas & Komogortsev, 2014), it is possible that the use of a central tendency summary statistic, such as the median, on gaze-similarity estimates over a large range of stimuli may hide important individuating information within the pattern of fingerprintability across stimuli. Given the unique stimulus-rich characteristic of our data set, we next employed a gaze-fingerprint-barcoding approach (Fig. 3a) to test whether the patterning of fingerprintability across a range of stimuli would allow for more individuation. The gaze-fingerprint-barcoding approach uses the binary vector of hits or misses across all 700 stimuli as a potentially unique individuating gaze-fingerprint pattern, or barcode, for an individual. As shown in Figure 3b, gaze-fingerprint barcodes are relatively sparse because each individual has a small but potentially unique pattern of fingerprintable stimuli across all 700 stimuli. Using Jaccard distance to quantify how similar or dissimilar the binary gaze-fingerprint barcodes are between individuals, we next used clustering to test whether the optimal number of clusters would be the practical upper bound of clusters detectable (e.g., k = n − 1). A k = n − 1 solution would indicate that the barcodes are all heavily distinguished from each other and that the clustering algorithm treats nearly every data point as its own unique cluster. Indeed, in both IIT discovery (Fig. 3c) and Gi replication (Figs. S2a and S2b) data sets, we found that the optimal number of clusters is k = n − 1. This result confirms that gaze-fingerprint barcodes hold unique individuating information.
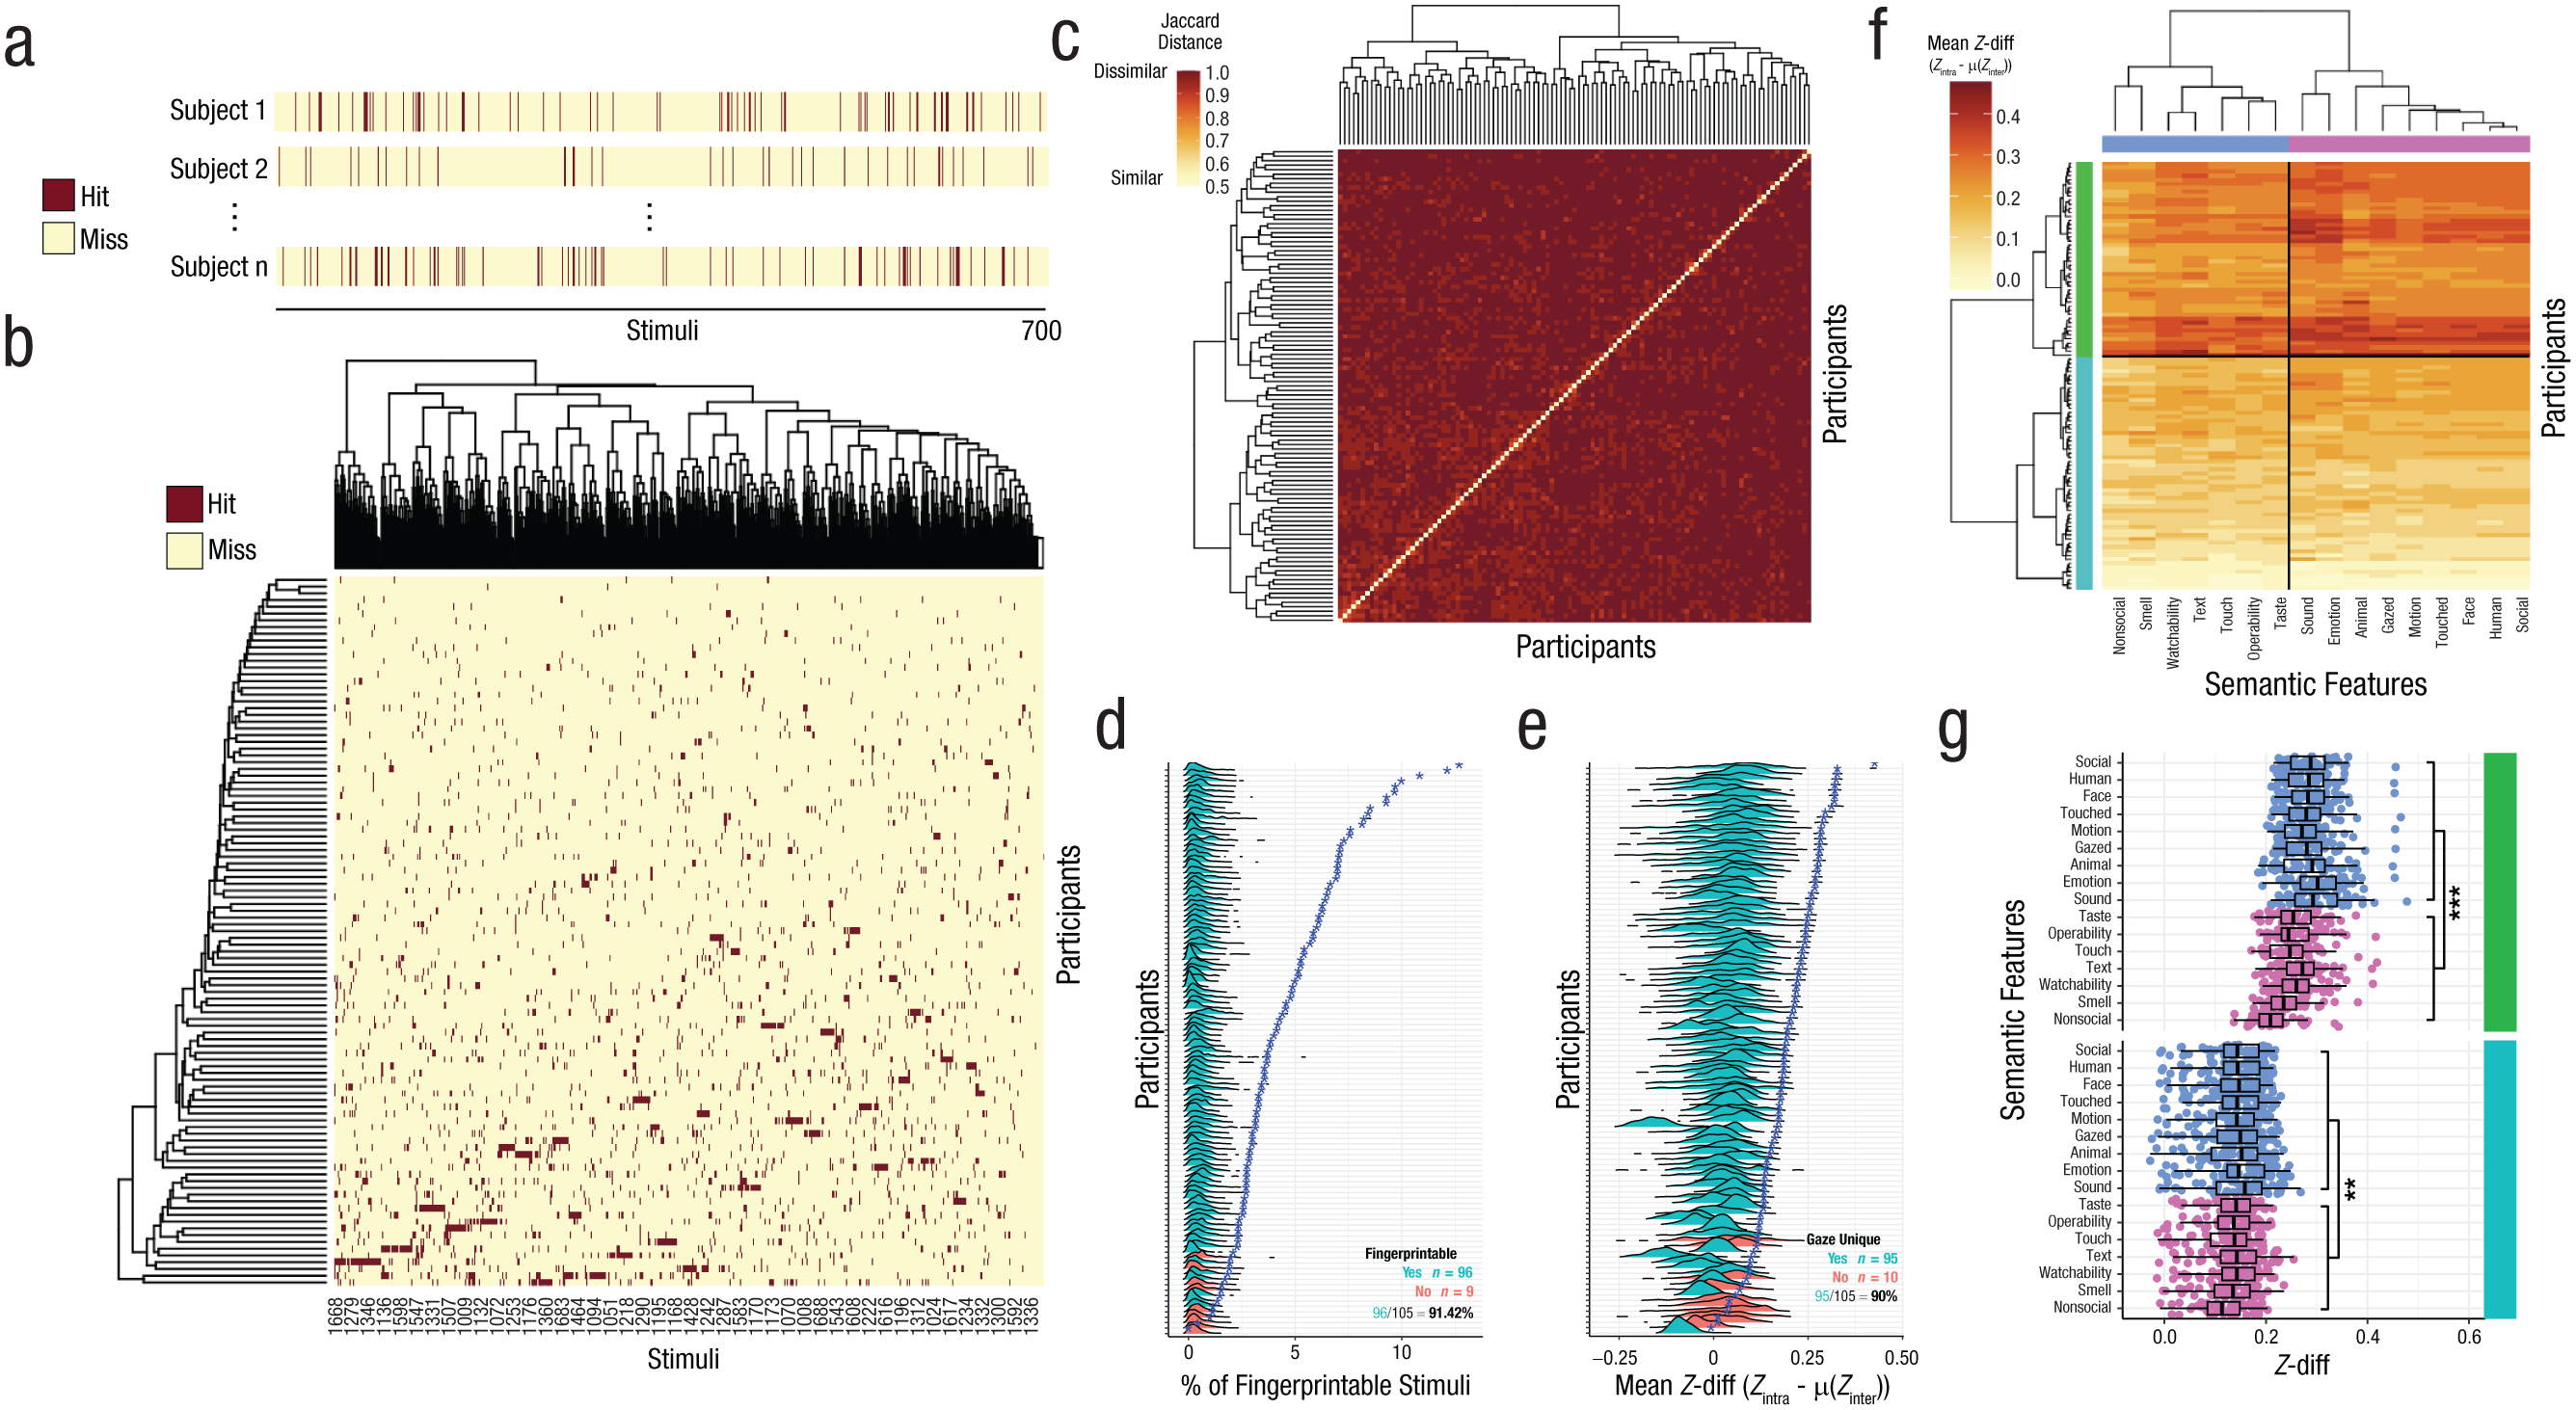
Gaze-fingerprint barcoding and degree of gaze uniqueness. In (a) we show a visual example of gaze-fingerprint barcodes. Stimuli from 1 to 700 are shown on the horizontal axis. The burgundy color indicates a stimulus for which the individual can be correctly identified (a hit), whereas yellow indicates a stimulus for which the individual could not be correctly identified (a miss). Along the rows are example individuals (e.g., Sub 1, Sub 2, . . . Sub n). In (b) we show a matrix of gaze-fingerprint barcodes for the IIT discovery data set. This matrix has subjects along the rows and stimuli along the columns. The burgundy color indicates stimuli hits, for which the individual can be correctly identified, whereas the yellow color indicates stimuli misses, for which the individual could not be correctly identified. In (c) we illustrate between-subject Jaccard dissimilarity matrices computed on the binary gaze-fingerprint barcode matrix shown in (b). The diagonal represents individuals’ barcode similarity with themselves and is maximally similar with a Jaccard distance equal to 0. The off-diagonal values depict how dissimilar or distant gaze-fingerprint barcodes are when compared between individuals. Rows and columns of this matrix are rearranged according to hierarchical clustering dendrograms, and the optimal number of clusters (k) is the upper practical bound of n − 1. In (d) we show the measure of percentage of fingerprintable stimuli (x-axis) per each individual (y-axis) in the IIT discovery data set. The actual percentage of fingerprintable stimuli per subject is denoted by the blue star. The density plots per each individual represent the null distribution of percentage of fingerprintable stimuli over 1,000 permutations where subject identifier is randomly permuted. The color of the density plot denotes whether the individual is fingerprintable (turquoise) or not (pink) based on statistical significance passing an FDR threshold of q < 0.05. The annotation in the bottom right of the plot indicates the percentage of individuals that are fingerprintable over the entire sample. In (e) we depict a continuous metric called Z-diff, indicating the degree of gaze uniqueness per individual. Z-diff is a difference score computed as Z-transformed intrasubject gaze correlation minus Z-transformed mean intersubject gaze correlation. Increasing Z-diff values indicates increasing gaze uniqueness. The blue stars in this plot indicate actual Z-diff values averaged over all stimuli (i.e., mean Z-diff, plotted on the x-axis). The density plots per each subject shown on the y-axis show the null distribution of mean Z-diff when the subject identifier is randomly permuted. Turquoise indicates that the observed mean Z-diff (blue star) is significantly greater than the null distribution, with statistical significance defined as passing FDR correction for multiple comparisons at q < 0.05. Pink indicates that observed mean Z-diff is not statistically significant. The annotation in the bottom right of the plot indicates the percentage of individuals that are identified as significantly gaze unique over the entire sample. In (f) we show a clustered heat map of the mean Z-diff with individual subjects along the rows and stimuli semantic-feature categories along the columns. Colors along the rows and columns indicate the identified subtype (turquoise, green) or semantic feature stimuli clusters (blue, pink). In (g) is a scatter-boxplot representation of the data shown in (f), with Z-diff (x-axis) for every individual as a dot plotted as a function of semantic-feature stimulus categories (y-axis). The colors represent the subtype and semantic-feature stimuli clusters carried over from (f). Stars in this plot represent statistical significance for the difference between semantic-feature stimuli clusters within a subtype. **p = .003. ***p = .0001.
We can also summarize information within gaze-fingerprint barcodes by quantifying the percentage of stimuli an individual could be gaze-fingerprinted on and then test whether this measure is significantly larger than what we would expect at chance when the subject identifier is randomly permuted. Here we find that the percentage of fingerprintable stimuli varies widely between individuals, with some individuals showing very minimal levels (e.g., 1%–2%), whereas others can be identified on the basis of 12%–14% of all stimuli (Fig. 3d). We replicably find that nearly all individuals in both discovery and replication data sets (IIT: 96/105 or 91.42%, Fig. 3d; Gi: 44/46 or 95.65%, Fig. S2c) had percentages of fingerprintable stimuli that were significantly higher than chance when the subject identifier is randomly permuted. Thus, although the information present within gaze-fingerprint barcodes is sparse, it is much higher than would be expected at chance when the subject identifier is randomly permuted.
As an alternative to a binary vector representing the gaze-fingerprint barcode, we also have introduced the concept of a continuous degree of gaze uniqueness via Z-diff. Z-diff can be computed on a per-stimulus basis and is operationalized as a difference score of Z-transformed intrasubject correlation minus Z-transformed mean intersubject correlation. Increasing Z-diff values indicate an increasing degree of gaze uniqueness. We computed one summary measure of Z-diff per subject by computing the mean Z-diff value across all stimuli. We then compared mean Z-diff on a per-subject basis to null distributions of mean Z-diff computed from permutation testing in which the subject identified was randomly permuted 1,000 times. Here we find that mean Z-diff is significantly greater than null mean Z-diff distributions for about 90% of IIT (95/105, Fig. 3e) and 86.95% of Gi individuals (40/46, Fig. S2d). Thus, Z-diff can complement the 0–1 binary sparse output from gaze-fingerprint barcodes and reveal that a vast majority of all individuals have relatively unique gaze.
We next clustered the continuous Z-diff gaze-uniqueness metric after averaging Z-diff for each semantic-features category. This analysis allows us to identify whether individuals may be clustered by gaze uniqueness assessed over semantic-feature categories. Here we find two subtypes (Fig. 3f) over social and nonsocial semantic-feature clusters. Identified gaze-uniqueness subtypes were relatively similar in proportions of males and females and thus did not differ by sex (χ2 = .01, p = .91). Further linear mixed-effect modeling revealed a Subtype × Feature cluster interaction (F = 23.31, p = 1.48e-6) that indicates that subtypes differ in the extent of gaze uniqueness between social and nonsocial feature clusters. This interaction can be described as one subtype with generally larger gaze uniqueness (green cluster in Fig. 3f and 3g) that is further enhanced between social versus nonsocial stimuli (F = 25.92, p = 1.64e-4). In contrast, the other subtype is generally less gaze unique (turquoise cluster in Figs. 3f and 3g) and shows a much smaller difference in gaze uniqueness between social and nonsocial stimuli clusters (F = 8.44, p = .003). Very similar results of two subtypes were also found in the Gi replication data set (Fig. S2f). However, in the Gi replication data set only the subtype with relatively more gaze uniqueness (i.e., the turquoise cluster) showed a differentiation by social versus nonsocial stimuli clusters (F = 9.63, p = .002), whereas the less gaze-unique subtype showed no such differentiation between social and nonsocial stimuli clusters (F = 0.19, p = .65). Thus, the nature of the interaction identified is likely one driven by higher gaze uniqueness for social stimuli compared with nonsocial stimuli that is specific to the subtype with generally more gaze uniqueness. Overall, these results show that a continuous metric of the degree of gaze uniqueness shows some subtype structure as a function of social and nonsocial stimuli categories. This result complements the finer distinction of highly granular individualized gaze-fingerprint barcodes by showing that continuously measured gaze uniqueness summarized at semantic levels (e.g., social vs. nonsocial distinction) can show some level of coarser population-stratification structure.
One alternative explanation for the high level of individuation in gaze-fingerprint barcodes (Figs. 3b and 3c) could simply be that the barcodes are random binary vectors that could not be repeatedly detected within an individual. To test this alternative explanation, we ran two preregistered follow-up experiments (i.e., Study 2) to measure barcodes repeatedly from the same individuals and then assess their similarity. In the first follow-up experiment, we called back 10 of the original individuals tested in the IIT discovery data set for a third eye-tracking session in which they repeated the same paradigm as in Sessions 1 and 2. However, this third eye-tracking session was conducted after years of delay compared with Session 1 (e.g., mean delay = 3.58 years, SD = 0.93 years, range = 1.87–5.16 years). Long-term gaze-fingerprint barcodes were computed by comparing gaze heat maps from Session 1 to Session 3 and then running the same gaze-fingerprint classifier as utilized in the original IIT discovery data set. For these 10 individuals, we could then compare gaze-fingerprint barcodes derived from the original IIT discovery data set (e.g., delay of 7 days between Sessions 1 and 2) with the barcodes derived from the long-term follow-up in which the delay between Session 1 and Session 3 is on the order of years. Permutation tests on Jaccard distance between gaze-fingerprint barcodes were computed for each of the 10 individuals to identify the number of individuals for whom gaze-fingerprint-barcode similarity is significantly different from chance similarity when barcodes are randomized. Of the 10 individuals tested, 30% had significantly similar barcodes relative to chance, and a binomial test identified this as a statistically significant number of successful hypothesis tests (number of successes = 3, number of trials = 10, p = .0115). A follow-up correlation test between barcode similarity and the delay between Sessions 1 and 3 revealed no correlation between time delay and barcode similarity (r = −.15, p = .67). Thus, this result suggests that gaze-fingerprint barcodes are nonrandom over long periods on the order of years for a significant number of individuals, and that barcode similarity is not associated with the length of time between compared barcodes.
We next conducted another preregistered short-term follow-up experiment in which individuals were gaze-tracked over five repeat sessions separated by 19 to 90 days, as a contrast to tests of barcode similarity on the timescale of years (e.g., the long-term follow-up experiment). Barcodes computed from Sessions 1 and 2 were compared with barcodes from Sessions 1 through 3, 1 through 4, and 1 through 5, with a similar permutation and binomial-test approach. Compared with barcodes from Sessions 1 and 2, 71% of individuals had significantly similar barcodes in Sessions 1 through 3 (number of successes = 5, number of trials = 7, p = 6.027e-06), whereas 33% were significantly similar in Sessions 1 through 4 (number of successes = 2, number of trials = 6, p = .03277), and 28% were significantly similar in Sessions 1 through 5 (number of successes = 2, number of trials = 7, p = .04438). This data can also be evaluated with longitudinal modeling, given the repeat assessments of barcode similarity within individuals over time. Comparing the distinction between real versus permuted barcode similarity (a factor we call “Condition”), there was a significant main effect of Condition in which real barcode similarity was significantly more similar than mean permuted barcode similarity (F = 11.81, p = .002). The model showed no significant effect over time (F = 0.91, p = 0.38) and no interaction of Time × Condition (F = 1.46, p = .23). A caveat here is that the lack of significant effects over time may be underpowered given limits in sample size (Fig. 4c). Thus, strong statements about the presence or lack of an effect of time cannot be made. Finally, we also added a factor that examined barcode similarity by social versus nonsocial stimulus category (i.e., stimulus type). This analysis showed no significant main effect of stimulus type (F = 0.04, p = .82), no interaction between stimulus type and condition (F = 0.06, p = .79), and no interaction in a three-way Time × Condition × Stimulus Type analysis (F = 0.08, p = .77). In contrast to the significant condition effect in the analysis using all stimuli, the lack of a significant Condition × Stimulus Type interaction effect potentially indicates that barcode similarity does not greatly differ depending on whether barcodes are computed from social or nonsocial stimuli. Overall, these results under short-term follow-up time frames on the order of months match the inferences from the long-term follow-up—that is, gaze-fingerprint barcodes were significantly similar for a significant number of individuals. However, the limited sample size of the follow-up experiments suggests there are caveats to interpreting the change over time, and future work in larger samples may help clarify this point.

Stability of gaze-fingerprint barcodes over time. In (a) we show a schematic of the design of the preregistered long-term and short-term follow-up experiments in which we tested individuals after a delay from Session 1 on the order of years (long term) or weeks to months (short term). The short-term follow-up experiment had five repeat eye-tracking sessions, which additionally allowed for tracking of gaze-fingerprint barcodes within individuals over the course of 2 to 3 months. In (b) we show a schematic of the data-analysis approach for assessing similarity of gaze-fingerprint barcodes. Jaccard distance was utilized to quantify degree of barcode similarity, with a smaller Jaccard distance being indicative of more barcode similarity. Barcodes were then randomly permuted 10,000 times to build a null distribution of Jaccard distance under the hypothesis that the barcodes are random. Statistical inference can be implemented on a within-individual level by computing a p value that describes the probability of getting a barcode similarity as small or smaller than the real barcode similarity in unpermuted data. In the example shown, the real barcode similarity is a Jaccard distance of 0.84. Under the simulated null distribution, such barcode similarity is never observed, and hence the p value is 1/10,001 = 9.99e-5. In (c) we illustrate barcode trajectories in the short-term follow-up experiment for real (red) and mean-permuted (black) conditions. Each individual is represented by a line, and the group trajectory is plotted in the thicker solid line with 95% confidence bands. Time since Session 1 in days is plotted on the x-axis, whereas barcode similarity (Jaccard distance) is plotted on the y-axis, with smaller values indicating more barcode similarity.
In a final set of analyses, we expanded scope on the relevance of gaze fingerprinting to autistic traits. Autistic traits represent a continuous and highly heritable phenotype linked back to polygenic or omnigenic common genetic architecture (Constantino & Todd, 2003; Robinson et al., 2016). Degree of gaze similarity is also strongly linked to genetic similarity (Constantino et al., 2017; Kennedy et al., 2017), and atypical gaze patterns are commonly observed in autism (Constantino et al., 2017; Jones & Klin, 2013; Wang et al., 2015). Thus, we reasoned that variation in autistic traits may be linked to individualized patterns of gaze captured by the gaze-fingerprinting approach. Here we used two self-report questionnaires that are widely used to measure autistic traits—the SRS-2 and the AQ. These measures are highly correlated (r = .77, p = 1.72e-22; Fig. 5a), and thus we utilized PCA to capture the first principal component accounting for about 88% of the variance between the AQ and the SRS-2. This autistic-traits PC1 was our dependent variable in all further models. Gaze-fingerprinting predictors in our model were a combination of gaze-fingerprinting metrics, such as the percentage of fingerprintable stimuli and mean Z-diff. Because these variables are highly correlated (r = .80, p = 5.77e-25; see Fig. 5b), we orthogonalized them with PCA and used PC1 and PC2 in the model as independent variables. Finally, the percentage of stimuli with missing-gaze data and sex were modeled as covariates. Sex was utilized as a covariate because prior research has shown strong sex differences in autistic traits in the typically developing population (Baron-Cohen et al., 2001; Constantino & Todd, 2003; Frazier et al., 2014). Here we find that there is a significant negative relationship between gaze-fingerprinting PC1 computed over all stimuli and autistic traits (β = −0.29, SE = 0.08, t = −3.58, p = 5.30e-4; see Table S2 in the Supplemental Material). Similar results appear when autistic traits are analyzed with the AQ or the SRS separately (see Table S2). Breaking down this relationship by gaze-fingerprinting PC1 on social versus nonsocial stimuli, we found that the relationship is specific to social stimuli (β = −0.28, SE = 0.08, t = −3.57, p = 5.32e-4; Fig. 5c) compared with nonsocial stimuli (β = −0.18, SE = 0.09, t = −1.84, p = .06; see Fig. 5d and Table S2). Individuals that tend to deviate most from this relationship tend to be individuals with remarkably high autistic traits, beyond cutoffs for typically developing adult norms on the SRS-2 or the AQ (see the turquoise dots in Fig. 5c and 5d). Another way to look at this relationship is to examine autistic traits between the gaze-uniqueness subtypes identified in Figures 3f and 3g. Congruent with the directionality of the continuous relationship between gaze fingerprinting and autistic traits, here we find that the subtype with less gaze uniqueness is higher in autistic traits than the subtype with more gaze uniqueness (F = 5.57, p = .02, Cohen’s d = 0.49; Fig. 5e).
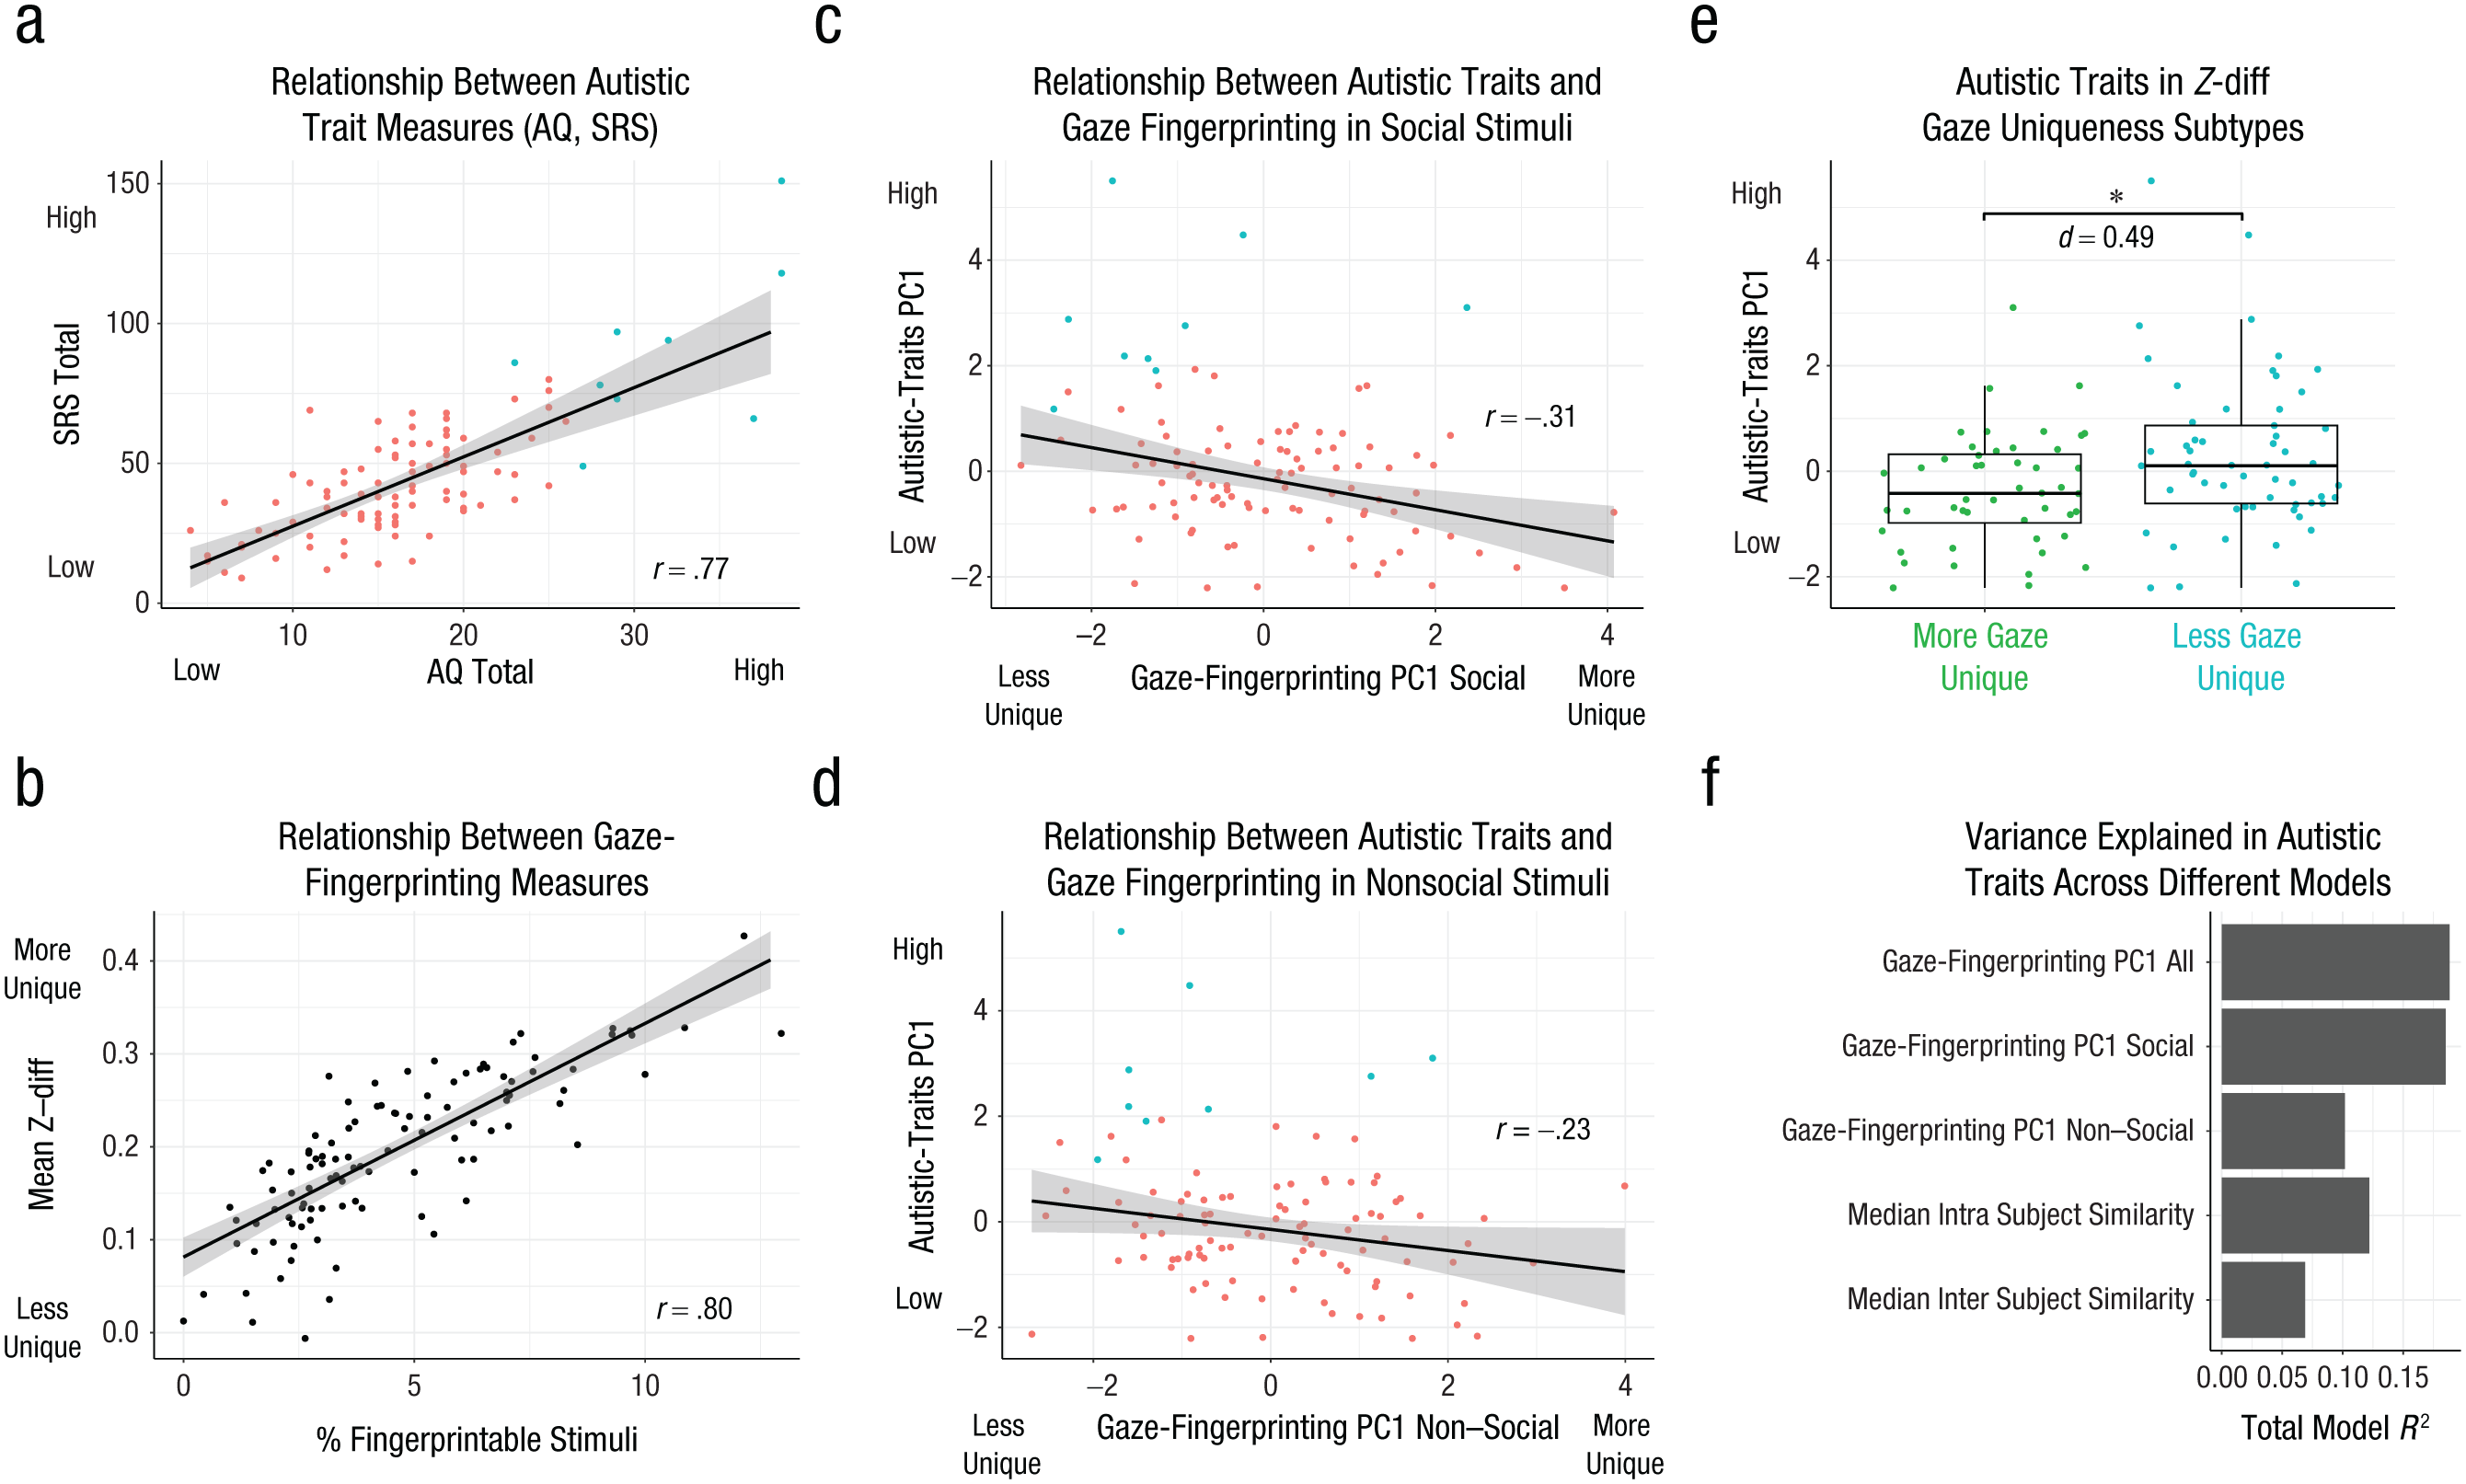
Gaze-fingerprinting association with autistic traits. This figure showcases how gaze-fingerprinting metrics are associated with variation in autistic traits. In (a) we show the two autistic-trait measures utilized in this study—the Autism Quotient, or AQ (x-axis), and the Social Responsivity Scale, Second Edition, or SRS-2 (y-axis). The SRS-2 and AQ are highly correlated, and thus principal components analysis (PCA) is used to isolate the first principal component representing 88% of the variance shared between the AQ and the SRS-2. This measure, called autistic-traits PC1, is used as the dependent variable in our model and is plotted on the y-axis in (c) through (e). The coloring of the dots in (a) represents two classes of individuals—individuals within the normative range expected for the AQ and the SRS-2 in typically developing adults (n = 96, pink) and individuals who are highly deviant from typically developing adults (n = 9, turquoise). Examples are a score > 26 on the AQ (Woodbury-Smith et al., 2005) or a score > 2 SD (80.81) from typically developing norms on the SRS-2. In (b) we show the two gaze-fingerprinting measures used in the model—that is, the percentage of fingerprintable stimuli per subject (x-axis) and the mean Z-diff computed across all 700 stimuli (y-axis). The scatterplot in (b) shows that these two measures are highly correlated. Thus, PCA was used to orthogonalize the data; two principal components were used as independent variables in a linear model predicting autistic traits. Gaze-fingerprinting PC1 accounts for 90% of the variance in the gaze-fingerprinting metrics. In (c) and (d) we show scatterplots depicting the association between autistic-traits PC1 and gaze-fingerprinting PC1, with the distinction between (c) and (d) being that gaze-fingerprinting metrics are computed only on social (c) or nonsocial (d) stimuli. The turquoise versus pink color distinction in the dots reflects the distinction shown in (a) regarding individuals with autistic-trait scores that were either above (turquoise) or within (pink) the normative range of scores in typically developing individuals. In (e) we show a scatter-boxplot of autistic-traits PC1 (y-axis) as a function of the Z-diff subtypes shown in Figures 3f and 3g, with green representing the subtype with significantly higher gaze uniqueness and turquoise representing the subtype with less gaze uniqueness. Standardized effect size (Cohen’s d) is annotated on this plot to show the magnitude of group difference in units of standard deviations of difference. In (f) we show total model R2 values (x-axis) indicating the percentage of variance explained for the various models evaluated to predict autistic traits (y-axis). This plot shows that the model using gaze-fingerprinting metrics computed on all stimuli (top bar) or social stimuli (second bar from top) are the best-performing models and explain much more variance than all three of the competing models shown below them.
Next, we compared models using gaze-fingerprinting PC1 on all stimuli or social and nonsocial stimuli as the independent variable, or models that use only median intrasubject or intersubject gaze similarity. These model comparisons were done to better understand which aspect of gaze fingerprinting best predicts autistic traits (i.e., intra- or intersubject gaze similarity alone, or the combination of both via gaze fingerprinting on all stimuli or on social or nonsocial stimuli). Here we found that the model using gaze-fingerprinting PC1 on all stimuli accounted for 18.82% of the variance in autistic traits. Similarly, gaze-fingerprinting PC1 on social stimuli accounted for 18.51% of variance in autistic traits. In comparison to these two models, all other models accounted for less than 12% (gaze-fingerprinting PC1 nonsocial = 10.17%; median intrasubject gaze similarity = 12.19%; median intersubject gaze similarity = 6.88%; see Fig. 5f). Of these other models, only median intrasubject gaze similarity was significantly related to autistic traits, in the direction of increasing autistic traits with decreased intrasubject gaze similarity (see Table S2 in the Supplemental Material). Thus, in direct model comparisons it is clear that gaze-fingerprinting PC1, particularly for social stimuli, provides significantly enhanced utility in predicting autistic traits over and above other models that compute gaze fingerprinting from nonsocial stimuli or that account for intra- or intersubject gaze similarity alone.
Discussion
In this work we discovered that it is possible to identify individuals from spatial-gaze patterns sampled from static pictures of complex natural scenes. Here we replicably show that we can gaze-fingerprint individuals at levels much higher than chance (52%–63% vs. 1%–2% chance levels). Although these identification rates are much higher than in previous studies (e.g., 29%–40%; Keles et al., 2022; Kennedy et al., 2017; Rigas & Komogortsev, 2014), there are some caveats to comparing identification rates between studies. First, identification rates may be dependent on the number of stimuli sampled per individual. This work demonstrates that identification rates can drop with the size of the stimulus set (e.g., Fig. 2d). Thus, identification-rate comparisons between the current and prior studies must be interpreted relative to the number of stimuli sampled within individuals. Second, two of the prior studies examined identification of the same target individual (Keles et al., 2022; Rigas & Komogortsev, 2014), whereas the other examined identification of twin pairs (Kennedy et al., 2017). It may be expected that accuracy in identifying the same target individual would be higher than in identifying an individual’s twin. However, for the prior studies that examined identification of the same target individual (Keles et al., 2022; Rigas & Komogortsev, 2014), comparing identification rates between studies may be limited because those prior studies utilized dynamic movie stimuli. In contrast, the current work examines a large range of static pictures of complex scenes. Theoretically, the idea of a traitlike gaze fingerprint suggests that a degree of invariance should be expected and should thus generalize across static versus dynamic stimuli or even real-world scenarios. An open question for future work should be to examine level of invariance of gaze fingerprints across dynamic real-world scenarios versus static picture viewing.
The current work shows some utility for summarizing central tendencies of gaze similarity over a large range of stimuli. However, such data-reduction techniques may risk potentially hiding unique and important information for the purpose of gaze fingerprinting. This point has been underscored in the past with analogous literature in functional neuroimaging that contrasts mass univariate analysis to multivariate pattern-decoding techniques (Haxby et al., 2001). Analogous to the stimulus-rich experimental-design strategies of representational similarity analysis (Kriegeskorte et al., 2008), our gaze-fingerprinting design’s stimulus-rich aspect allows us to fingerprint individuals on each stimulus and then summarize gaze fingerprintability over different semantic features; we found that most semantic features had relatively similar levels of identification rates. These results are similar to recent observations made by Broda and de Haas regarding how domain-general mechanisms may be helpful in explaining individualized gaze biases rather than domain-specific mechanisms (e.g., face-specific biases; Broda & de Haas, 2024).
At a more granular level than semantic-feature categories, there may also be useful information at the level of individual stimuli. Although identification rates for any one stimulus are generally much lower than rates for median gaze similarity across stimuli, the gaze-fingerprinting output per subject and stimuli may still represent a unique and novel gaze-fingerprint barcode. We show that gaze-fingerprint barcodes are sparse, but far from random. Evidence supporting this statement comes from observations that > 90% of all individuals have a percentage of fingerprintable stimuli that is significantly higher than the null distribution when the subject identifier is randomly permuted. Clustering gaze-fingerprint barcodes also results in the optimal number of clusters reaching the upper practical bound. Furthermore, preregistered follow-up experiments (i.e., Study 2) show that similar gaze-fingerprint barcodes can be identified within individuals over short time frames (e.g., weeks to months) and long time frames (e.g., years). One caveat to the barcoding approach applied in this work is that Session 1’s data is utilized in both short-term and long-term barcodes. The reason for this is that Session 1’s data is psychologically the most important for making inferences about traitlike tendencies because it samples gaze behavior upon an initial first viewing rather than on subsequent repeat viewings. Repeat-viewing behavior may differ psychologically from initial first viewings through the incorporation of other statelike factors (e.g., habituation, memory; Chakravarthula et al., 2025; Schmidig et al., 2025). However, it is impossible to eliminate the reliance on Session 1’s data because we cannot sample initial-viewing behavior to the same stimuli independently across two occasions within the same individual.
Another salient aspect of this work to underscore is the stimulus-rich sampling of gaze across a large array of visual stimuli. The 700 stimuli utilized here represent a much larger group than the stimuli used in other work on the topic. However, it is but a fraction of the total number of stimuli that possibly reveal unique individuating signatures for how individuals uniquely view the world. Thus, there is likely vast potential for expanding on this approach with much larger data sets and with expansion into dynamic stimuli (e.g., naturalistic movie viewing). Extending this work into real-world or naturalistic viewing scenarios would also enable testing of the robustness and generalizability of gaze fingerprinting under static viewing conditions. There is also probably much potential for taking a thin-slices approach (Byrge & Kennedy, 2019) to identifying what would be the smallest amount of data across stimuli that would be useful for gaze fingerprinting. Such a thin-slice approach is beyond the scope of the current work but should be explored in future research.
Finally, we also show that decreased gaze fingerprintability is associated with higher levels of autistic traits. This finding can be contrasted with two prior studies (Avni et al., 2020; Keles et al., 2022) that primarily differ from the current work by examining gaze data during naturalistic movie viewing and by also directly examining clinically diagnosed autistic individuals. Keles et al. found similar gaze-fingerprinting identification rates between typically developing and autistic adults, as well as intact within-individual reliability. However, these authors did find that autistic-gaze heat maps were significantly more dissimilar to reference-gaze heat maps representing the average typically developing or autistic individual (Keles et al., 2022). This result may be suggestive of increased heterogeneity of gaze patterns in autism. Another study by Avni et al. (2020) found that autistic children showed more idiosyncratic gaze, operationalized as reduced intra- and intersubject gaze correlations. In contrast to these two prior studies, the current work did not find evidence of a relationship between intersubject gaze similarity and autistic traits. However, we did observe that reduced intrasubject similarity was predictive of higher autistic traits. Directly comparing with these prior studies may be difficult because of the difference between movie and static-picture viewing, but also because of the difference in examining clinically diagnosed autistic individuals (Avni et al., 2020; Keles et al., 2022) versus examining covariation of the autistic traits in otherwise nondiagnosed populations (i.e., the current study). Future work using our approach in clinically diagnosed populations and in movie-viewing contexts is needed. Nevertheless, the general idea that degree of gaze idiosyncrasy may be important for autism, autistic traits, or both matches up well with other hypotheses regarding enhanced neural or behavioral idiosyncrasy in autism (Avni et al., 2020; Benkarim et al., 2021; Bleimeister et al., 2024; Bolton et al., 2018; Byrge et al., 2015; Cavallo et al., 2018; Dinstein et al., 2012, 2015; Hahamy et al., 2015; Hasson et al., 2009; Keles et al., 2022; Milne, 2011; Nunes et al., 2019; Pegado et al., 2020; Rubenstein & Merzenich, 2003; Sohal & Rubenstein, 2019; Trakoshis et al., 2020). Furthermore, given the idea that both individualized gaze patterns and autistic traits are underpinned by heritable polygenic common genetic architecture (Constantino & Todd, 2003; Constantino et al., 2017; Kennedy et al., 2017; Portugal et al., 2023; Robinson et al., 2016), future work should investigate whether these phenomena are underpinned by shared or distinct genetic architecture. Finally, the relationship between gaze fingerprintability and autistic traits is an important general confirmation for the idea of a traitlike factor between individuals that helps explain variance in gaze behavior. Such a finding matches well with other work that generally identifies a link between personality traits and gaze behavior (Wu et al., 2014; Yamashita et al., 2023). It is also notable that intrasubject gaze correlations for fingerprintable stimuli (mean r = .79, SD = 0.08; Fig. S3) tend to be on par with test–retest stability observed in personality traits (e.g., r = .5–.7; Damian et al., 2019; Lodder et al., 2022; Roberts & DelVecchio, 2000). Such evidence further bolsters the idea of traitlike factors influencing gaze behavior.
We should also discuss some limitations and caveats of the current work. First, the sample size of Study 2 was relatively small, because many of the original participants were not able to come back for the long-term follow-up testing sessions (some delays were on the order of years). Future work with larger sample sizes for long-term follow-up sessions may be needed. Second, although these results appear in the context of brief viewings of static pictures of complex natural scenes, future work should examine generalizability to other contexts, such as naturalistic movies. Third, the correlations with autistic traits were discovered in otherwise typically developing individuals without an autism diagnosis. Thus, stronger statements about relevance to autism will require future experiments in clinically diagnosed autistic samples.
In summary, we show that gaze fingerprinting is possible both by (a) examining a central tendency of gaze similarity over a relatively large range of stimuli and (b) by preserving the gaze-fingerprint information held within gaze-fingerprint barcodes. The insights of this study were enabled by the use of a stimulus-rich design and have strong methodological support via replicable evidence across discovery and replication sets, as well as confirmatory hypothesis tests from preregistered longitudinal follow-up experiments. Such work is important for future research decomposing individually sensitive information within gaze patterns and may be of high neurodevelopmental and biological significance.
Supplemental Material
sj-pdf-1-pss-10.1177_09567976251415352 – Supplemental material for Detection of Idiosyncratic Gaze-Fingerprint Signatures in Humans
Supplemental material, sj-pdf-1-pss-10.1177_09567976251415352 for Detection of Idiosyncratic Gaze-Fingerprint Signatures in Humans by Sarah K. Crockford, Eleonora Satta, Ines Severino, Donatella Fiacchino, Andrea Vitale, Natasha Bertelsen, Elena Maria Busuoli, Veronica Mandelli and Michael V. Lombardo in Psychological Science
Supplemental Material
sj-xlsx-2-pss-10.1177_09567976251415352 – Supplemental material for Detection of Idiosyncratic Gaze-Fingerprint Signatures in Humans
Supplemental material, sj-xlsx-2-pss-10.1177_09567976251415352 for Detection of Idiosyncratic Gaze-Fingerprint Signatures in Humans by Sarah K. Crockford, Eleonora Satta, Ines Severino, Donatella Fiacchino, Andrea Vitale, Natasha Bertelsen, Elena Maria Busuoli, Veronica Mandelli and Michael V. Lombardo in Psychological Science
Footnotes
Transparency
Action Editor: Evie Vergauwe
Editor: Simine Vazire
Author Contributions
References
Supplementary Material
Please find the following supplemental material available below.
For Open Access articles published under a Creative Commons License, all supplemental material carries the same license as the article it is associated with.
For non-Open Access articles published, all supplemental material carries a non-exclusive license, and permission requests for re-use of supplemental material or any part of supplemental material shall be sent directly to the copyright owner as specified in the copyright notice associated with the article.