
Abstract
Background
Individuals with vestibular disorders often describe symptoms of dizziness, disorientation, and impaired balance induced by visual stimuli, commonly referred to as visual vertigo.
Objective
The purpose of this study was to improve assessment of visually induced symptoms by modifying the original, nine-item Visual Vertigo Analogue Scale (VVAS) to produce a more robust, interpretable, and clinically useful measure of visual vertigo. We also aimed to establish a cut-off score for identifying patients with vestibular disorders and low- versus high-severity visual vertigo.
Methods
Patients with vestibular disorders (n = 199) and controls (n = 107) completed the modified VVAS (mVVAS). Exploratory factor analysis was conducted to develop a shorter scale and internal consistency analyses were performed. A K-means cluster analysis was used to determine a cut-off score for identifying low- and high-severity groups.
Results
A reduced six-item scale (VVAS-6), which included three items from the VVAS and three items from the mVVAS, had excellent internal consistency (Cronbach’s α = 0.93). We identified four concepts within the VVAS-6 (walking with visual stimulation, visual stimulation only, escalator, car). A cut-off score of 37 was able to identify patients with vestibular disorders and high severity of visual vertigo.
Conclusions
The use of a cut-off score of 37 for the VVAS-6 scale resulted in an improvement in correctly identifying patients with vestibular disorders and high severity of visual vertigo from controls.
Introduction
Visual vertigo describes symptoms of dizziness, disorientation, and impaired balance induced by environments with conflicting visual and vestibular information or complex visual stimuli. 1 Visual vertigo has shared characteristics with space and motion discomfort, 2 phobic postural vertigo, 3 and chronic subjective dizziness.4,5 Although these conditions share overlapping symptom profiles, they represent distinct clinical constructs; visual vertigo refers to visually induced vertiginous symptoms, 6 whereas persistent postural-perceptual dizziness is a formal diagnosis characterized by persistent symptoms exacerbated by moving or complex visual stimuli. 7 While clinicians have long recognized visually-induced complaints in patients presenting with central and peripheral causes of dizziness, a formal means of assessment under the moniker of visual vertigo was not presented until 2011. 8 Dannenbaum and colleagues proposed a nine-item Visual Vertigo Analogue Scale (VVAS) 8 based on the qualitative examination questions of Longridge and Mallinson. 9
The VVAS is used to rate the intensity of dizziness induced by dynamic visual input during daily situations, and was designed to be faster to administer in the clinic than the 41-item Situational Characteristics Questionnaire 10 for quantifying space and motion discomfort. Patients are asked to make a vertical mark on each 10 cm long analogue scale of the VVAS, indicating how much dizziness is provoked by a particular situation. The scales are anchored from zero to ten, with zero representing no dizziness and ten representing extreme dizziness and/or activity avoidance due to dizziness. 8 The distance from the zero anchor to the patient’s marking is measured to the nearest half-centimeter, and two final scores are calculated: VVAS positive and VVAS severity. 8 VVAS positive indicates that the patient rated two or more items on the scale above zero. 8 VVAS severity is the mean score of the completed analogue scales multiplied by 10, yielding a score of 0 (patient does not experience visual vertigo) to 100 (patient has severe visual vertigo). 8 The VVAS is valid and responsive to change, making it a useful tool for identifying and evaluating the progression of symptoms of visual vertigo. 11
While the VVAS is internally consistent and reliable (Cronbach’s α = 0.94), 8 there are aspects of the scale that present challenges for use. First, patients are classified as VVAS positive if they rate two or more items on the scale above zero. 8 This makes identifying and grouping patients challenging, as a patient who rates two items at 0.5 cm and a patient who rates nine items at 9.5 cm would both be classified as VVAS positive. These patients at the two extremes in scoring would likely present with very different symptoms in the clinic. While VVAS severity can also be calculated, Dannenbaum et al. 12 did not provide a cut-off score for identifying patients with vestibular disorders and high severity of visual vertigo. Second, the scales are anchored from zero to ten, which can cause confusion for interpreting scales that are not marked. If a patient does not make a marking on a scale, it may be because the situation is not applicable (“I don’t do that”), is not provocative (“I do that but it does not bother me”), or is not completed (“I did not respond to that item”). This makes the VVAS difficult to score consistently and interpret. Third, measuring to the nearest half-centimeter makes calculating VVAS severity imprecise.
The purpose of this study was to improve assessment of visually induced symptoms by modifying the original, nine-item VVAS to produce a more robust, interpretable, and clinically useful measure of visual vertigo. We aimed to (1) construct a measure that was internally consistent, reliable, and clinically interpretable; and (2) establish a cut-off score for identifying patients with vestibular disorders and low- versus high-severity visual vertigo. We also aimed to explore relationships between visual vertigo scale scores and self-perceived dizziness handicap scores. We hypothesized that patients with vestibular disorders and high severity of visual vertigo would have greater self-perceived dizziness handicap scores, depression, and anxiety than patients with vestibular disorders and low severity of visual vertigo.
Materials and methods
Participants
The most frequent diagnoses for 199 patients with vestibular disorders.
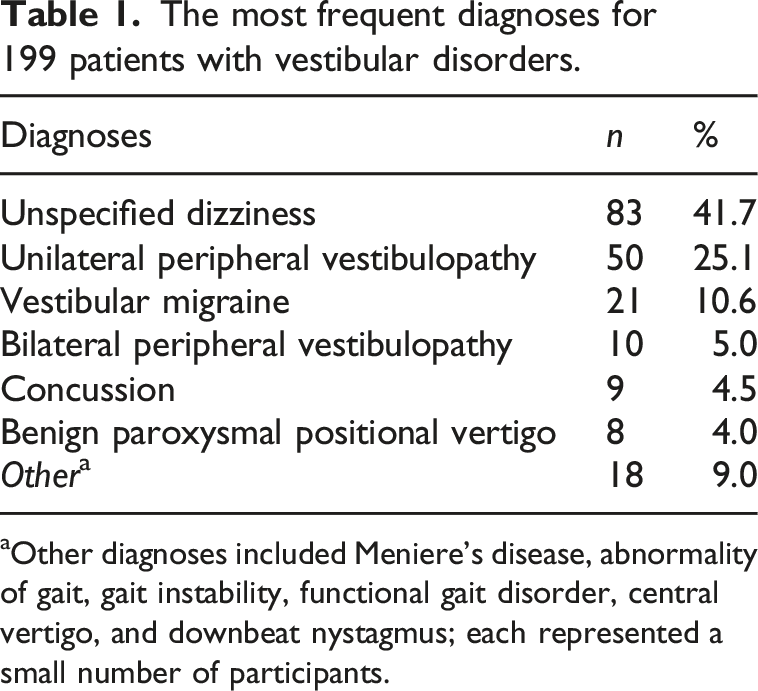
aOther diagnoses included Meniere’s disease, abnormality of gait, gait instability, functional gait disorder, central vertigo, and downbeat nystagmus; each represented a small number of participants.
Modifications to the VVAS
We proposed several modifications to the original, nine-item VVAS to address limitations related to interpretability and clinical application. We changed the instructions to simply and clearly state: “Indicate the amount of dizziness you experience in the following situations by marking off the scales below. Check the box to the left if you do not do the activity (it is not applicable) or don’t know if it would bother you.” As stated in these instructions, a box has been added to the left of each item that the patient can mark if an item could not be rated; however, it did not distinguish between reasons such as non-applicability, uncertainty, or activity avoidance.
Additionally, we added six items to the scale, making 15 items total in the modified VVAS (mVVAS). The selection of new items for the mVVAS was accomplished through discussion and consensus among a group of physical therapists and a board-certified neurologist with fellowship training in nonsurgical neurotology. A formal item-generation process (such as Delphi methods) was not used. Instead, items were identified based on clinical experience treating patients with vestibular disorders and visual vertigo, with the goal of capturing visually provocative situations commonly reported by these patients. Each newly added item was selected because it represented a distinct and clinically meaningful visual–vestibular stimulus not fully addressed by the original VVAS. No additional items beyond these six were considered for inclusion.
The first two items were added to determine if the location of being a passenger in the front seat or back seat of a vehicle is more provocative. Sitting in the front seat allows for fixation on the road ahead, while sitting in the back seat exposes the passenger to visual-vestibular mismatch and constant motion in the peripheral field of view, which can provoke motion sickness. 13 The next item, “being under flickering lights,” was added because many of our patients with vestibular disorders and visual vertigo report that it is not the type of light (fluorescent) but the flickering of the lights that provokes their symptoms. Two additional items relating to ambulation, anxiety, and space and motion discomfort (“walking in crowds” and “walking in open spaces”) were added to the scale. Lastly, “going down an escalator” was added to complement the original item “going up an escalator.”
Finally, we modified the scoring to make the measure of dizziness more precise. Patients were asked to make a vertical mark on each 10 cm long analogue scale of the mVVAS, indicating how much dizziness is provoked by a particular situation. The scales are anchored from zero to ten, with zero representing no dizziness and ten representing extreme dizziness and/or activity avoidance due to dizziness. 8 The distance from the zero anchor to the patient’s marking were measured to the nearest tenth of a centimeter. To remain consistent with the scoring proposed in the original measure, two final scores were calculated for the mVVAS: VVAS positive and VVAS severity.
Patient self-report measures
In addition to completing the VVAS and the mVVAS, patients with vestibular disorders completed the Dizziness Handicap Inventory (DHI) 10 and the Hospital Anxiety and Depression Scale (HADS). 14 The DHI was developed to assess the self-perceived handicapping impact of dizziness on daily life. The DHI consists of 25 items with a total possible score of 100. 15 The DHI is internally consistent and reliable (Cronbach’s α = 0.89). 15 The HADS is used to identify and measure self-reported severity of anxiety and depression. There are seven items related to anxiety and seven items related to depression. Each subscale has a total score range from 0 to 21 (each item scored 0–3), and is reliable and valid for detecting and quantifying the severity of anxiety and/or depression. 16 A cut-off score of 8 or more on each section of the HADS was used to identify probable cases of anxiety and/or depression. 14 The control group did not complete the DHI or HADS.
Statistical analyses
Data were analyzed using IBM SPSS Statistics 26 (IBM Corporation, Armonk, NY). Descriptive statistics were calculated for demographic variables and patient self-report measures. Data were checked for normality using Shapiro-Wilk tests. Spearman rank correlations were used to explore relationships between visual vertigo scales and the DHI. Independent-samples t-tests were used to compare DHI and HADS scores between patients with vestibular disorders who were VVAS positive and those who were not VVAS positive, and between patients classified as having low versus high visual vertigo severity. The internal consistency of the mVVAS was examined using Cronbach’s alpha.
To achieve the goal of constructing a measure that was internally consistent and concise, an exploratory factor analysis (EFA) was conducted using all 15 items of the mVVAS. To determine if there were a sufficient number of items that were significantly related, Bartlett’s test of sphericity and the Kaiser–Meyer–Olkin test were conducted. Then, the EFA was completed, and the scree plot was visualized to determine how many factors to retain. Also, the number of factors with Eigenvalues >1 were considered.
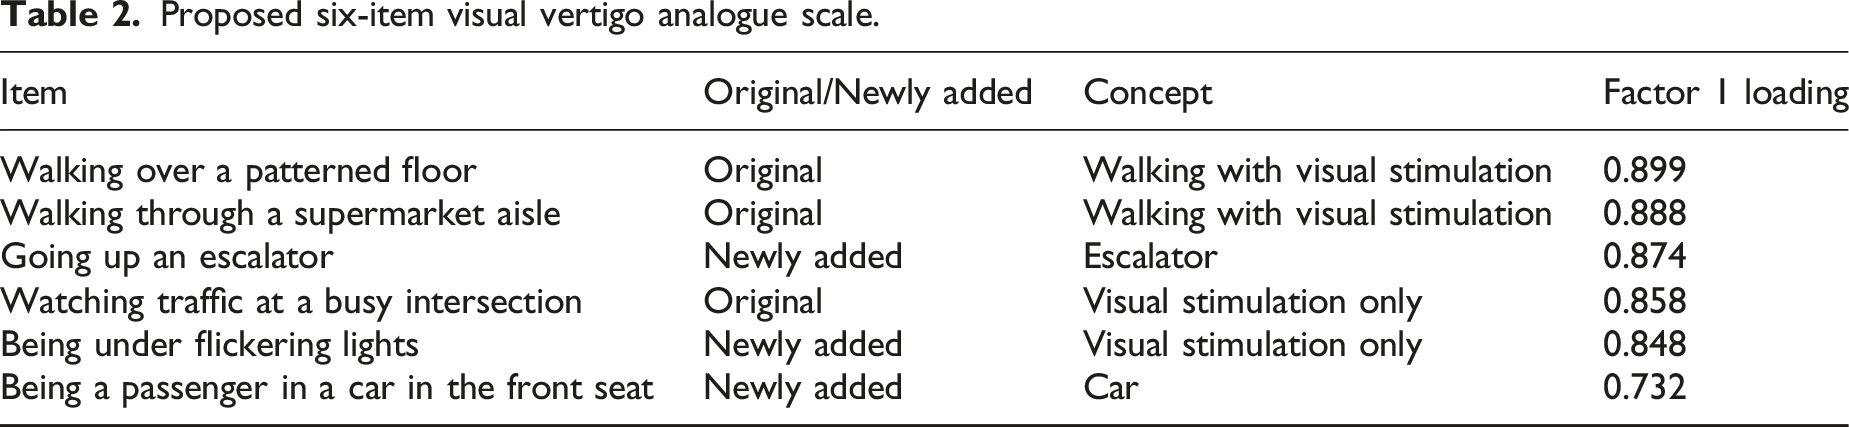
Proposed six-item visual vertigo analogue scale.
Once the EFA was completed, K-means clustering was used to divide the patients with vestibular disorders into two non-overlapping clusters utilizing the VVAS-6. The goal was to produce low-severity and high-severity groups with high similarity within groups and low similarity between groups.17–19 We established a cut-off score between the maximum low-severity group score and minimum high-severity group score. To determine the stability of the clustering, the sample was randomly divided into two halves and the cluster analysis was repeated on each half. 12
Results
The control participants (71 female, 34 male, 2 unreported gender) had a mean age of 42 (SD = 18) years. The patients with vestibular disorders (125 female, 72 male, 2 unreported gender) had a mean age of 54 (SD = 16) years. The most frequent diagnoses based on the primary 10th revision of the International Statistical Classification of Diseases and Related Health Problems (ICD-10) code were abstracted from the electronic medical record and are listed in Table 1.
Patients with vestibular disorders reported an average DHI score of 38 (SD = 23). The patients with vestibular disorders who were VVAS positive (two or more items scored greater than zero; n = 179) reported significantly higher DHI scores (M = 40, SD = 22) than the patients with vestibular disorders who were not VVAS positive (n = 20; M = 13, SD = 8), (t (60) = 6.97, p < 0.001). Patients with vestibular disorders reported an average HADS anxiety score of 6 (SD = 4) and HADS depression score of 7 (SD = 4). Using a cut-off of 8 on the HADS anxiety and depression subscales for probable anxiety and depression, 20 93 patients with vestibular disorders (47%) scored 8 or above on the depression subscale, 70 (35%) scored 8 or above on the anxiety subscale, and 53 (27%) scored 8 and above on both subscales in our study. Patients with vestibular disorders who were VVAS positive had more anxiety symptoms evidenced by HADS anxiety scores (M = 6.2, SD = 4.3) than patients with vestibular disorders without visual vertigo (M = 3.0, SD = 2.5), t (28) = 4.93, p < 0.001.
Item endorsement (%) and mean ratings among participants classified as Visual Vertigo Analogue Scale (VVAS) positive.
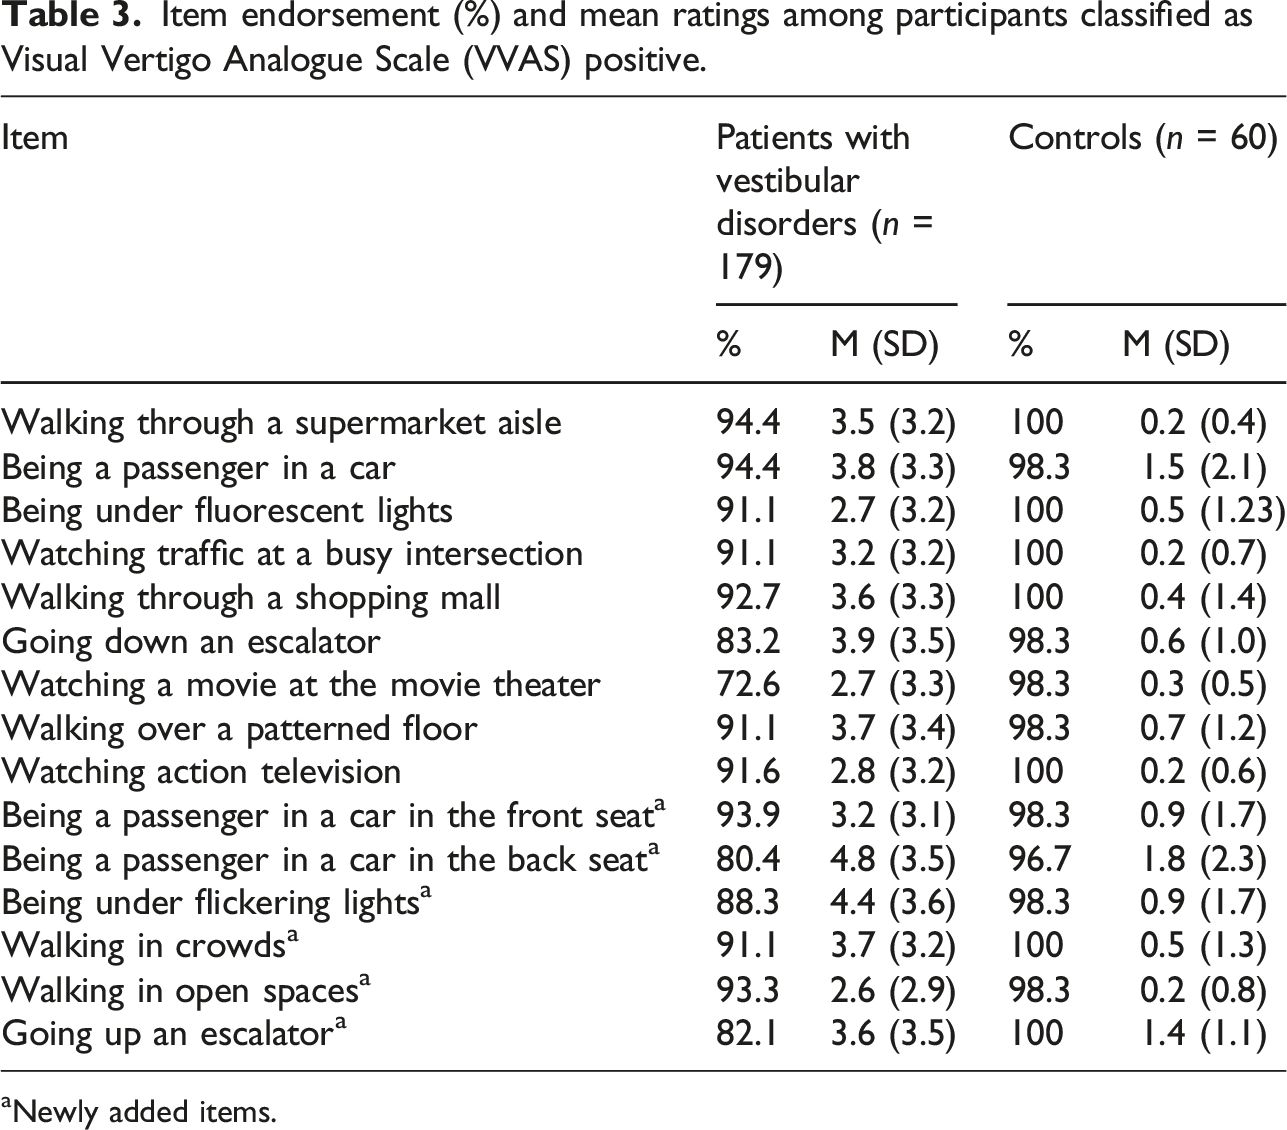
aNewly added items.
Item-to-total correlation coefficients and Cronbach’s alpha index for the nine-item Visual Vertigo Analogue Scale (original) and the fifteen-item modified Visual Vertigo Analogue Scale.
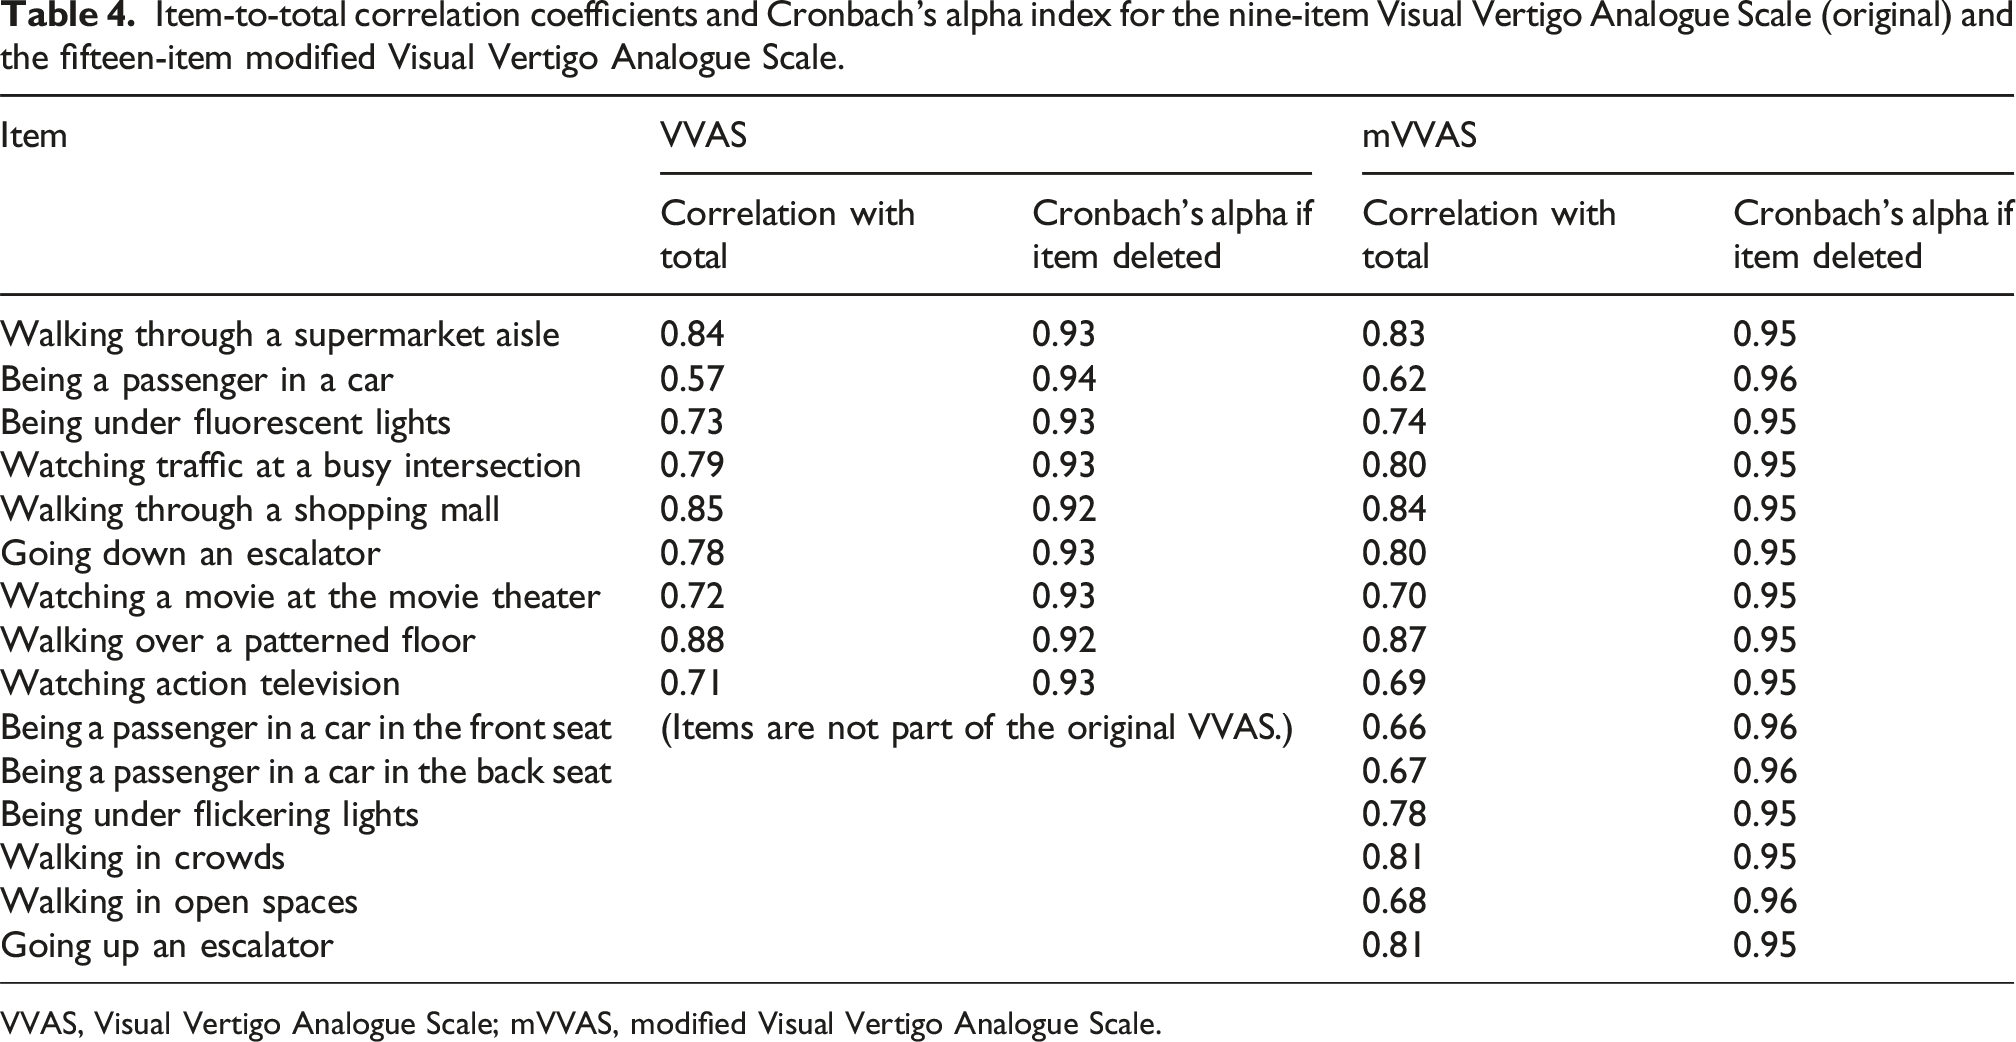
VVAS, Visual Vertigo Analogue Scale; mVVAS, modified Visual Vertigo Analogue Scale.
Items in the Visual Vertigo Analogue Scale (original items) and modified Visual Vertigo Analogue Scale (newly added items) organized by strength of factor loadings and concept (walking with visual stimulation, visual stimulation only, escalator, car).
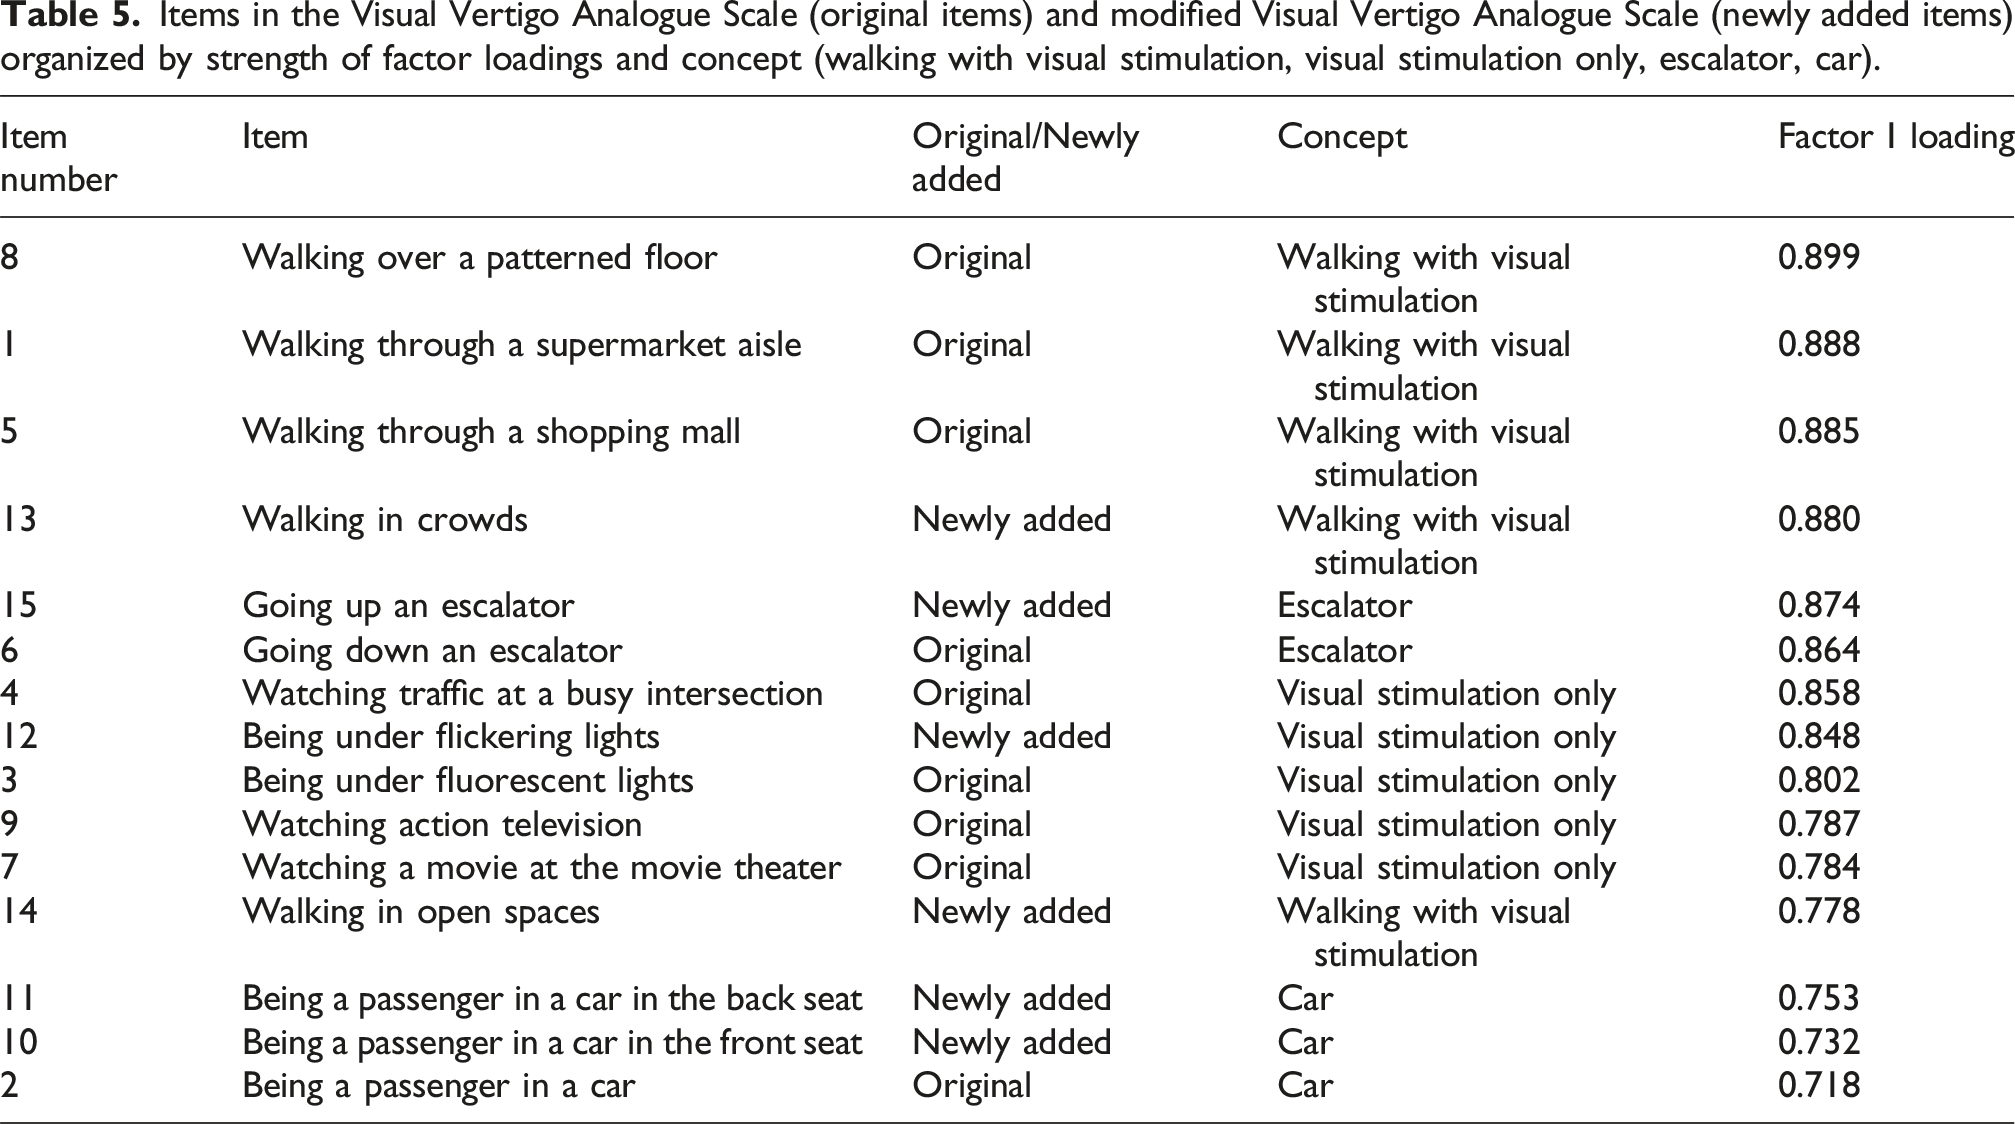
To construct a concise scale with good reliability while still maintaining the measurement of the four identified concepts, we assessed Cronbach’s alpha for the items with the highest loadings within each concept (items 8, 15, 4, 11). The Cronbach’s alpha was 0.90 for these four items. We then included the items with the second-highest factor loadings from each concept (items 1, 6, 10, 12) and Cronbach’s alpha was 0.94. This indicates excellent internal consistency and reliability. The addition of three more items resulted in a Cronbach’s alpha of 0.96 indicating possible redundancy. Also, there were several items among those 11 items that were highly correlated (r > 0.80). Therefore, only the first eight items were retained. Upon further review of the Cronbach’s alpha analysis, items 15 and 6 were highly correlated (r > 0.90) and item 11 would improve Cronbach’s alpha if it was deleted. The research team made the decision to remove item 6 because it had a lower factor loading than item 15 and to remove item 11 because it did not contribute to the internal consistency of the scale and because it was marked “not applicable” by 39 participants (patients with vestibular disorders and controls). The remaining six items (8, 15, 4, 1, 10, 12) had excellent internal consistency with Cronbach’s alpha of 0.93 and did not have any highly correlated items (r > 0.80). The proposed six-item scale (VVAS-6; Appendix) includes three items from the VVAS and three items from the mVVAS (Table 2).
K-means clustering was used to divide the patients with vestibular disorders into two, non-overlapping clusters based on VVAS-6 score. The first high-severity cluster (n = 83) had an average VVAS-6 score of 61 (SD = 16; range 37–100). The second low-severity cluster (n = 114) had an average VVAS-6 score of 12 (SD = 11; range 0–37). Using a cut-off score of 37, only one of the controls (with a VVAS-6 score of 49) had high VVAS severity.
The sample was randomly divided into two, and the cluster analysis was repeated to determine the stability of the clustering. For the first half, the first cluster (n = 47) had an average VVAS-6 score of 60 (SD = 24; range 37–100) and the second cluster (n = 53) had an average VVAS-6 score of 13 (SD = 16; range 0–36). For the second half, the first cluster (n = 36) had an average VVAS-6 score of 62 (SD = 26; range 39–96) and the second cluster (n = 61) had an average VVAS-6 score of 12 (SD = 14; range 0-37).
Based on a cut-off score of 37 on the VVAS-6, 83 (42%) patients with vestibular disorders had high severity of visual vertigo. The patients with vestibular disorders and high severity of visual vertigo (n = 83) reported an average DHI score of 52 (SD = 22), while the patients with vestibular disorders and low severity of visual vertigo (n = 114) reported an average DHI score of 27 (SD = 16). The difference in DHI scores between the high- and low-severity VVAS-6 groups was statistically significant (t (167) = 8.80, p < 0.001). The patients with vestibular disorders and high severity of visual vertigo (M = 5.8, SD = 4.3) had more anxiety symptoms than the patients with vestibular disorders and low severity of visual vertigo (M = 4.3, SD = 3.3). Patients with vestibular disorders in the high-severity VVAS-6 group had significantly higher HADS anxiety scores than those in the low-severity group (t (147) = 2.81, p = 0.006). Patients with vestibular disorders and high severity of visual vertigo (M = 8.6, SD = 4.1) also had more depressive symptoms than the patients with vestibular disorders and low severity of visual vertigo (M = 6.2, SD = 4.0). Patients with vestibular disorders in the high-severity VVAS-6 group also had significantly higher HADS depression scores than those in the low-severity group (t (174) = 4.08, p < 0.001). The VVAS-6 was moderately correlated with the DHI (ρ = 0.65, p < 0.001).
Applying each of the scales to describe the patients with vestibular disorders resulted in the following: VVAS (M = 30.2, Mdn = 24.0, range 0.0–98.7), mVVAS (M = 34.1, Mdn = 31.6, range 0.0–100.00), and VVAS-6 (M = 32.9, Mdn = 27.3, range 0.0–99.5). The VVAS was highly correlated with the mVVAS and the VVAS-6 (ρ = 0.90, p < 0.001, and ρ = 0.97, p < 0.001, respectively). Similarly, the mVVAS and the VVAS-6 were highly correlated (ρ = 0.92, p < 0.001).
Discussion
The purpose of this study was to improve the assessment of visually-induced symptoms by modifying the original, nine-item VVAS to produce a clinically more informative measure with an empirically derived severity cut-off. We propose a six-item scale (VVAS-6) with a cut-off score of 37 that allows clinicians to identify patients with vestibular disorders who have high severity of visual vertigo, addressing a key limitation of the original “VVAS positive” classification. By using the cluster analysis to separate patients with vestibular disorders into groups with low- and high-severity of visual vertigo, we were able to overcome a limitation of the original VVAS, which classifies most individuals with vestibular dysfunction as VVAS positive, calling into question the clinical utility of this designation. It is important to note that the goal of the present study was not to formally compare “positive” classifications between the original VVAS and the mVVAS, but rather to highlight limitations of binary classification and emphasize severity-based interpretation. The binary VVAS-positive designation has limited clinical utility, as it identifies the majority of patients with vestibular disorders as “positive” and does not differentiate severity. For this reason, our focus was on developing a clinically meaningful severity-based subgrouping approach rather than on comparing positive/negative classifications across versions of the scale. The VVAS-6 cut-off score provides a clearer distinction between low- and high-severity visual vertigo than a positive/negative classification and therefore offers greater value for clinical decision-making. While the original VVAS also provided a measure of severity, Dannenbaum et al. 12 did not provide a cut-off score for identifying patients with high severity of visual vertigo.
Additionally, we were able to establish a cut-off score of 37 for the VVAS-6. We performed split-sample validation and found that the cluster profiles of the sub-samples maintained the clustering pattern of the original, full-sample solution. This allows us to reliably conclude the existence of two meaningful subgroups within the sample (low-severity and high-severity groups). The use of a cut-off score of 37 for the VVAS-6 scale resulted in an improvement in correctly identifying patients with vestibular disorders and high severity of visual vertigo from controls who were healthy or seeking physical therapy for orthopedic disorders. Amongst all participants, 90% of patients with vestibular disorders and 56% of controls were VVAS positive using the criteria established by Dannenbaum et al. (two or more items scored greater than zero). Less than 1% of controls classified in the high-severity group using the cut-off score of 37. This severity-based cut-off score may help clinicians to accurately identify patients with vestibular disorders and visual vertigo so that they can prescribe more appropriate vestibular rehabilitation interventions including optokinetic and/or habituation-type exercises for individuals who score 37 and above.
Using the cut-off score of 37 on the VVAS-6, 42% of patients with vestibular disorders were identified as having high severity of visual vertigo. They reported a mean severity score of 61. Using the criteria for VVAS positive (two or more items scored greater than zero), 90% of patients with vestibular disorders and 56% controls were identified as having some degree of visually-induced dizziness; however, severity scores revealed marked differences between groups. Among patients with vestibular disorders who met VVAS-positive criteria, mean severity scores were 34 on the VVAS and 37 on the mVVAS, values consistent with the mean severity score of 30.3 reported in the vestibular group described by Dannenbaum et al. 8 In contrast, patients with vestibular disorders classified in the high-severity group using the VVAS-6 reported substantially higher severity scores, indicating that reliance on the VVAS-positive classification alone might underestimate the severity of visual vertigo.
This apparent underestimation is likely due to differences in the psychometric structure of the scales. The original VVAS and the mVVAS include items that are less provocative, less frequently endorsed, or represent weaker contributors to visually-induced dizziness. When these lower-severity items are included in the mean score, they dilute the overall severity rating and compress differences between individuals with mild and more substantial visually-induced symptoms. In contrast, the VVAS-6 is composed exclusively of the highest-loading items across the constructs identified in our factor analysis, each of which strongly discriminates between individuals with low versus high symptom burden. By focusing the scale on the most sensitive and clinically meaningful visual–vestibular situations, the VVAS-6 amplifies the severity signal rather than averaging it with less provocative contexts. As a result of this refinement, the VVAS-6 produced a clearer separation between severity groups and demonstrated strong internal consistency without redundancy. This supports the use of the VVAS-6 as a concise tool that preserves the conceptual breadth of visually-induced dizziness while providing a more accurate reflection of symptom severity.
Patients with vestibular disorders and high severity of visual vertigo in our sample experienced substantial functional impact from their dizziness. Their mean DHI score was 52, indicating that they perceived a moderate level of handicap due to dizziness. 21 Patients with visual vertigo are known to have higher DHI scores than those with vestibular dysfunction without visual vertigo and healthy controls. 22 In our study, the patients with vestibular disorders in the high-severity group did report a higher average DHI score than those who were in the low-severity group, but we were unable to make comparisons to our controls as they did not complete the DHI.
Patients with vestibular disorders and high severity of visual vertigo had higher anxiety symptom scores than patients with vestibular disorders and low severity of visual vertigo. Patients with vestibular dysfunction and visual vertigo, 23 vestibular disorders, 24 and Meniere’s disease 25 are known to have increased levels of anxiety and depression. Depression scores have been correlated with increased reports of symptoms provoked or aggravated by complex visual stimuli. 23 The increased levels of depression reported by the patients with vestibular disorders in the high-severity group in this study may be due to the vestibular disorder, activity limitations, and participation restrictions. 26 Patients with vestibular disorders are known to have increased prevalence of anxiety.23,27 As observed in this study, increased anxiety has been reported in patients with visual vertigo, 22 chronic subjective dizziness, 4 and persistent postural-perceptual dizziness. 28 Anxiety-related gaze instability has been proposed as one possible pathophysiologic mechanism for visual vertigo. 29
The VVAS was moderately correlated with the DHI in this study. Previous studies have noted a moderate correlation between the VVAS and the DHI, ranging from 0.54 30 to 0.67. 8 The mVVAS and the VVAS-6 were also moderately correlated with the DHI. This may indicate that the DHI does not completely reflect the presence or severity of visually-induced dizziness and may provide preliminary evidence for the importance of using a separate tool (the VVAS-6) to measure these aspects of the patient’s vestibular dysfunction. Yip and Strupp found that the DHI did not correlate with tests of vestibular function or postural sway on posturography. 31 They also concluded that the DHI and vestibular function tests plus posturography measure different aspects of the patient’s vestibular disorder. 31 Accordingly, the DHI and the VVAS-6 should be viewed as complementary tools within a comprehensive vestibular assessment, each providing unique and clinically relevant information.
Both the VVAS and the mVVAS had a high level of internal consistency. The alpha coefficients estimated in this sample were slightly higher than that reported for the vestibular group (Cronbach’s α = 0.92) by Dannenbaum et al. 8 Correlation coefficients showed high associations between individual items for both scales, indicating that some items may be redundant. Using EFA, we were able to reduce the mVVAS to six items. These items included three items from the original VVAS and three items from the mVVAS. Item-level endorsement patterns among VVAS-positive participants demonstrated that visually complex walking environments and dynamic visual–vestibular contexts were commonly provocative, supporting the construct validity of the retained VVAS-6 items. The item, “going down an escalator,” was added to the mVVAS to complement the original item, “going up an escalator.” Although both ascending and descending an escalator can provoke visually-induced dizziness, only the “going up an escalator” item demonstrated a sufficiently strong factor loading to retain in the final scale. The item, “being under flickering lights,” affirms the report that it is not the type of light (i.e., fluorescent), but the flickering of the lights that provokes the symptoms of patients with vestibular disorders. The factor analysis supported inclusion of a car-related item in the final scale, reflecting the clinical relevance of visually induced symptoms during vehicular motion. This refined scale maintains excellent internal consistency while providing clinicians with a practical, severity-based tool for identifying and stratifying visually induced dizziness.
A box was added to the left of each item that the patient can mark if an item could not be rated. Some individuals may not participate in certain activities based on personal preferences or may be unsure if an activity is bothersome (they have not had an opportunity to complete a certain activity since the onset of their dizziness). Other patients may be unable to participate in certain activities due to their dizziness and/or desire to avoid certain activities known to aggravate their dizziness. The addition of this box may help clinicians better understand the patient’s activity limitations and participation restrictions by cueing the clinician to further explore why a patient does not perform certain activities. If left blank, however, there is still uncertainty as to why a particular scale was not marked off. Although the checkbox may help identify items that were intentionally left unrated, it provides limited information regarding the reason an item was not scored. Specifically, it does not differentiate between non-applicability, uncertainty, or avoidance due to symptom provocation, which remains a limitation of the VVAS, mVVAS, and VVAS-6.
Our sample differed from that originally described by Dannenbaum and colleagues because we included individuals diagnosed with benign paroxysmal positional vertigo, bilateral vestibular hypofunction, and central vestibular disorders. This may have affected the variability of VVAS scores in this sample but likely represents the population of patients treated for dizziness in tertiary care settings. Future studies should explore the test-retest reliability, convergent validity, and responsiveness of the newly proposed VVAS-6.
Conclusions
The VVAS-6 is a short and internally consistent measure of visually-induced dizziness that can be used in clinical settings. A cut-off score of 37 is recommended for identifying patients with vestibular disorders and high severity of visual vertigo. Future studies should explore its reliability, validity, and responsiveness when administered as a stand-alone test.
Footnotes
Acknowledgements
The authors give special thanks to Jehan Alomar, MS, PT, Suchita Rajan, MS, PT, and Anita Lieb, MS for their help on this project.
ORCID iDs
Funding
The authors disclosed receipt of the following financial support for the research, authorship, and/or publication of this article: Partial support for this project was funded by a grant (P30 AG024827) from the Pittsburgh Claude D. Pepper Older Americans Independence Center, and the Eye and Ear Foundation of Pittsburgh. Participant recruitment was facilitated by the Clinical and Translational Science Institute, supported by the National Institutes of Health through Grant Number UL1TR001857.
Declaration of conflicting interests
The authors declared no potential conflicts of interest with respect to the research, authorship, and/or publication of this article.
Disclaimer
The views and information expressed are those of the authors and do not represent the official position of the 59th Medical Wing, Defense Health Agency, Department of the Air Force, Department of War, or U.S. Government.